Distinct responses to reduplicated chromosomes require distinct Mad2 responses
- Duke University Medical Center, United States
Figures
Figure 1 with 1 supplement

Induced genome reduplication in wing progenitors leads to polytene diplochromosomes and aneuploidy.
(A) A model for the cell cycle progression following fizzy-related (HS>fzr) overexpression in a mitotically cycling tissue. Cells progress directly from G2 into G1 without an intervening mitosis, resulting in an additional S-phase. (B) A diagram depicting the Fly-FUCCI system in each stage of the cell cycle, and representative images of wing imaginal disc cells in each cell cycle state. GFP-E2F11-230 (green) is nuclear during G1 and G2 and fills the cell during mitosis. RFP-CycB1-266 (magenta) is cytoplasmic during S-phase and G2 and fills the cell during mitosis. (C) Representative micrographs of the wing imaginal disc pouch expressing UAS Fly-FUCCI under the control of engrailed-Gal4 in the absence of HS>fzr expression (No HS, C) as well as +2 hr (C’) and +10 hr (C’’) after a 60-min heat shock to induce HS>fzr expression. GFP-E2F11-230 is in green, RFP-CycB1-266 is in magenta. (D) The percentage of cells in G1, S, G2, and M based on Fly-FUCCI expression prior to HS>fzr expression (No HS), +2 hr and +10 hr after a 60-min heat shock to induce fzr expression. Stacked bars represent mean plus standard error of the mean (+S.E.M.), ***p<0.001, NS = p>0.05, t-test. Data are an average of three replicates with at least 5 animals per replicate and at least 50 cells counted per animal. (E) Representative karyotypes from a mitotic HS>fzr wing imaginal disc cells without heat shock. Chromosomes are pseudocolored according to each chromosome type and numbered. Prior to HS>fzr expression cells display a normal diploid karyotype. Tissue was incubated in colcemid for 30 min to enrich for mitotic cells. (F) Representative karyotypes from mitotic HS>fzr wing imaginal cells 10 hr after a 60-min heat shock. Chromosomes are pseudocolored according to the type as in Figure 1E. Transiently, closely aligned polytene chromosomes are seen when chromosomes first condense after genome reduplication (F). Asterisks indicate the 2 groups of homologous centromeres of the X-chromosome. Diplochromosomes, characterized by the attachment of four centromeres of each sister chromatid (F’ see inset), are seen at the first metaphase after genome reduplication. Tissue was incubated in colcemid for 30 min to enrich for mitotic cells. (G) Representative karyotype of a mitotic HS>fzr cell 24 hr after a 60 minheat shock, colored according to type as in Figure 1E. Aneuploid cells are observed at 24 hr after heat shock, during the second metaphase after genome reduplication, which follows the division of diplochromosomes. Tissue was incubated in colcemid for 30min to enrich for mitotic cells. (H) The percentage of wing imaginal disc karyotypes classified as euploid/diploid, euploid/tetraploid, euploid/diplo-tetraploid, or aneuploid/tetraploid prior to heat shock (No HS), or +10 hr, +24 hr, or +120 hr after a 60-min heat shock. Stacked bars represent Mean (+S.E.M.), ***=p<0.001, NS = p>0.05, t-test. Data are an average of 3 replicates with at least 50 karyotypes per replicate. (I) Representative time-lapse of a diploid wing imaginal disc cell dividing prior to HS>fzr expression (No HS) and a tetraploid cell with diplochromosomes dividing 10 hr after a 60-min heat shock to induce HS>fzr expression (HS +10 hr). Yellow arrowhead shows a single lagging kinetochore. Red arrows highlight a single diplochromosome that segregates its chromatids in a 3:1 fashion. Cenp-C-Tomato showing kinetochores in cyan, His2av-GFP showing DNA in magenta. Time represents min from the last frame prior to anaphase. (J) The percentage of lagging chromosomes in diploid cells, in tetraploid cells with diplochromosomes (4N Diplo), and in tetraploid cells without diplochromosomes (4N) after HS>fzr expression. Bars represent averages (+S.E.M.) between animals with at least five animals per condition. ***p<0.001, NS = p>0.05, t-test. (K) A model for a cell cycle that results in aneuploid daughter cells showing only the two homologs of a single chromosome for simplicity. The two homologs are shown in black and gray with a red centromere. Chromatids are replicated in S-phase and then reduplicated following a heat shocked induced endocycle. This results in polytene chromosomes. Diplochromosomes are seen as the genome-reduplicated cells progress into metaphase. At anaphase, diplochromosome segregation frequently produces lagging chromatids, which can segregate erroneously resulting in aneuploidy. Scale bars represent 5 μm, except in insets in F’ and G where it represents 1 μm.
Figure 1—figure supplement 1

Supporting data regarding the effect of HS>fzr on imaginal discs and brains.
(A) Representative micrographs of 3rd instar wing imaginal discs from HS>fzr animals stained for Phospho-HistoneH3 (PH3, green) and DAPI (magenta) prior to heat shock (No HS, A) as well as +2 hr (A’) and +10 hr (A’’) after a 60-min heat shock. (B) Bee-swarm plot depicting the number of Phospho-HistoneH3 (PH3) positive cells per animal prior to heat shock (No HS), immediately after heat shock (2–7 hr post) or 10 hr after a 60-min heat shock for HS>fzr (dark blue circles) and wild type (w1118, light blue triangles). N ≥ 6 animals per time point. (C) The proportion of 3rd instar larval brain karyotypes prior to heat shock (No HS), or +10 hr, +24 hr and +120 hr after a 60 min heat shock, classified as euploid/diploid, euploid/polyploid, euploid/diplo-polyploid, or aneuploid/polyploid. Stacked bars represent Mean + Standard Error of the Mean (+S.E.M.), **p < 0.01, ***p< 0.001, t-test, data are an average of 3 replicates with at least 50 karyotypes per replicate. (D) The proportion of aneuploidies caused by 3:1 non-disjunction or 4:0 non-disjunction of wing imaginal disc diplochromosome divisions, inferred from subsequent divisions. Information is divided into gains and losses. N = 52 aneuploidies. (E) Representative time-lapse of a tetraploid cell without diplochromosomes dividing 24 hr after a 60-min heat shock to induce HS>fzr expression. Cenp-C-Tomato showing kinetochores in cyan, His2av-GFP showing DNA in magenta. Time represents min from the last frame prior to anaphase. (F) Representative micrographs depicting a cell within a wing-disc stained for Phospho-HistoneH3 (PH3, magenta) and γ–tubulin (green) before (no HS) and after (HS+10 hr) a 60min heat shock. HS>fzr cells occasionally show evidence of centrosome amplification. (F’) Quantification of the frequency of counting 2 centrosomes or greater than 2 centrosomes in diploid (2N) and tetraploid (4N) cells. Denominator represents the number of cells counted. (G) A time-lapse micrograph showing a tripolar anaphase in a HS>fzr cell 24 hr after a 60 min heat shock. Cenp-C-Tomato showing kinetochores is in cyan, His2av-GFP showing DNA is in magenta. Time represents min from the last frame prior to anaphase. (G’) Quantification of the number of diploid (2N) and tetraploid (4N) cells that showed tripolar anaphases before heat shock, or 10 hr and 24 hr after heat shock. Only a single tripolar was observed in over 200 movies, which is shown in (G). Scale bars represent 50 μm in A and 5 μm in E, F, and G.
Figure 2 with 1 supplement
The spindle assembly checkpoint wait-anaphase response is required after ectopic genome reduplication.
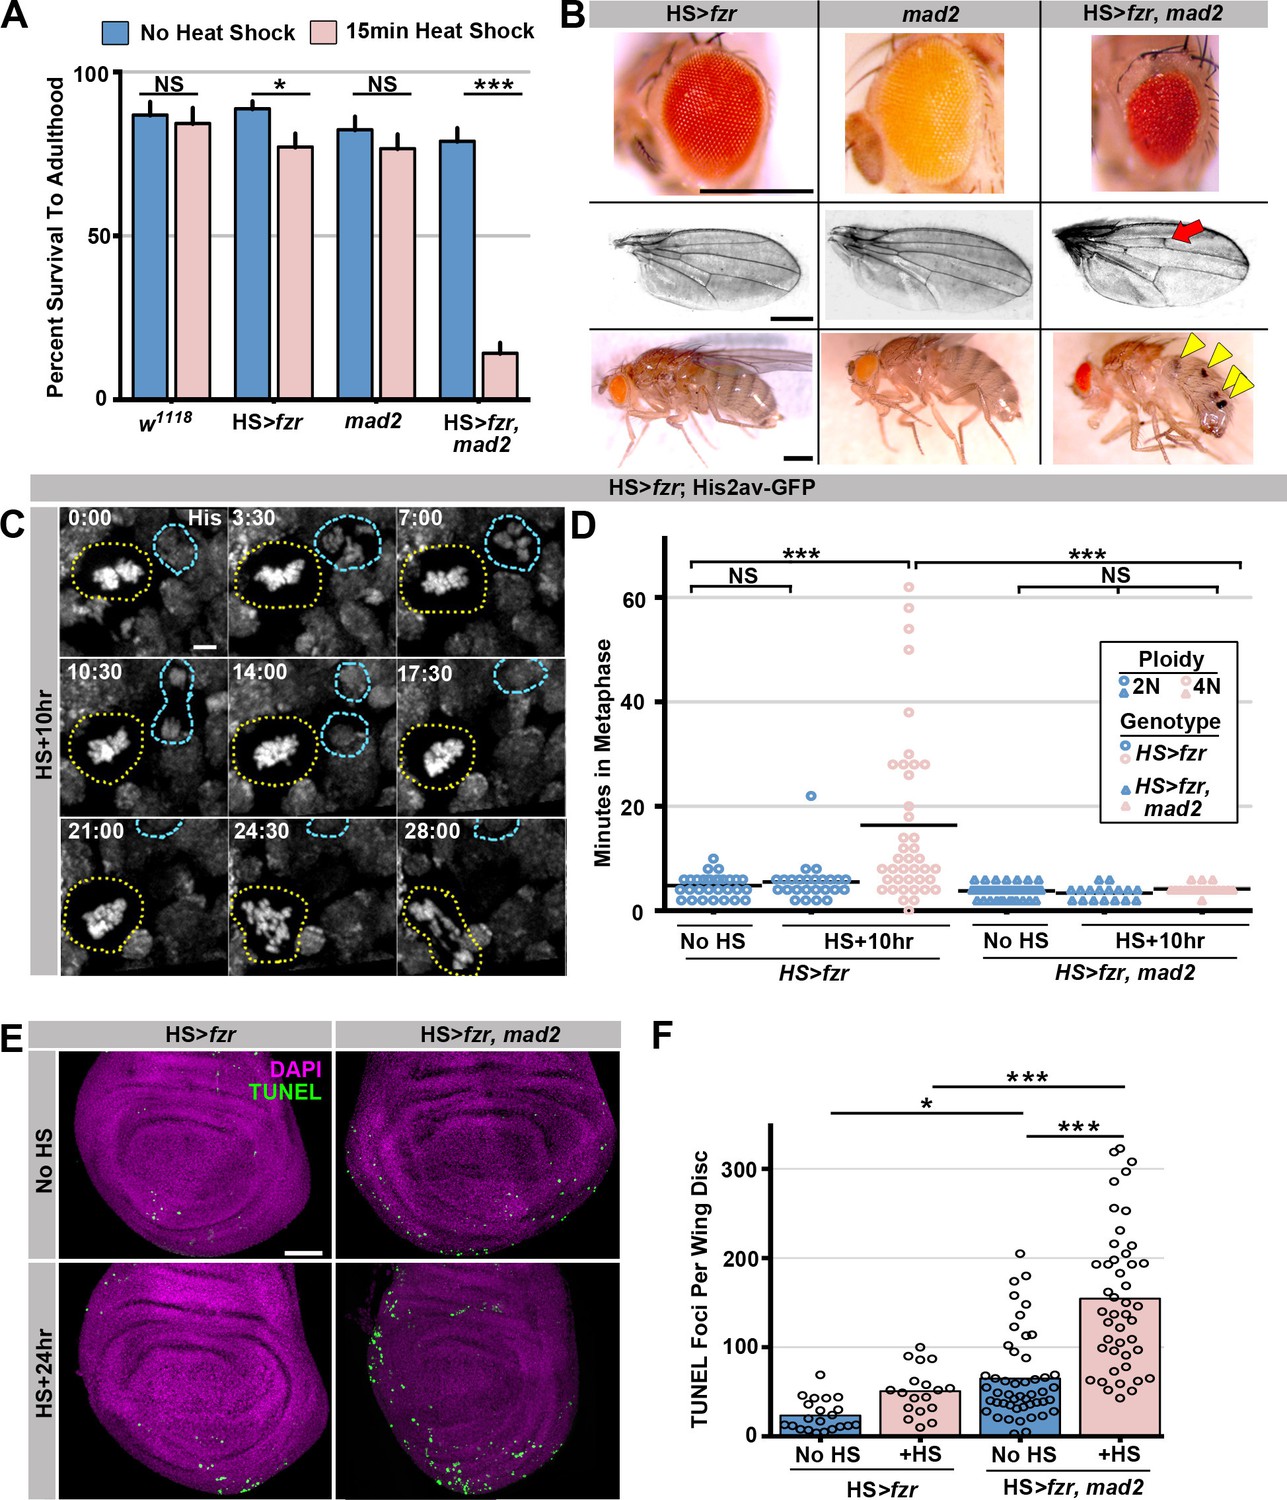
(A) Quantitation of survival rates from third instar larvae to adulthood of the indicated genotypes without heat shock (dark blue) or following a 15-min heat shock (light red) (which generates 23% tetraploid, see methods).Bars represent means + standard error of the mean (S.E.M) of at least 5 independent experiments, with 20 animals per experiment. *p<0.05, ***p<0.001, NS = p>0.05, t-test. (B) Representative micrographs of eyes, wings, and abdomens from HS>fzr alone, mad2 alone, or HS>fzr, mad2 flies heat shocked for 15 min as third instar larvae and then allowed to develop to adults. Red arrow indicates an extra ectopic wing vein, and yellow arrow heads indicate melanotic masses both of which are found in in HS>fzr, mad2 adults following heat shock. (C) Representative time-lapse showing a HS>fzr wing imaginal disc 10 hr after a 60-min heat shock including a cell with diplochromosomes (yellow dotted line) and a diploid cell (blue dashed line) dividing within the same field (one of the diploid daughters drifts vertically out of the frame). The cell with diplochromosomes takes more than four times as long to enter anaphase, and division is error prone. His2av-GFP showing DNA is in white. Time indicates minutes from the start of filming. (D) The length of metaphase without fzr overexpression (No HS) or +10 hr after a 60-min heat shock to induce overexpression from HS>fzr, and HS>fzr, mad2 larval wing imaginal disc cells. Points represent individual cell divisions, bars represent means, diploid cells are represented in dark blue, polyploid cells are represented in light red, HS>fzr is represented in circles, HS>fzr, mad2 is represented in triangles. N>17 cells per column, ***p<0.001, Not Significant (NS) = p>0.05, one-way ANOVA with correction for multiple hypothesis testing. (E) Third instar larval wing imaginal discs from HS>fzr or HS>fzr, mad2 stained for TUNEL in green and DAPI in magenta without heat shock (No HS) or +24 hr after a 15-min heat shock. (F) Quantification of the number of TUNEL positive foci per wing disc for HS>fzr and HS>fzr, mad2 without heat shock (No HS, blue bars) or 24 hr after a 15 min heat shock (+HS, red bars). Points represent individual wing imaginal discs, bars represent mean, N ≥ 18 discs per condition. NS = p>0.05, * = p<0.05, *** = p<0.001, ANOVA. Scale bars represent 500 μm in B, 5 μm in C, and 50 μm in E.
Figure 2—figure supplement 1
Supporting data regarding Mad2’s role in response to diplochromosomes.
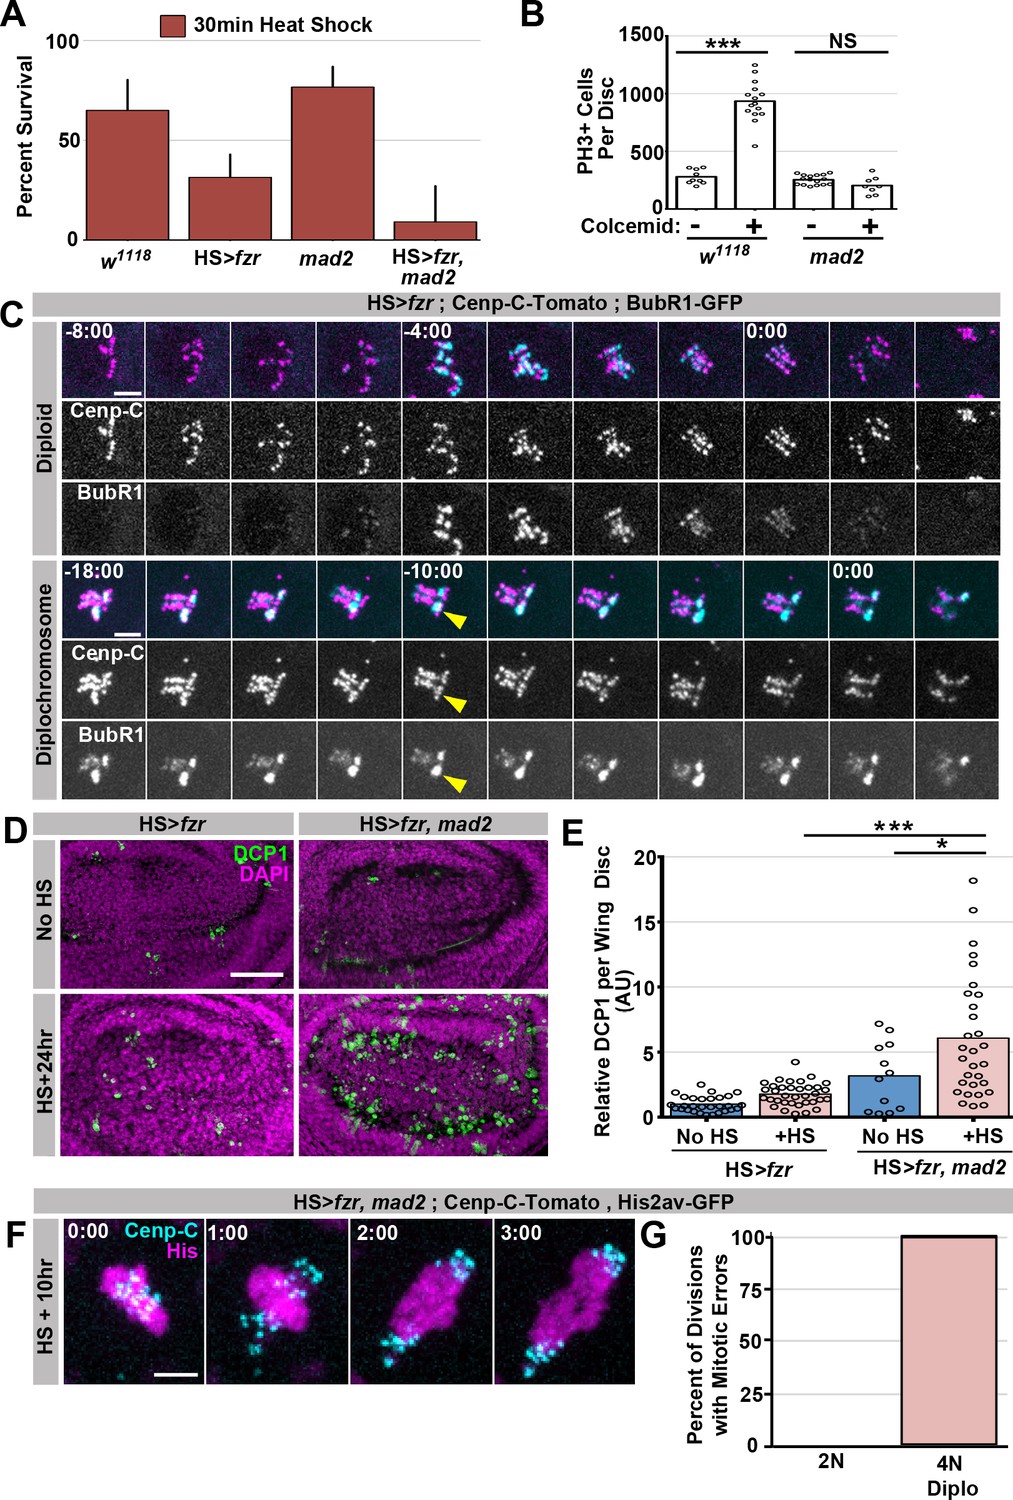
(A) Graph of the survival rate from third instar larvae to adulthood following a 30 min heat shock from wild type, HS>fzr alone, mad2 alone, or HS>fzr, mad2 animals. Bars represent means + Standard Error of the Mean (+ SEM) of at least 5 experiments with 20 animals per experiment. (B) Graph showing the number of Phospho-Histone H3 positive (PH3+) cells per wing imaginal disc incubated in PBS for one hour with (+) or without (-) colcemid from wild type, or mad2 animals. (C) Representative time-lapse micrographs of wing disc cells expressing Cenp-C-Tomato (magenta) and BubR1-GFP (cyan) dividing 10 hr after a 60-min heat shock. In diploid cells (top) BubR1 is evenly distributed across the kinetochores. In cells with diplochromosomes (bottom) mitosis is longer and BubR1 is present for longer as well. BubR1 is not evenly distributed on kinetochores prior to anaphase but appears to concentrate on a subset of diplochromosomes kinetochores. Time indicates minutes to the last prior to anaphase. (D) Micrographs of antibody staining against Drosophila cleaved caspase 1 protein (DCP1) in the wing disc pouch of HS>fzr or HS>fzr, mad2 animals without heat shock or 24 hr after a 15-min heat shock. DCP1 is in green and DAPI is in magenta. (E) Quantification of the relative amount of DCP1 staining per wing disc from HS>fzr and HS>fzr,mad2 without heat shock or 24 hr after a 15-min heat shock. Data was normalized so that the mean of HS>fzr without heat shock (No HS) is equal to 1. Points represent individual wing discs, bars represent means without (dark blue) or with (light red) a 15 min heat shock. *p<0.05, ***p< 0.001, ANOVA, N > 12 animals per condition. (F) Representative live imaging of a HS>fzr, mad2 cell dividing with diplochromosomes 10 hr after a 60-min heat shock. Cenp-C-Tomato to label kinetochores is in cyan and His2av-GFP to label DNA is in magenta. Minutes indicate time to the last frame prior to anaphase. (G) Graph showing the frequency of errors in HS>fzr, mad2 diploid cells (0%), HS>fzr, mad2 tetraploid cells with diplochromosomes (100%), and HS>fzr cells with diplochromosomes (80%). Scale bar represents 5 μm in C and F and 50 μm in D.
Figure 3 with 1 supplement
Programed genome reduplication in papillar cells is followed by Separation Into Recent Sisters (SIRS), which individualizes polytene chromosomes into recent sister pairs.
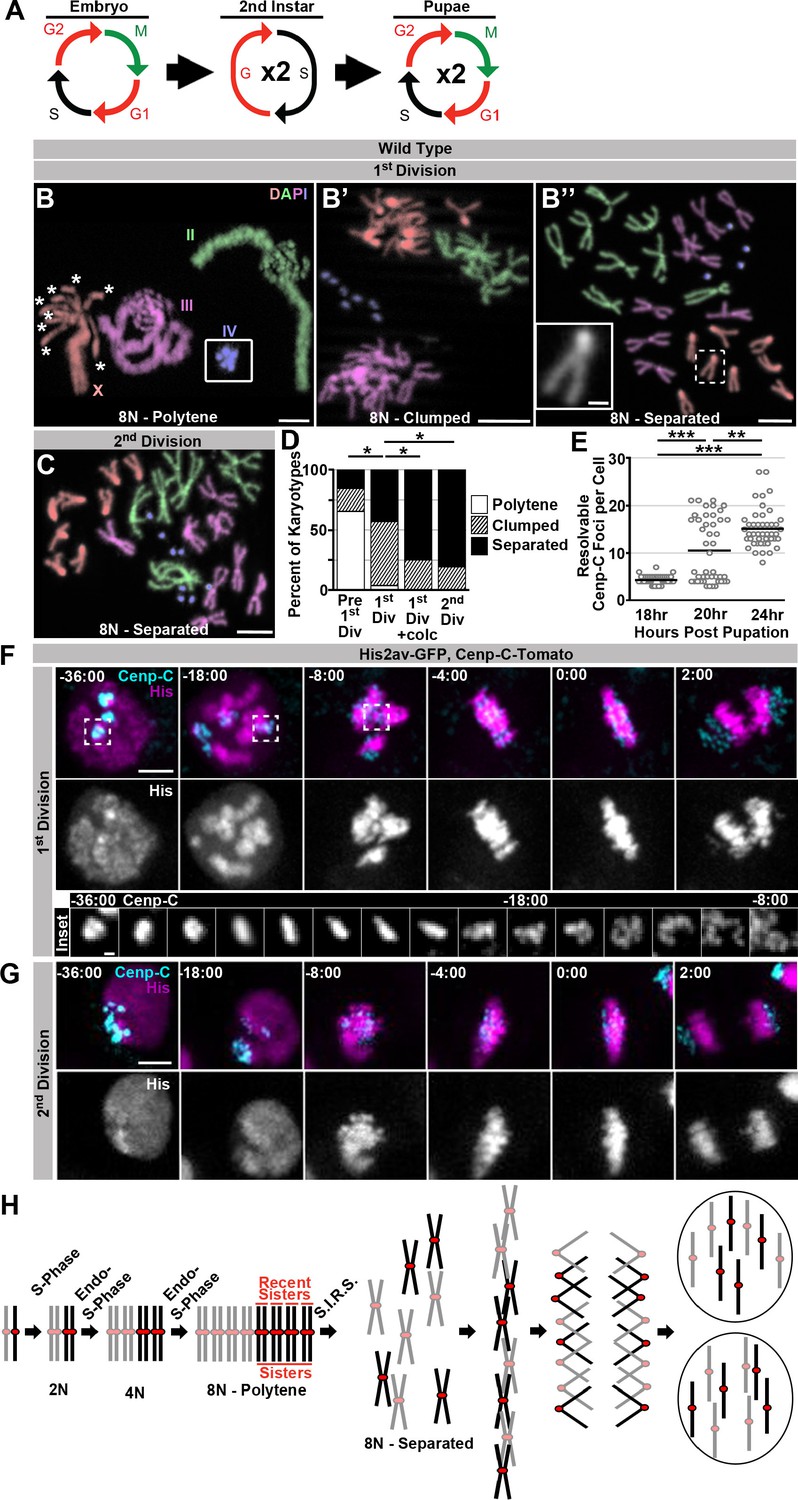
(A) A model of the cell cycles in Drosophila papillar cells. These cells undergo two rounds of the endocycle in the 2nd instar to reach 8N/16C, then enter a G2-like state, then undergo, on average, two cell divisions with intervening S-phases during pupation (Fox et al., 2010; Schoenfelder et al., 2014). (B) Karyotypes of papillar cells during the 1st polyploid division, (B–B’’). Chromosomes are pseudocolored according to type and labeled in panel B. Panel B inset shows the 4th chromosomes, which were out of frame. When chromosomes first condense following genome reduplication, they are in a polytene configuration (asterisks indicate the 8 separated centromere pairs of an otherwise polytene X chromosome). This cell contains a heterozygous pericentric inversion on the third chromosome caused by the presence of a balancer chromsome. B’ Example of the clumped configuration in early mitosis of the first papillar division. B’’ Example of fully separated 1st division papillar chromosomes. No diplochromosomes are present (compare X chromosome in inset to inset in Figure 1F’). Note- one second chromosome contains a DNA break, which are common in wild type papillar cells (Fox et al., 2010; Bretscher and Fox, 2016). (C) Karotype of papillar chromosomes during the 2nd polyploid division. Chromosomes are pseudocolored according to type as in Figure 3B. At the second division almost all cells show chromosomes fully separated into sister pairs. (D) Percentage of cells with polytene chromosomes, recent sisters clumped, or recent sisters clearly separated from four time points: prior to the first division (following treatment with Calyculin A to visualize pre-mitotic chromosome structure- see Materials and methods), during the first division (no drug treatment), during the first division (following treatment for 30 min with colcemid to enrich for late metaphase (1st Div + colc)), and during the second division (no drug treatment). *p<0.05 compared to 1st Division, chi-squared test, N ≥ 26 karyotypes per treatment from at least 5 animals. (E) Quantification of the number of resolvable Cenp-C-Tomato foci in fixed papillar cells during the course of pupation (expressed in hours post pupation). Before the first mitosis (18 hr) each cell has an average of 4.1 kinetochore foci closely corresponding to the haploid chromosome number, following the first division (24 hr) cells average 15.1 foci per cell. At 20 hr some cells have divided and others are yet to divide and the distribution is bimodal. Circles represent individual cells. Bars represent the mean of 3 animals per time point and 15 cells per animal. ***p<0.001, **p<0.01, by Kruskal-Wallis one-way ANOVA. (F) Live imaging of the 1st divisions from wild type papillar cells shows the SIRS process. Cenp-C-Tomato (Cenp-C) is in cyan, His2av-GFP (His) is in magenta. Time represents minutes to the last frame prior to anaphase. In the 1st division kinetochores from a group of homologs are tightly clustered prior to division. At -18:00 min. relative to anaphase, chromosome condensation has begun and polytene chromosomes are visible (See His channel). Dispersal continues until individual pairs of sister kinetochores are evident at metaphase. The inset shows the Cenp-C-Tomato channel of a single kinetochore focus from time frames -36 min to -8 min. (G) Live imaging of the 2nd division from a wild type papillar cell. In contrast to the first division many discrete kinetochore foci are evident at time-points prior to the onset of mitosis, and polytene chromosomes are never evident. (H) A model for a pair of homologs undergoing 2 rounds of endo-S-phase to become a polytene 16C chromosome. The polytene chromosome then separates into pairs composed of only the most recent sister chromatids during mitosis, and each sister then segregates to opposite poles at anaphase. Scale bar represents 5 μm, except in insets in B’’ and F where it represents 1 μm.
Figure 3—figure supplement 1
Supporting data regarding SIRS.
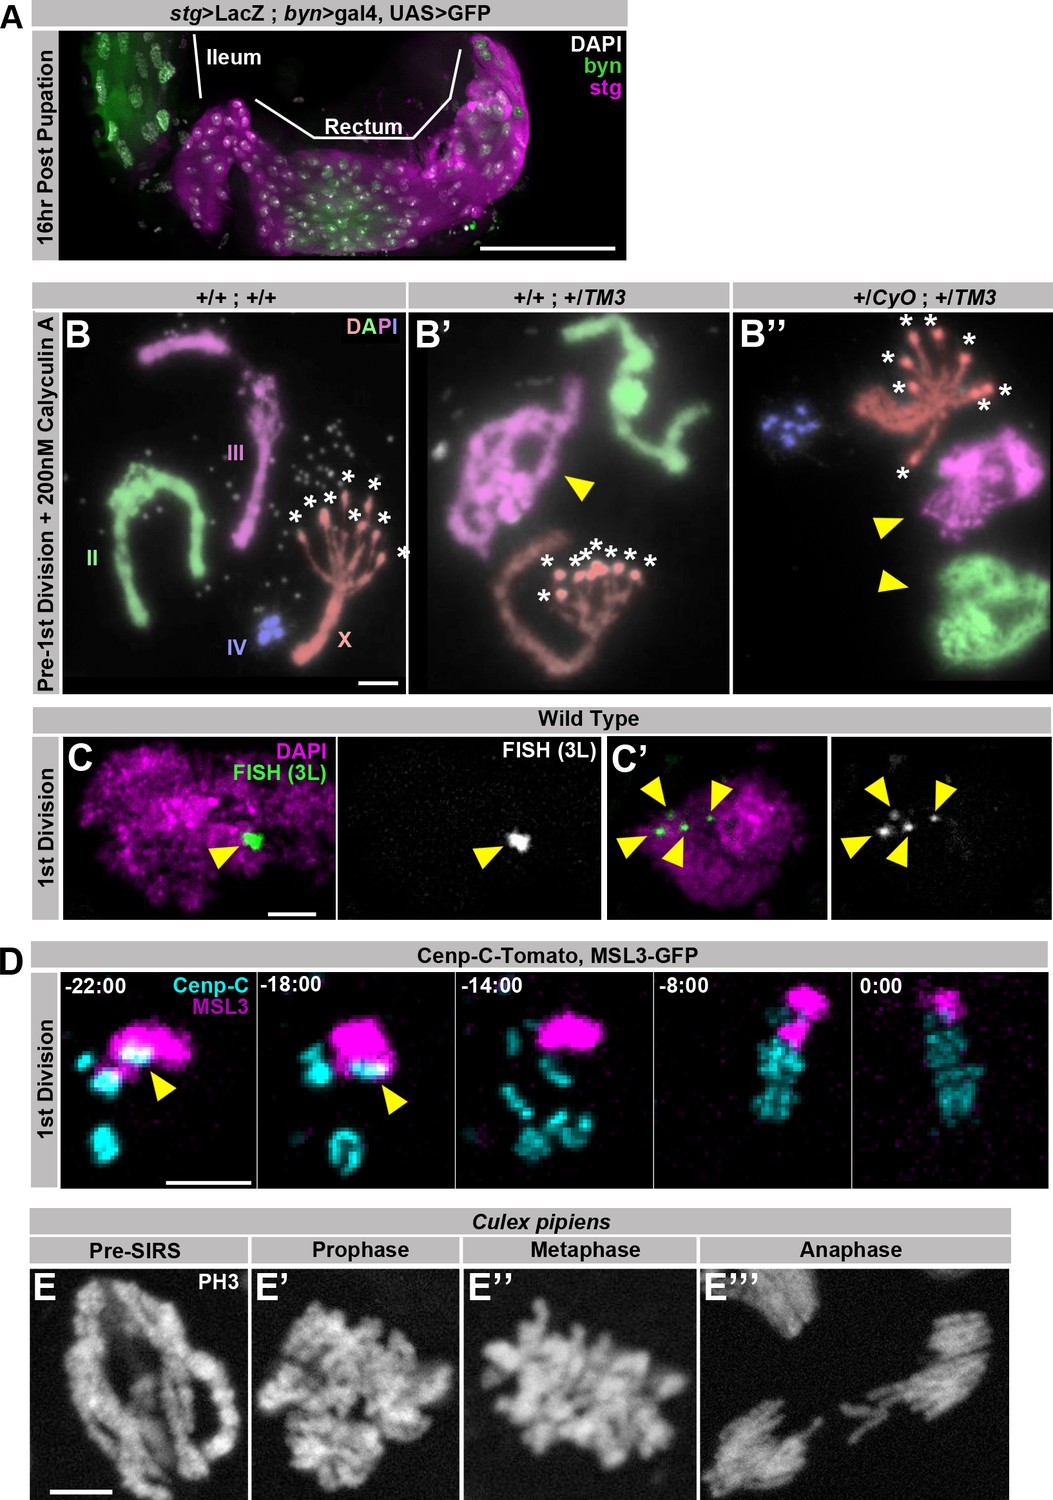
(A) Representative micrograph of the hindgut including the ileum (anterior, left) and rectum (posterior, right) stained for GFP driven by brachyenteron (byn) (green), stg>LacZ4.9(magenta), and DAPI (white) at 16 hr post pupation, a time point shortly before the onset of the first papillar mitosis.The rectum but the not ileum stains strongly for expression of the G2/M regulator string. (B) Karyotypes of papillar cells from just prior to the first papillar division treated with 200 nM Calyculin A to induce Premature Chromosome Compaction (PCC), showing polytene chromosome organization in the interphase prior to SIRS. Panels show genotypes without balancer chromosomes (B), with one balancer chromosome (B’) or with two balancer chromosomes (B’’). Balancer chromosomes are evident by the presence of pericentric inversions (yellow arrowhead). Asterisks indicate where the 8 recent sister chromatid pairs of the acrocentric X-chromosome have already separated into eight pairs of recent sister centromeres. Chromosomes are false colored by homolog and labelled in (B) (C) Two representative micrographs taken from the same field showing Fluorescent in situ hybridization (FISH) to a single region on the left arm of chromosome 3 in green and DAPI in magenta during the 1st papillar division, at a time-point in which some cells have a pre-SIRS chromosome configuration (C) while others have undergone SIRS (C’). Yellow arrowheads indicate FISH foci. (D) Live imaging of a papillar cell 1st division from a male expressing MSL3-GFP (magenta) and Cenp-C-Tomato (Cyan). MSL3-GFP is specific to the male X chromosome and only a single Cenp-C-Tomato focus is MSL3-GFP positive prior to SIRS (yellow arrows) indicating that each Cenp-C foci is composed of a single homolog. Time represents minutes prior to the final frame of metaphase. (E) Micrographs of polyploid pupal division mitotic chromosomes stained with Phospho-Histone H3 (white) from the ileum of Culex pipiens, showing cells in all stages of mitosis including an apparent pre-SIRS polytene phase (E), as well as a post SIRS prophase (E’) cell.Scale bars represent 5 μm except in A where it represents 50 μm.
Figure 4
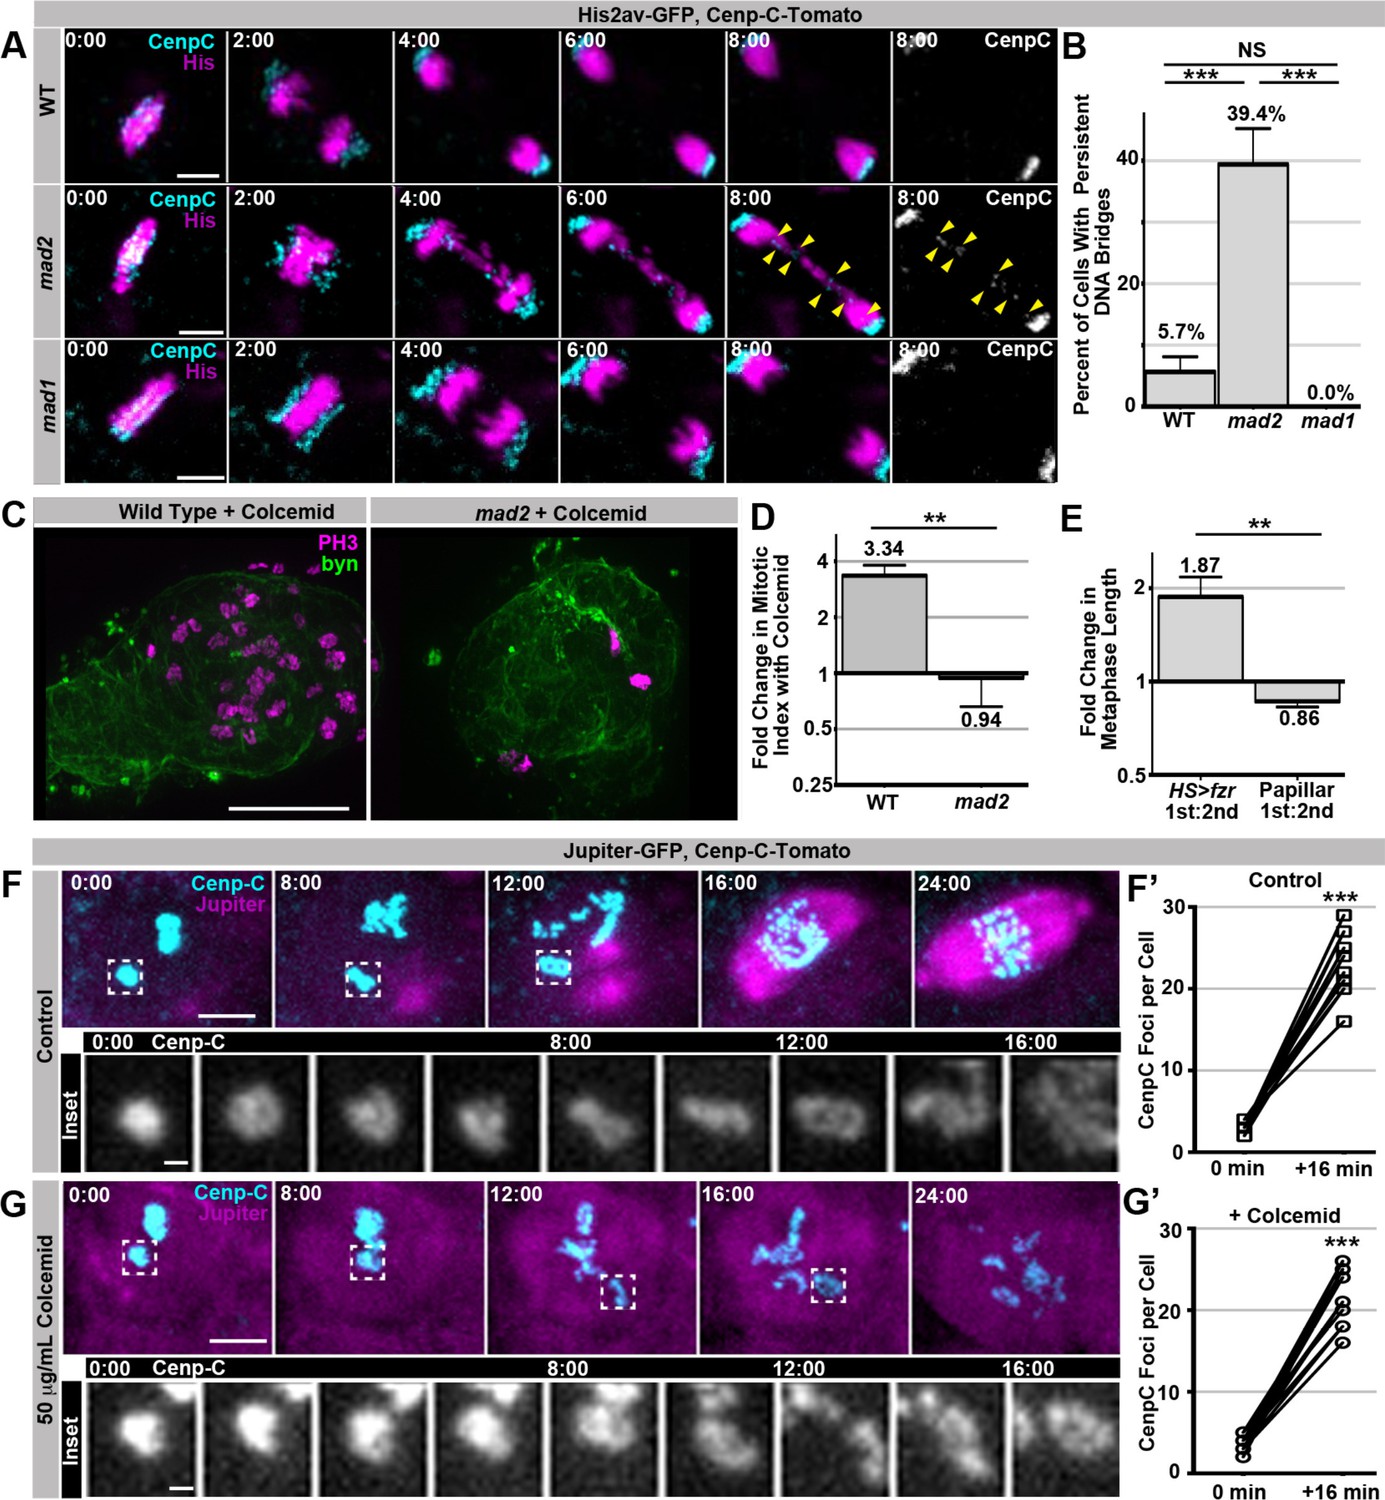
SIRS does not depend on the SAC wait-anaphase response or formation of a mitotic spindle.
(A) Representative micrographs of wild type (WT), mad2, and mad1 cell 1st divisions beginning in the last frame of metaphase (0:00) and continuing through eight minutes of anaphase.Cenp-C-Tomato showing kinetochores in cyan, His2av-GFP showing DNA in magenta. Yellow arrowheads show kinetochores that are part of a bridge between the two poles in a mad2 cell. Time represents minutes from the last frame prior to anaphase. (B) Quantification of the frequency of persistent DNA bridging observed 4 min after the onset of the 1st division anaphase from papillar cells in wild type (WT), mad2, and mad1 animals. Bars represent the mean of all cell divisions, + Standard Error of the Mean (S.E.M.) ***p<0.001, t-test. (C) Representative images of a single pupal rectums from wild type or mad2 animals treated with colcemid for 60 min prior to fixation and stained for Phospho-Histone H3 (PH3) positive nuclei in magenta and expressing GFP under the control of brachyenteron (byn, a hindgut marker) in green. (D) The fold increase in the number of polyploid mitotic cells per hindgut from wild type and mad2 animals following treatment with colcemid compared to without colcemid. A value of 1 equals no difference. Bars represent mean fold change (+ SEM), and are labeled with the mean value. **p<0.01, t-test, N ≥ 8 animals per condition. (E) The fold increase in metaphase length for HS>fzr polyploid cells with (1st) and without polytene diplochromosomes (2nd) compared to papillar cells with (1st division) and without (2nd division) polytene chromosomes. A value of one equals no difference between 1st and 2nd divisions. The increase in HS>fzr wing cells indicates that metaphase polytene diplochromosomes trigger the spindle assembly checkpoint, but papillar polytene chromosomes do not. Bars represent means (+S.E.M.), and are labeled with the mean value. *p<0.05, t-test, N ≥ 22 cells per condition from at least 5 animals. (F) Live imaging of a cell expressing Cenp-C-Tomato in cyan and Jupiter-GFP in magenta undergoing SIRS in the presence of a vehicle control. Time represent minutes before the onset of SIRS. Inset shows the dispersal of a single Cenp-C-Tomato kinetochore at all the time points between 0 min and 16 min. (F’) shows the number of resolvable Cenp-C-Tomato foci from prior to SIRS (0 min) and after SIRS (16 min), points represent individual cells with the two time points connected by a line. ***p<0.001, t-test N = 12 divisions from 2 animals. (G) Live imaging of a cell expressing Cenp-C-Tomato in cyan and Jupiter-GFP in magenta undergoing SIRS in the presence of a colcemid. Time represent minutes from the onset of SIRS. Inset shows the dispersal of a single Cenp-C-Tomato kinetochore at all the time points between 0min and 16 min. (G’) shows the number of resolvable Cenp-C-Tomato foci from prior to SIRS (0 min) and after SIRS (16 min), points represent individual cells with the two time points connected by a line. ***p<0.001, t-test, N = 15 cells from 5 animals. Scale bar represents 5 μm except in insets of F, and G where they represent 1 μm.
Figure 5
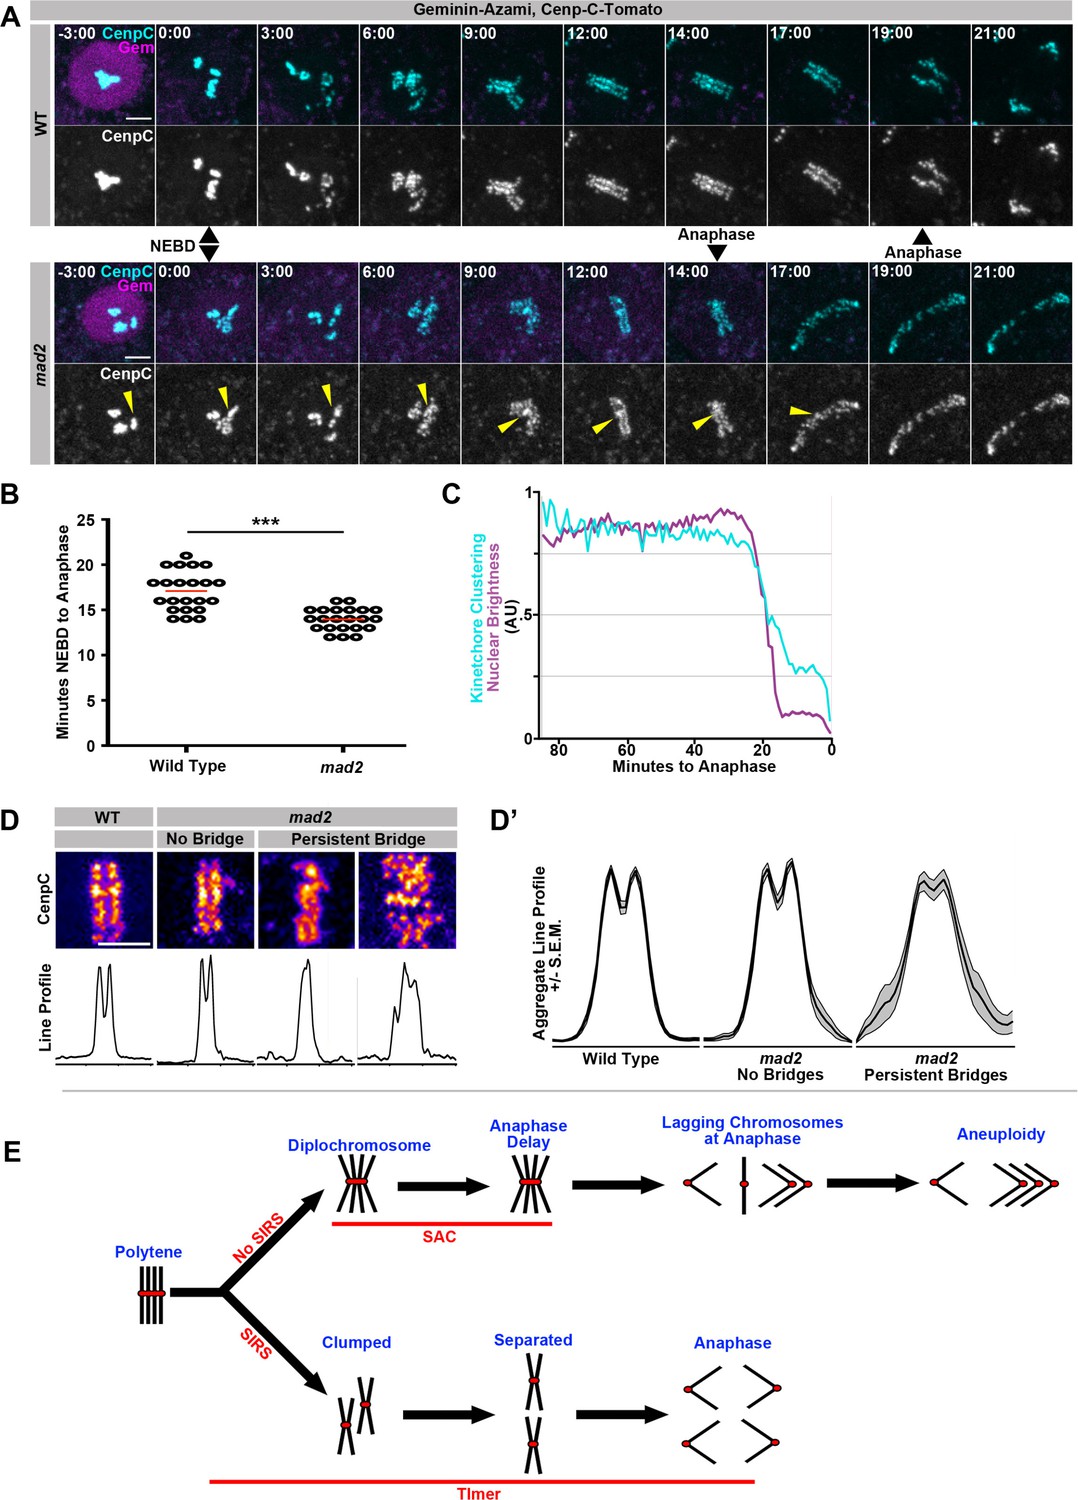
SIRS is dependent on Mad2-dependent mitotic timing.
(A) Live imaging of a representative wild type and mad2 cell expressing geminin-Azami (magenta) in and Cenp-C-Tomato (cyan) during the 1st papillar division. Just the Cenp-C-Tomato channel is also shown. Nuclear Envelope Breakdown (NEBD) can be seen when the geminin signal goes from nuclear to cytoplasmic. Time represents minutes from NEBD. The mad2 cell reaches anaphase more quickly after NEBD than the wildtype cell (14 min to 19 min). Yellow arrows indicate a Cenp-C foci in mad2 that appears to fail SIRS and is still partially clumped at anaphase. (B) The length of time from NEBD to anaphase in wild type and mad2 papillar cells. Points represent individual cell divisions, red bar represents mean (17.1 min for wild type, 14.0 min for mad2). ***p<0.001, t-test, N = 22 cell divisions for each condition from at least 5 animals. (C) Quantification of the intensity of geminin-Azami in magenta and a measure of kinetochore clusteredness in cyan over time from wild type cell. 0 min represents the onset of anaphase. Both measures decline synchronously at the onset of NEBD. Data represents the mean of 22 cells. (D) Representative images of Cenp-C-Tomato forming the metaphase plate of WT or mad2 cells immediately prior to the onset of anaphase with reds indicating more Cenp-C-Tomato signal and blue indicating less signal (Top) and line graphs measuring the total signal intensity from left to right (Bottom), in call cases the eventual division is in the same left-right orientation. mad2 metaphases were split into those that did not generate a persistent DNA bridge at anaphase (no bridge) and those that did (persistent bridge). (D’) Aggregate plots of the line graph and the confidence interval for each category. mad2 cells that formed bridgs are significantly more variable than wild type or mad2 without bridging. N > 13 cells per category. (E) Model: A simplified model in which four sisters from a single round of genome reduplication are shown. In cells with SIRS (down arrow) polytenes fully split into individual sister pairs and with a functioning mitotic timer complete SIRS and divide evenly. However, in the absence of the timer anaphase is precocious and DNA bridges result from incompletely resolved polytene chromosomes. In cells without SIRS (upper arrow), diplochromosomes result. The spindle assembly checkpoint (SAC) delays cells in metaphase and reduces but does not eliminate aneuploidy during the ensuing anaphase. In the absence of a checkpoint, cell death results from errant diplochromosome divisions.
Author Response Image 1
Videos
Video 1
This video accompanies Figure 1I.
Live imaging of a diploid HS>fzr wing imaginal disc cell dividing prior to HS>fzr expression showing His2av-GFP in magenta to label DNA, and Cenp-C-Tomato in cyan to label kinetochores. No mitotic errors are detected. Time Indicates minutes to the last frame of metaphase, scale bars represent 5 μm.
Video 2
This video accompanies Figure 1I.
Live imaging of a tetraploid HS>fzr wing imaginal disc cell with diplochromosomes 10 hr after a 60-min heat shock to induce HS>fzr expression with His2av-GFP in magenta to label DNA, and Cenp-C-Tomato in cyan to label kinetochores. Lagging chromosomes are evident. Time Indicates minutes to the last frame of metaphase, scale bars represent 5 μm.
Video 3
This video accompanies Figure 1—figure supplement 1E.
Live imaging of a tetraploid HS>fzr wing imaginal disc cell without diplochromosomes 24 hr after a 60-min heat shock to induce fzr overexpression with His2av-GFP in magenta to label DNA, and Cenp-C-Tomato in cyan to label kinetochores. Time Indicates minutes to the last frame of metaphase, scale bars represent 5 μm.
Video 4
This video accompanies Figure 1—figure supplement 1G.
Live imaging from a tetraploid HS>fzr wing imaginal disc cell 24 hr after a 60-min heat shock, undergoing a tripolar anaphase with His2av-GFP in magenta to label DNA, and Cenp-C-Tomato in cyan to label kinetochores. Time Indicates minutes to the last frame of metaphase, scale bars represent 5 μm.
Video 5
This video accompanies Figure 2C.
Live imaging of a wing disc from a HS>fzr animal 10 hr after a 60-min heat shock showing mitosis by a polyploid diplochromosome-containing cell (yellow dotted line) and a diploid cell (blue dotted and dashed line) in the same field, His2av-GFP labelling DNA is shown. Time Indicates minutes from the start of filming, scale bars represent 5 μm.
Video 6
This video accompanies Figure 2—figure supplement 1C.
Live imaging of Cenp-C-Tomato in magenta to label kinetochores and BubR1-GFP in cyan during the division of a diploid cell 10 hr after a 60-min heat shock. Time indicates minutes to the last frame of metaphase. Scale bar represents 5 μm.
Video 7
This video accompanies Figure 2—figure supplement 1C.
Live imaging showing Cenp-C-Tomato to label kinetochores in magenta and BubR1-GFP in cyan during the division of a tetraploid cell with diplochromosomes 10 hr after a 60-min heat shock. Time indicates minutes to the last frame of metaphase. Scale bar represents 5 μm.
Video 8
This video accompanies Figure 2—figure supplement 1F.
Live imaging showing His2av-GFP in magenta and Cenp-C-Tomato in cyan during the division of a HS>fzr,mad2 tetraploid cell with diplochromosomes 10 hr after a 60-min heat shock. Time indicates minutes from the last frame of metaphase. Scale bar represents 5 μm.
Video 9
This video accompanies Figure 3F.
Live imaging of a papillar cell undergoing a first division, including the SIRS process showing His2av-GFP in magenta, and Cenp-C-Tomato in cyan. SIRS is most evident at the centromere which transitions from four tight foci prior to mitosis to many foci at anaphase. Polytene chromosomes are visible 18:00 min before anaphase. Time Indicates minutes to the last frame of metaphase, scale bars represent 5 μm.
Video 10
This video accompanies Figure 3G.
Live imaging showing His2av-GFP in magenta, and Cenp-C-Tomato in cyan from a papillar cell undergoing a second division. Time Indicates minutes to the last frame of metaphase, scale bars represent 5 μm.
Video 11
This video accompanies Figure 3—figure supplement 1D.
Live-imaging showing MSL3-GFP in magenta and Cenp-C-Tomato in cyan from a male papillar cell undergoing a first division. Only a single Cenp-C-Tomato foci is MSL-3-GFP positive. Time Indicates minutes to the last frame of metaphase, scale bars represent 5 μm.
Video 12
This video accompanies Figure 3—figure supplement 1E.
Video showing sequential z-planes from a fixed ileum of Culex pipiens with mitotic cells that are pre-SIRS (left) and post-SIRS (right) stained with Phospho-Histone H3. scale bars represent 5 μm.
Video 13
This video accompanies Figure 4A.
Live imaging showing His2av-GFP in magenta, and Cenp-C-Tomato in cyan from a wild type papillar cell during anaphase of the first mitosis. Minutes indicates time before the onset of anaphase. No DNA bridge is present.
Video 14
This video accompanies Figure 4A.
Live imaging showing His2av-GFP in magenta, and Cenp-C-Tomato in cyan from a mad2 papillar cell from DNA condensation through anaphase of the first mitosis, including formation of a DNA bridge. Minutes indicates the time to before the onset of anaphase.
Video 15
This video accompanies Figure 4A.
Live imaging showing His2av-GFP in magenta, and Cenp-C-Tomato in cyan from a mad1 papillar cell during from DNA condensation through anaphase of the first mitosis. No DNA bridging is present in mad1 papillar cells. Time indicates minutes from the onset of anaphase.
Video 16
This video accompanies Figure 4F.
Live imaging showing Jupiter-GFP in magenta and Cenp-C-Tomato in cyan from a first division papillar cell undergoing SIRS in control imaging media. Time indicates minutes from the start of filming.
Video 17
This video accompanies Figure 4G.
Live imaging showing Jupiter-GFP in magenta and Cenp-C-Tomato in cyan from a first division papillar cell undergoing SIRS in the presence of a colcemid. Colcemid prevents spindle formation so the Jupiter remains diffuse. Time indicates minutes from the onset of filming.
Video 18
This video accompanies Figure 5A.
Live imaging showing Geminin-Azami in magenta, and Cenp-C-Tomato in cyan in a wild type papillar cell from prior to Nuclear Envelope Breakdown through anaphase. The geminin signal is nuclear before the onset of mitosis. Concurrent with NEBD is the onset of SIRS. Anaphase takes place 19 min after NEBD. Time indicates minutes from the first frame after NEBD. Scale bar represents 5 μm
Video 19
This video accompanies Figure 5A.
Live imaging showing Cenp-C-Tomato in cyan and Geminin-Azami in magenta in a mad2 papillar cell from prior to NEBD through anaphase. Anaphase is 14 min after NEBD and Cenp-C-tomato clumps are still evident. Time indicates minutes from the first frame after NEBD. Scale bar represents 5 μm
Download links
A two-part list of links to download the article, or parts of the article, in various formats.
Downloads (link to download the article as PDF)
Open citations (links to open the citations from this article in various online reference manager services)
Cite this article (links to download the citations from this article in formats compatible with various reference manager tools)
Distinct responses to reduplicated chromosomes require distinct Mad2 responses
eLife 5:e15204.
https://doi.org/10.7554/eLife.15204


