Enhancer regions show high histone H3.3 turnover that changes during differentiation
- Massachusetts General Hospital, United States
- Harvard Medical School, United States
- Instituto Gulbenkian de Ciencia, Portugal
- Massachusetts General Hospital and Harvard Medical School, United States
Figures
Figure 1 with 3 supplements

Time-ChIP assay in H3.3_SNAP ESCs.
(A) Western blot for total H3 in H3.3_SNAP ESCs after 48 hr dox induction of transgene. (B) Outline of time-ChIP protocol. (C) Quantification of DNA recovered from time-ChIP experiments. The amount of DNA relative to the 0 hr sample (expressed as %) was averaged over two H3.3 time-ChIP replicates. Error bars are ± standard deviation.
Figure 1—figure supplement 1
Time-ChIP assay in H3.3_SNAP ESCs.
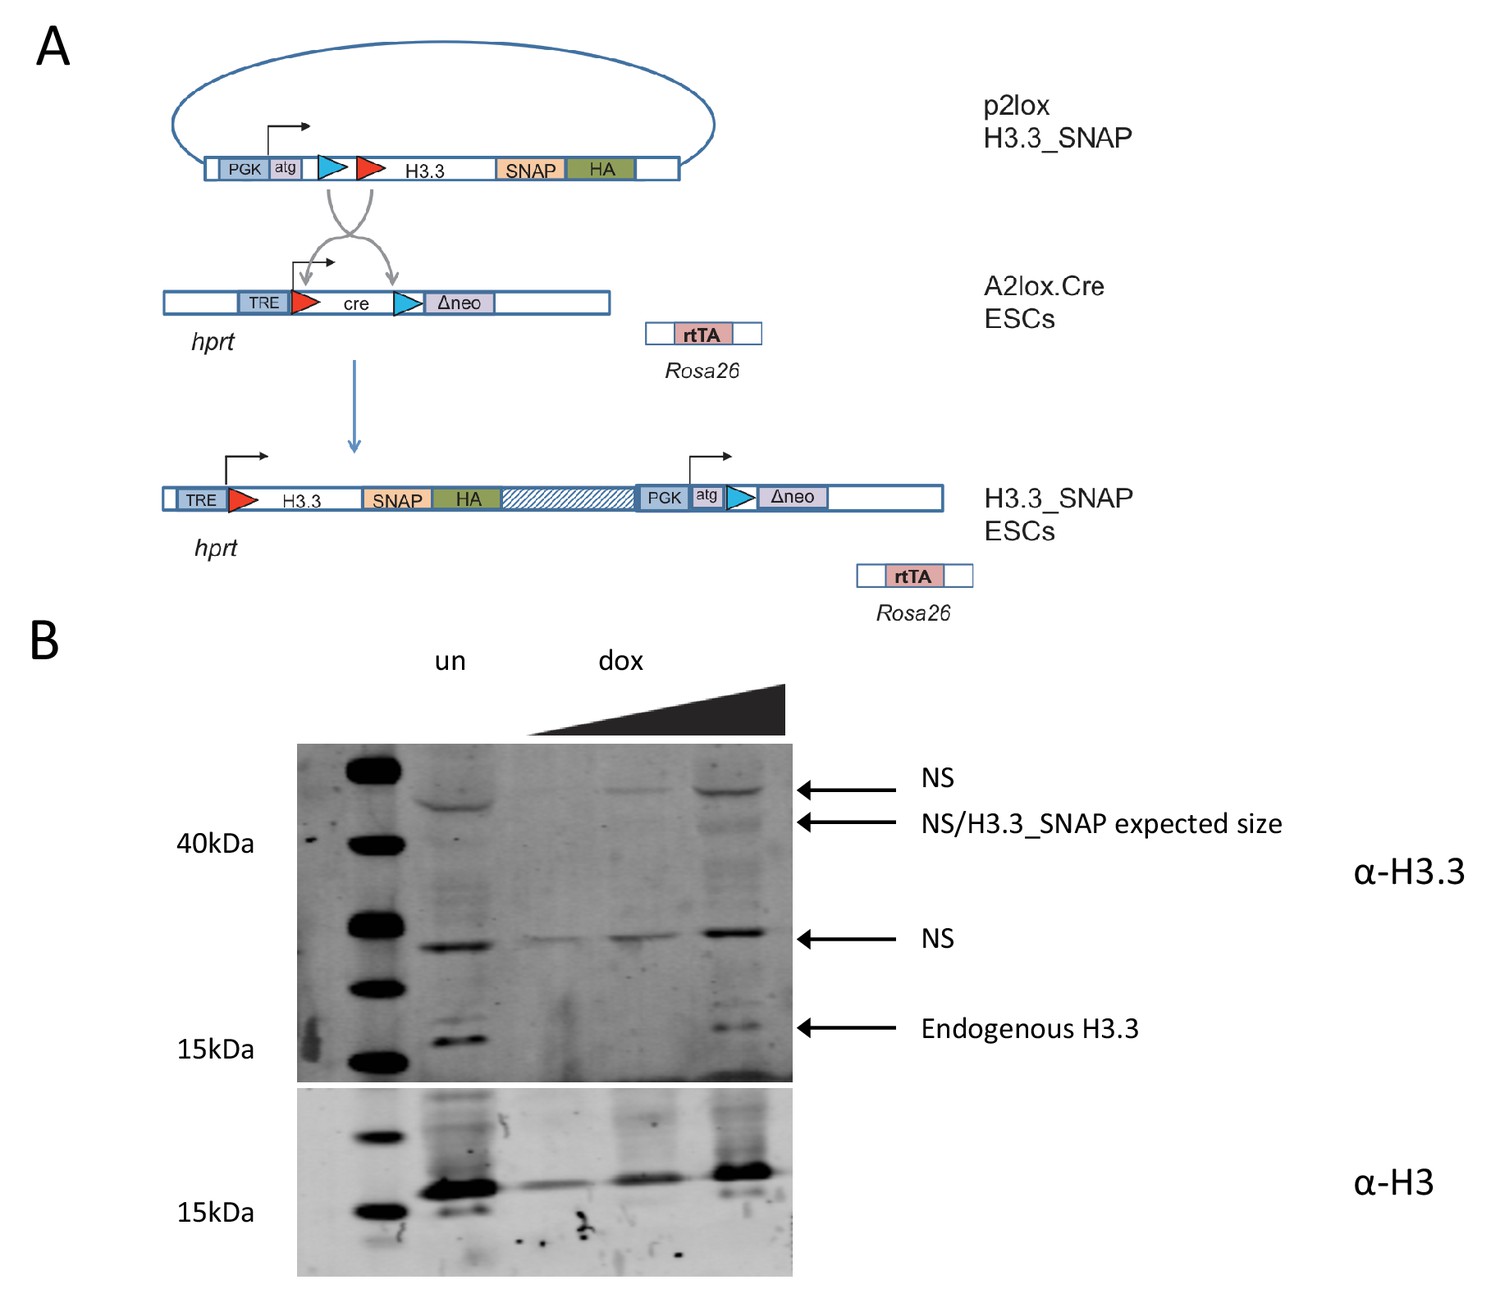
(A) Generation of H3.3_SNAP ESCs. The p2lox H3.3_SNAP plasmid was introduced into A2lox.Cre ESCs resulting in H3.3_SNAP ESCs expressing H3.3_SNAP_HA under dox inducible control from the hprt locus along with a neomycin resistance gene. These cells contain rtTA expressed from the Rosa26 locus to mediate dox inducible expression. (B) Western blot for H3.3 in H3.3_SNAP ESCs. For dox induced samples ('dox'), increasing amounts of protein were loaded, for the uninduced sample ('un'), only the highest protein concentration was loaded. Non-specific bands present in both the uninduced and dox induced samples are marked as 'NS'. Endogenous H3 serves as a loading control.
Figure 1—figure supplement 2
Post-translational modification of SNAP-tagged histones.
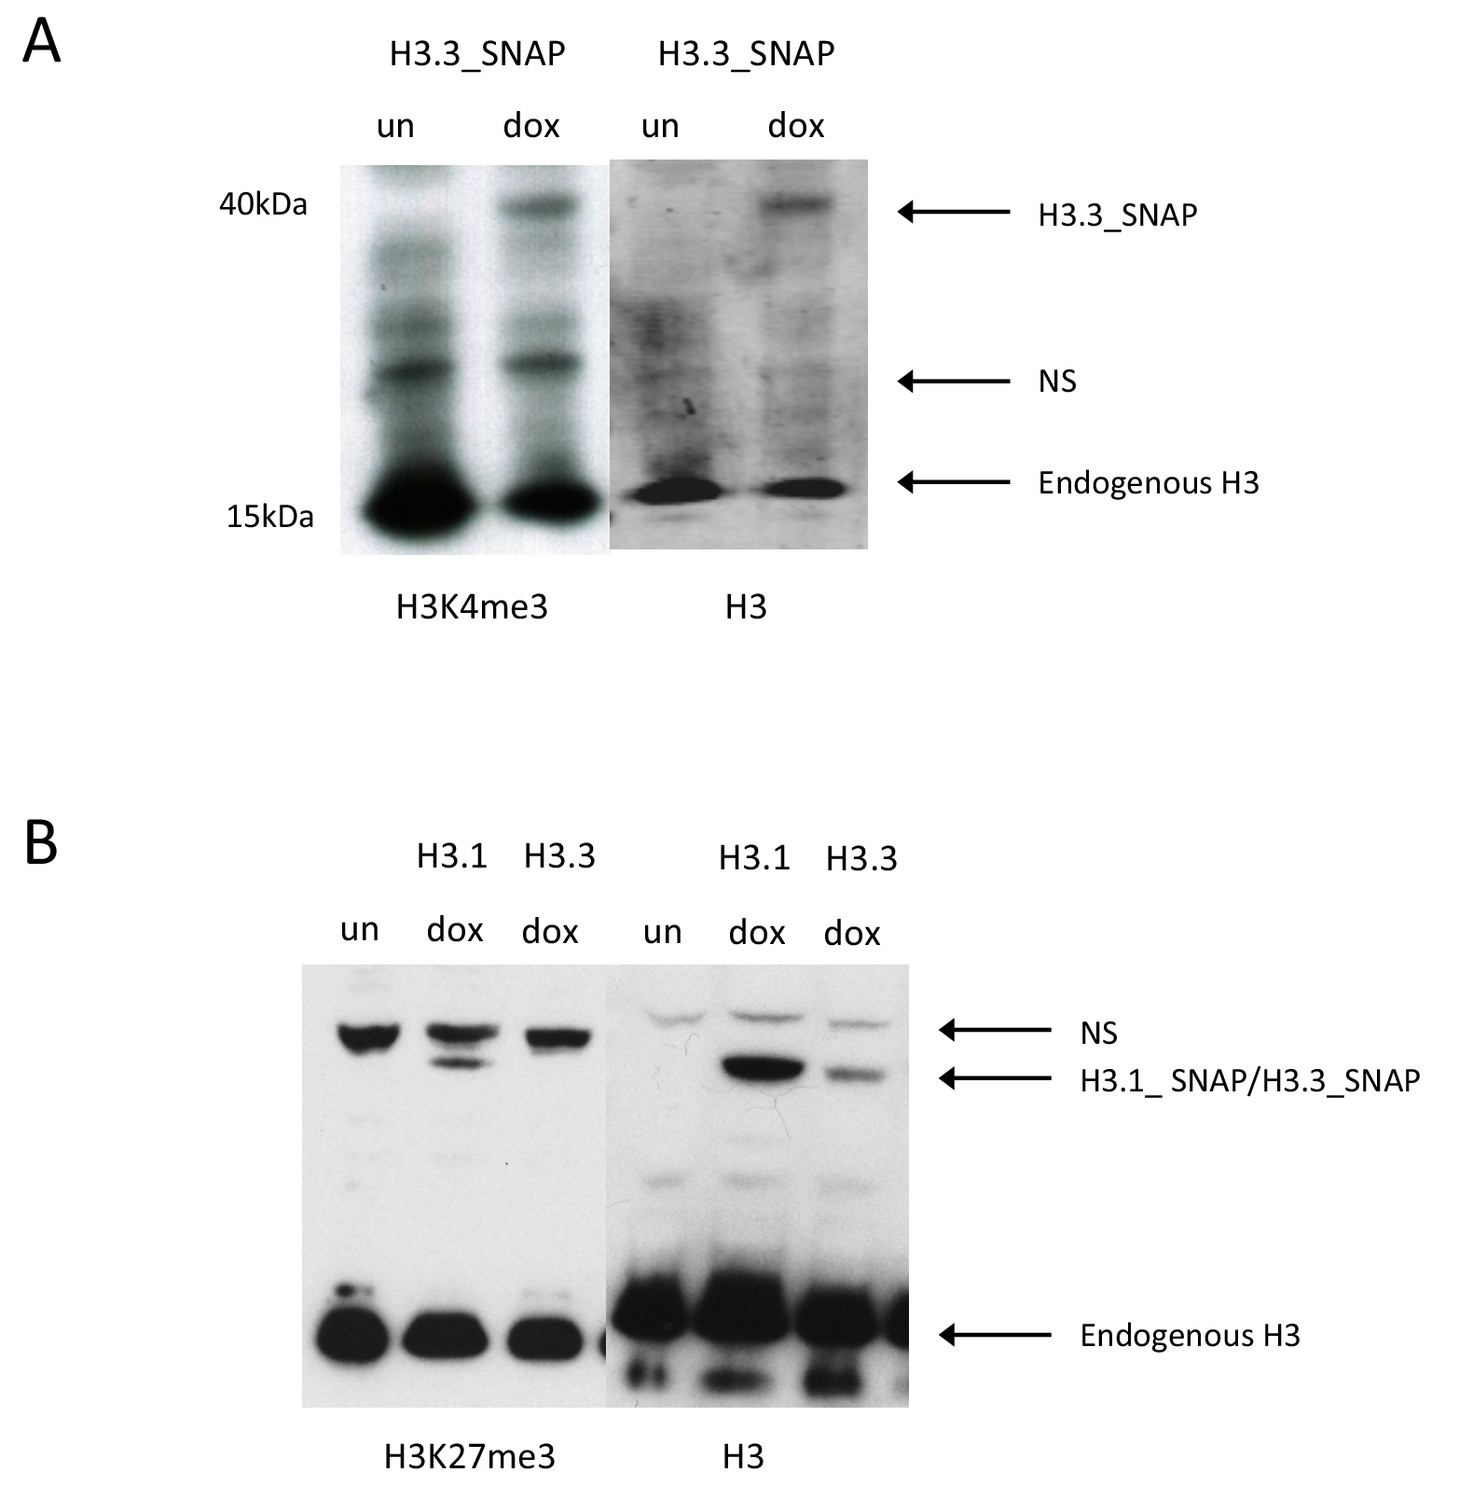
(A) Western blot for H3K4me3 H3.3_SNAP ESCs. Uninduced sample ('un') does not have any H3.3_SNAP, upon dox induction ('dox') H3K4me3 modified H3.3_SNAP is observed. Non-specific bands present in both the uninduced and dox induced samples are marked as 'NS'. Histone H3 serves as a loading control. (B) Western blot for H3K27me3 in H3.1_SNAP and H3.3_SNAP ESCs. Uninduced sample ('un') does not have any H3.1_SNAP or H3.3_SNAP, upon dox induction ('dox') H3K27me3 modified H3.1_SNAP is observed. Non-specific bands present in both the uninduced and dox induced samples are marked as 'NS'. Histone H3 serves as a loading control.
Figure 1—figure supplement 3
Spike-in control.
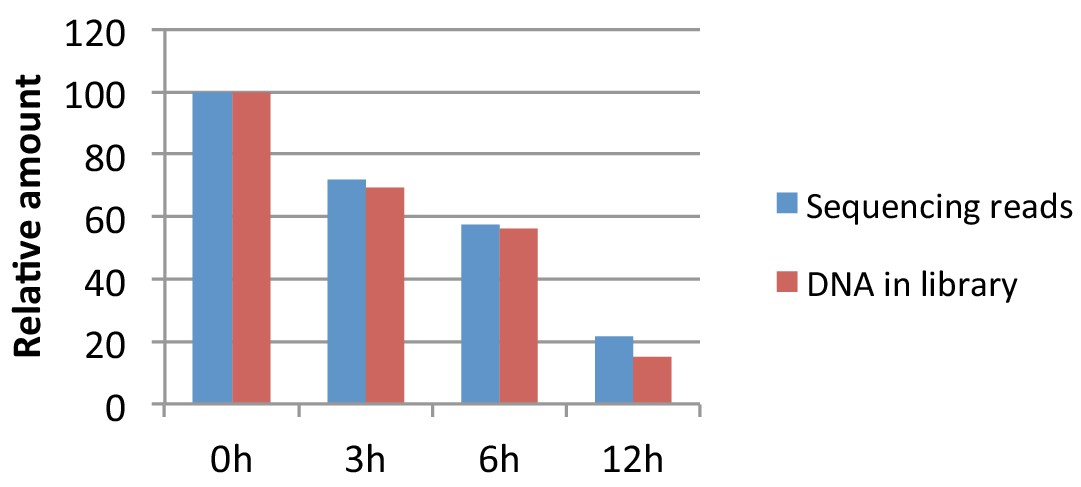
Amount of DNA recovered relative to 0 hr time point (red bars) and proportion of sequencing reads mapping to the mouse genome relative to 0 hr time point based on the number of reads recovered from the spike-in control (blue bars). See 'Materials and methods' for more details.
Figure 2 with 1 supplement
Measuring H3.3 turnover in ESCs.
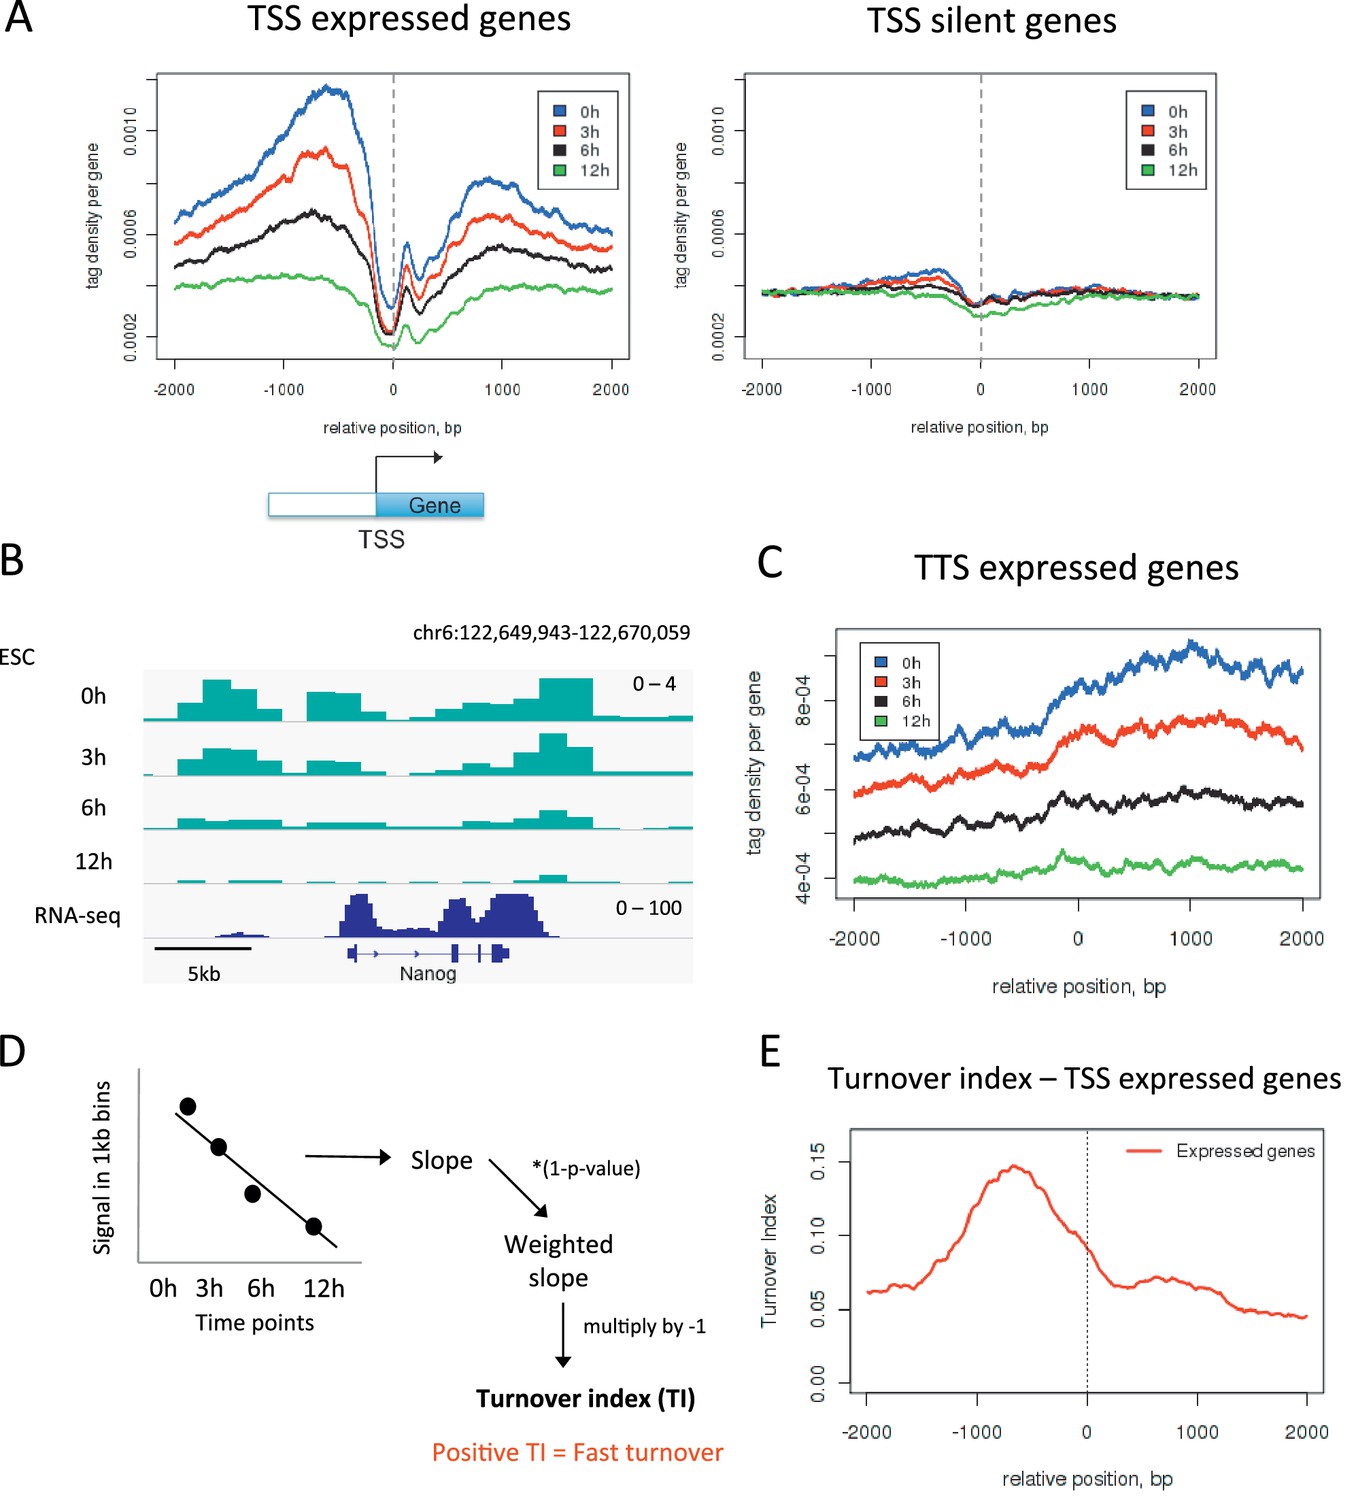
(A) Average H3.3 profiles for 0 hr, 3 hr, 6 hr and 12 hr time points over the transcription start sites (TSSs) of expressed and silent genes in ESCs. (B) H3.3 in 1kb bins profiles for 0 hr, 3 hr, 6 hr and 12 hr time points at the actively transcribed Nanog locus. (C) Average H3.3 profiles over the transcription termination sites (TTSs) of genes expressed in ESCs. (D) Calculating turnover index (TI) in 1 kb bins across the genome. H3.3 signal for each bin was plotted for every time point, these were fitted to a linear regression model and the slope of this line was weighted and multiplied by minus 1 to get TI. (E) Average TI over the TSSs of expressed genes. For (A–C) results from one experiment representative of three biological replicates is shown.
Figure 2—figure supplement 1
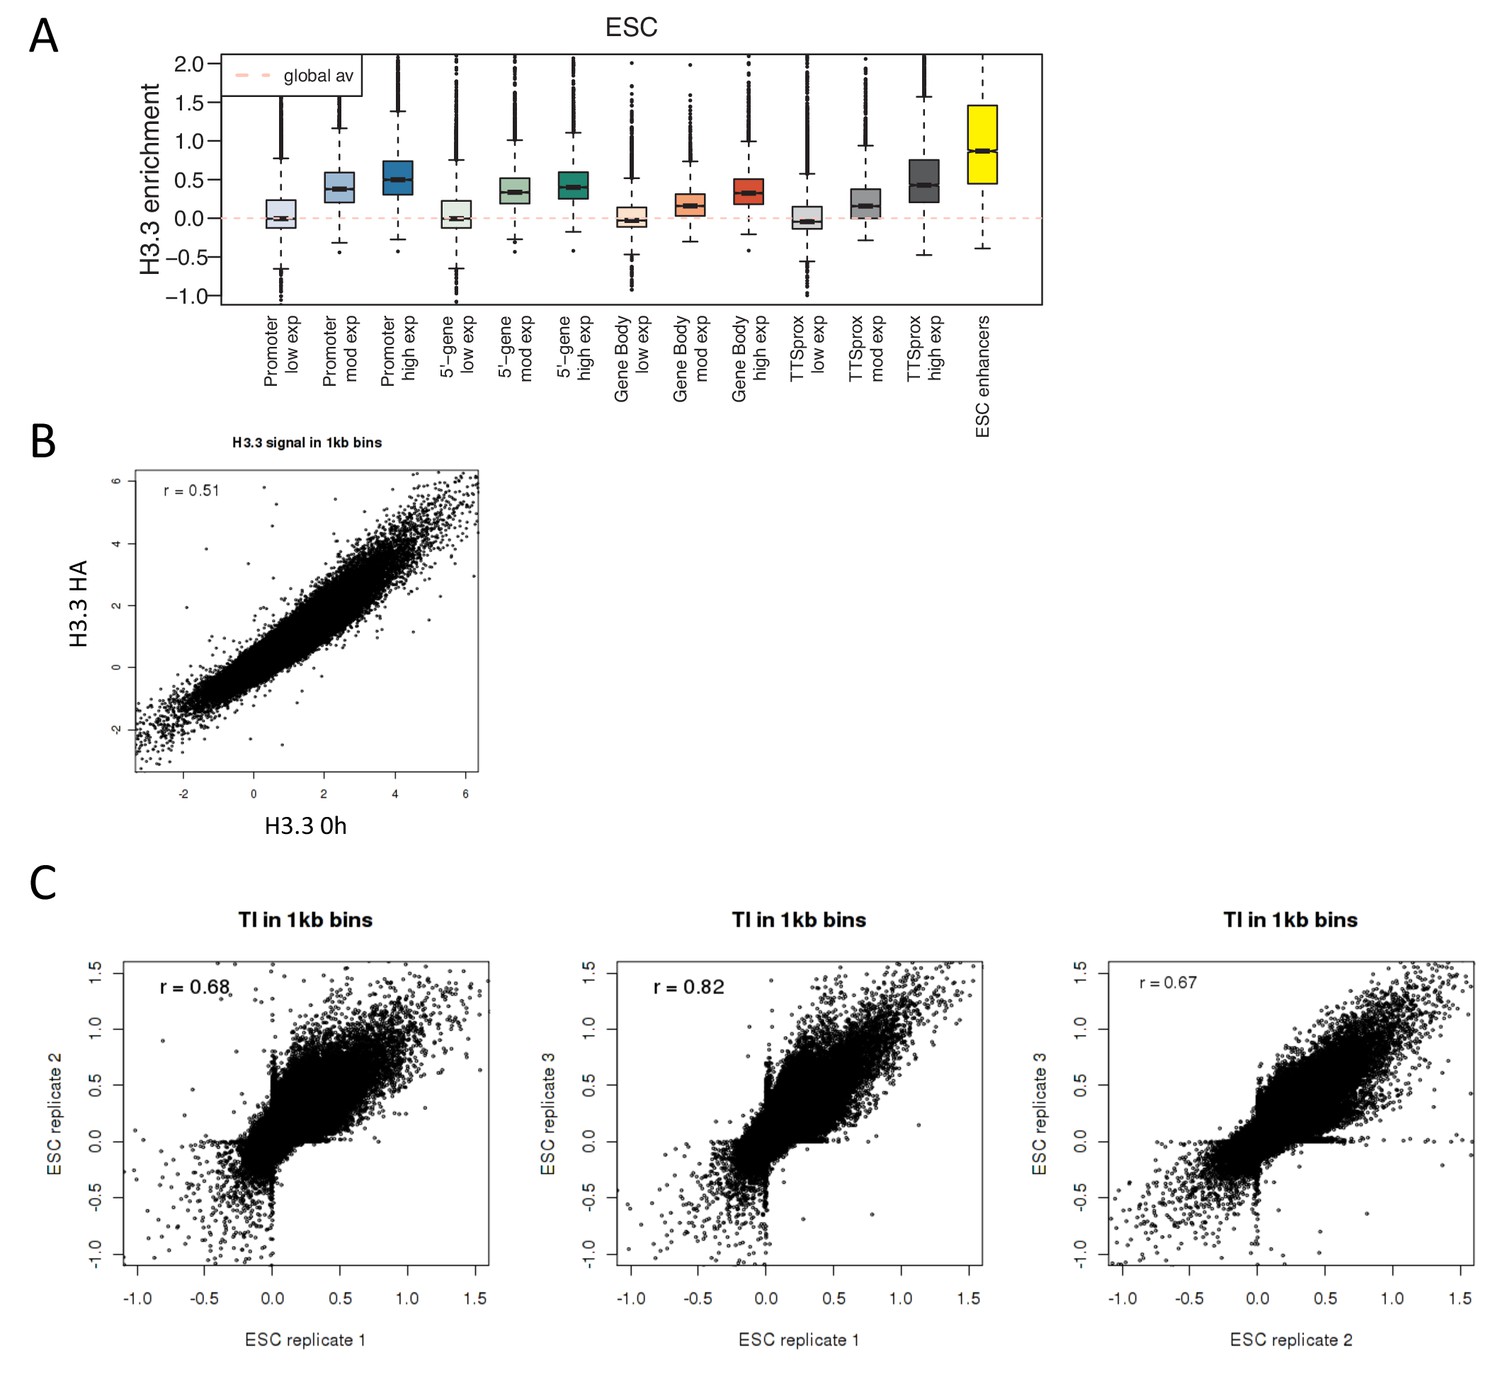
H3.3 enrichment in ESCs and TI correlation between replicates.
(A) H3.3 enrichment in ESCs at annotated genomic elements – promoters, 5’ end of genes, gene bodies, TTSs and enhancers. Genes are grouped by ESC expression level and ESC enhancers are from Whyte et al. (2013). (B) Scatter plot of H3.3 enrichment calculated in 1 kb bins for ESC H3.3_HA ChIP and H3.3 0 hr time-ChIP samples. R value is from Pearson’s correlation. (C) Scatter plots comparing TI calculated for the three ESC time-ChIP replicates. R value is from Pearson’s correlation.
Figure 3 with 2 supplements
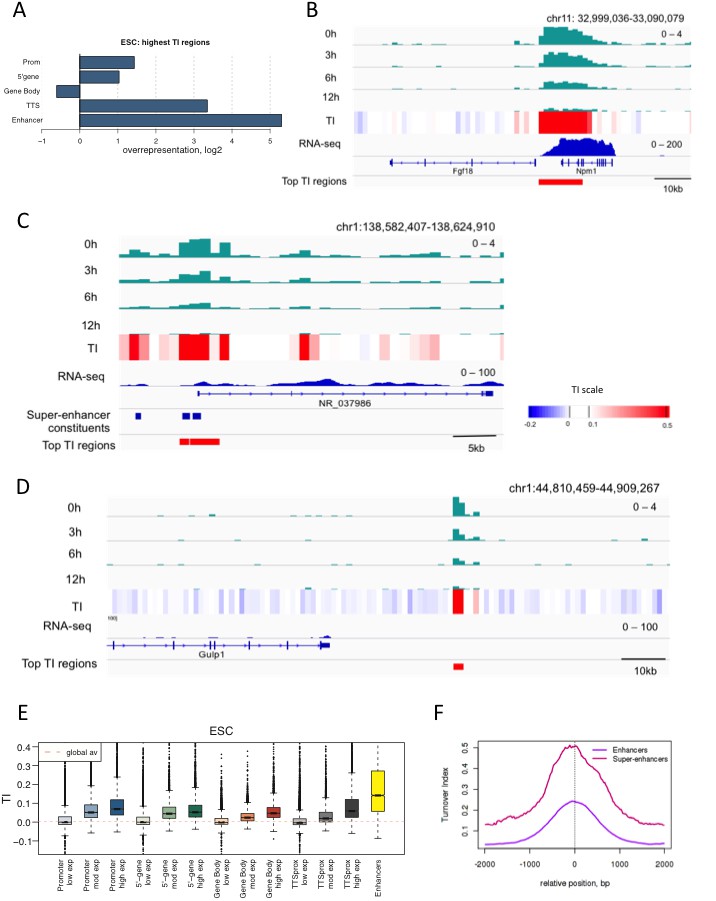
Regions with high TI in ESCs have regulatory functions.
(A) Representation of annotated genomic features in the 1000 highest TI regions in ESCs relative to their representation in the genome as a whole. Overrepresentation was calculated by taking the log2 ratio of the proportion of the high TI regions overlapping a particular feature divided by the proportion of whole genome overlapping the same feature. (B) The region 5’ of the Fgf18 gene and 3’ of the neighboring Npm1 gene has high TI in ESCs. Signal for each time point is shown for one replicate (top 4 tracks – green) while TI averaged for 3 replicates is shown (heatmap). RNA-seq in ESCs is shown in blue while the highest TI regions are marked with red bars. (C) Super-enhancers in the NR_037986 locus are amongst the most highly turned over regions in ESCs. Super-enhancer constituents are as defined by (Whyte et al., 2013) and shown as blue bars. (D) Unannotated regions are also present in the set of highest TI regions. The red bar marks a high TI region downstream of the Gulp1 gene on chr1. (E) ESC TI distribution at annotated genomic elements – promoters, 5’ end of genes, gene bodies, TTSs and enhancers. Genes are grouped by ESC expression level and ESC enhancers are from Whyte et al. (2013). (F) Average TI over conventional ESC enhancers (purple) and super-enhancer constituent enhancers (pink) as described in Whyte et al. (2013).
Figure 3—figure supplement 1

H3.3 turnover at enhancers and super-enhancers calculated using a 300 bp bin size.
Average H3.3 TI over conventional ESC enhancers ('Enhancers' – purple) and super-enhancer constituent enhancers ('Super-enhancers' – pink) where TI was calculated using a 300 bp bin size. The mean TI for three biological replicates is shown. Enhancers and super-enhancers are as described in Whyte et al. (2013).
Figure 3—figure supplement 2
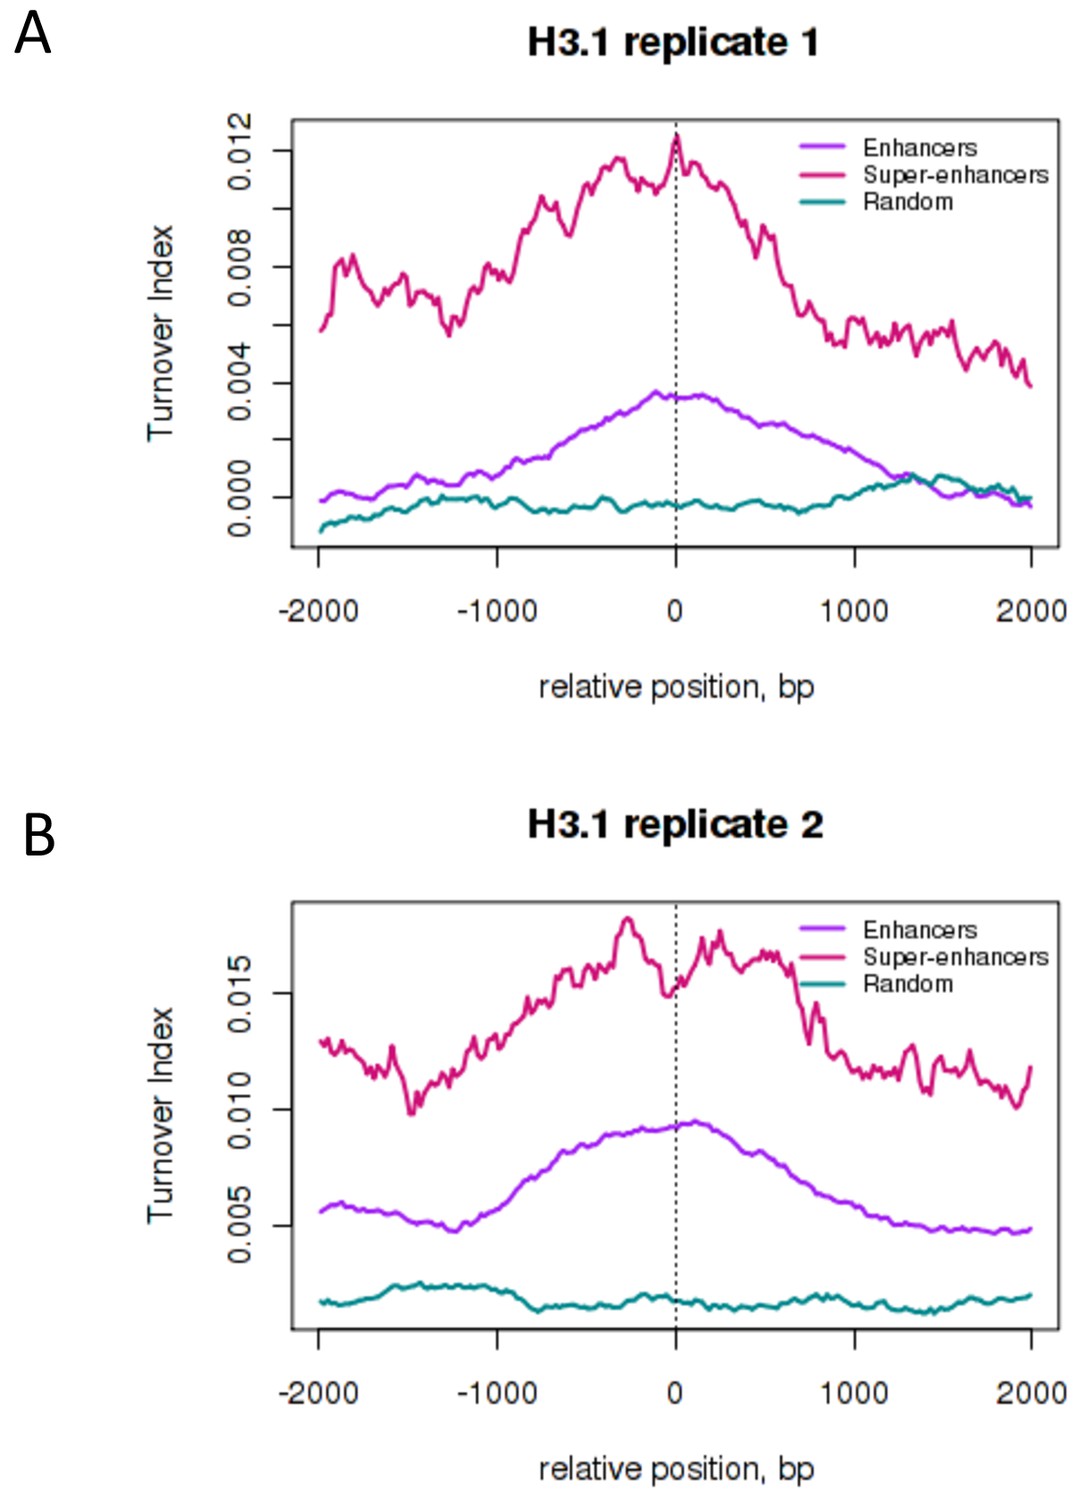
H3.1 turnover at ESC enhancers and super-enhancers.
Average H3.1 TI over conventional ESC enhancers ('Enhancers' – purple), super-enhancer constituent enhancers ('Super-enhancers' – pink) and random genomic regions with a similar size distribution to enhancers ('Random' – teal). Enhancers and super-enhancers are as described in Whyte et al. 2013). (A) H3.1 biological replicate 1 (B) H3.1 biological replicate 2
Figure 4 with 1 supplement

H3.3 turnover at PcG targets in ESCs.
(A) TI averaged over PcG-bound genomic regions (turquoise) and all CpG islands (red). (B) TI averaged over the TSSs of active genes (red), PcG targets (turquoise) and silent genes (blue) in ESCs. (C) The PcG-regulated Hoxb locus shows enrichment for H3.3 (top 4 tracks show H3.3 at each time point) but low TI (heatmap). The grey tracks show ChIP-seq for PcG protein Ring1b and the blue tracks RNA-seq. (D) The non-PcG-bound active gene Hnrnpa3 shows greater H3.3 enrichment and higher TI than Hoxb. TI scale is the same as in Figure 3.
Figure 4—figure supplement 1
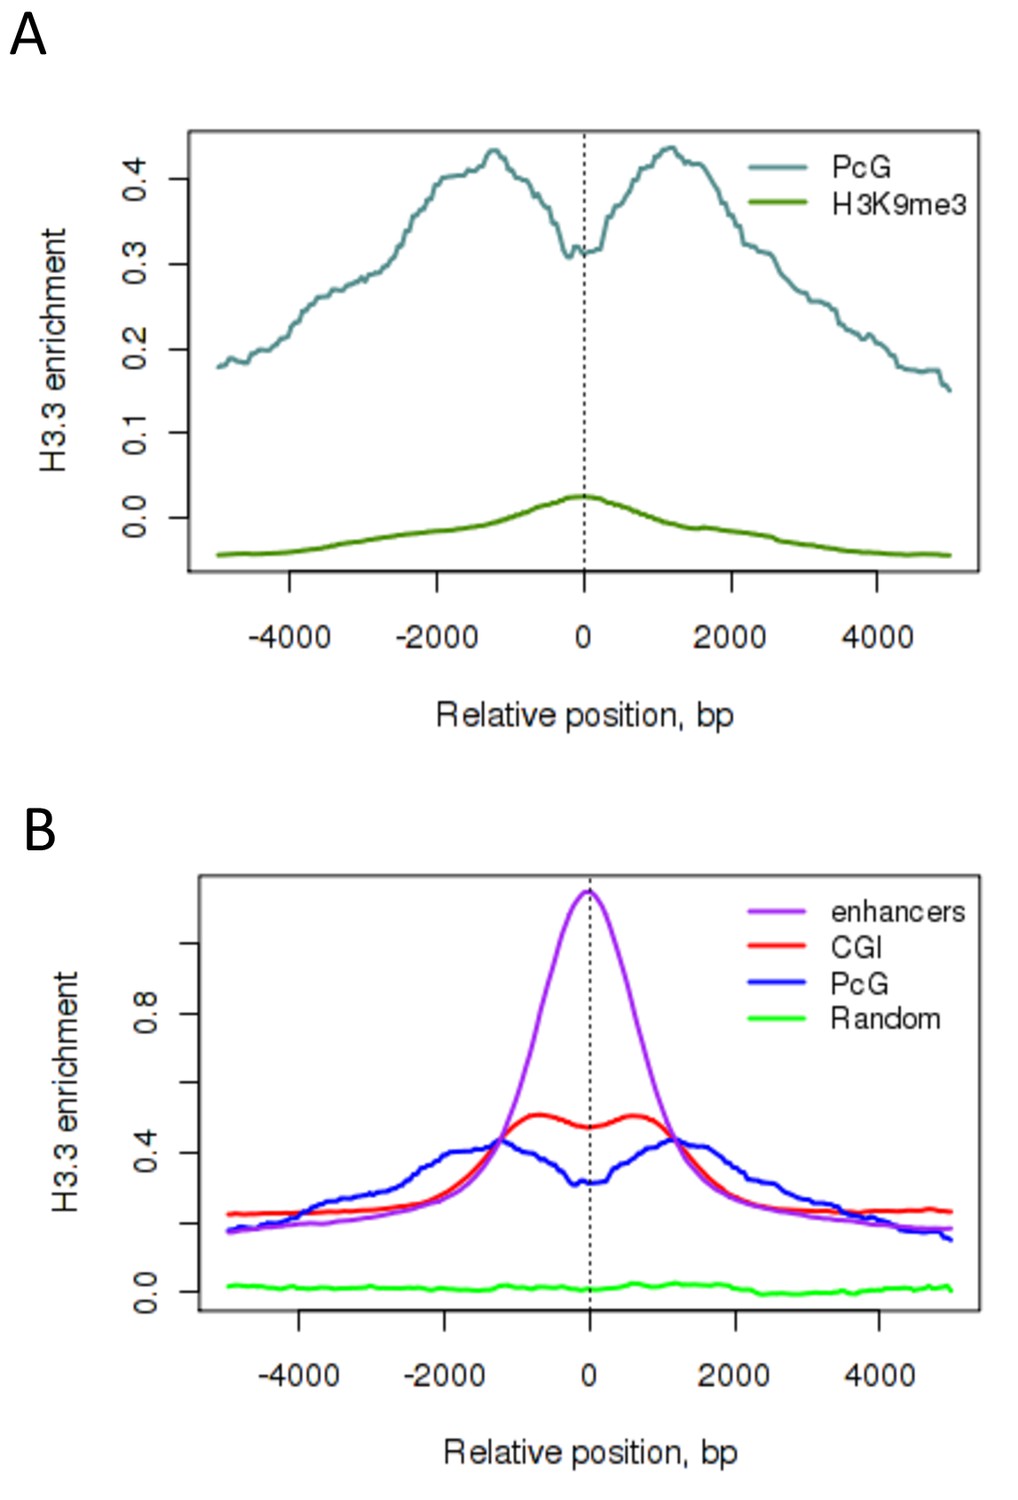
H3.3 enrichment at PcG targets in ESCs.
(A) H3.3 enrichment in ESCs at PcG targets (grey) compared to H3K9me3 regions (green). (B) H3.3 enrichment in ESCs at PcG targets (blue), CpG islands (CGI – red), enhancers (purple) and randomized PcG regions (green).
Figure 5 with 2 supplements
H3.3 turnover and distribution changes during neural differentiation of ESCs.
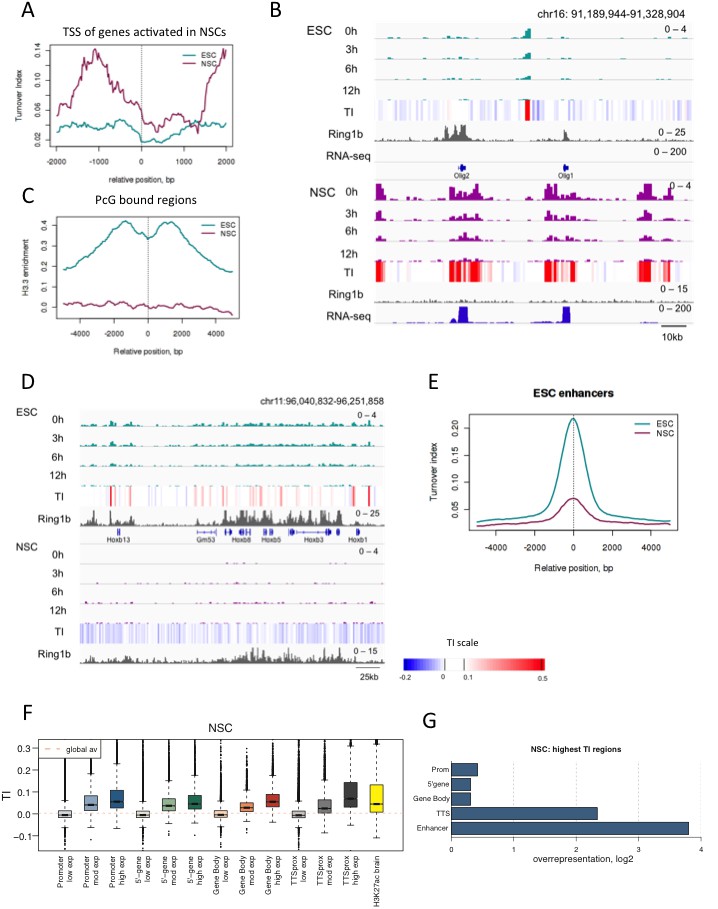
(A) Average TI profile around TSSs of genes that lose PcG binding and increase gene expression upon differentiation to NSCs. (B) The region containing the Olig1 and Olig2 genes, which are activated during neural differentiation, shows a dramatic increase in H3.3 turnover when ESCs are differentiated to NSCs. The top tracks represent H3.3 (green) and TI (heatmap) in ESCs while the bottom tracks show H3.3 (purple) and TI in NSCs. The grey tracks show ChIP-seq for PcG protein Ring1b and the blue tracks RNA-seq. (C) Average H3.3 enrichment (0 hr sample) over PcG-bound regions in ESCs and NSCs. (D) Hoxb remains bound by PcG (Ring1b) in NSCs but H3.3 enrichment is lost. (E) Average TI at ESC-specific enhancers in ESCs (cyan) and NSCs (purple). (F) NSC TI distribution at annotated genomic elements – promoters, 5’ end of genes, gene bodies, TTSs and enhancers. Genes are grouped by NSC expression level and putative NS enhancers were defined using H3K27ac ChIP-seq data from Encode (E14.5 embryonic brain - ENCFF001XZR). (G) Representation of annotated genomic features in the 1000 highest TI regions in NSCs relative to their representation in the genome as a whole.
Figure 5—figure supplement 1

Generation of H3.3_SNAP NSCs.
(A) Screening for chimeric NSC lines expressing H3.3_SNAP based on puromycin resistance. Red bars indicate cell lines that scored as highly chimeric. NSC line '3_1' was used for time-ChIP studies. (B) RT-qPCR showing expression of NSC markers (Sox1, Sox2, Olig2 and Slc1a3) but not the pluripotency marker Oct4 in H3.3_SNAP NSCs. RT-qPCR in ESCs is shown for comparision. Expression is relative to the housekeeping gene Eef1A1. (C) Immunofluorescence for NSC markers Sox2 (red) and Nestin (green) in H3.3_SNAP NSCs.
Figure 5—figure supplement 2

Measuring turnover in H3.3_SNAP NSCs.
(A) Western blot showing expression of H3.3_SNAP upon dox induction in ESCs compared to NSCs. For dox induced samples ('dox'), increasing amounts of protein were loaded, for uninduced samples ('un') only the highest protein concentration was loaded. H3.3_SNAP is detected using an anti-HA antibody while endogenous H3 and TBP serve as loading controls. (B) H3.3 enrichment at ESC enhancers is reduced in NSCs (purple) compared to ESCs (cyan).
Figure 6
Changes in TI occurring during neural differentiation often occur at enhancers.
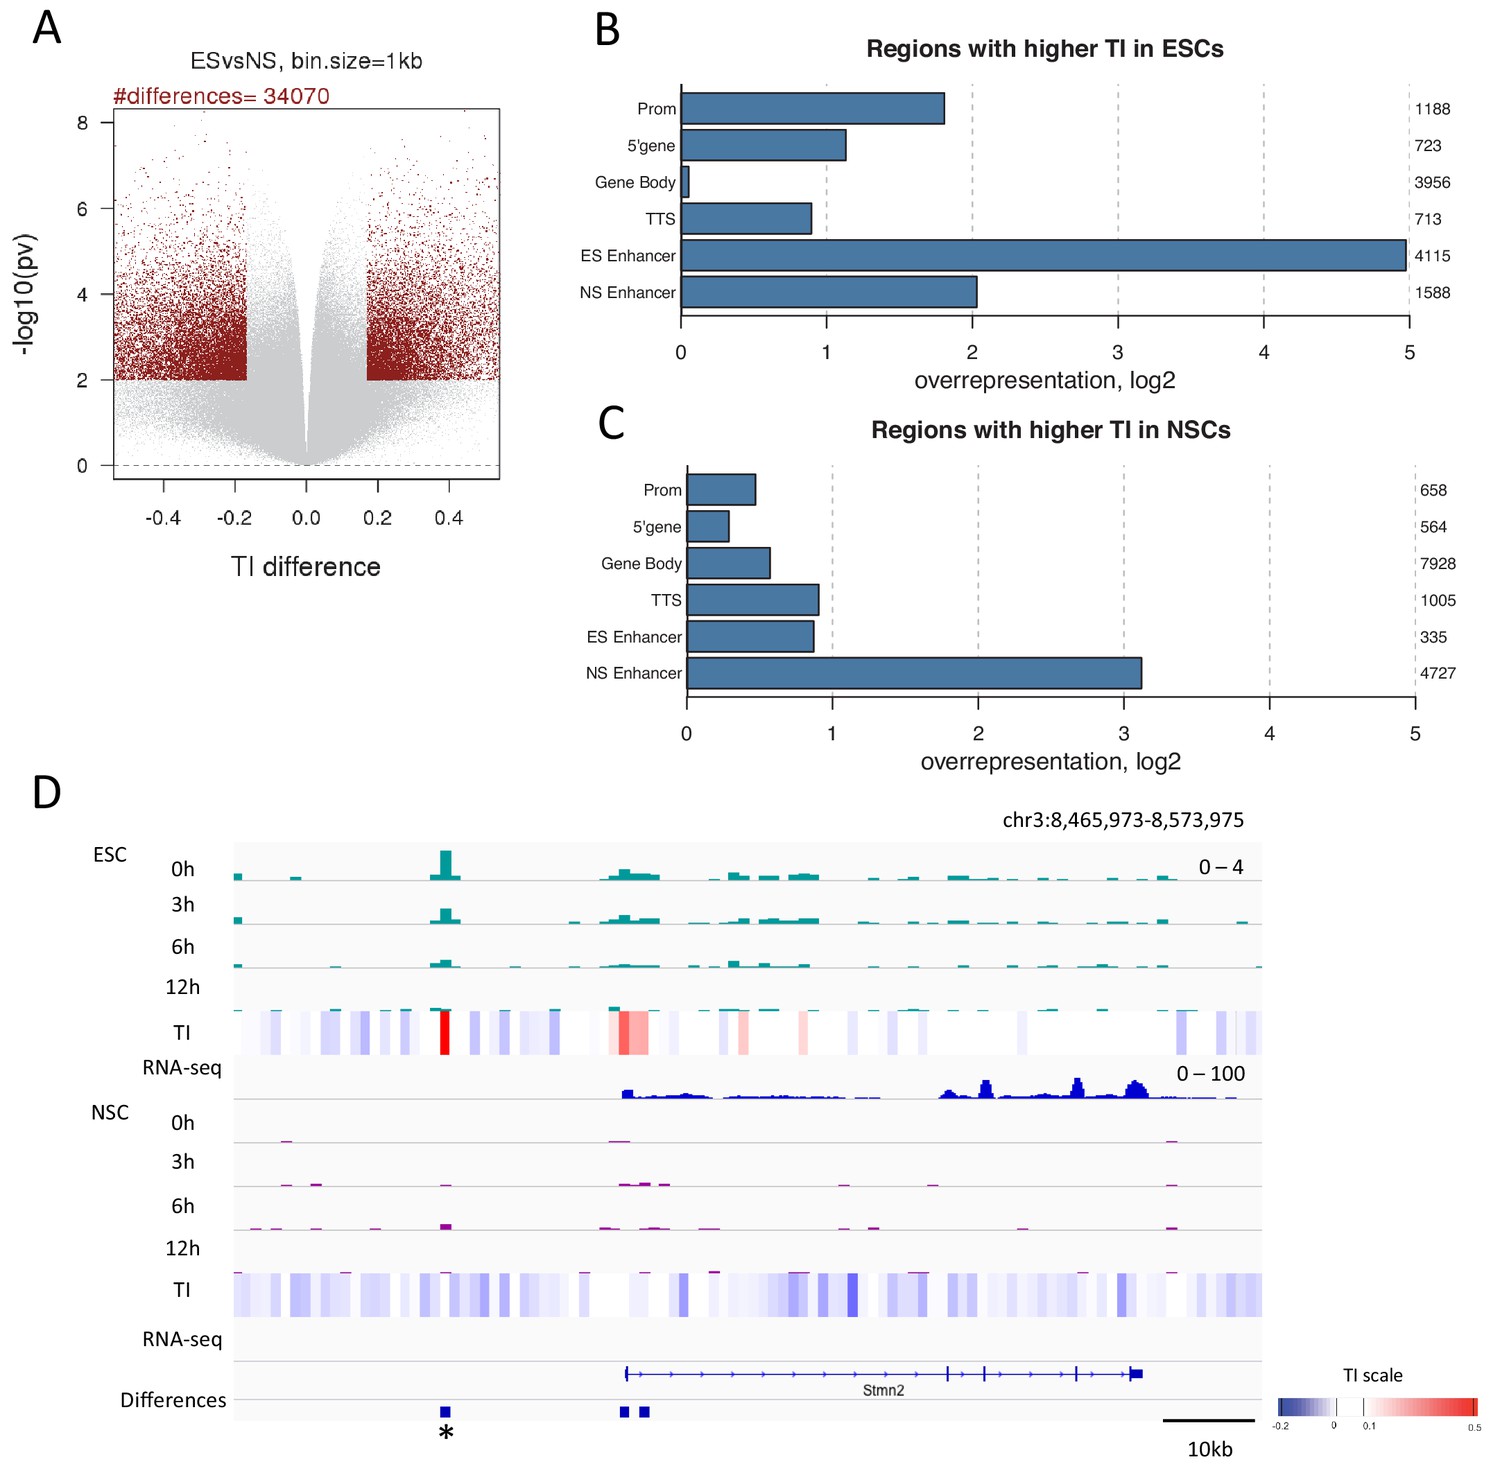
(A) Volcano plot showing differences in TI between ESCs and NSCs. Regions with a TI difference in the top 2.5% with a p-value≤0.01 were selected as changing during differentiation (red dots). (B) Representation of annotated genomic features in regions showing higher TI in ESCs compared to NSCs (selected as described in A). The numbers to the right of the plot indicate the number of regions corresponding to each type of genomic feature. (C) Representation of annotated genomic features in regions showing higher TI in NSCs compared to ESCs (selected as described in A). (D) An unnanotated region on chromosome 3, which shows an increase in H3.3 and TI upon differentiation of ESCs to NSCs (asterisk) and an expression decrease in the nearby Stmn2 gene. The heatmap shows average TI while differences in TI are represented by blue bars.
Figure 7 with 2 supplements
H3.3 turnover correlates with DNA accessibility at enhancers.
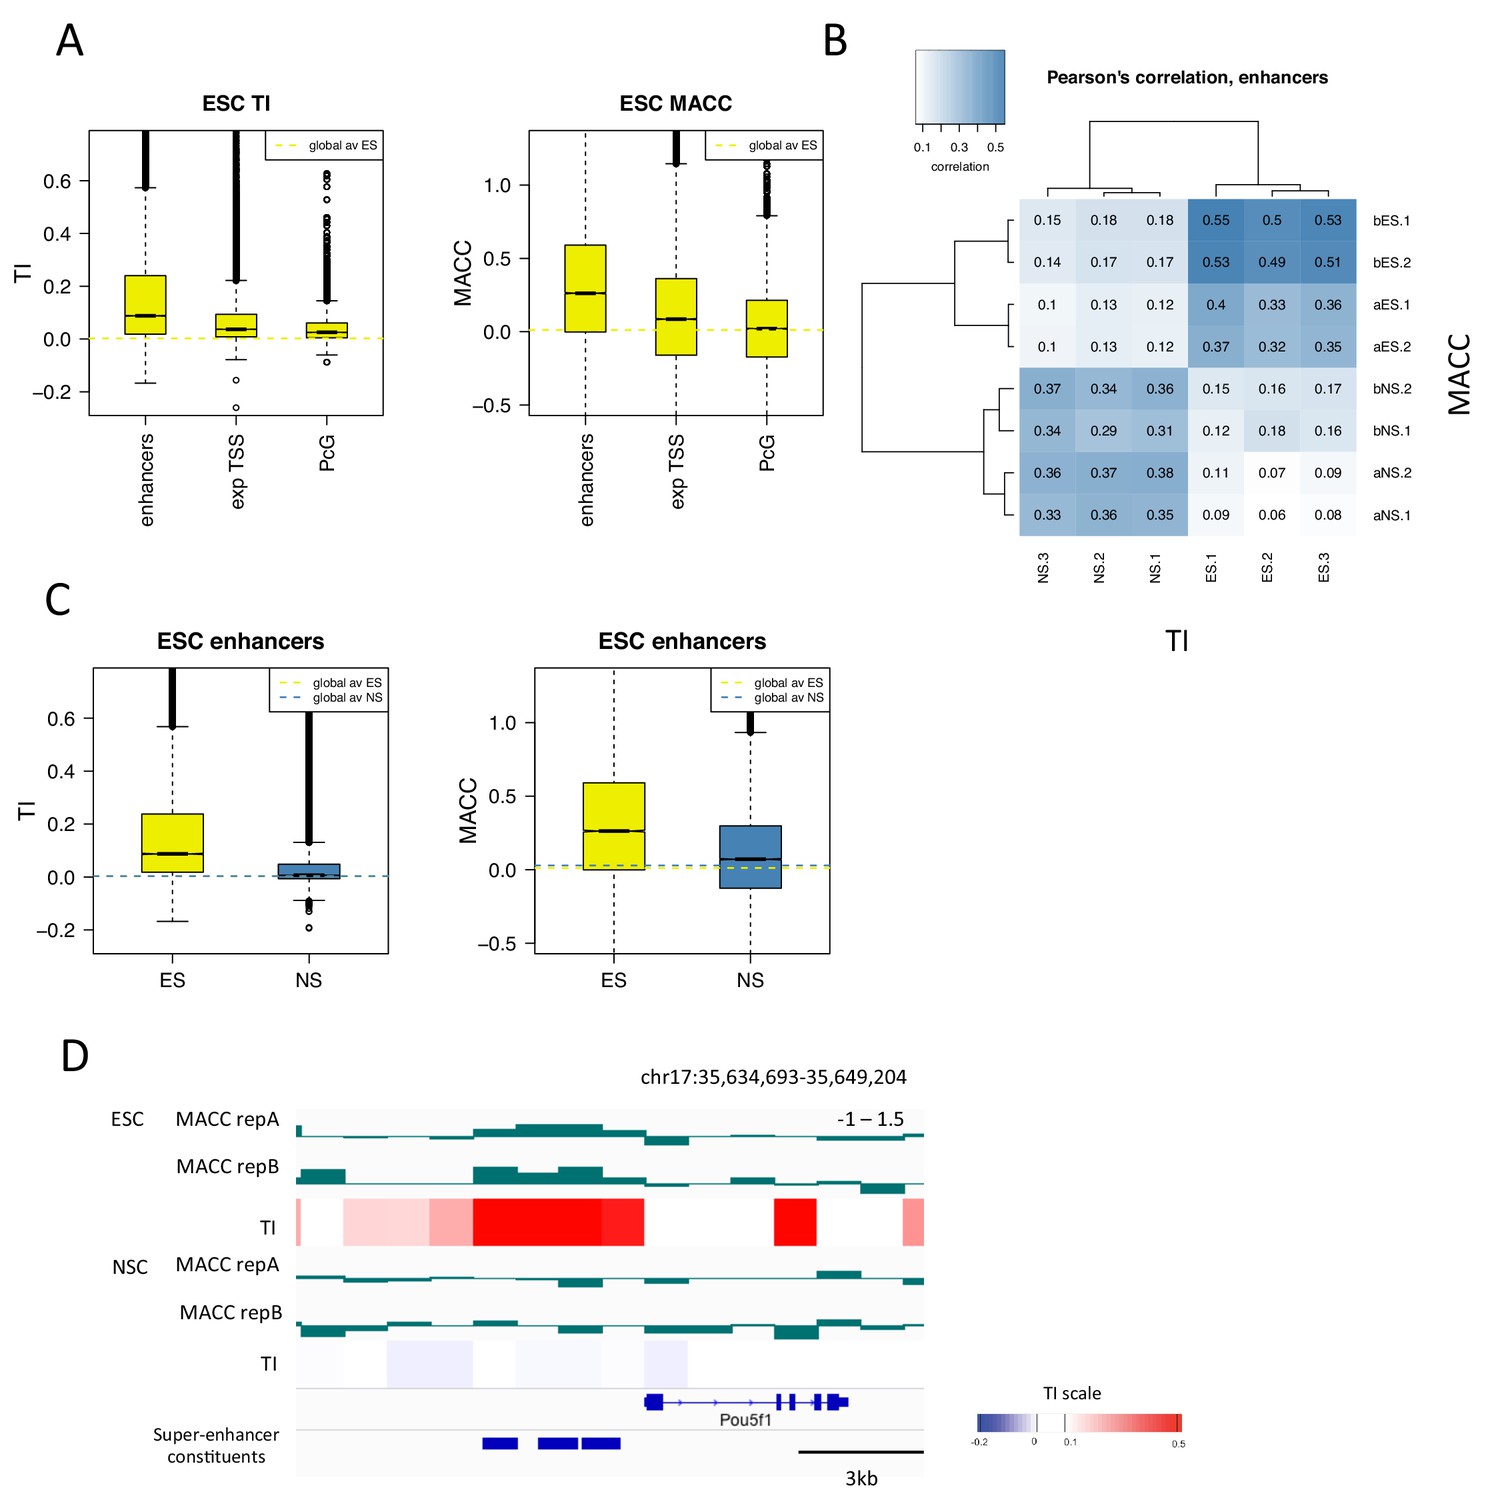
(A) Boxplot of average ESC TI and MACC at ESC enhancers, the TSSs of expressed genes, and PcG-bound regions. (B) Pearson’s correlation between DNA accessibility as measured by MNase titration (MACC) and TI at ESC enhancers. For MACC four replicates are shown for each cell type, two for ESC_ and NSC_H3.3_SNAP lines ('a' replicates) and two for separate ESC and NSC lines ('b' replicates). For TI three biological replicates are shown. (C) Boxplot of average TI and MACC values at ESC enhancers. (D) The Oct4/Pou5f1 super-enhancer shows high MACC (green) and TI (heatmap) in ESCs but not in NSCs.
Figure 7—figure supplement 1
Measuring DNA accessibility using MNase titration.
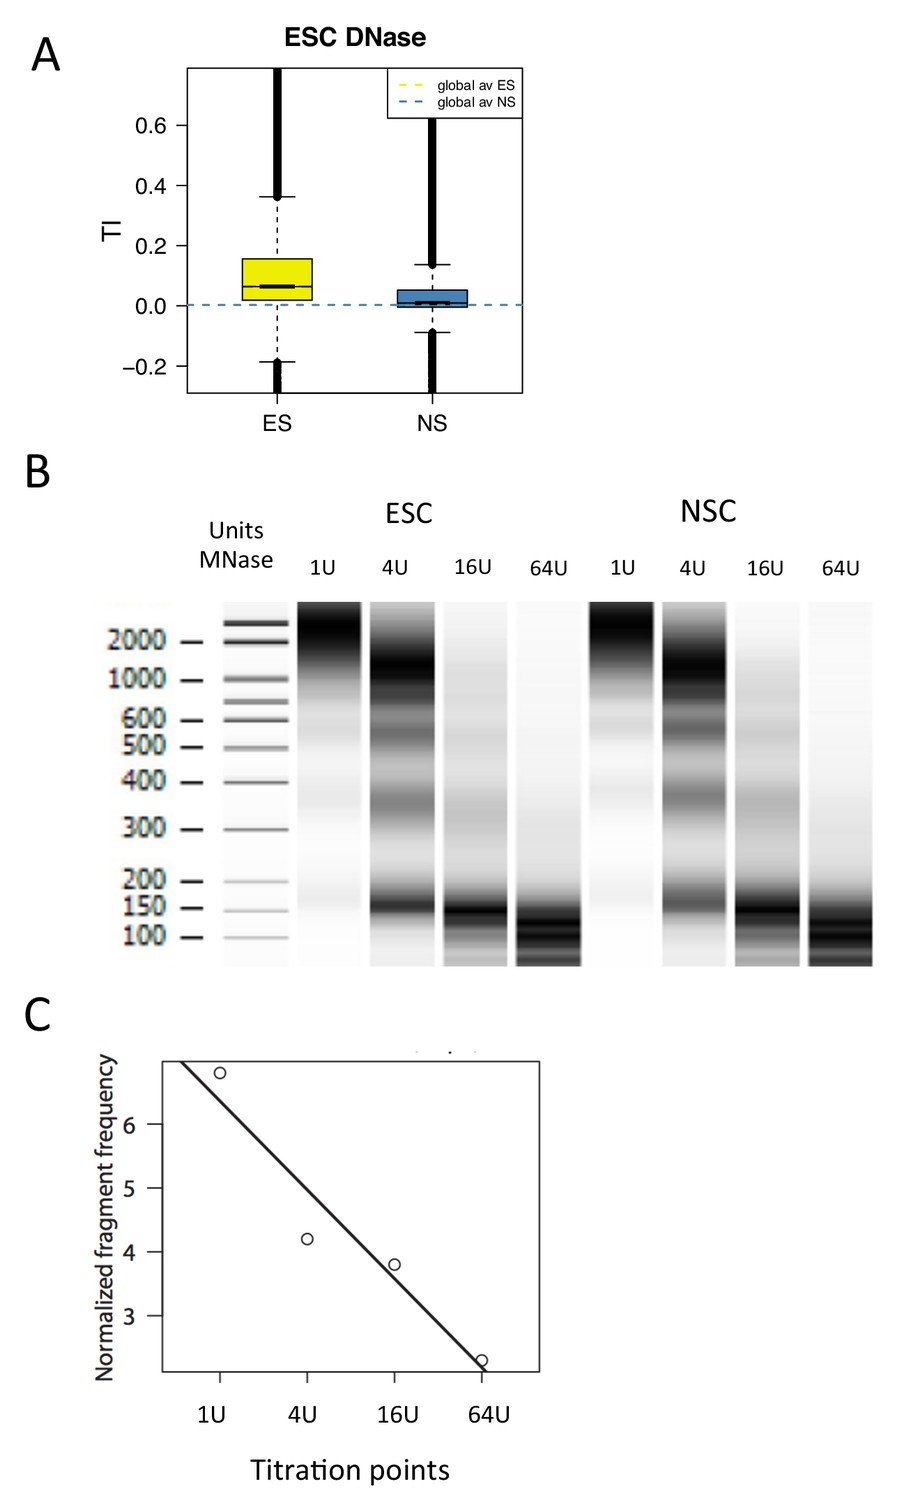
(A) Boxplot of average TI over DNase hypersensitive regions in E14 ESCs (Encode accession ENCSR000CMW). TI index was plotted over called DNase peaks (E14-DS18505.peaks.fdr0.01). (B) MNase digestion patterns generated by digestion of ESC and NSC chromatin with varying concentrations of enzyme (1U, 4U, 16U, 64U). (C) Sequencing data from each of the above titration points was used to generate an accessibility score (MACC) by fitting these to a linear model.
Figure 7—figure supplement 2
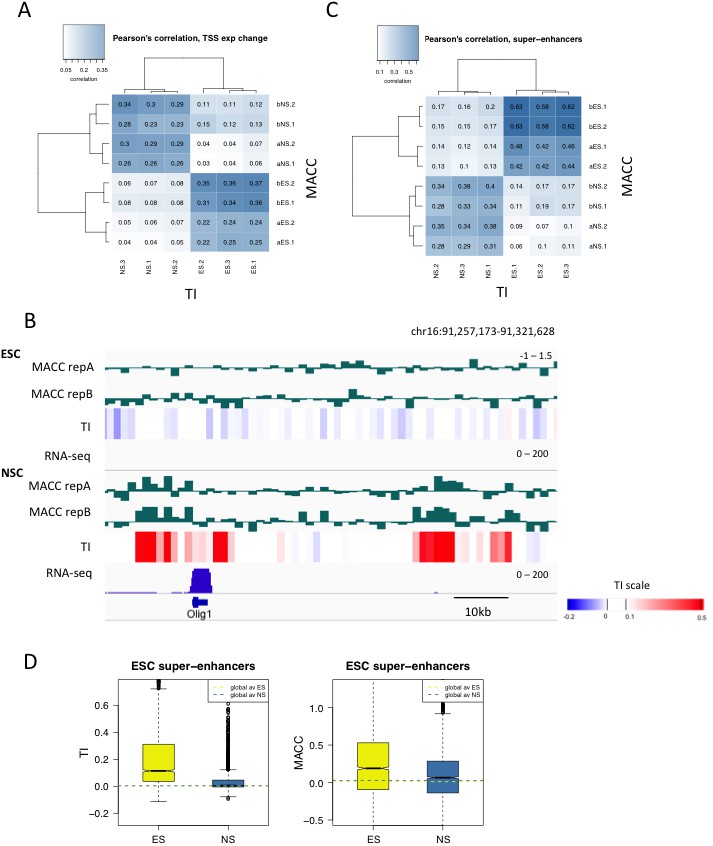
Comparing turnover to DNA accessibility measured by MNase titration.
(A) Pearson’s correlation between DNA accessibility as measured by MNase titration (MACC) and TI at the TSSs of genes differentially expressed in ESCs and NSCs. For MACC four replicates are shown for each cell type, two for ESC_ and NSC_H3.3_SNAP lines ('a' replicates) and two for separate ESC and NSC lines ('b' replicates). Three biological replicates are shown for TI. (B) Olig1 is activated during neural differentiation and shows high MACC (green) and TI (heatmap) in NSCs but not ESCs. RNA-seq is shown in blue. (C) Pearson’s correlation between DNA accessibility as measured by MNase titration (MACC) and TI at ESC super-enhancers. Details as described in C. (D) Boxplot of average TI and MACC values at ESC super-enhancers.
Additional files
-
Supplementary file 1
Top 1000 regions with highest turnover in ESCs.
- https://doi.org/10.7554/eLife.15316.021
-
Supplementary file 2
Top 1000 regions with highest turnover in NSCs.
- https://doi.org/10.7554/eLife.15316.022
-
Supplementary file 3
Differences in turnover between ESCs and NSCs.
- https://doi.org/10.7554/eLife.15316.023
-
Supplementary file 4
External datasets used.
- https://doi.org/10.7554/eLife.15316.024
-
Supplementary file 5
Spike-in controls.
- https://doi.org/10.7554/eLife.15316.025
-
Supplementary file 6
Primer sequences.
- https://doi.org/10.7554/eLife.15316.026
Download links
A two-part list of links to download the article, or parts of the article, in various formats.
Downloads (link to download the article as PDF)
Open citations (links to open the citations from this article in various online reference manager services)
Cite this article (links to download the citations from this article in formats compatible with various reference manager tools)
Enhancer regions show high histone H3.3 turnover that changes during differentiation
eLife 5:e15316.
https://doi.org/10.7554/eLife.15316


