Tagging motor memories with transcranial direct current stimulation allows later artificially-controlled retrieval
- The University of Tokyo, Japan
- University of Western Ontario, Canada
- Osaka University, Japan
- Kochi University of Technology, Japan
- National Institute of Information and Communications Technology, and Osaka University, Japan
- Université catholique de Louvain, Belgium
- KU Leuven, Belgium
Figures
Figure 1

Experimental procedure.
(a) Participants performed a reaching movement toward a target located 10 cm ahead of the starting position. Participants were trained with a rightward or leftward velocity-dependent force field while receiving anodal or cathodal tDCS to the left M1, respectively. (b) During the test period, the error-clamp trials were used to evaluate how tDCS polarity affected the force output exerted against the force channel. (c) During the training period, anodal (2 mA) or cathodal tDCS (−2 mA) was applied for 2 min, and the transition time between the two was 12 s. When receiving anodal or cathodal tDCS, participants performed 20 reaching movements, and the first and last trials were error-clamp trials. The remaining 18 trials were force field (i.e., training) trials. During the tDCS transition time, 2 error-clamp trials were used to avoid unnecessary motor learning. (d) During the test period, the tDCS pattern was the same as patterns during the training period. However, error-clamp trials were used throughout the entire period. (e,f) In the control groups, sham tDCS was applied during training (e) and the test period (f). In the sham tDCS condition, only the beginning tDCS portion was present. (g) Experimental protocol. After 20 baseline trials, training blocks shown in (c) were repeated 6 times (i.e., total of 12 blocks), and the test blocks shown in (d) were repeated twice (i.e., total of 4 blocks). There was a 3-minute rest period after 8 training blocks were completed. During the test period, the T-TCACA group experienced cathodal tDCS first. (h,i) In the S-T and T-S groups, the training blocks shown in (e), and the test blocks shown in (f) were used, respectively.
Figure 2 with 2 supplements
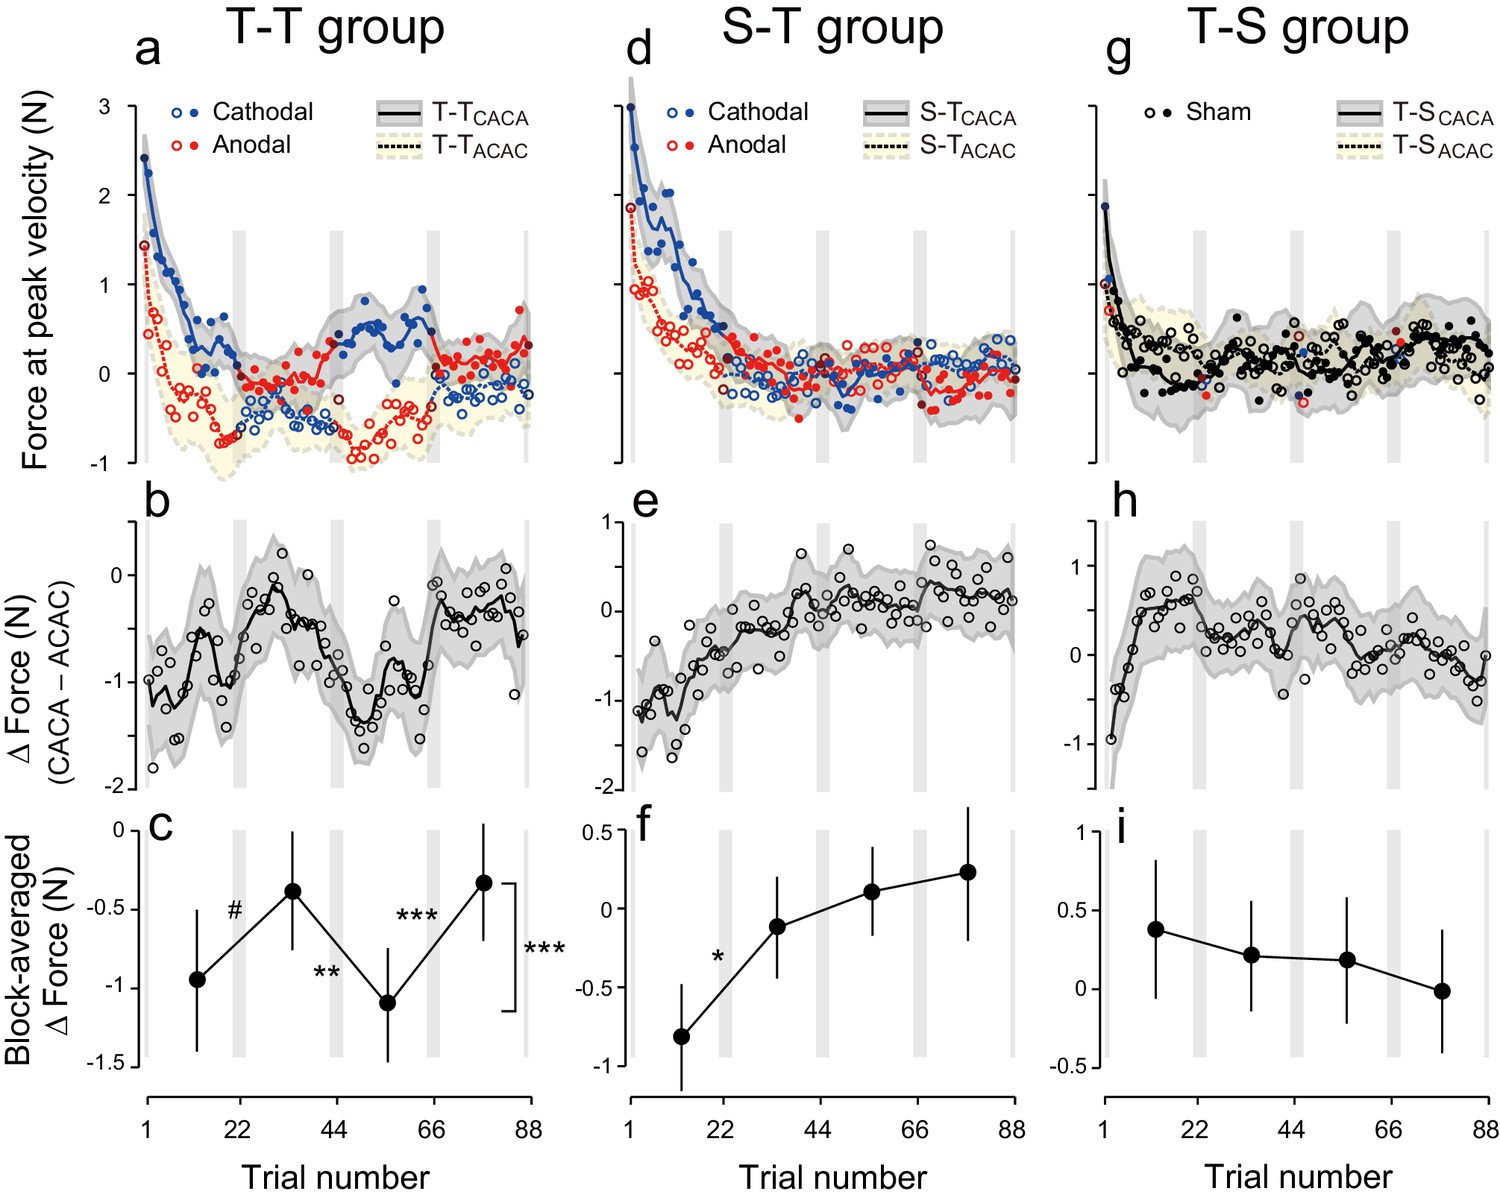
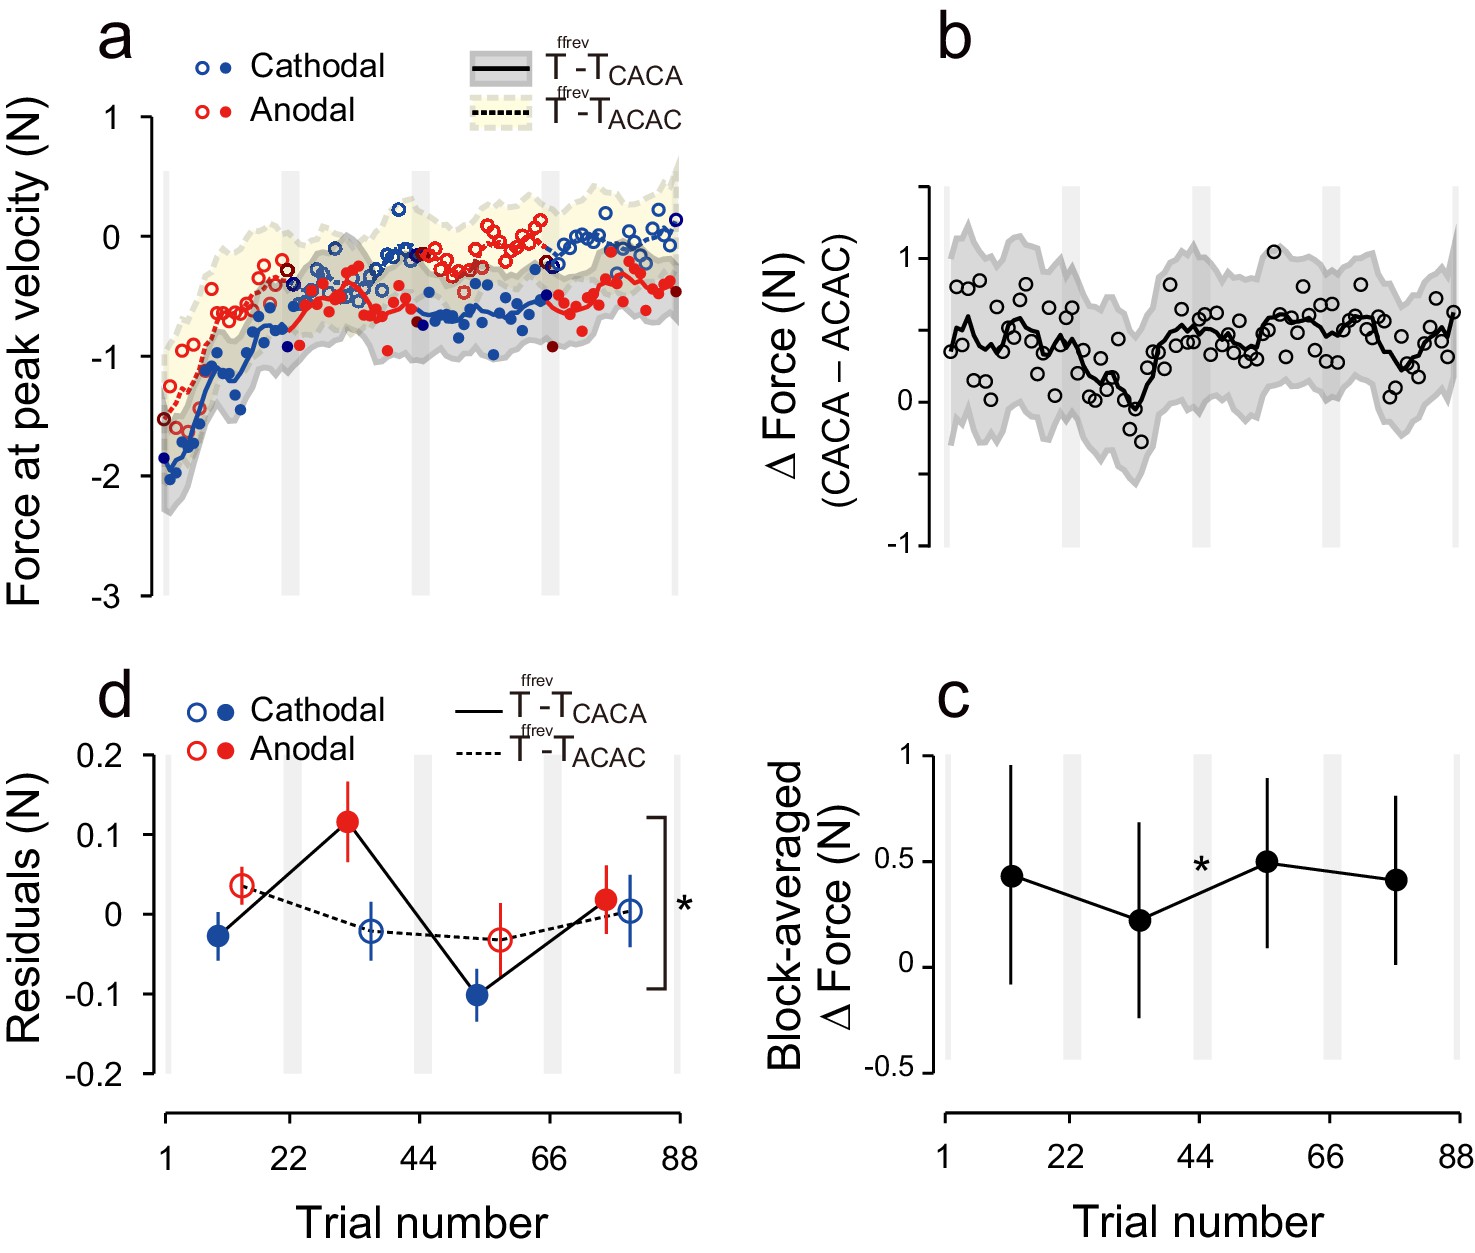
Experimental results during the test period.
(a) Motor memory evaluated as the force output using the error-clamp trials for the T-TACAC (open circle) and T-TCACA subgroups (filled circle) during the test period. The positive force indicates rightward force output. Circle color represents tDCS polarity (red and blue for anodal and cathodal tDCS, respectively). The solid and dashed lines are the moving average (5 data points), and the shaded areas indicate standard errors. Gray vertical bars indicate the period during which tDCS polarity changed. Note that the T-TACAC and T-TCACA subgroups received anodal and cathodal tDCS, respectively, in the first block. (b) ΔForce was calculated as the difference between the T-TACAC and T-TCACA subgroups in order to reduce the effect of exponential motor memory decay. The bold, solid line and shaded grey area indicates the mean and standard deviation of the bootstrapped samples, respectively (moving average calculated over 5 data points). (c) ΔForce averaged over each block. The mean and standard deviation were obtained from bootstrapped samples. A permutation test was used to test the effect of block order (***p<0.0001 as indicated at the right side). A permutation test was also used to compare the values between the first and second, second and third, and the third and fourth blocks. #p<0.07; **p<0.01; ***p<0.005. (d–i) Results for the S-T group (d–f) and T-S group (g–i).
Figure 2—figure supplement 1
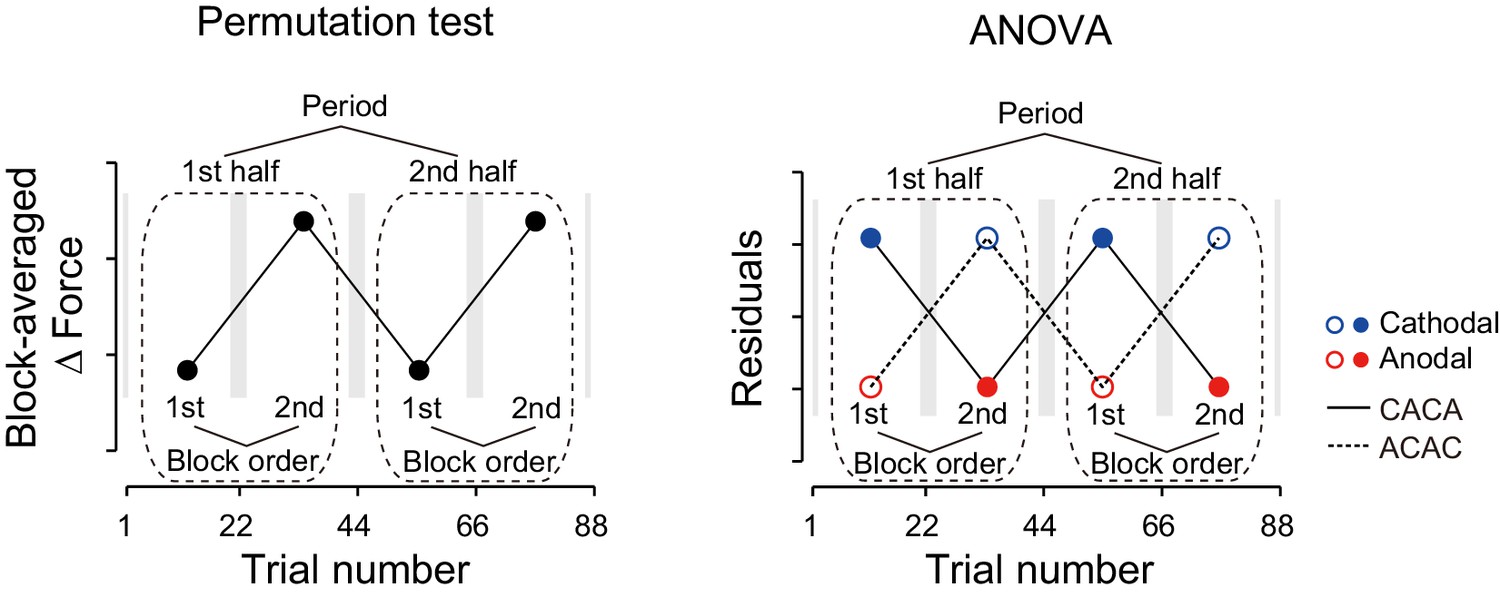
Definition of factors 'period' and 'block order'.
https://doi.org/10.7554/eLife.15378.005
Figure 2—figure supplement 2
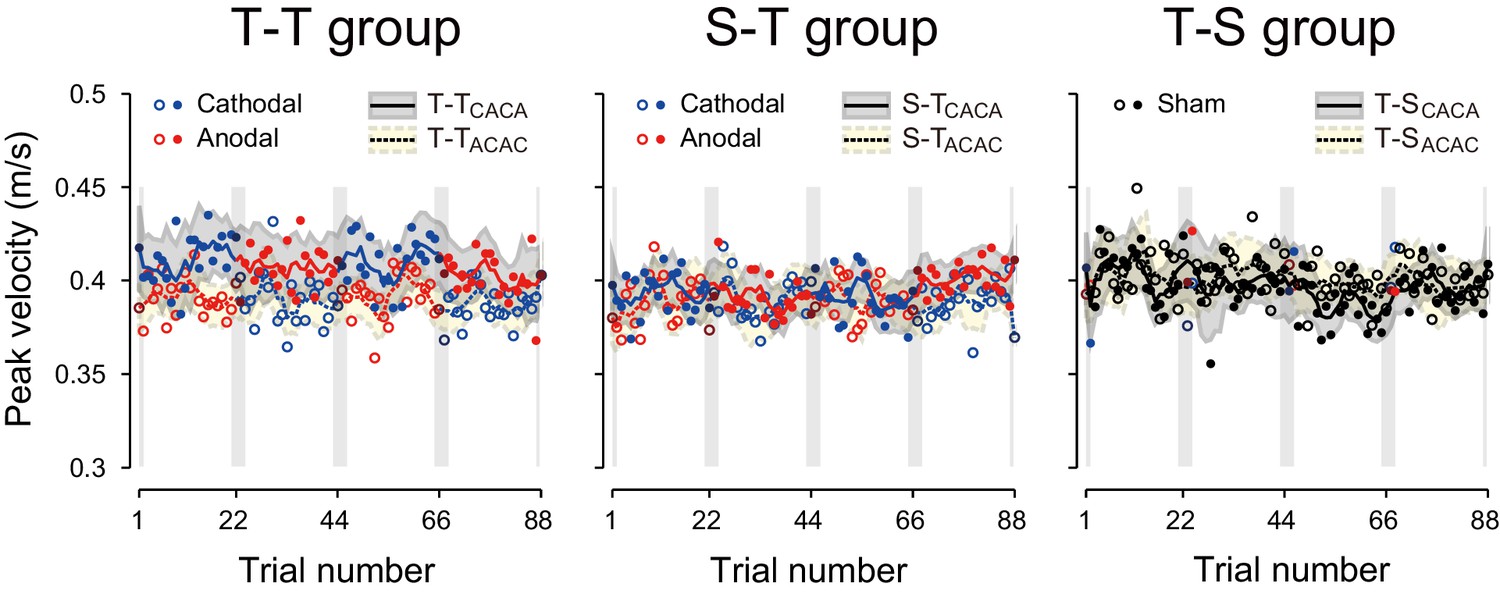
Trial-dependent changes in the handle’s peak velocity for the T-TACAC (open circle) and T-TCACA subgroups (filled circle) during the testing period.
The format is identical to Figure 2 (a), (d), and (g).
Figure 3 with 3 supplements
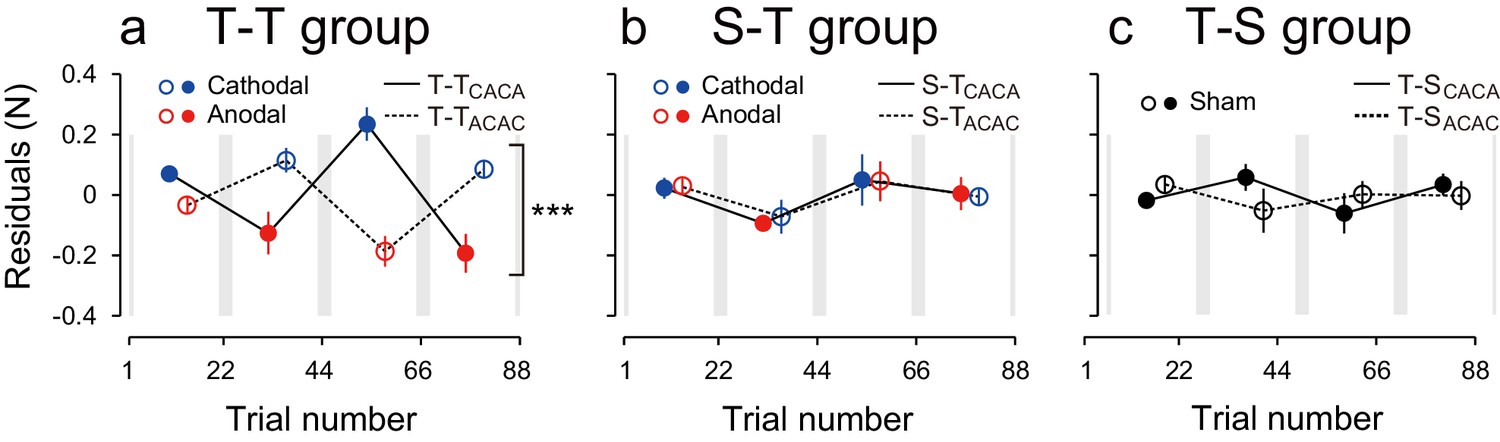
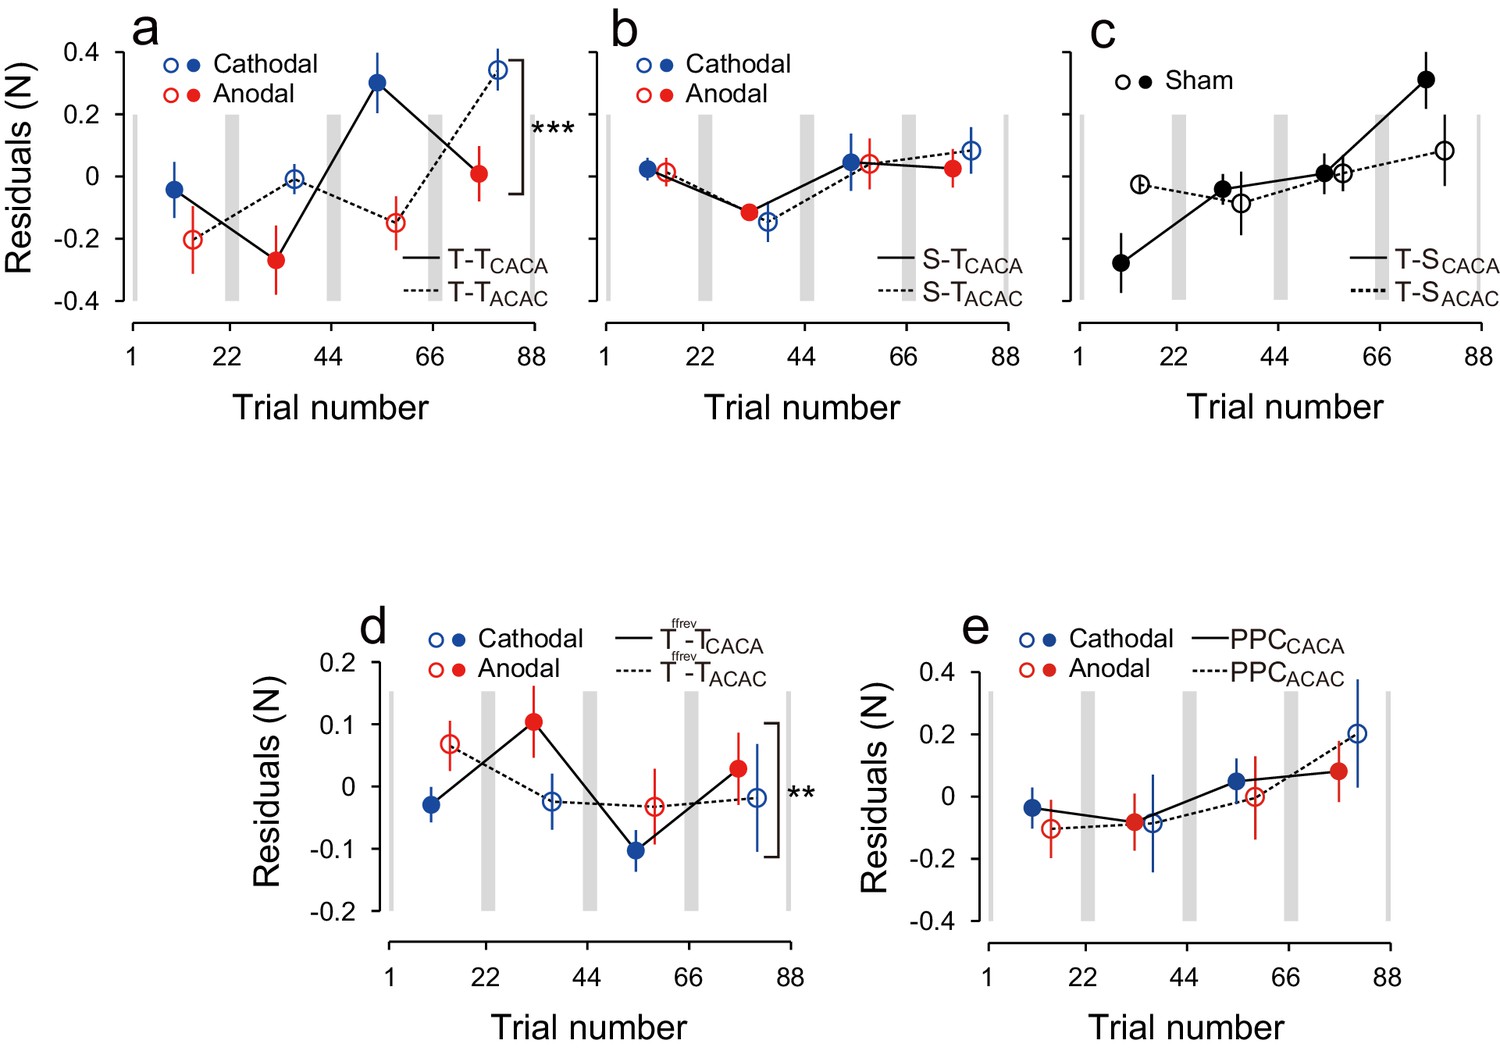
Modulation of the residuals, with block, during the test period.
(a) The force output residuals from the exponential fitting of 4 blocks for the T-TACAC (dashed line and open circle) and T-TCACA (solid line and filled circle) groups. The error bars indicate standard errors. Circle color represents tDCS polarity. A 3-way ANOVA indicates a significant interaction between subgroup and block order. ***p<0.005. (b) Results for the S-T group receiving sham tDCS during the training period. (c) Data for the T-S group receiving sham tDCS during the test period. Circle color was set to black for data obtained when sham tDCS was used.
Figure 3—figure supplement 1
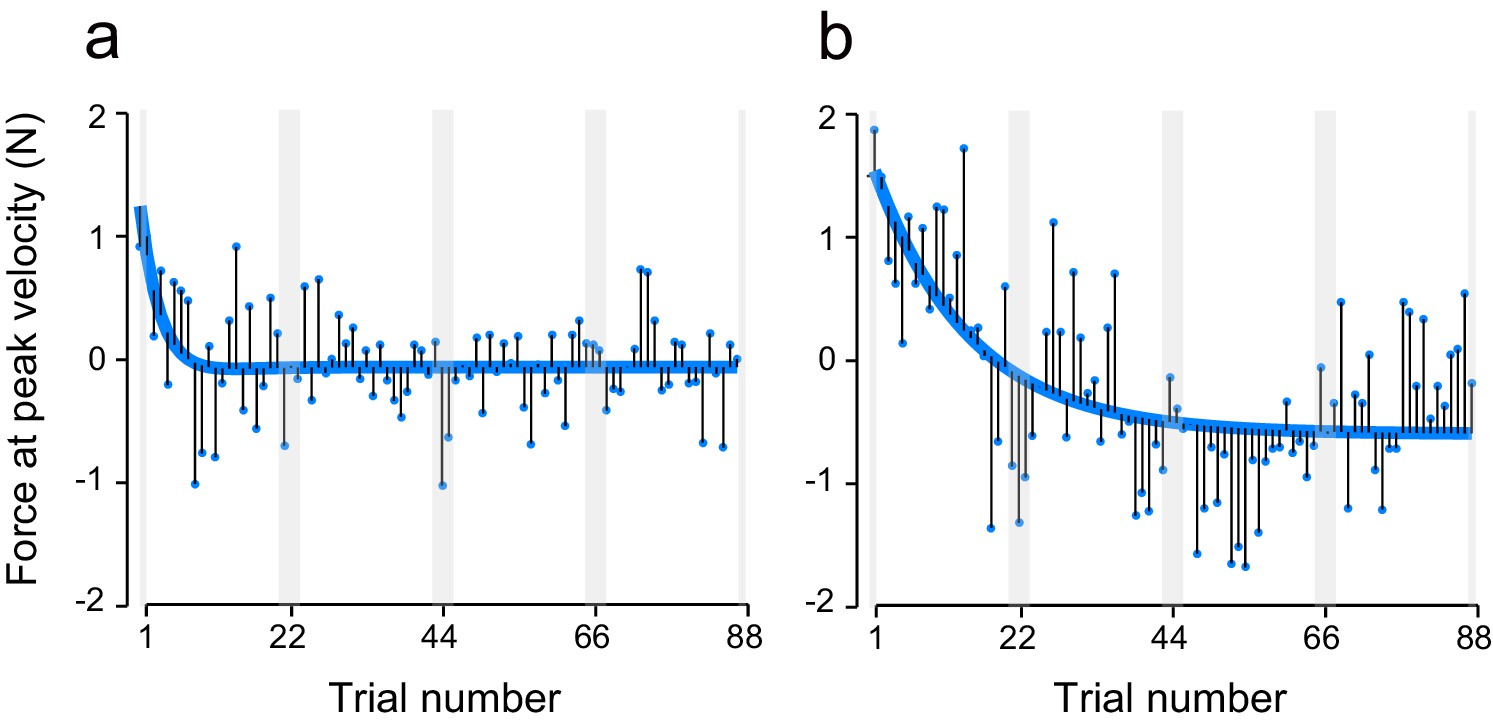
Calculations for residuals.
Force data were fitted using a sum of two exponential curves, and fitted curves were subtracted from the data to obtain the residuals. If there were no block-dependent modulation, the residuals should be evenly distributed around the curve (a). In contrast, if there were modulation, the residuals should change, along with the blocks, around the curve (b).
Figure 3—figure supplement 2
Polarity-dependent changes in the aftereffect for the Tffrev-T groups.
https://doi.org/10.7554/eLife.15378.009
Figure 3—figure supplement 3
The residuals obtained using a single exponential curve instead of two exponential curves.
The format is identical to Figure 3. The results were not substantially different from those obtained using two exponential curves. As for the T-T group results (a), there was a significant interaction between subgroup and block order [repeated measures 3-way ANOVA: F(1,14) = 43.82, p = 1.15 × 10⁻⁵, = 0.76]. For both groups, there was a simple main effect of block order on the residuals [T-TACAC: F(1,14) = 28.45, p = 1.05 × 10⁻⁴, = 0.67; T-TCACA: F(1,14) = 16.22, p = 0.0012, = 0.54]. As for the S-T group (b), there was no significant interaction between subgroup and block order [repeated measures 3-way ANOVA: F(1,14) = 0.040, p = 0.844, = 0.0028; simple main effect of block order: F(1,14) = 1.759, p = 0.206, = 0.11]. Furthermore, the modulation of the residuals by stimulation polarity was larger for the T-T group than it was for the S-T group [repeated measures 4-way ANOVA, interaction between group, subgroup, and block order: F(1,28) = 17.94, p = 2.22 × 10⁻⁴, = 0.39]. As for the T-S group (c), there was a significant interaction between subgroup and block order [repeated measures 3-way ANOVA: F(1,14) = 7.641, p = 0.015, = 0.35], and there was a simple main effect of block order only for the T-SCACA group [F(1,14) = 16.07, p = 0.001, = 0.53], but the modulation due to polarity was opposite to the predicted pattern. Furthermore, the modulation of force output by stimulation polarity was larger for the T-T group than it was for the T-S group [repeated measures 4-way ANOVA, interaction between group, subgroup, and block order: F(1,28) = 43.16, p = 4.00 × 10⁻⁷, = 0.61]. Regarding the Tffrev-T group (d), there was a significant interaction between subgroup and polarity [repeated measures 3-way ANOVA: F(1,14) = 9.202, p = 0.008, = 0.37]. While in one group (Tffrev-TACAC) there was no clear effect of stimulation polarity during the test period [simple main effect of polarity on the residuals: F(1,16) = 2.04, p = 0.173, = 0.11], the other group showed a clear effect of stimulation. In this group (Tffrev-TCACA), there was a simple main effect of polarity on the residuals [F(1,16) = 8.20, p = 0.011, = 0.34]. This modulation was consistent with what was predicted by the association between polarity and force-field during the training period. As for the PPC group (e), there was no significant interaction between subgroup and block order [repeated measures 3-way ANOVA: F(1,16) = 0.996, p = 0.333, = 0.058], and modulation was significantly greater for the T-T group than for the PPC group [interaction between group, subgroup, and block order by repeated measures 4-way ANOVA: F(1,30) = 4.903, p = 0.035, = 0.46].
Figure 4
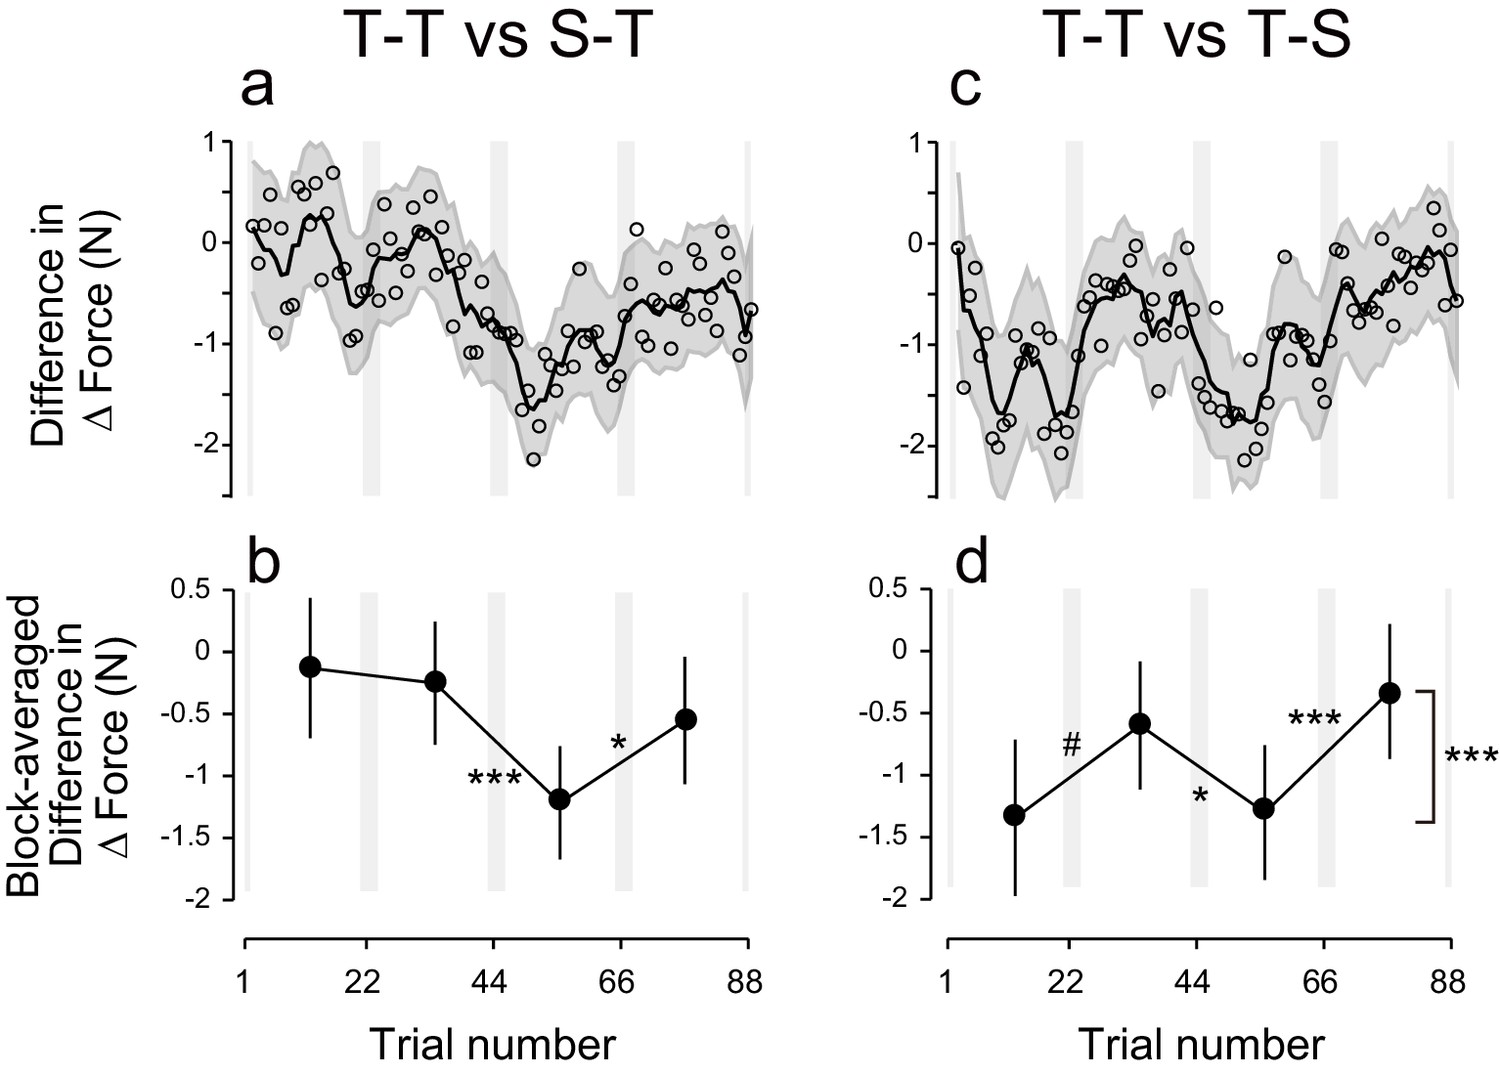
Difference in ΔForce between experimental groups.
(a) ΔForce for the S-T group was subtracted from the T-T group. The solid line and shaded grey area indicates the mean and standard deviation of the bootstrapped samples (moving average calculated over 5 data points). (b) The difference in the bootstrap samples of ΔForce was averaged for each block. The error bars indicate the standard deviations of the bootstrapped samples. (c,d) Difference in ΔForce between T-T and T-S groups. A permutation test was used to test the effect of block order (***p<0.005 as indicated at the right side of panel (d). A permutation test was also used to compare the values between the first and second, second and third , and the third and fourth blocks. #p<0.06; *p<0.05; ***p<0.005
Figure 5
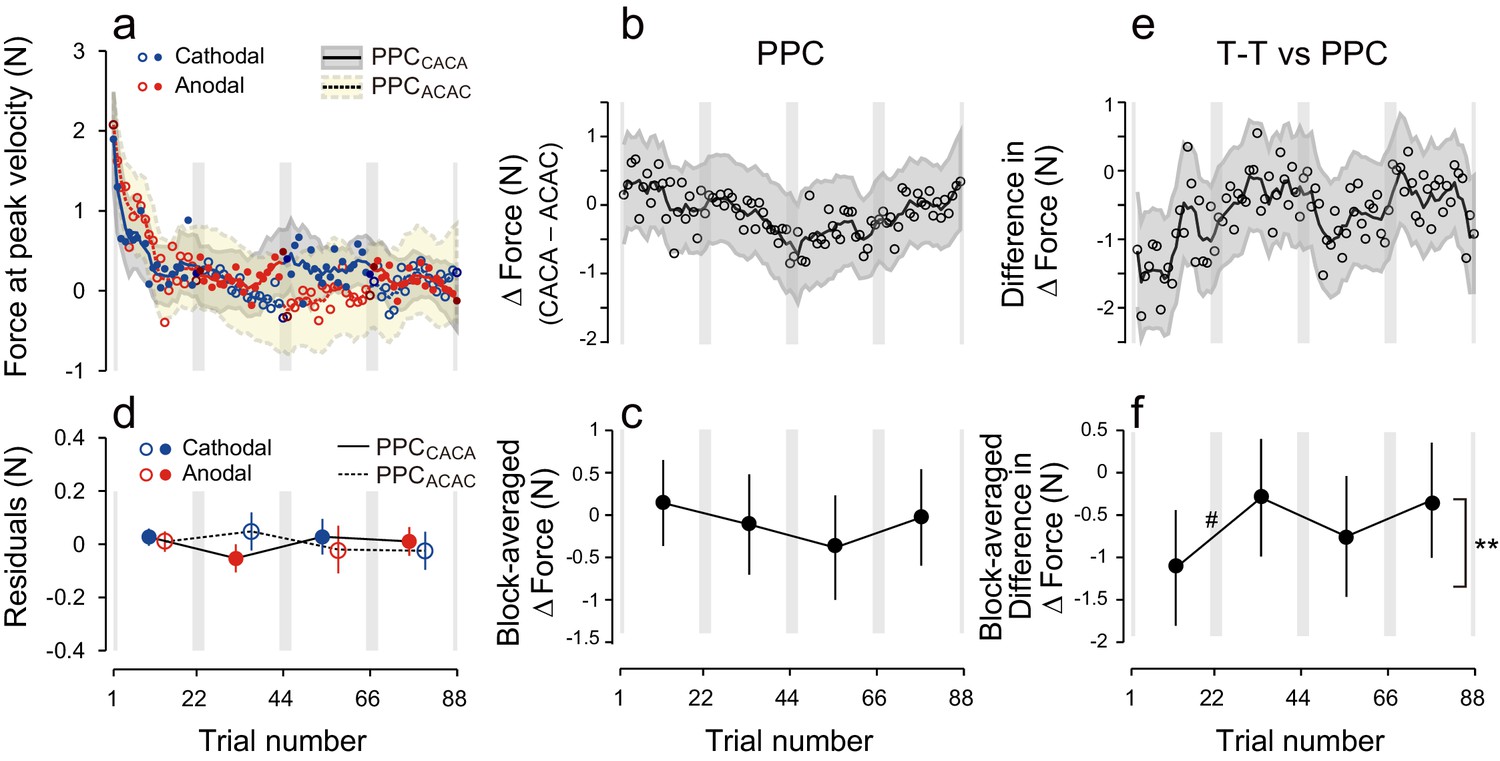
Results during the test period for the PPC group.
(a) Force output during the test period. (b) Trial dependent change in ΔForce obtained with a bootstrap method. The solid line and grey area indicates mean and standard deviation of the bootstrapped samples (moving average calculated over 5 data points). (c) ΔForce averaged for each block. The error bars indicate standard deviations of the bootstrapped samples. (d) Residuals obtained by subtracting the exponential curves from the original force output. (e, f) Trial-dependent (e) and block-dependent (f) difference in ΔForce between T-T and PPC groups. A permutation test was used to test the effect of block order (**p<0.01 as indicated by the right side of panel (f). A permutation test was also used to compare the values between the first and second, second and third, and the third and fourth blocks. #p<0.06.
Figure 6
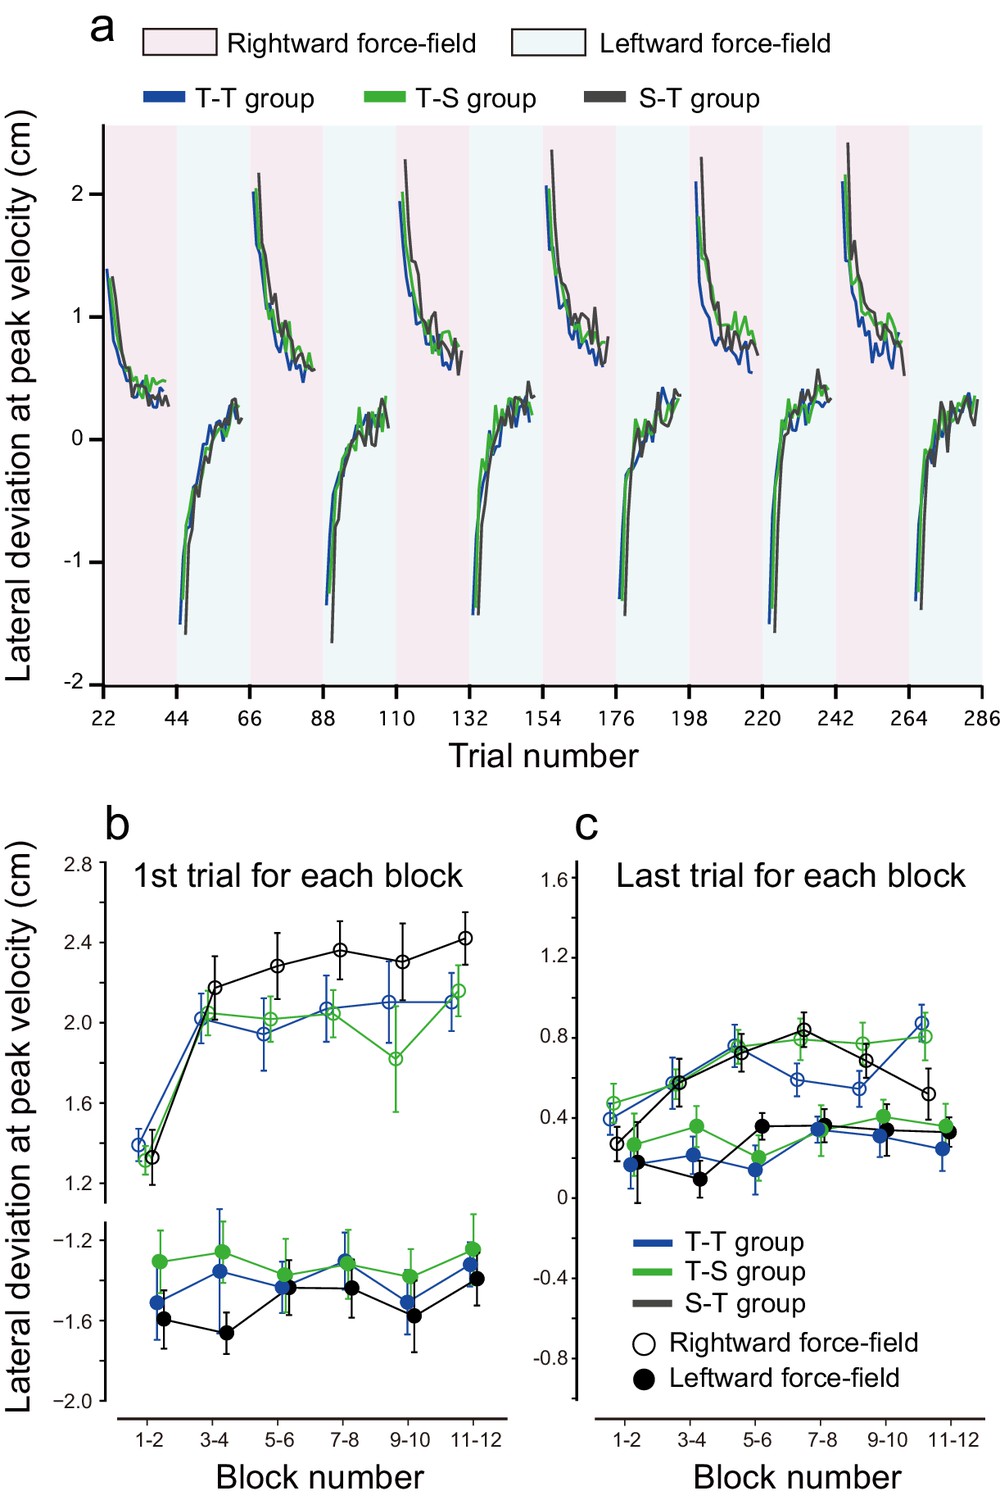
Results during the training period.
(a) Trial-by-trial changes in lateral deviation evaluated at the peak handle velocity. Only data averaged among participants are displayed; depicting standard errors makes it difficult to observe the data. Red and blue backgrounds indicate the period in which anodal and cathodal stimulation were applied. (b, c) Lateral deviation for the first trial (b) and last trial (c) for each block averaged over participants. The error bar indicates standard error.
Author response image 1
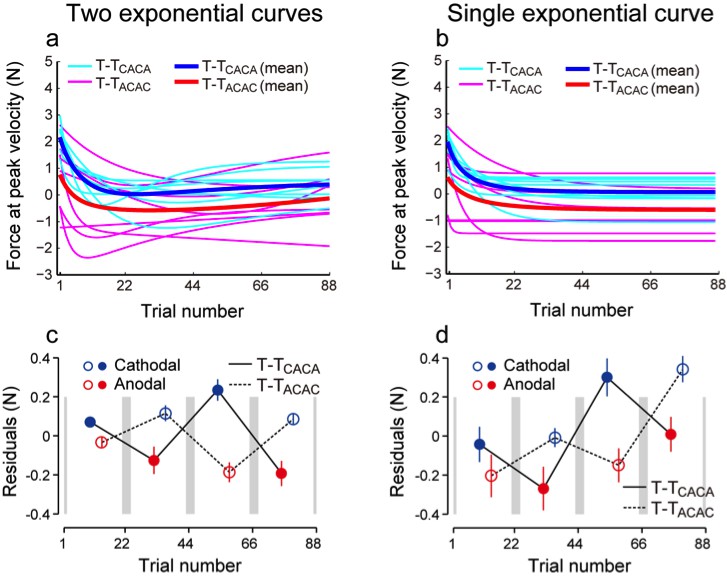
Curves fitted for individual data (cyan and magenta) and the averaged curves (blue and red) when two exponential curves (a) and a single exponential curve (b) were used.
The residual values were different (c, d), but the presence of modulation was not influenced.
Download links
A two-part list of links to download the article, or parts of the article, in various formats.
Downloads (link to download the article as PDF)
Open citations (links to open the citations from this article in various online reference manager services)
Cite this article (links to download the citations from this article in formats compatible with various reference manager tools)
Tagging motor memories with transcranial direct current stimulation allows later artificially-controlled retrieval
eLife 5:e15378.
https://doi.org/10.7554/eLife.15378


