Repeated social defeat stress enhances glutamatergic synaptic plasticity in the VTA and cocaine place conditioning
- University of Texas, United States
Figures
Figure 1
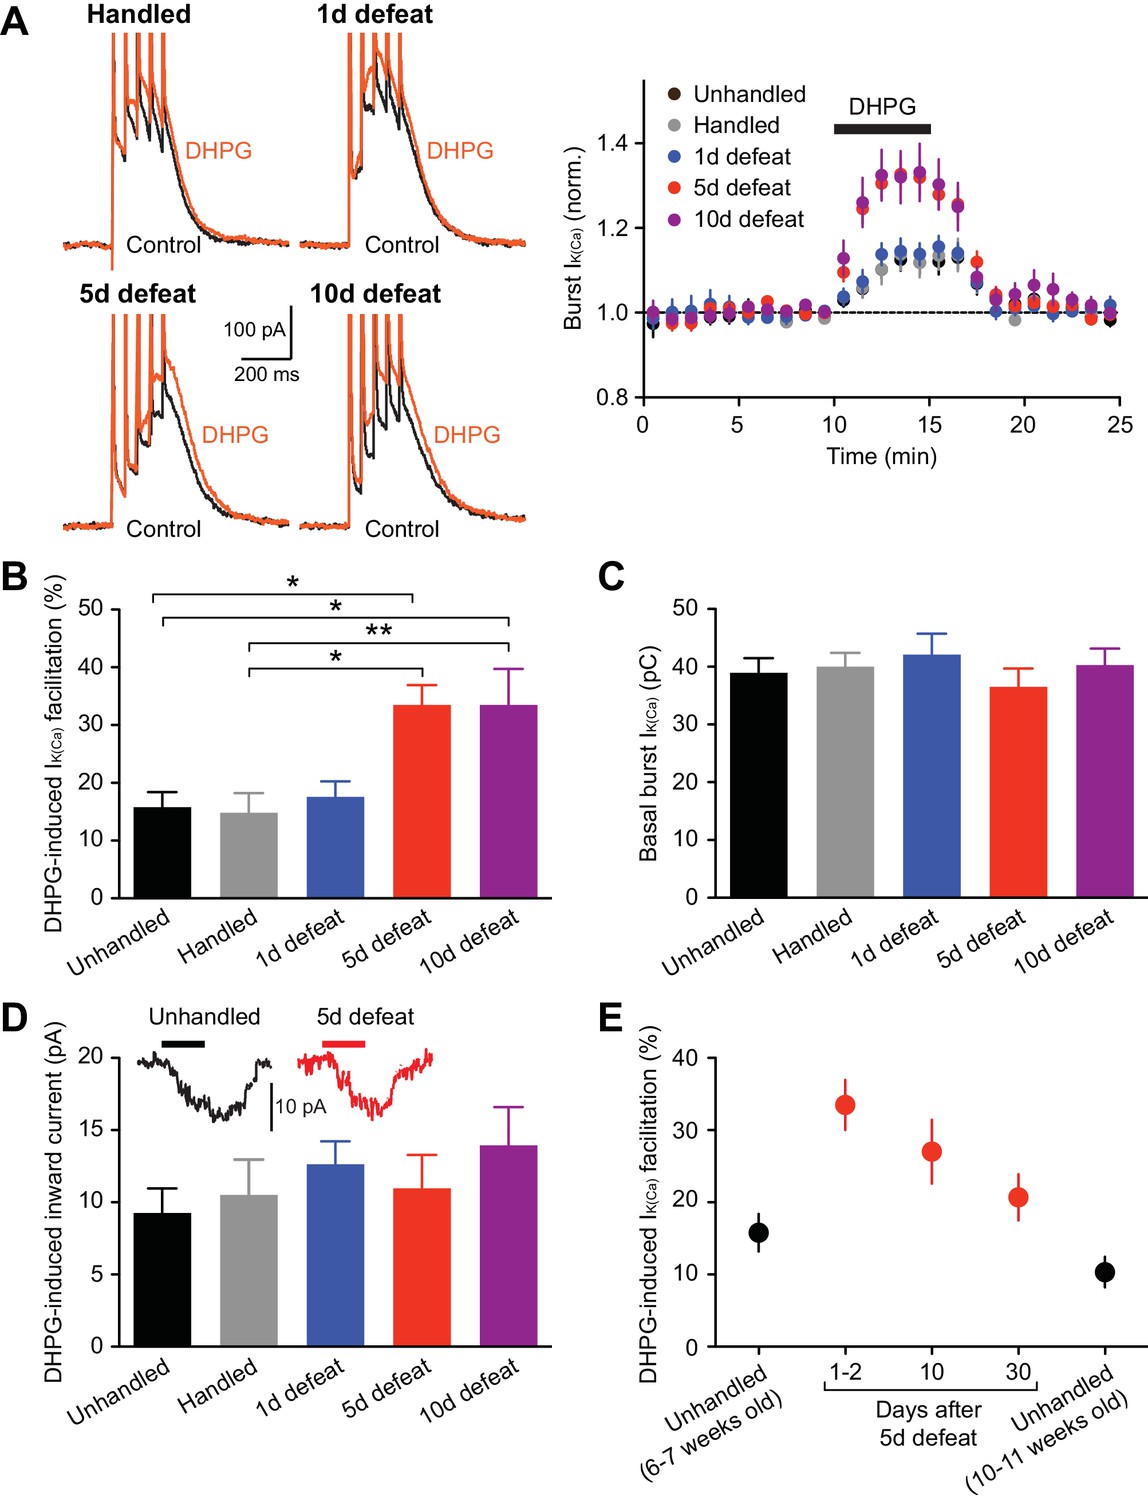
mGluR-dependent facilitation of burst-evoked Ca2+ signals is enhanced after repeated social defeat.
(A) Example traces (left) and summary time graph (right) illustrating the facilitating effect of DHPG (1 µM) on burst IK(Ca) in neurons from unhandled rats (traces not shown), rats handled for 5 days, and rats that underwent social defeat for 1, 5, or 10 days. (B) Summary bar graph showing the magnitude of DHPG-induced burst IK(Ca) facilitation (unhandled: 20 cells from 12 rats, handled: 20 cells from 13 rats, 1 day defeat: 19 cells from 11 rats, 5 day defeat: 21 cells from 13 rats, 10 day defeat: 19 cells from 10 rats; F4,94 = 6.19, p<0.001, one-way ANOVA). *p<0.05, **p<0.01 (Bonferroni post hoc test). (C) The size of basal burst IK(Ca) was not altered by social defeat. (D) DHPG-induced inward currents were not affected by social defeat. Inset: Example traces of DHPG-induced currents from unhandled and 5-day defeated rats (5-min DHPG perfusion at the horizontal bar). (E) Summary graph depicting DHPG effect on burst IK(Ca) after different intervals following 5-day social defeat. Data in 6–7 weeks old unhandled and 1–2 day interval groups were from those in panels A–D (6–7 weeks old unhandled: 20 cells from 12 rats, 1–2 day interval: 21 cells from 13 rats, 10-day interval: 17 cells from 8 rats, 30-day interval: 16 cells from 9 rats, 10–11 weeks old unhandled: 15 cells from 7 rats).
Figure 2
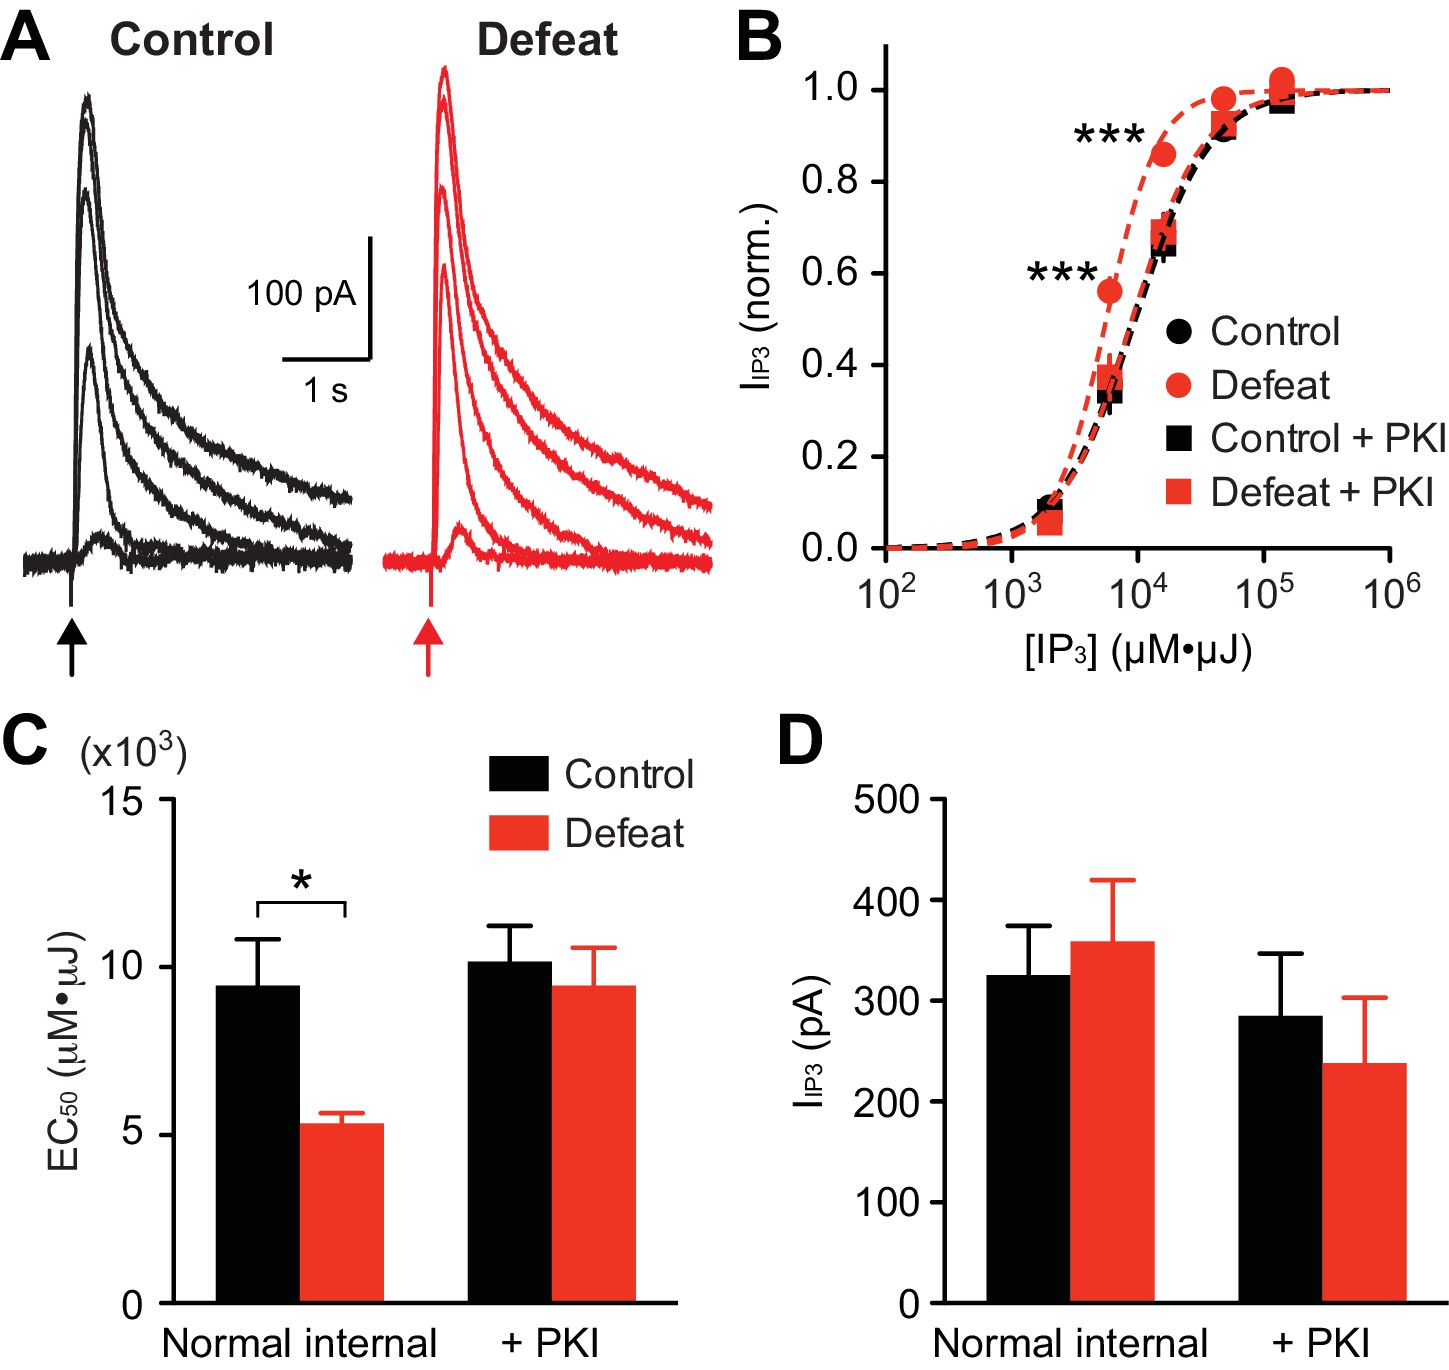
PKA activity maintains increased IP3R sensitivity in socially defeated rats.
(A) Example traces of IIP3 evoked by different concentrations of IP3 (2000, 6000, 16000, 48000, and 140000 µM·µJ) in control and defeated rats. (B) Averaged IP3 concentration-response curves from control and defeated rats. IIP3 amplitudes were normalized to the maximal value (estimated from fit to a logistic equation) in each cell. Recordings were made with normal internal solution or with PKI (control: 12 cells from 8 rats, defeat: 12 cells from 7 rats, control + PKI: 15 cells from 9 rats, defeat + PKI: 14 cells from 8 rats; treatment (defeat/PKI): F3,196 = 4.88, p<0.01; IP3 concentration: F4,196 = 1214, p<0.001; treatment × IP3 concentration: F12,196 = 4.42, p<0.001; mixed two-way ANOVA). ***p<0.001 vs. control (Bonferroni post hoc test). Lines represent logistic fit to the averaged data in each group. (C) Summary bar graph depicting the average EC50 values (EC50 determined in each cell) in the 4 groups shown in (B) (defeat: F1,49 = 5.11, p<0.05; PKI: F1,49 = 5.11, p<0.05; two-way ANOVA). *p<0.05 (Bonferroni post hoc test). (D) The maximal IIP3 amplitude was not affected by social defeat experience or PKI during recording.
Figure 3 with 1 supplement

NMDAR-mediated transmission is more susceptible to LTP induction after social defeat.
(A) Example experiments to induce NMDAR LTP in neurons from control and defeated rats. Time graphs of NMDAR EPSCs are shown with example traces at times indicated by numbers (baseline: gray, post-induction: black). The LTP induction protocol (IP3-synaptic stimulation-burst combination; illustrated in top inset) was delivered after 10-min baseline recording (at arrow). (B) Summary time graph of baseline-normalized NMDAR EPSCs in LTP experiments (control: 7 cells from 7 rats, defeat: 7 cells from 7 rats). (C) Summary of NMDAR LTP magnitude in control and defeated rats (t12 = 3.93, **p<0.01, unpaired t-test). (D) Example traces (left; from the defeated rat shown in A) and summary (right) of IK(Ca) facilitation by IP3 assessed before LTP induction (t12 = 4.65, ***p<0.001, unpaired t-test). (E) The magnitude of NMDAR LTP is plotted versus the magnitude of IP3-induced facilitation of IK(Ca). Dashed line is a linear fit to all data points from both control and defeated rats.
Figure 3—figure supplement 1
Summary time graph of baseline-normalized NMDAR EPSCs in LTP experiments using a high concentration of IP3 (500 μM·μJ) during induction in control rats (4 cells from 4 rats).
Facilitation of burst IK(Ca) by IP3 was 26 ± 5% in these cells.
Figure 4

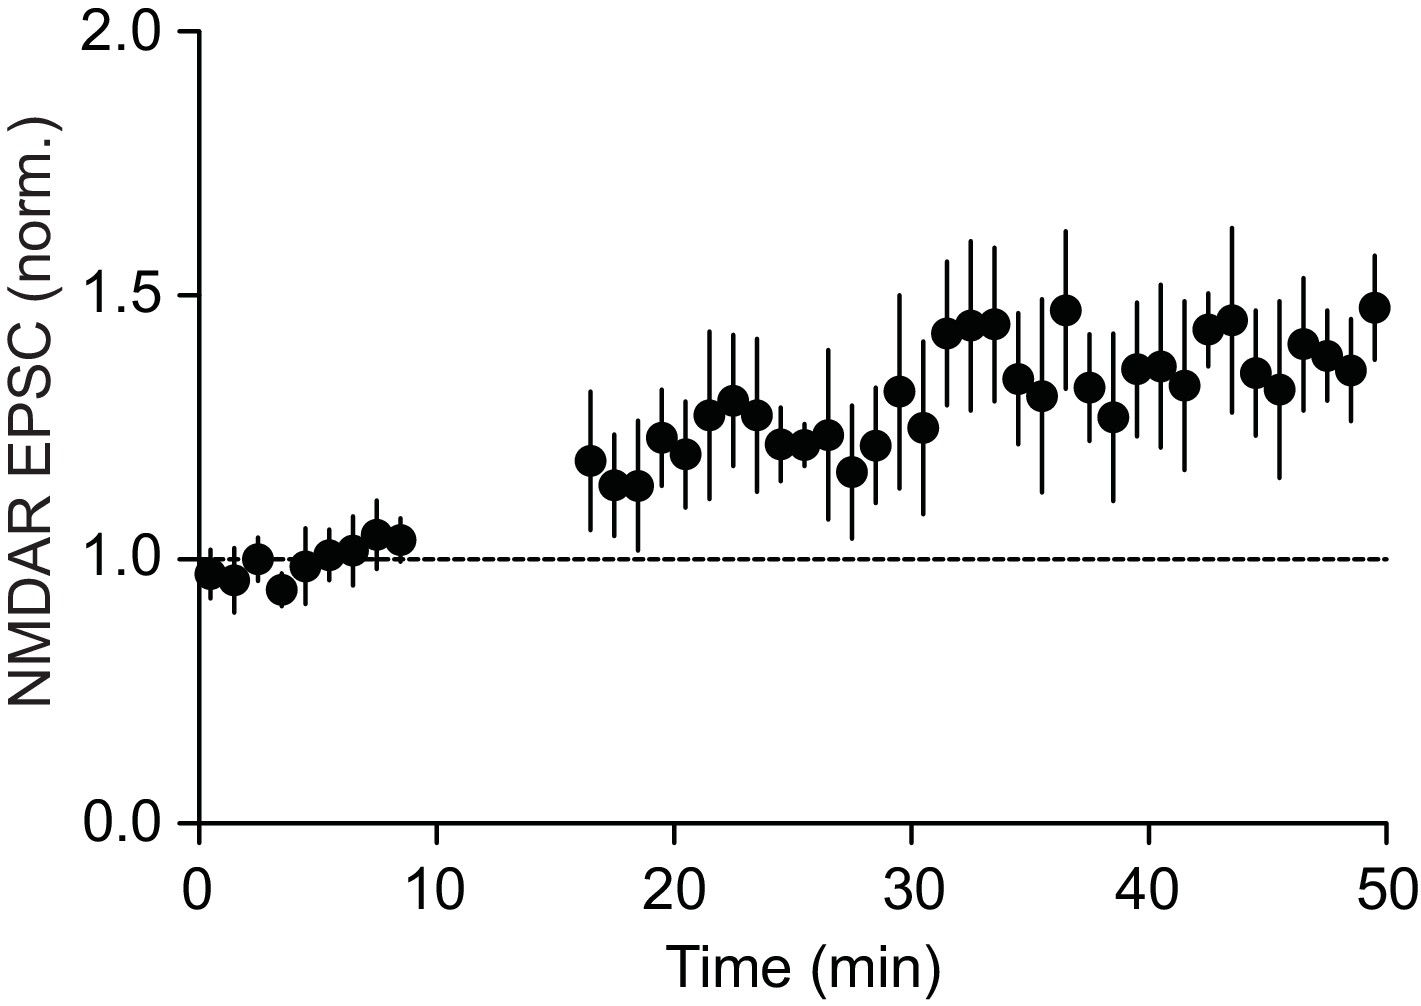
Summary time graph depicting inward currents induced by 1-min perfusion of NMDA (10 μM) in VTA dopamine neurons from control (8 cells from 3 rats) and 5 day defeated rats (6 cells from 2 rats).
https://doi.org/10.7554/eLife.15448.007
Figure 5
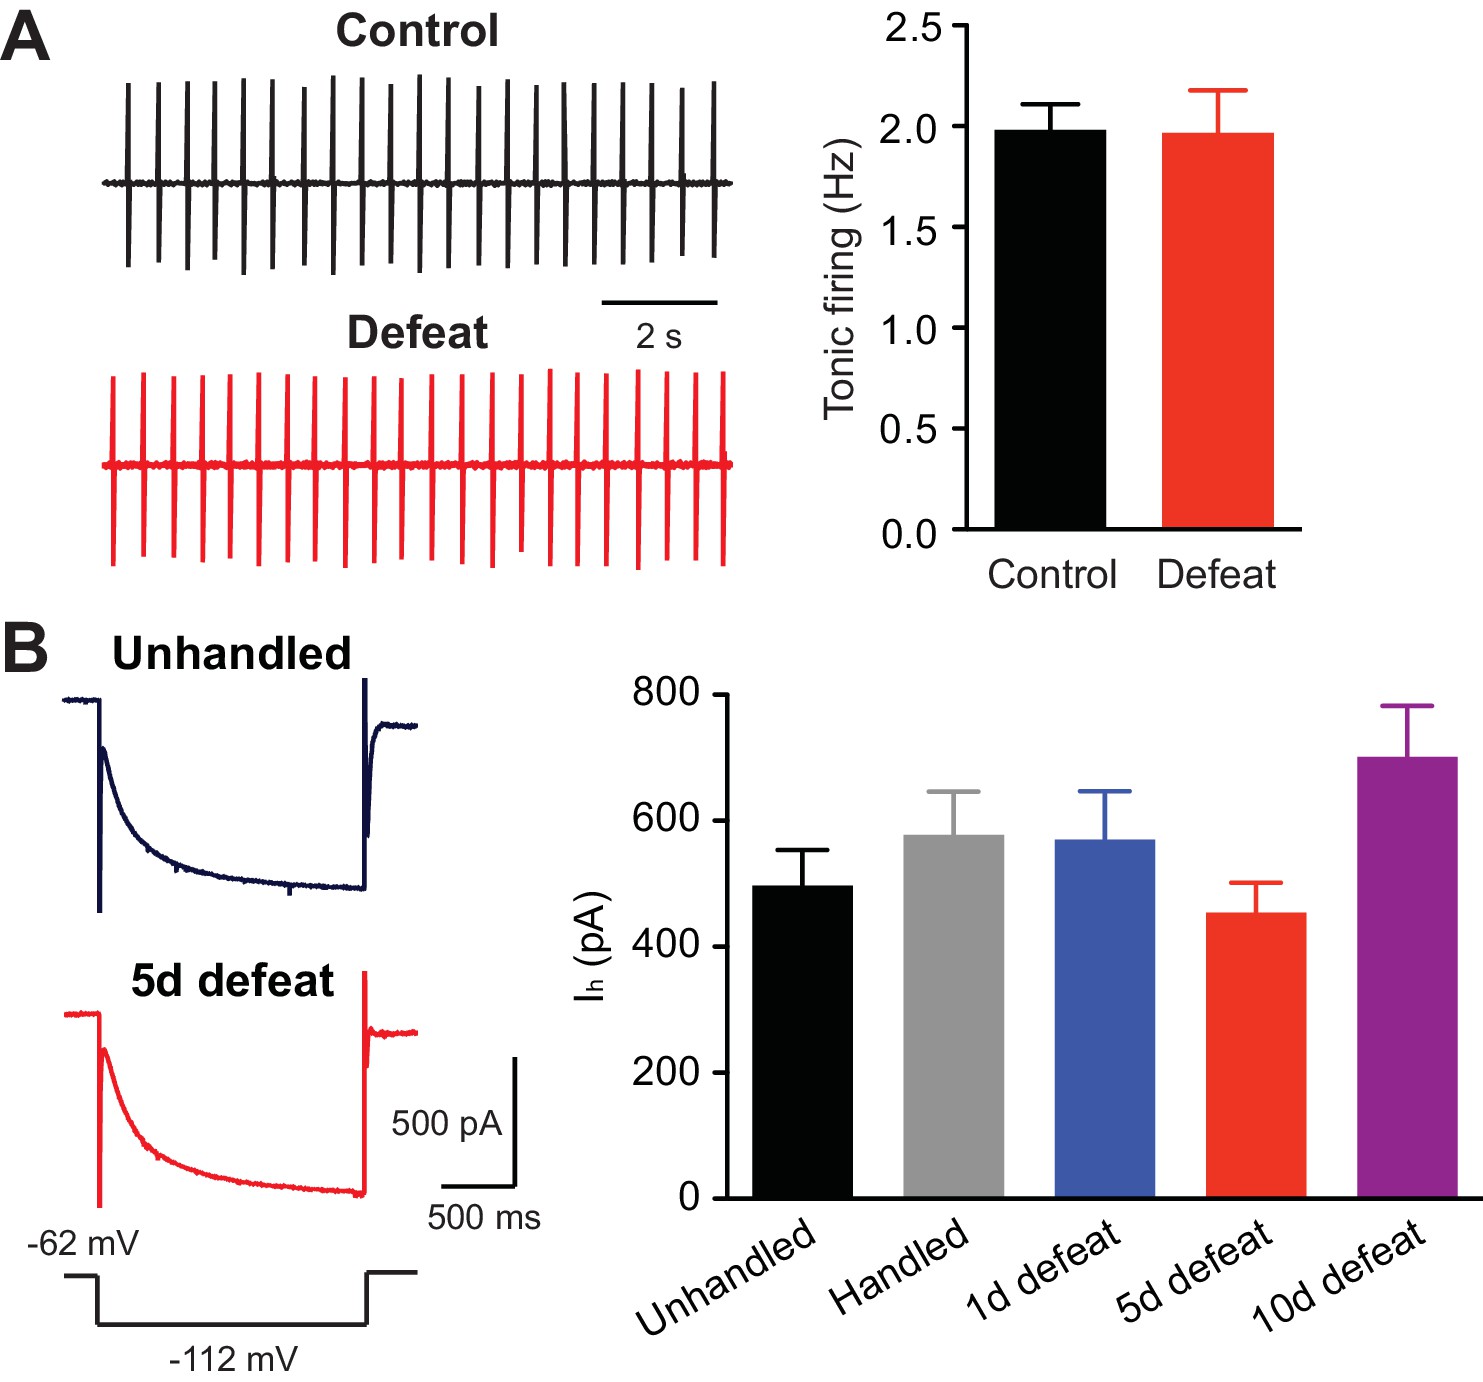
Tonic firing is unaltered by social defeat.
(A) Example traces (left) and summary (right) of tonic firing frequency in VTA neurons from control and defeated rats (control: 15 cells from 3 rats, 5 defeats: 9 cells from 3 rats; t22 = 0.066, p=0.95, unpaired t-test). In these experiments, loose-patch recordings (<20 MΩ seal) were made using pipettes filled with 150 mM NaCl to monitor tonic pacemaker firing. (B) Example traces (left; voltage step depicted at bottom) and summary (right) of Ih currents recorded in cells from animals that underwent control procedures or 1, 5, or 10 days of defeat (data were obtained from the same cells shown in Figures 1A–D; F4,94 = 2.01, p=0.10, one-way ANOVA).
Figure 6

Stress-induced, but not cocaine-induced, IP3R sensitization is prevented by GR blockade.
(A) Example traces (left) and summary (right) of DHPG-induced burst IK(Ca) facilitation in neurons from animals that were injected with vehicle or mifepristone before undergoing control handling or social defeat sessions (vehicle + control: 8 cells from 5 rats, vehicle + defeat: 10 cells from 4 rats, mifepristone + control: 10 cells from 5 rats, mifepristone + defeat: 11 cells from 4 rats; defeat × mifepristone: F1,35 = 4.56, p<0.05, two-way ANOVA). *p<0.05 (Bonferroni post hoc test). (B) Summary bar graph showing that repeated corticosterone treatment (once daily for 5 days) failed to affect DHPG-induced burst IK(Ca) facilitation (vehicle: 8 cells from 5 rats, 2.5 mg/kg: 11 cells from 5 rats, 5 mg/kg: 10 cells from 4 rats, 15 mg/kg: 12 cells from 7 rats). (C) Summary bar graph demonstrating that mifepristone pretreatment failed to block the increase in DHPG effect resulting from repeated cocaine treatment (10 mg/kg, i.p., once daily for 5 days) (saline: 17 cells from 7 rats, cocaine: 16 cells from 7 rats, mifepristone + saline: 21 cells from 8 rats, mifepristone + cocaine: 16 cells from 6 rats; cocaine: F1,66 = 11.4, p<0.01, two-way ANOVA). *p<0.05 (Bonferroni post hoc test).
Figure 7 with 3 supplements

Social defeat promotes cocaine-induced CPP via a GR-dependent mechanism.
(A) Summary of changes in the preference for the cocaine-paired side following 1-day conditioning in unhandled, handled, and defeated rats (unhandled: t7 = 2.51, p<0.05; handled: t7 = 1.90, p=0.10; defeat: t6 = 11.0, p<0.001; paired t-test). (B) Summary of 1-day cocaine CPP scores in unhandled, handled, and defeated rats (F2,20 = 25.2, p<0.001, one-way ANOVA). ***p<0.001 (Bonferroni post hoc test). (C) Summary of changes in the preference for the cocaine-paired side following 1-day conditioning in rats pretreated with vehicle or mifepristone 30 min prior to social defeat or handling sessions (vehicle + defeat: t8 = 5.30, p<0.001; mifepristone + defeat: t8 = 1.90, p=0.09; mifepristone + handled: t7 = 0.95, p=0.37; paired t-test). (D) Summary of 1-day cocaine CPP scores in the 3 groups shown in panel C (F2,23 = 4.90, p<0.05, one-way ANOVA). *p<0.05 (Bonferroni post hoc test). None of the treatments in this figure affected the overall activity level during the pretest (Figure 7—figure supplement 2).
Figure 7—figure supplement 1
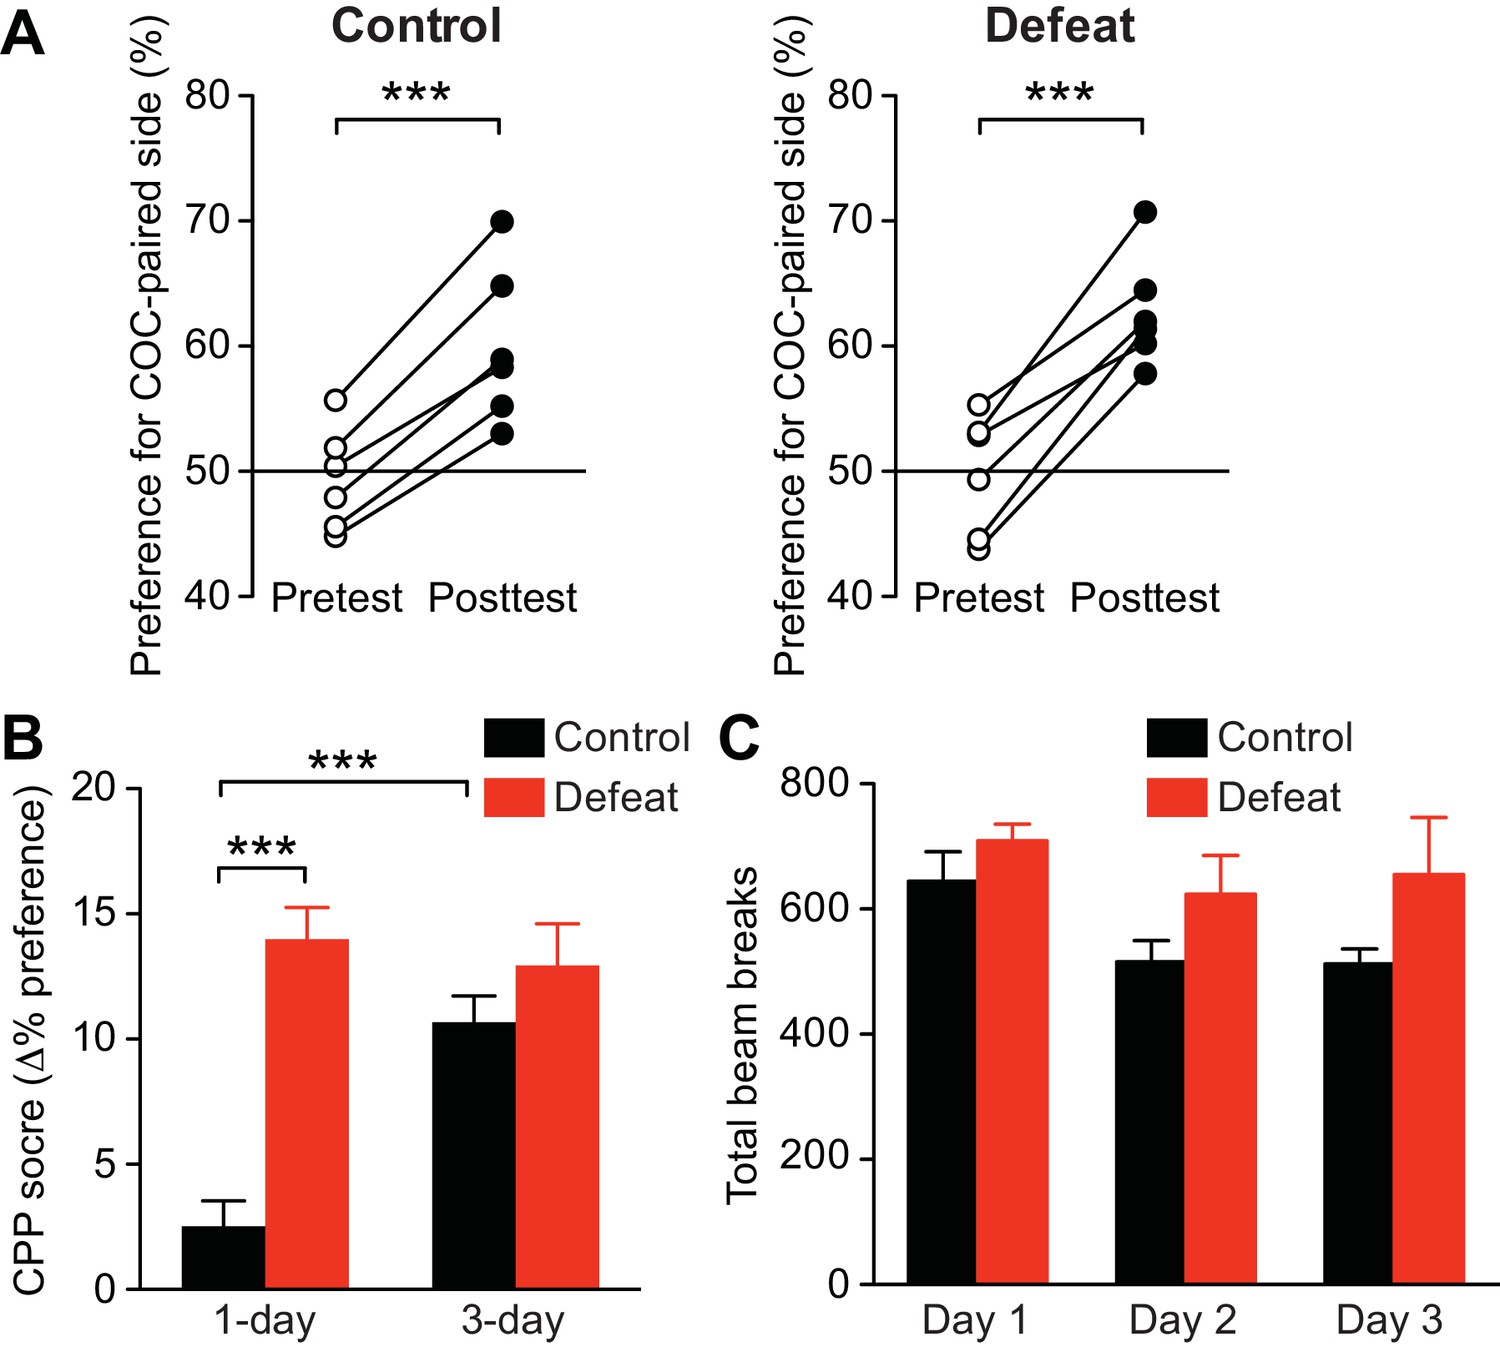
Unhandled control rats developed robust CPP after 3-day conditioning with cocaine (5 mg/kg).
(A) Summary of changes in the preference for the cocaine-paired side following 3-day conditioning in unhandled control and defeated rats (unhandled: t5 = 10.1, p<0.001; defeat: t5 = 7.73, p<0.001; paired t-test). (B) Summary of 1-day (from the data shown in Figure 7B) and 3-day CPP scores in unhandled control and defeated rats (defeat: F1,23 = 29.9, p<0.0001; conditioning period: F1,23 = 7.95, p<0.01; defeat x conditioning period: F1,23 = 13.4, p<0.01; two-way ANOVA). ***p<0.001 (Bonferroni posthoc test). (C) Summary of the overall activity level, i.e., total number of beam breaks in the CPP box compartment, during the three cocaine conditioning sessions for the 3-day conditioning experiments shown in (A) and (B) (defeat: F1,20 = 3.45, p=0.09; defeat x conditioning day: F2,20 = 0.43, p=0.66; mixed two-way ANOVA).
Figure 7—figure supplement 2

Summary graphs depicting the overall activity level (i.e., total number of beam breaks in the CPP box compartments) during the pretest for the experiments shown in Figure 7.
(A) Data from the groups in Figures 7A and B (F2,20 = 1.76, p=0.20, one-way ANOVA). (B) Data from the groups in Figure 7C and D (F2,23 = 0.92, p=0.41, one-way ANOVA).
Figure 7—figure supplement 3
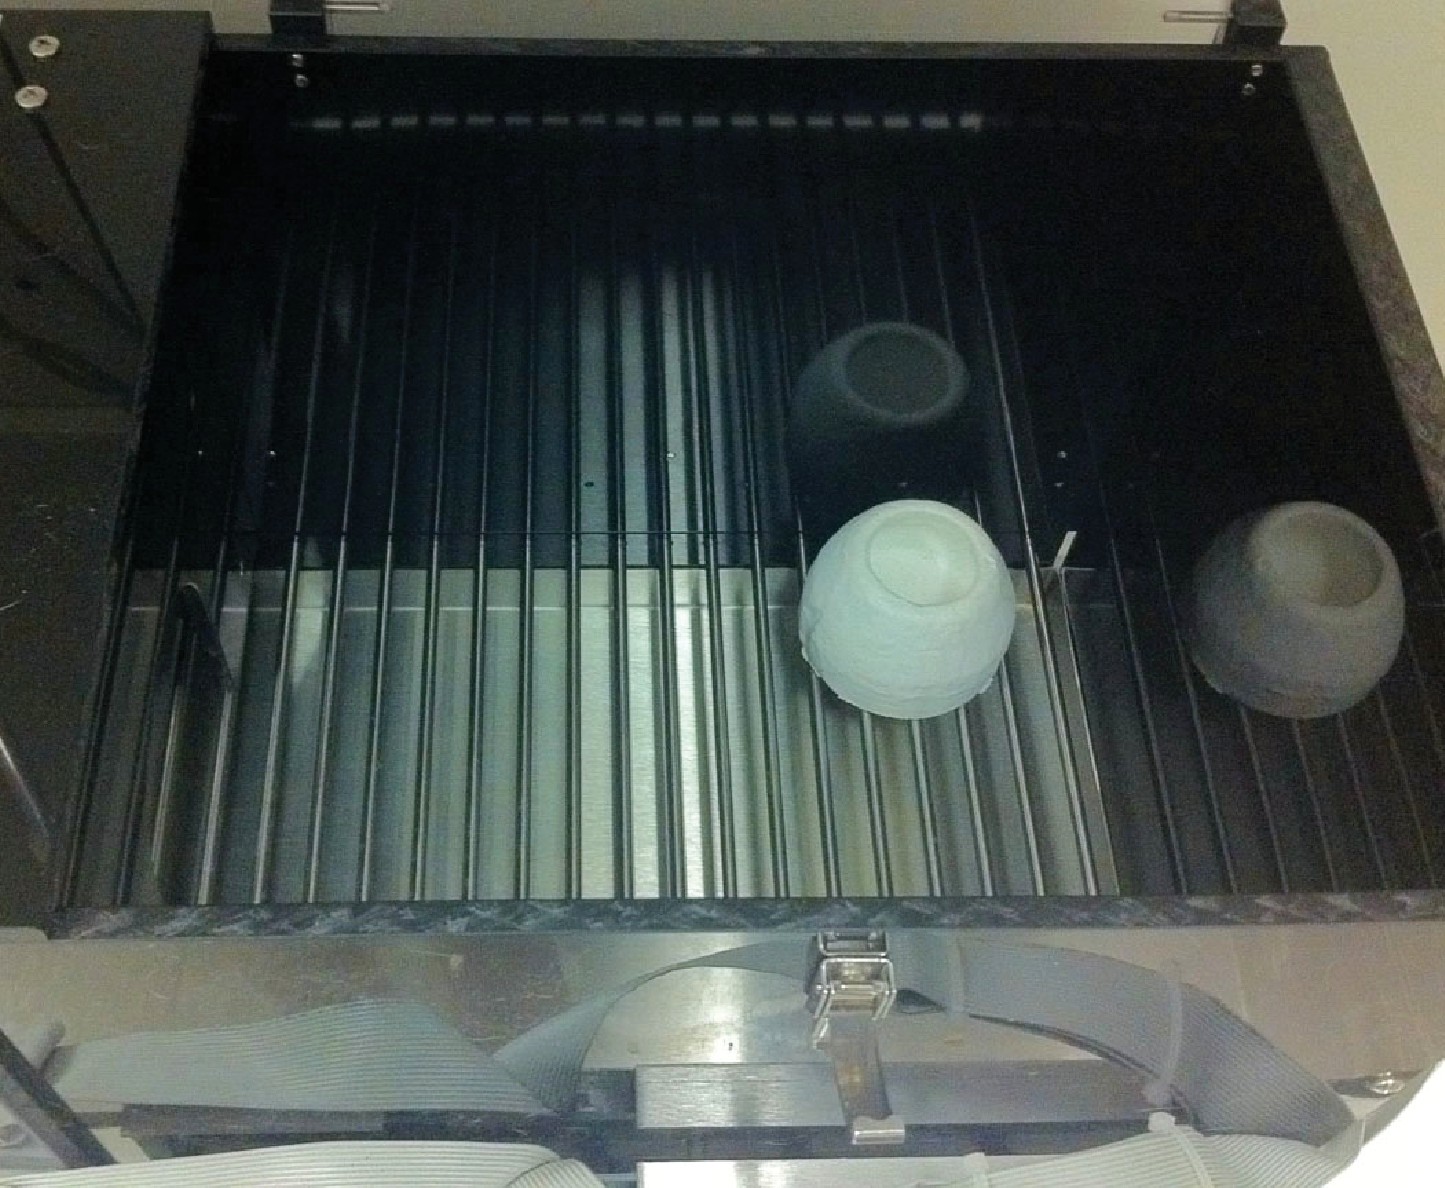
Photograph of CPP box compartment with color-contrasting ceramic weight.
The weight serves as a discrete cue to further differentiate the two conditioning contexts.
Download links
A two-part list of links to download the article, or parts of the article, in various formats.
Downloads (link to download the article as PDF)
Open citations (links to open the citations from this article in various online reference manager services)
Cite this article (links to download the citations from this article in formats compatible with various reference manager tools)
Repeated social defeat stress enhances glutamatergic synaptic plasticity in the VTA and cocaine place conditioning
eLife 5:e15448.
https://doi.org/10.7554/eLife.15448


