Sox9 and Sox8 protect the adult testis from male-to-female genetic reprogramming and complete degeneration
- Universidad de Granada, Spain
- University of Freiburg, Germany
- Facultad de Ciencias, Universidad de Granada, Spain
- University of California, San Diego, United States
Figures
Figure 1 with 7 supplements
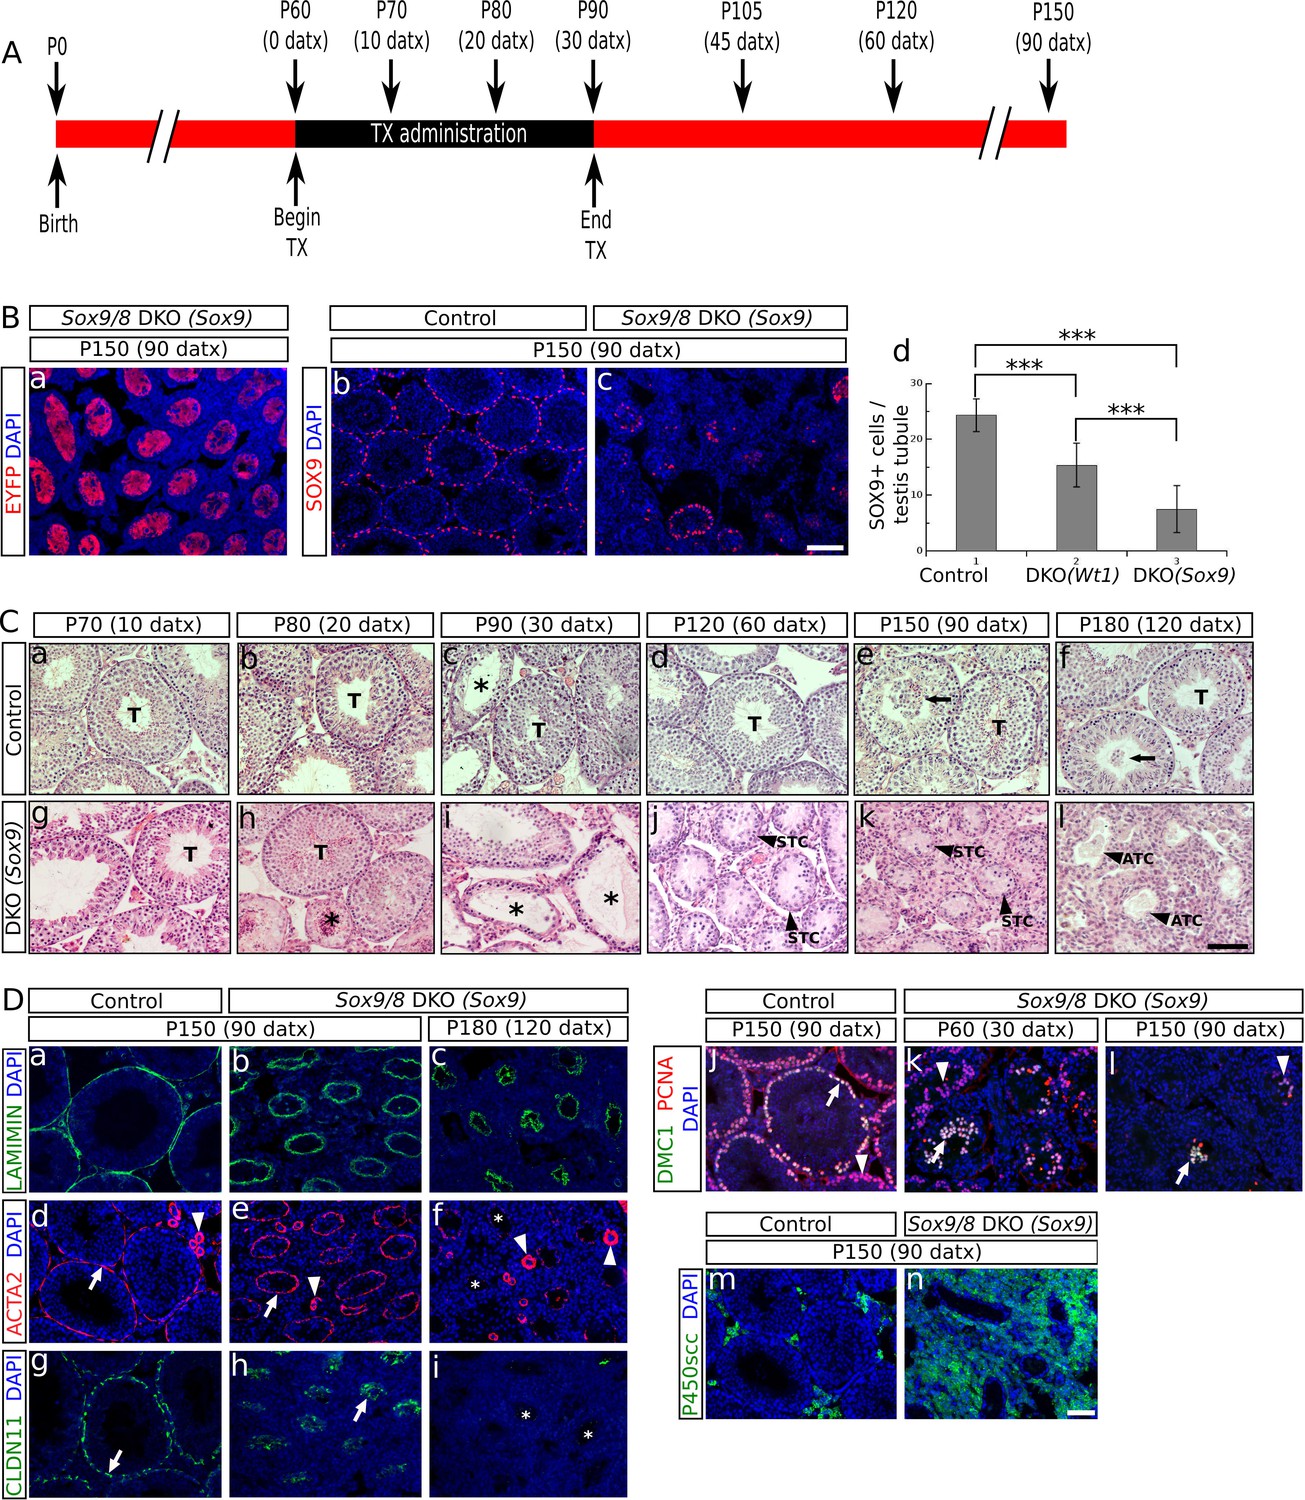
Sox9 and Sox8 maintain the function and integrity of the adult mouse testis.
(A) Diagram illustrating the time course of TX administration. Mice were fed with a TX-supplemented diet during one month, between P60 (0 datx) and P90 (30 datx). After this period, mice were fed with a normal diet. The main stages studied in this work are depicted. (B) Analysis of the Cre-recombination efficiency in Sox9/8 DKO (Sox9) mice at p150 (90 datx). (a) EYFP is widely expressed in SC-DKO testis cords. At the same stage, the number of SOX9+ cells in the control (Sox9f/f;Sox8-/-) (b) is clearly higher than in the mutant (c). (d) Comparisons of the mean number of SOX9+ cells per transversal testis tubule section in control (Sox9f/f;Sox8-/-) and mutant testes. All pairwise comparisons provided statistically significant differences (two tail test, p<0.001 in all cases). (C) Time-course of testis regression in Sox9/8 DKO (Sox9) mice. Representative micrographs are shown for both TX-treated controls (Sox9f/f;Sox8-/-) (a–f) and Sox9/8 DKO (Sox9) mice (g–l) between p70 (10 datx) and P180 (120 datx). T, normal seminiferous tubules; arrows indicate desquamated germ cells; asterisks mark testis tubules showing signs of degeneration (from enlarged lumen to Sertoli cell-only condition); STC, shrunken testis cords; ATC acellular testis cords. (D) Analysis of somatic (a–i and m–n) and germ cell (j–l) molecular markers. Immunofluorescence for LAMININ (a–c), ACTA2 (d–f) and CLAUDIN11 (g– i) in both P150 (90 datx) TX-treated control (Sox9f/f;Sox8-/-) (a, d and g) and SC-DKO testes at P150 (90 datx) (b, e and h) and P180 (120 datx) (c, f and i). Arrows mark seminiferous tubule expression of ACTA2 (d and e) and Claudin11 (g and h); arrowheads mark arterial expression of ACTA2 (d–f). Asterisks mark testis cords lacking ACTA2 (f) or Claudin11 (i) expression. Double immunofluorescence for PCNA and DMC1 showing the time-course of spermatogenesis reduction in the testes of both P150 (90 datx) TX-treated control (Sox9f/f;Sox8-/-) (j) and P90 (30 datx) and P150 (90 datx) SC-DKO mice (k,l). Arrows mark spermatocytes showing colocalization of the two proteins; arrowheads mark proliferating spermatogonia expressing PCNA but not DMC1. Expression of P450SCC (green fluorescence) in Leydig cells of both TX-treated control (Sox9f/f;Sox8-/-) (m) and SC-DKO (n) testes at P150 (90 datx). Scale bars in Bc, Cl and Dn represent 100 µm for pictures in B, 50 µm for those in C and 50 µm for those in D, respectively.
-
Figure 1—source data 1
Comparison of the number of SOX9+ cells per testis tubule in both SC-DKO mutants and TX-treated controls (Sox9f/f;Sox8-/-).
- https://doi.org/10.7554/eLife.15635.004
Figure 1—figure supplement 1
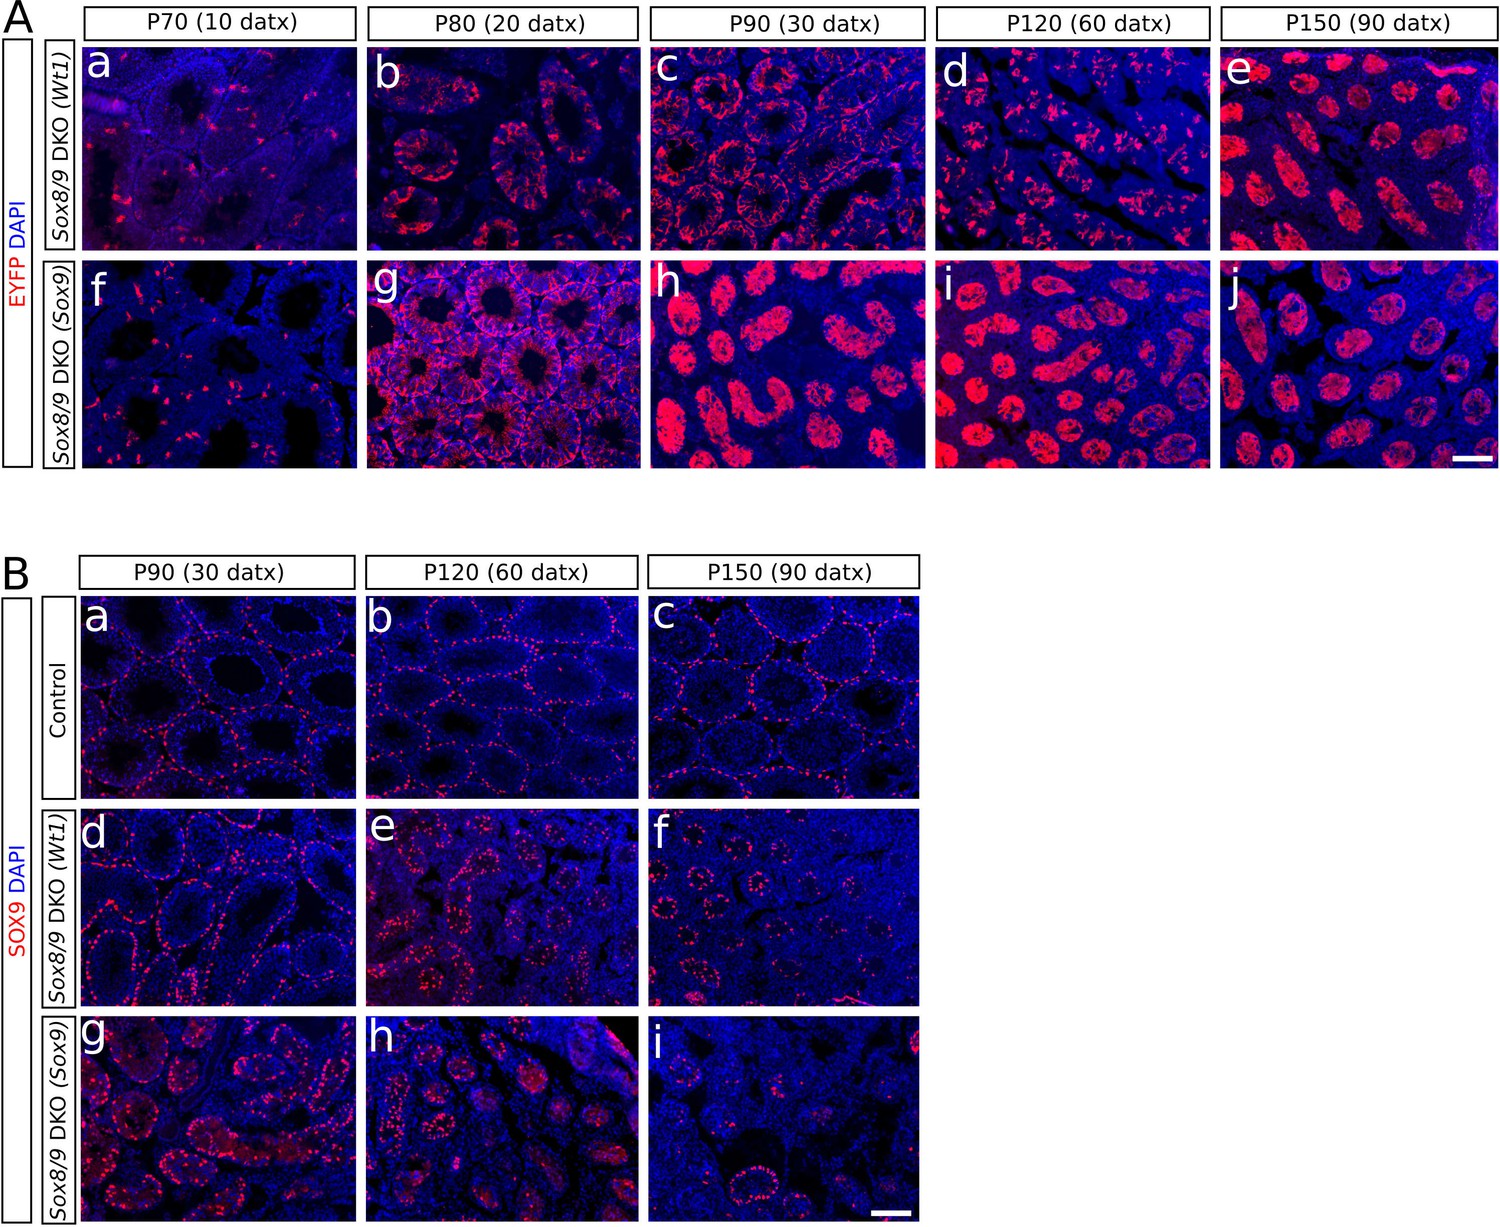
Analysis of the CRE-recombination efficiency in SC-DKO mice.
(A) Immunostaining of the EYFP protein in mutant mice at different times-points after the initiation of the TX treatment. The number of cells expressing EYFP increases with time (from a to e and from f to j). (B) Immunostaining for SOX9 in control (Sox9f/f;Sox8-/-) (a, b and c) and SC-DKO testes (d–i) at different time points after the initiation the TX treatment. The number of SOX9+ cells decreases with time. Scale bar in Aj and Bi represents 100 μm in A and B respectively.
Figure 1—figure supplement 2
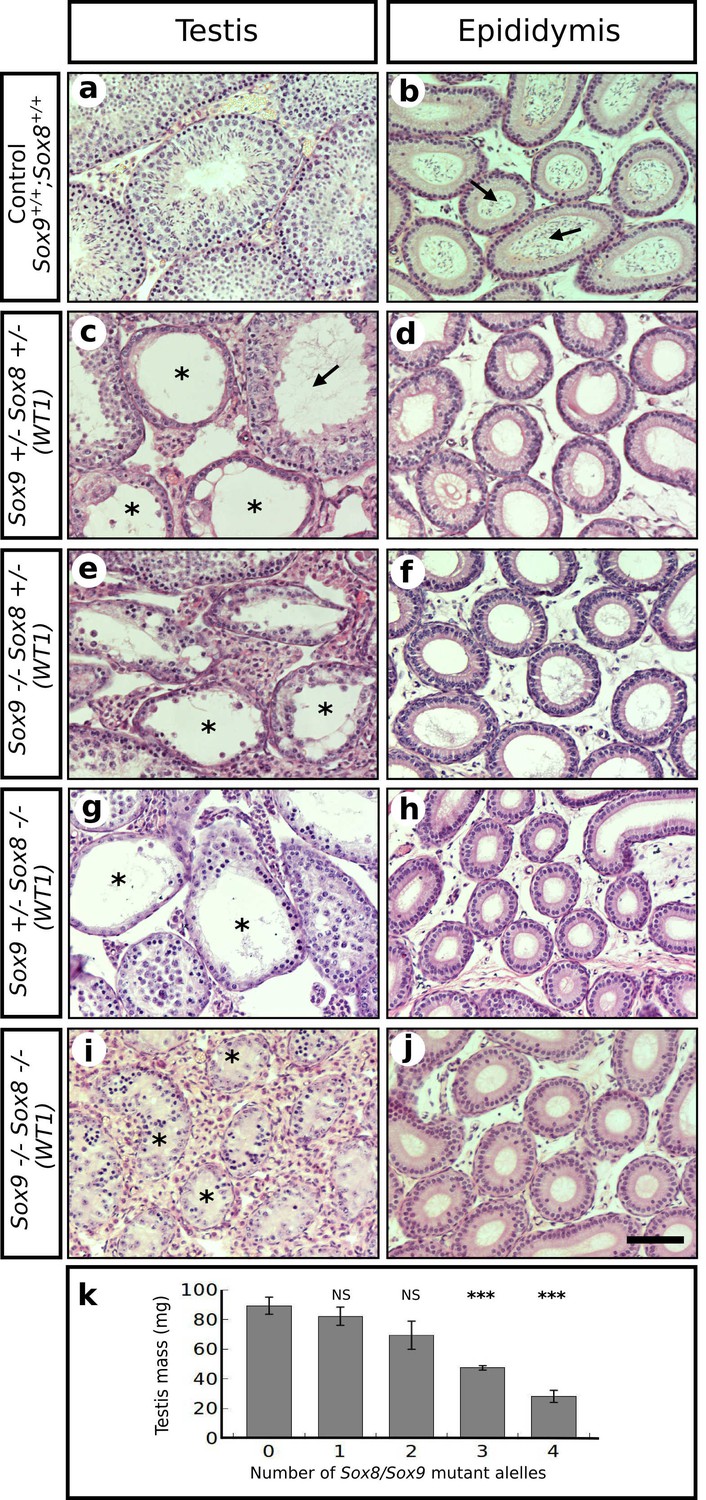
Redundant role for Sox9 and Sox8 in the maintenance of adult testis cord architecture.
Haematoxilin-eosin stained transversal sections of P120 testes (left column) and epididymides (right column) from control mice (a–b) and four different types of Sox9/8 DKO (Wt1) mice differing in the number of Sox9/8 mutant alleles 60 days after TX administration during 5 days with a feeding-gauge needle (c–j). Mutant mice exhibited various degrees of testis regression correlating with the number of mutated alleles. Double homozygote mutants exhibited the highest degree of testicular degeneration, with all seminiferous tubules transformed into sterile, solid testis cords (Ai). Seminiferous tubules from control testes were normal, whereas those from mutant mice showed several abnormalities including enlarged lumen (arrow in c), and different degrees of germ cell depletion (asterisks in c, e, g, and i). Only control epididymides contained abundant sperm (arrows in b), whereas those from mutant mice were completely sterile (d, f, h, and j). Correspondingly, the testis mass of mutant mice decreased as the number of Sox9/8 mutant alleles increased in their genotypes (k). Scale bars shown in j represents 50 μm for all micrographs.
Figure 1—figure supplement 3

Relative abundance of the most relevant morphological features observed in the testes of P120 control and Sox9/8 mutant mice differing in the number of Sox9/8 mutant alleles 60 days after TX administration during 5 days with a feeding-gauge needle.
Categories of relative abundance: (−) not present, (+) sporadic, (++) scarce, (+++) abundant, (++++) generalized.
Figure 1—figure supplement 4
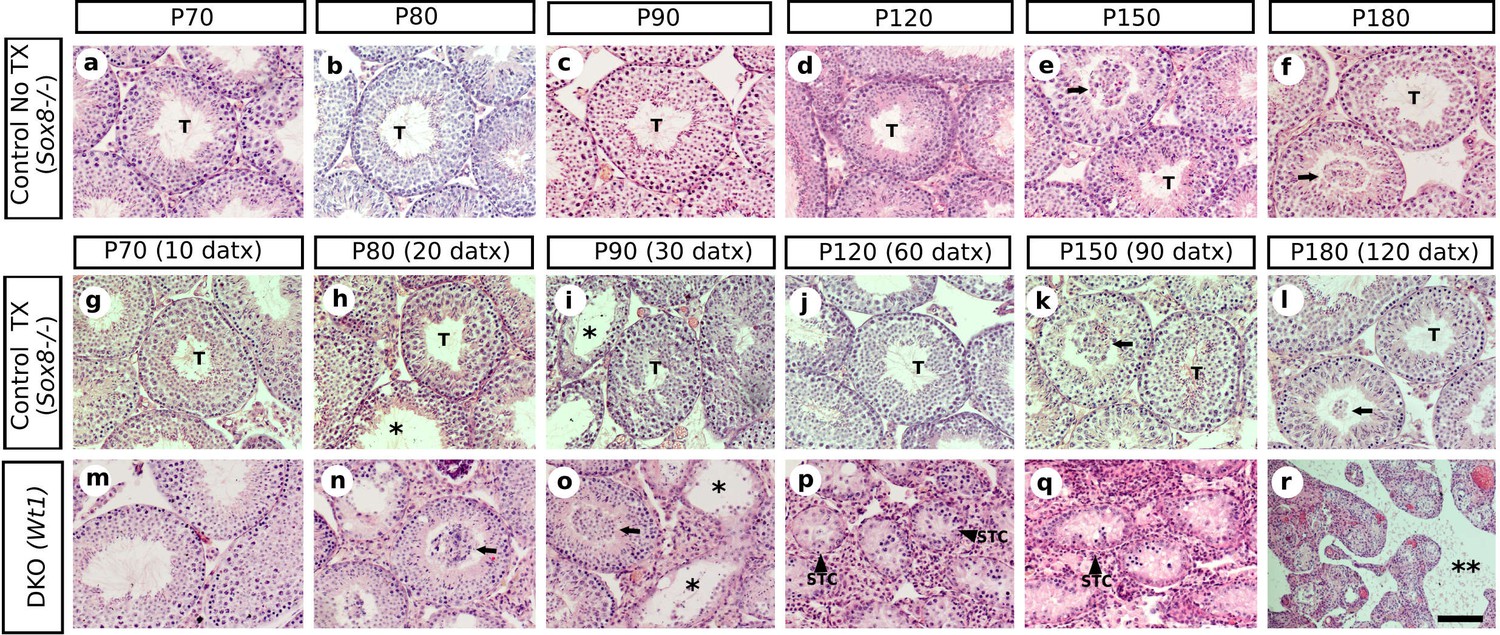
Time course of the testis phenotype of control and SC-DKO (Wt1) mice.
Representative micrographs of H&E stained sections of non-treated Sox8-/- (a–f), TX-treated Sox8-/- (g–l) and TX-treated Sox8/9 DKO (Wt1) (m–r) mouse testis at different time-points. T, normal testis tubules; arrows indicate desquamated germ cells; asterisks mark testis tubules showing some degree of degeneration; double asterisk mark acellular interstitial space; STC shrunken testis cords. Scale bars in Ar represents 50 μm for all micrographs.
Figure 1—figure supplement 5
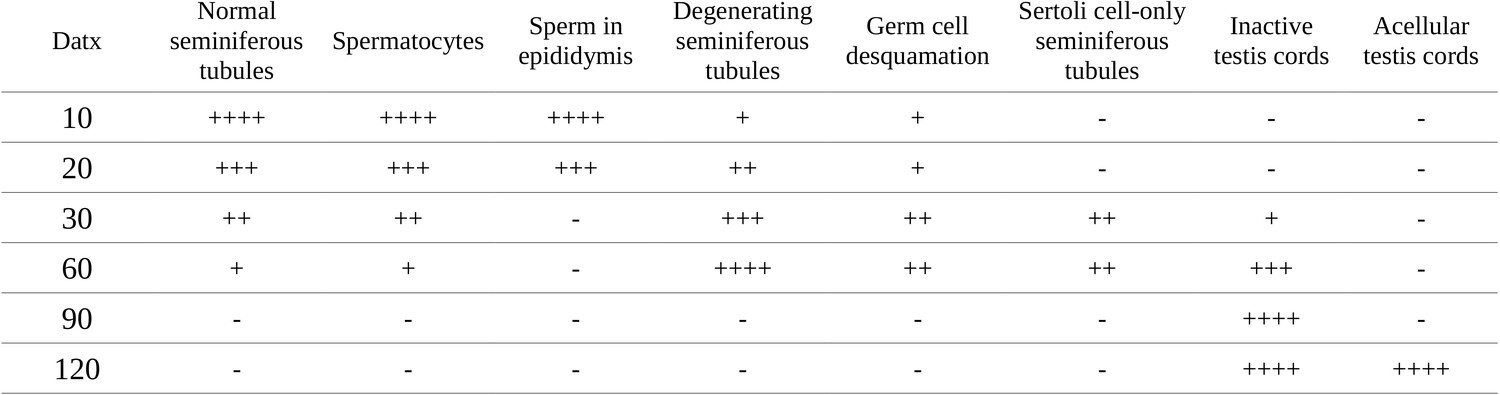
Relative abundance of the most relevant morphological features observed throughout the timecourse of testis regression in double Sox8/Sox9 mutant mice.
Categories of relative abundance: (−) not present, (+) sporadic, (++) scarce, (+++) abundant, (++++) generalized.
Figure 1—figure supplement 6
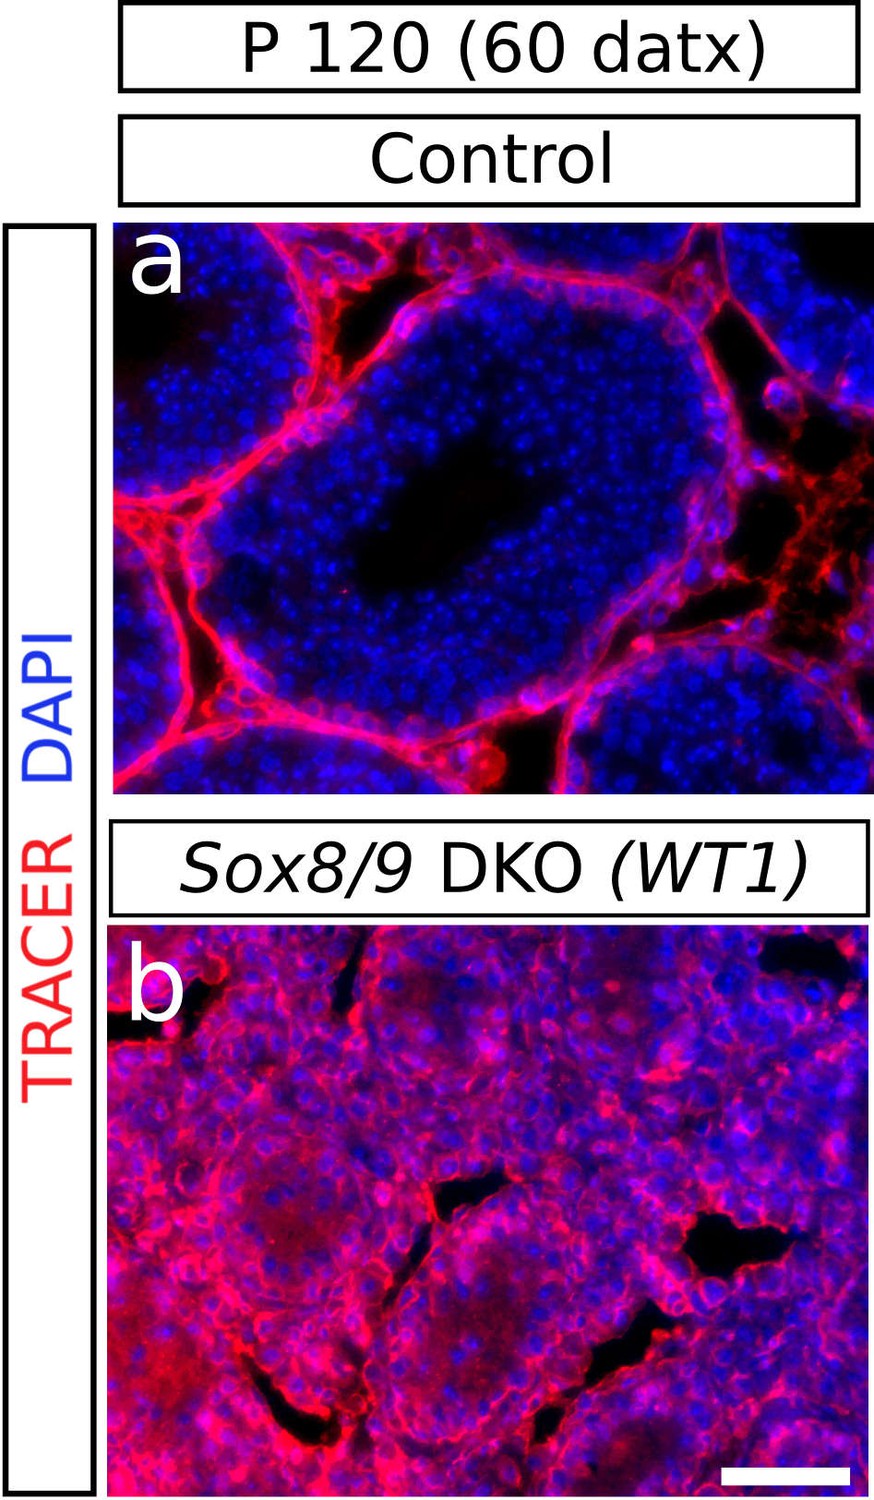
Functional status of the BTB in Sox9/8 DKO testes.
The location of a biotin tracer (red fluorescence) shows that the BTB is impermeable in the control (Sox9f/f;Sox8-/-) testis (a) as it did not enter into the adlumninal compartment of the seminiferous tubules, whereas it is permeable in the mutant (b), where the tracer can be seen also inside the tubules. Scale bar in b represent 50 μm for a and b.
Figure 1—figure supplement 7

Expression bar plots of two adult Leydig cell markers.
Hsd3b1: 3β-hydroxysteroid dehydrogenase; Insl3: Insulin-Like 3. Data obtained from our transcriptome analysis.
Figure 2 with 4 supplements

Genetic reprogramming in somatic cells of adult Sox9/8 SC-DKO (Sox9).
(A) Expression of FOXL2 (green fluorescence) in P150 (90 datx) TX-treated control (Sox9f/f;Sox8-/-) (a) and in Sox9/8 SC-DKO (Sox9) mouse testes analyzed at P90 (30 datx) (b), P105 (45 datx) (c), and P150 (90 datx) (d) as well as in a P 90 control ovary (e). (B) Heatmap showing the 12,380 genes found to be differentially expressed at alpha < 0.005 when comparing control (Sox9f/f) and mutant adult gonads. The log2(FPKM+1) of each gene in each condition has been divided by the corresponding value in control testis. Gene expression has not been altered by the TX treatment. Red colors indicate genes upregulated with respect to their expression levels in control testis and green colors indicate downregulated genes. (C) Expression heatmaps of selected ovarian somatic-specific and oocyte-specific genes. (D) Expression bar plots of six relevant ovarian somatic-specific genes upregulated in mutant testes. (E) Aromatase (red) and FOXL2 (green) immunofluorescence staining of TX-treated control (Sox9f/f;Sox8-/-) testis (a), mutant testes (b–d), and control ovary (e). Arrows mark reprogrammed Sertoli cells showing simultaneous expression of Aromatase and FOXL2. Scale bar shown in Ae represents 150 µm in A and 75 µm in E.
-
Figure 2—source data 1
Genes with significant differential expression among untreated controls, TX-treated controls, Sox8/9 SC-DKO mutants and control ovary at P150 (90 datx) identified from the bioinformatic analysis of our transcriptome.
- https://doi.org/10.7554/eLife.15635.013
Figure 2—figure supplement 1

Expression of Foxl2 in somatic cells of adult Sox9/8 DKO (Wt1).
Immunofluorescence for FOXL2 (green fluorescence) in P150 (90 datx) TX-treated control (Sox9f/f;Sox8-/-) (a) and Sox9/8 DKO (Wt1) mouse testes analyzed at P90 (30 datx) (b), P105 (45 datx) (c), and P150 (90 datx) (d) as well as in a control ovary (e). Scale bar shown in e represents 150 µm for all the micrographs.
Figure 2—figure supplement 2
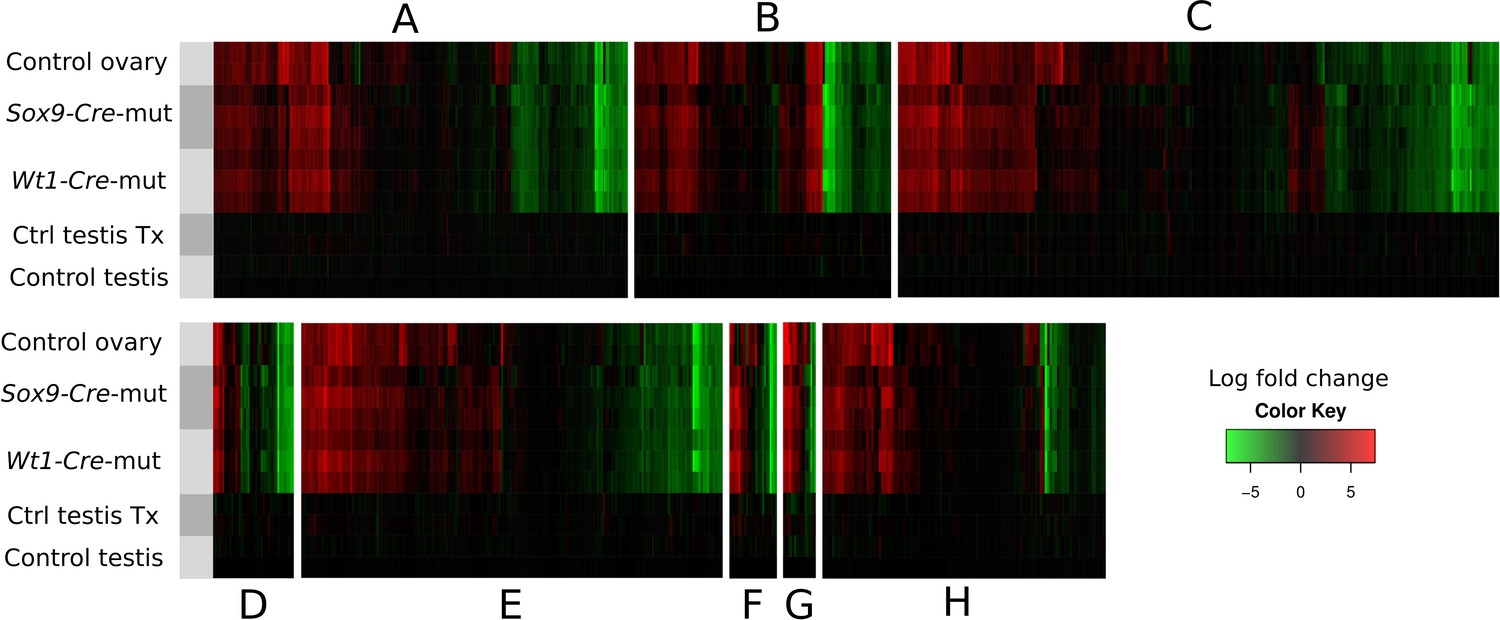
Heatmaps showing the expression of genes involved in 8 selected pathways (A–H), relative to their expression in control testes.
Gene sets where obtained from the Pathway Unification Database except for the Myosin genes Family that where obtained from the list of differentially expressed genes. The pathways, URL, and number of genes of each paths are as follow: (A) Sertoli-Sertoli Cell Junction Dynamics (http://pathcards.genecards.org/pathway/543) 213 genes (B) Germ Cell-Sertoli Cell Junction Dynamics (http://pathcards.genecards.org/pathway/1181) 140 genes (C) Epithelial Tight Junctions (http://pathcards.genecards.org/pathway/448) 329 genes (D) Regulation of Microtubule Cytoskeleton (http://pathcards.genecards.org/pathway/792) 44 genes (E) Regulation of actin cytoskeleton SuperPath (http://pathcards.genecards.org/card/regulation_of_actin_cytoskeleton) 230 genes (F) Myosin Family 26 genes (G) Cell-extracellular matrix interactions (http://pathcards.genecards.org/pathway/286) 18 genes (H) Cell adhesion molecules (http://pathcards.genecards.org/pathway/1823) 145 genes The complete lists of genes are included in Supplementary file 1.
Figure 2—figure supplement 3
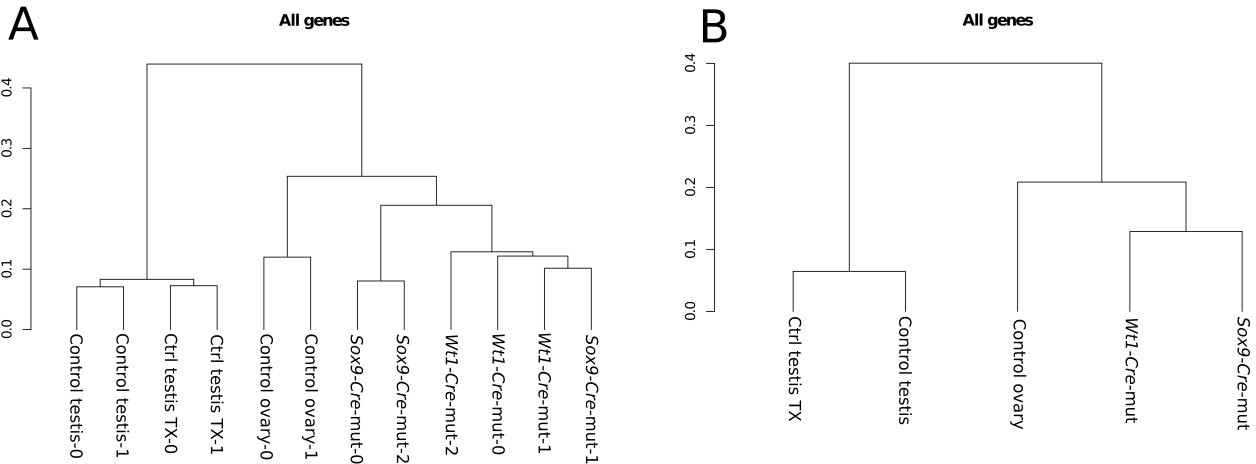
Cluster analysis of (A) replicates and (B) conditions.
The global gene expression patterns of mutants are closer to the expression in ovaries than to that in normal testes. Both controls with and without Tamoxifen treatment also group together as expected.
Figure 2—figure supplement 4
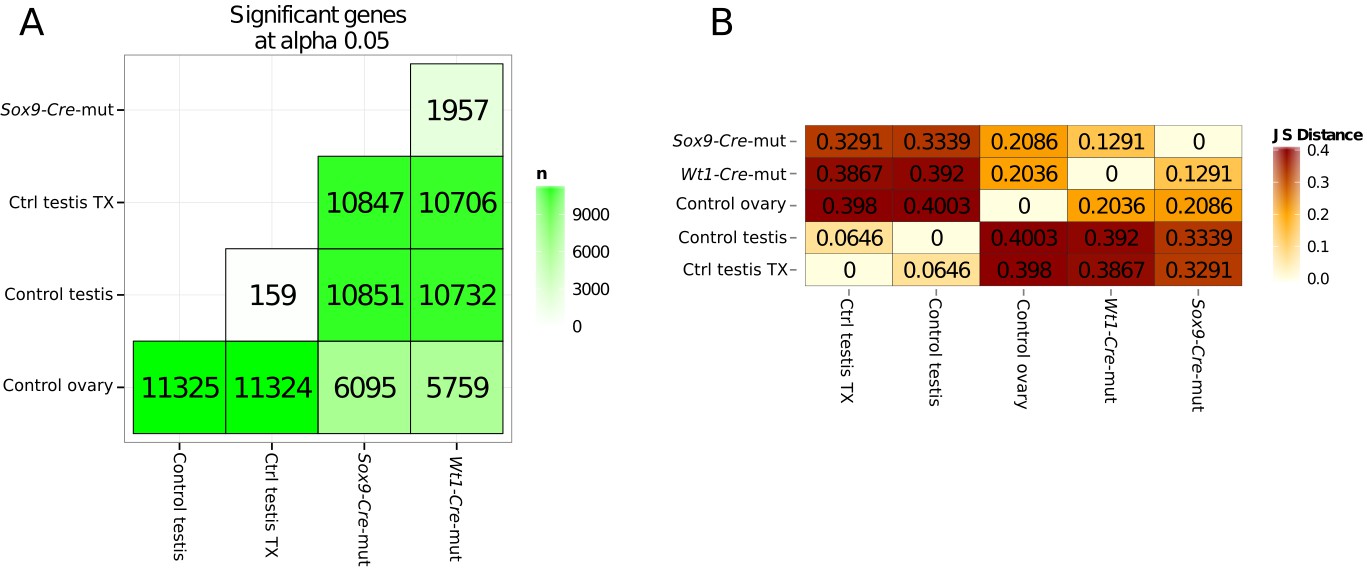
Quantification of genes with differential expression and Jensen–Shannon (JS) distances between conditions.
(A) Number of genes showing differential expression in pairwise comparisons of the different conditions.
(B) Jensen–Shannon (JS) distances heatmap between conditions.
Figure 3
Identification of the somatic cells expressing FOXL2.
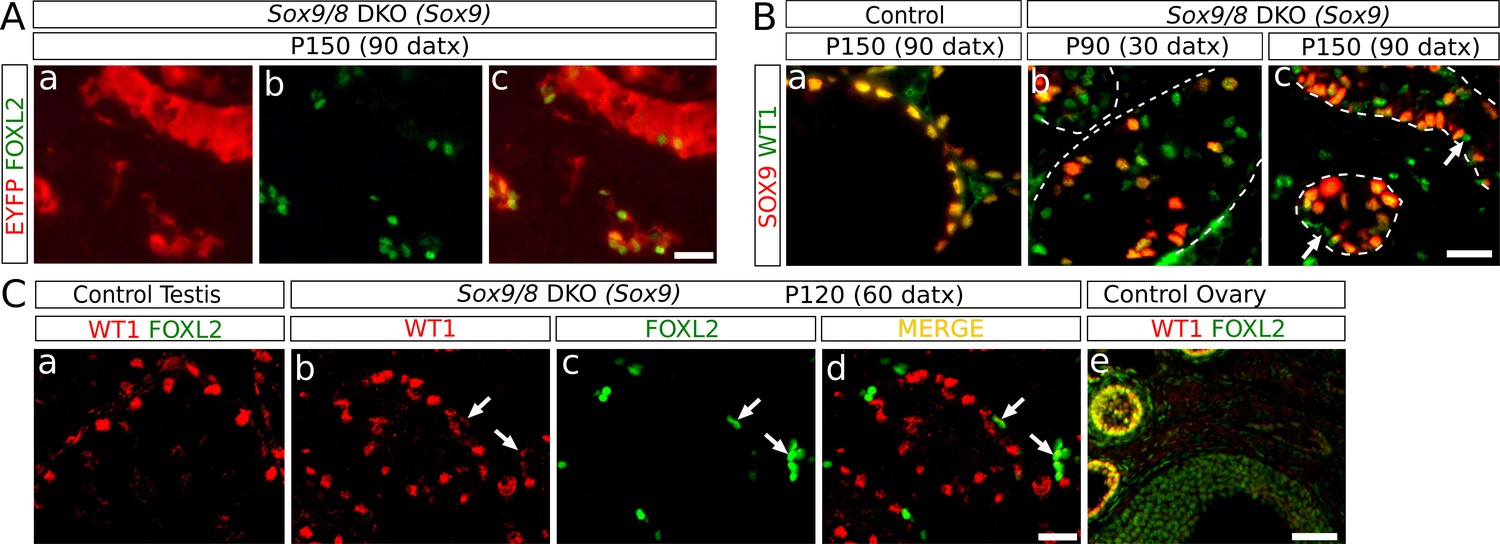
(A) Double immunofluorescence for FOXL2 (green, nuclear) and EYFP (red, cytoplasmic) (B) Double immunofluorescence for SOX9 and WT1 in P150 (90 datx) TX-treated control (Sox9f/f;Sox8-/-) testes (a) and Sox9/8 SC-DKO testes analyzed at P90 (30 datx) (b) and P150 (90 datx) (c). Dashed lines delineate the seminiferous tubules contour. Arrows mark mutant cells expressing WT1 but not SOX9. (C) Double immunofluorescence for FOXL2 and WT1 in both TX-treated control (Sox9f/f;Sox8-/-) (a) and Sox9/8 SC-DKO mutant testes analyzed at P120 (60 datx) (b–d), as well as in a control ovary (e). Arrows point to mutant cells expressing both proteins. Scale bar in Ac represents 25 μm in A; scale bar in Bc represents 25 μm in B; scale bar in Cd represents 25 μm in Ca–d and scale bar in Ce represents 100 μm.
Figure 4 with 1 supplement
Role of Dmrt1 in Sertoli-to-granulosa cell transdifferentiation.
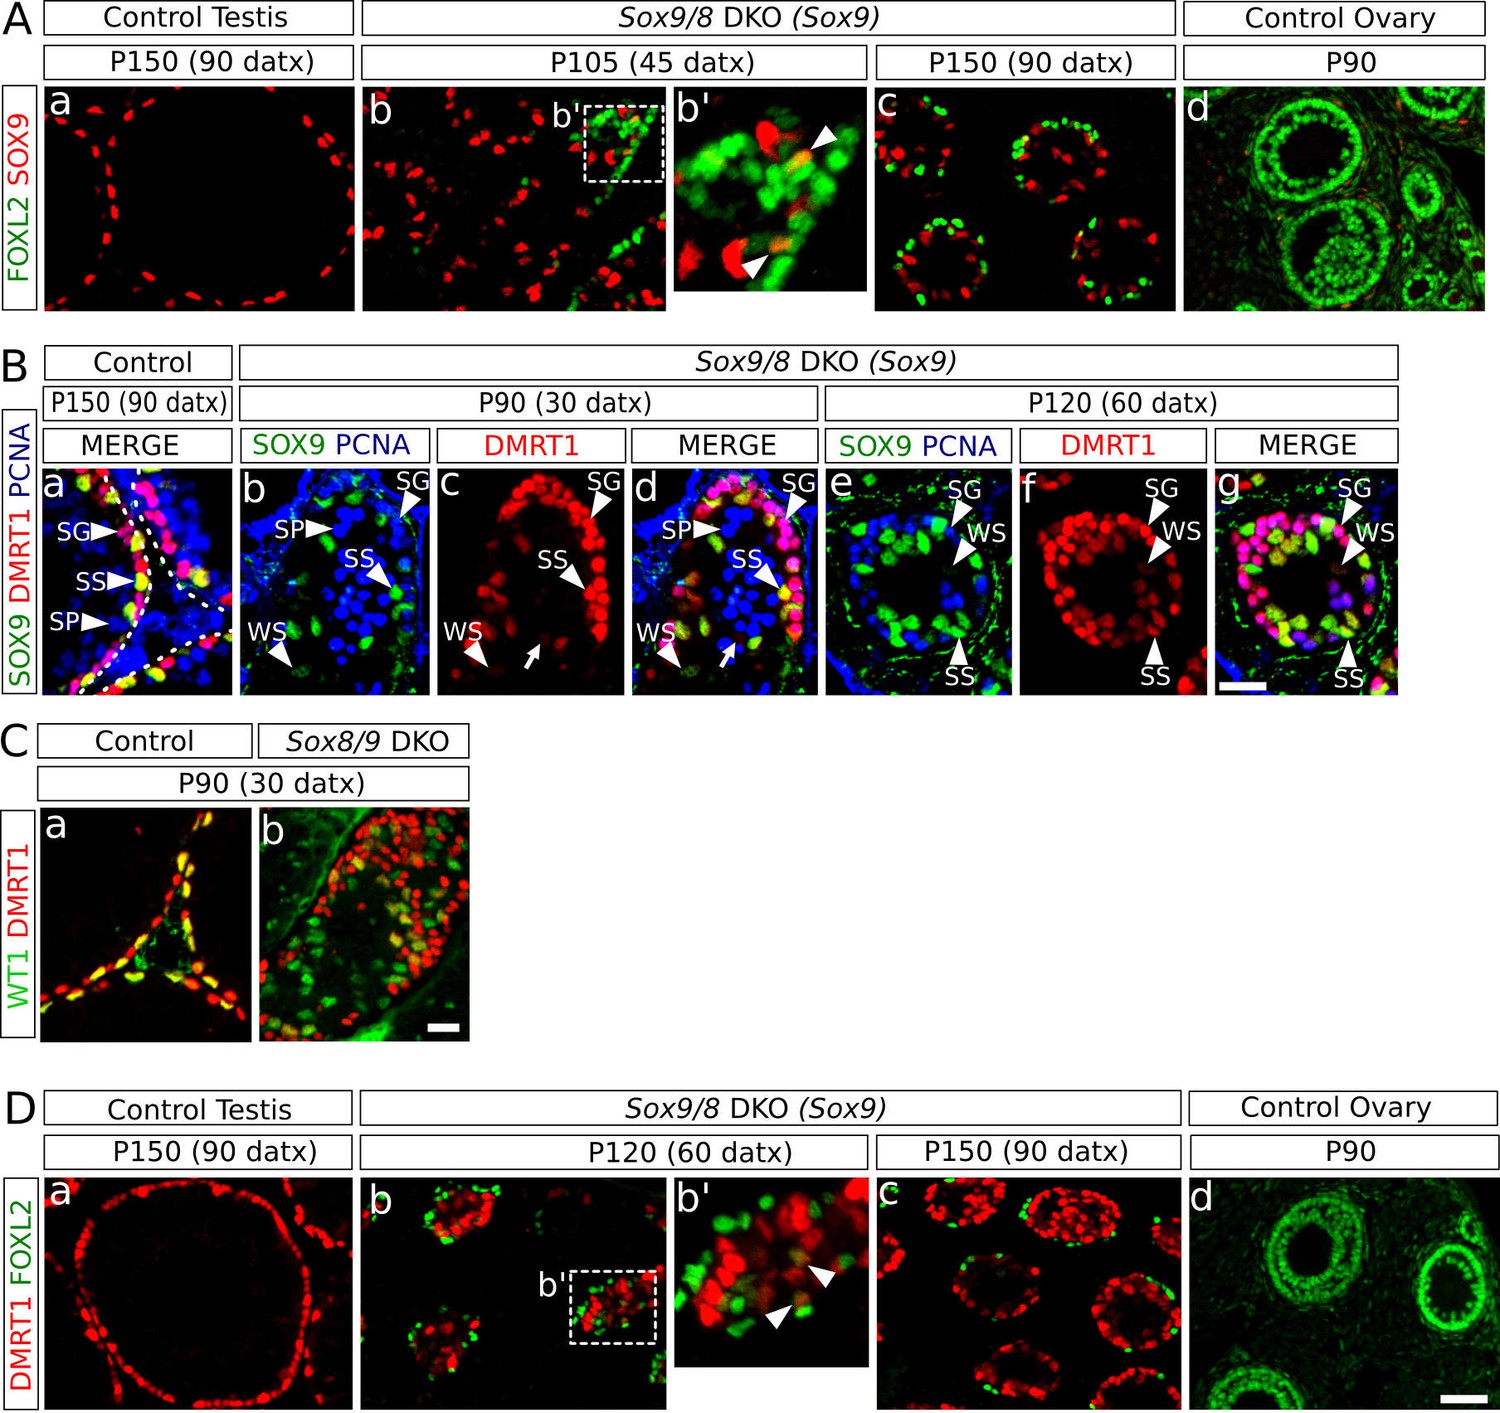
(A) Double immunofluorescence for SOX9 and FOXL2 in TX-treated control (Sox9f/f;Sox8-/-) testis (a), Sox9/8 SC-DKO mutant testes analyzed at P105 (45 datx) and P150 (90 datx) (b,c) and a control ovary (d) (b' is a higher magnification of the area marked in b). Colocalization of SOX9 and FOXL2 was rare and the few observed cells showed weak fluorescence for both proteins (arrowheads in b'). (B) Triple immunofluorescence for SOX9, DMRT1 and PCNA (germ cell marker) in P150 (90 datx) TX-treated control (Sox9f/f;Sox8-/-) testes (a) and Sox9/8 SC-DKO mutant testes at P90 (30 datx) (b–d) and P120 (60 datx) (e-g). Different cell types can be identified: SS: Sertoli cells with strong staining for both DMRT1 and SOX9 (SOX9+ DMRT1+ PCNA-; strong yellow); WS: Sertoli cells with weak staining for both DMRT1 and SOX9 (SOX9+ DMRT1+ PCNA-; pale yellow); SP: spermatocytes (SOX9- DMRT1- PCNA+; blue); SG: proliferating spermatogonia (SOX9- DMRT1+ PCNA+; purple), arrow (SOX9- DMRT1+ PCNA-; red). Non-proliferating spermatogonia could be confused in Sox9/8 SC-DKO mice with recombined DMRT1+ SOX9- Sertoli cells in which SOX9 already disappeared, but the number of the former cell type is so low that they can be ignored. (C) Double immunofluorescence for DMRT1 and WT1 in P90 (30 datx) TX-treated control (Sox9f/f;Sox8-/-) (a) and mutant testes (b). (D) Double immunofluorescence for DMRT1 and FOXL2 in P150 (90 datx) TX-treated control (Sox9f/f;Sox8-/-) testis (a), Sox9/8 SC-DKO mutant testes (b–c) and control ovary (d) (b' is a higher magnification of the area marked in b). Colocalization of both proteins was rare (arrowheads in b'). Scale bar in Dd represent 50 µm in A and D; scale bar in Bg represents 25 µm in B; scale bar in Cb represents 50 µm in C.
Figure 4—figure supplement 1
Role of Dmrt1 in Sertoli-to-granulosa cell transdifferentiation.
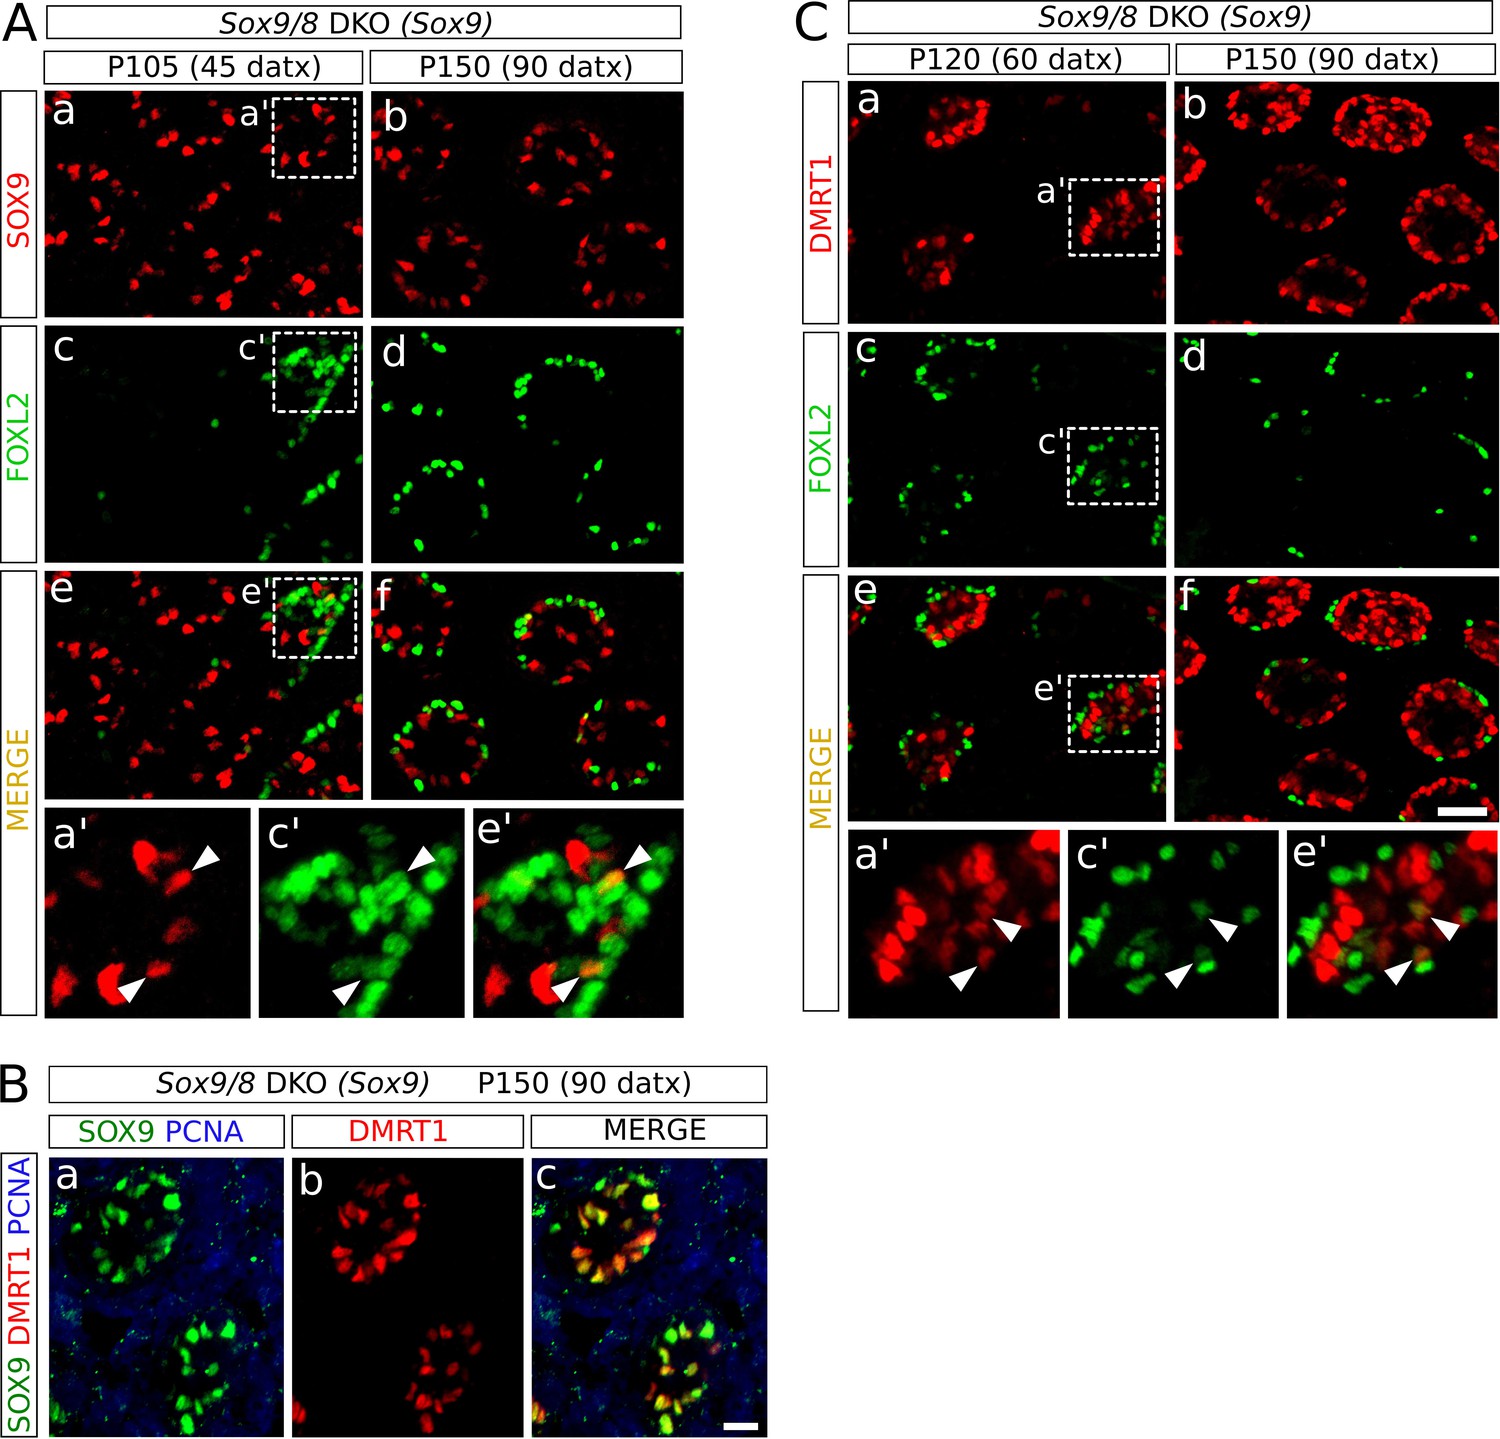
Double immunofluorescence for SOX9 and FOXL2 (A), and for FOXL2 and DMRT1 (C) as shown in Figure 4 but showing separated the single color channels (a', c' and e' are higher magnifications of the areas marked in a, c and e in both A and C). Triple immunofluorescence for SOX9, DMRT1 and PCNA (B) of P150 (90 datx) Sox9/8 DKO (Sox9) testis. Arrowheads in A and C indicate colocalization of both proteins. Scale bar in Cf represent 50 μm in A and C; scale bar in Bc represents 25 μm in B.
Figure 5
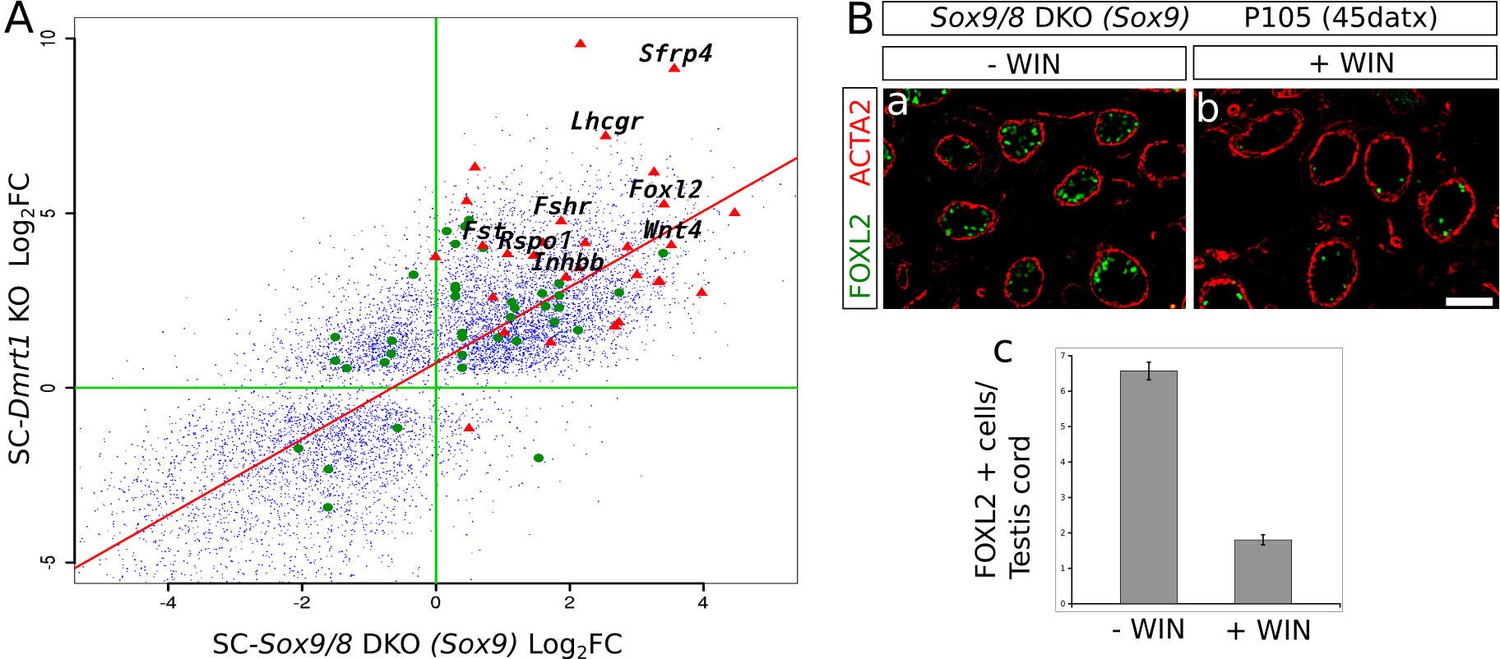
Sox9 and Dmrt1 act in the same pathway during Sertoli-to-granulosa transdifferentiation.
(A) Log2 fold change scatterplot comparing the microarray data from the P28 SC-Dmrt1 KO testes reported by Matson et al., 2011b; GEO accession: GSE27261) with the RNA-seq data from our P150 (90 datx) SC-Sox9/8 DKO testes, including 8910 genes showing significant differential expression respect to normal testis in both Dmrt1 and Sox9/8 mutants (blue dots). Among these, green dots represent 24 genes belonging to the all-trans-retinoic acid-mediated apoptosis path and RA receptors-mediated signaling from the PathCards database. Red triangle show 29 of the ovarian somatic specific genes included in Figure 2C. The names of some relevant genes are indicated. Regression line is shown in red (intecept = 0.7112, slope = 1.0883). (B) Effect of the treatment of Sox9/8 SC-DKO mice with WIN 18,644 on Sertoli-to-granulosa cell transdifferentiation. FOXL2-positive cells (green fluorescence) were much more abundant in untreated (a) than in treated mutant testes (b). The number of positive cells per testis/cord section was 3.5-fold higher in untreated mice (c). The ACTA2 signal (red fluorescence) permitted to delineate the testis cords in a and b. Scale bar in Bb represents 100 µm in Ba–b.
-
Figure 5—source data 1
List of 8910 genes showing significant differential expression respect to normal testis in both Dmrt1 and Sox9/8 mutants.
- https://doi.org/10.7554/eLife.15635.022
-
Figure 5—source data 2
Log2 fold change of expression of both Dmrt1 and Sox9/8 mutants respect to controls in a set of genes belonging to the all-trans-retinoic acid-mediated apoptosis path and RA receptors-mediated signaling from the PathCards database.
- https://doi.org/10.7554/eLife.15635.023
-
Figure 5—source data 3
Comparison of the number of FOXL2+ cells per transversal testis cord section in Sox9/8 DKO (Sox9) WIN 18,446-treated mice and vehicle-injected controls
- https://doi.org/10.7554/eLife.15635.024
Figure 6
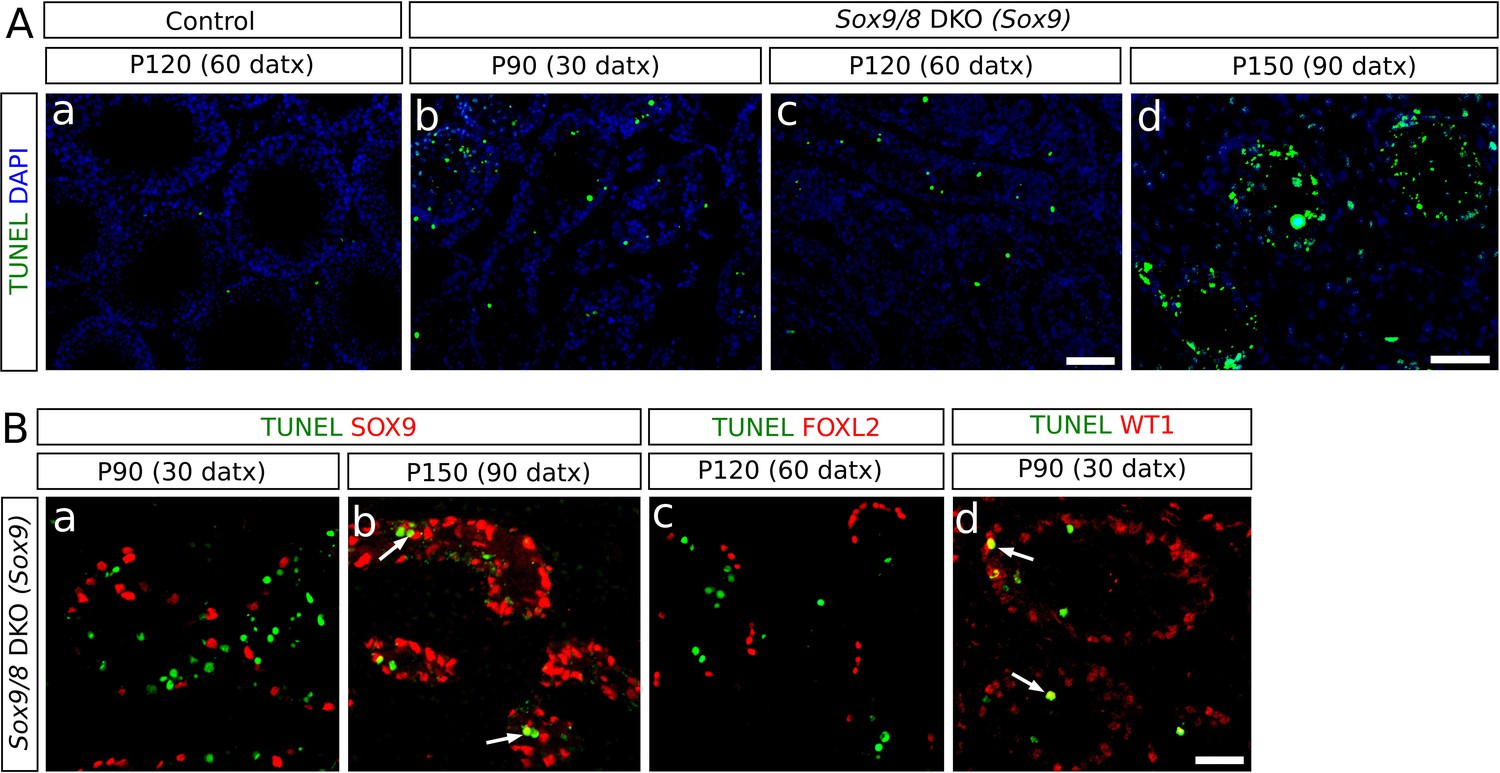
Incidence of apoptosis in Sox9/8 SC-DKO testes.
(A) TUNEL staining in testis sections of TX-treated control (Sox9f/f;Sox8-/-) at P120 (60 datx) (a) and Sox9/8 SC-DKO at different time-points (b–d). (B) Double immunofluorescence for TUNEL and three molecular markers: SOX9 [a, (P90 (30datx)) and b, (P150 (90 datx))], FOXL2 (c, P120 (60 datx)), and WT1 (d, P90 (30 datx)). Arrows in b and d mark cells showing coexpression of the two proteins. Scale bar in Ac represents 100 µm for Aa–c; scale bar in Ad represents 50 µm; scale bar in Bd represents 50 µm in B.
-
Figure 6—source data 1
Comparison of the number of TUNEL-positive cells per section area unit in both SC-DKO mutants and TX-treated controls.
- https://doi.org/10.7554/eLife.15635.026
Figure 7
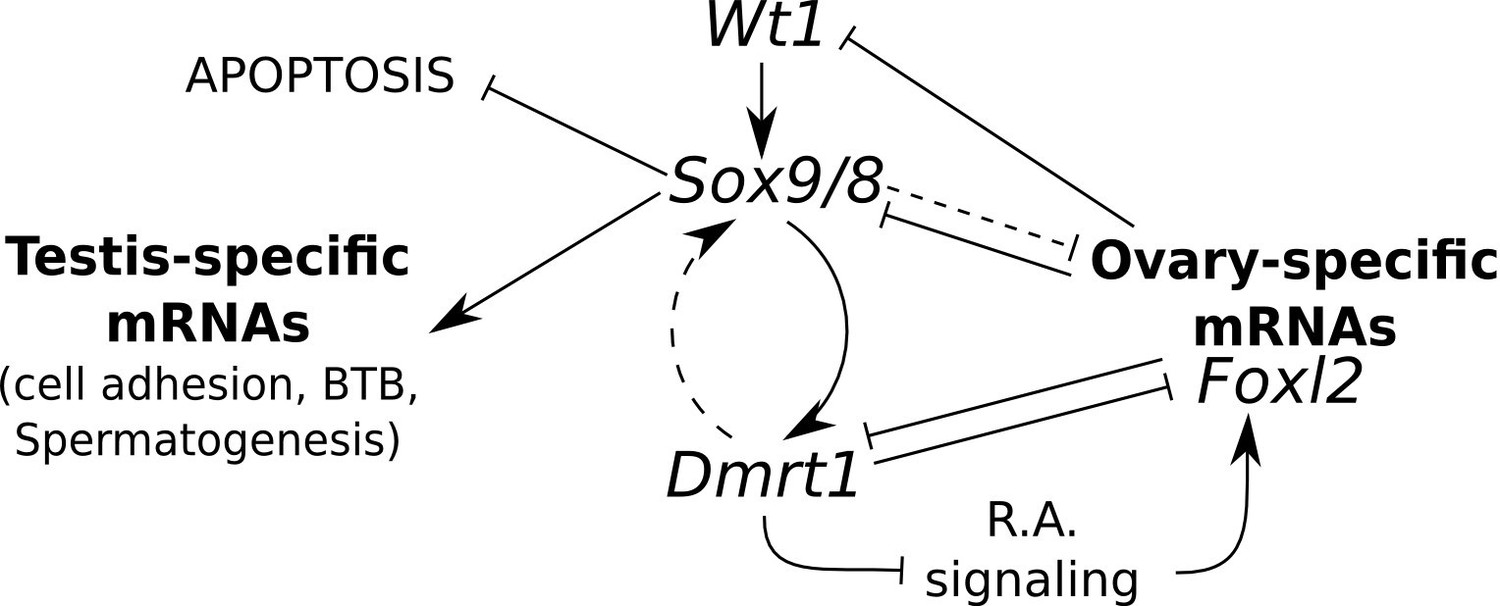
Model for the regulation of mammalian sex maintenance.
Positive regulation is indicated by arrows. Negative regulation is indicated by perpendicular lines. See text for a detailed explanation.
Figure 8
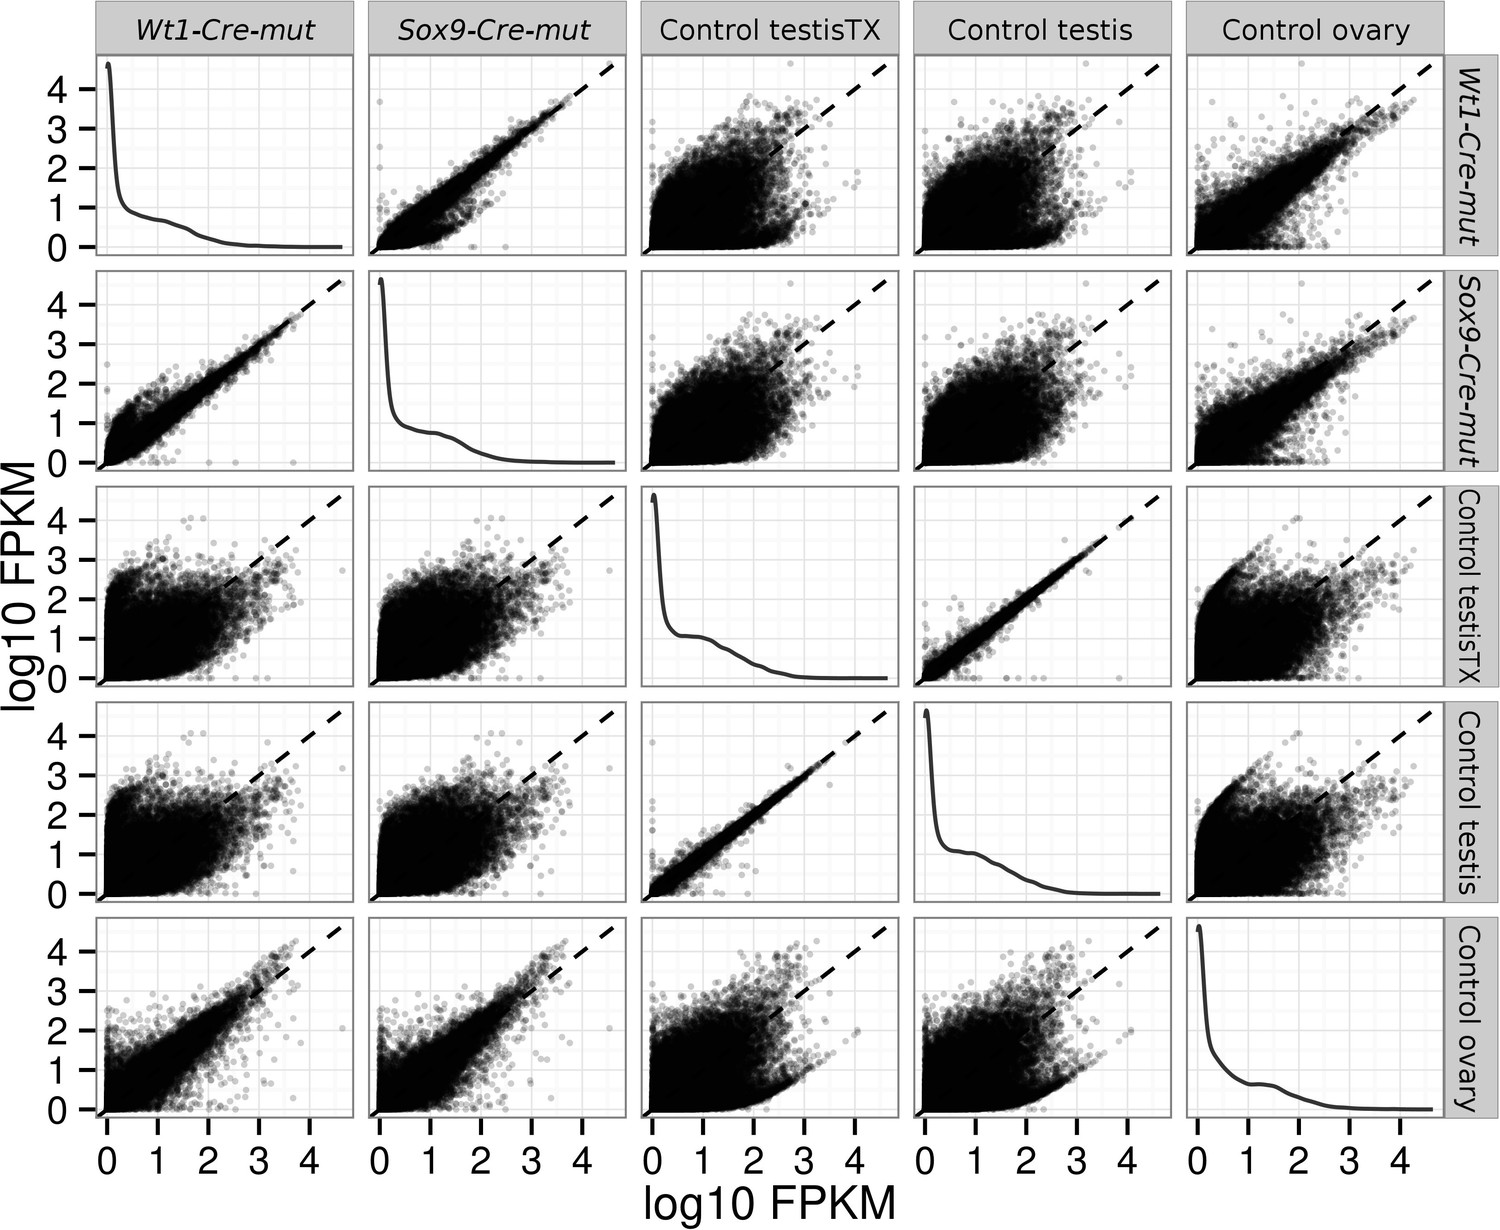
Pairwise scatterplots comparing log10 FPKM between different conditions.
Dispersion is lower when comparing similar conditions (controls, mutants) and higher when comparing mutant with control conditions. Notice that dispersion observed when mutants are compared with ovary is lower than that observed comparing them with any of the testis controls.
Figure 9
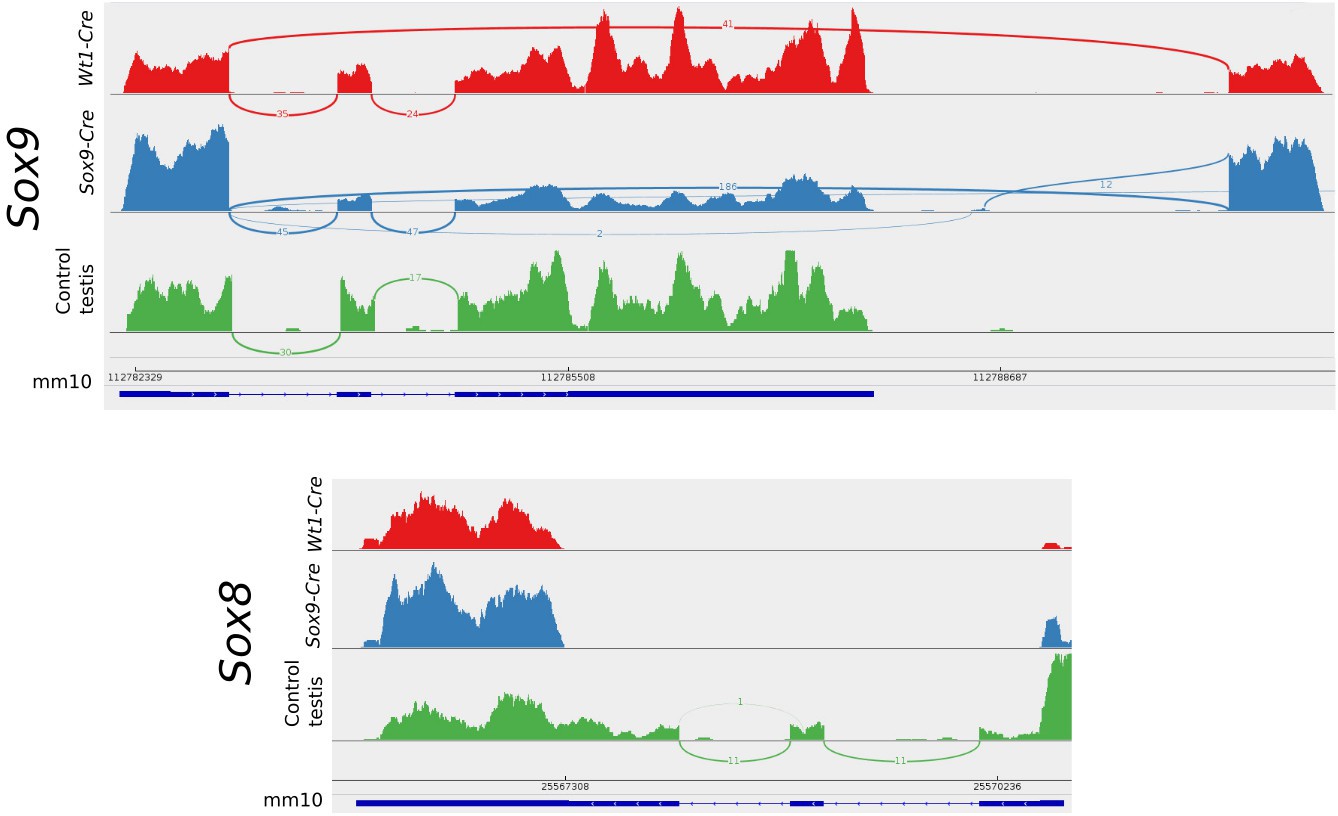
Sashimi plots of the Sox9 and Sox8 genes in mutant and control conditions.
Vertical lines indicate coverage and curved lines indicate splicing. The mm10 row shows the positions of the exons and introns and the translated region as annotated in the mm10 UCSC mouse genome. Aberrant splicing sites where found in mutant but not in control samples. Notice that normal splicing also occurred in mutant animals showing that CRE-recombination efficiency was not 100%.
Tables
Table 1
Antibodies used in this study.
| Gene product | Raised in | Working dilution | References |
|---|---|---|---|
| Laminin | rabbit | 1:100 | Sigma L9393 |
| ACTA2 | mouse | 1:200 | Sigma A2547 |
| Claudin11 | rabbit | 1:100 | Santa Cruz Biotechnology, CA sc-25711 |
| DMC1 | goat | 1:100 | Santa Cruz Biotechnology, CA sc-8973 |
| PCNA | mouse | 1:100 | Santa Cruz Biotechnology, CA sc-56 |
| CYP14A1 (P450scc) | goat | 1:200 | Santa Cruz Biotechnology, CA sc-18043 |
| SOX9 | rabbit | 1:100 | Santa Cruz Biotechnology, CA sc-20095 |
| SOX9 | goat | 1:10 | Santa Cruz Biotechnology, CA sc-17341 |
| WT1 | rabbit | 1:100 | Santa Cruz Biotechnology, CA sc-192 |
| FOXL2 | goat | 1:100 | Abcam ab5096 |
| GFP | rabbit | 1:100 | Novus Biologicals NB600-308 |
| WT1 | mouse | 1:30 | DAKO M3561 (clone 6F-H2) |
| CYP19A1 (Aromatase) | mouse | 1:10 | GeneTex GTX41561 |
| DMRT1 | rabbit | 1:400 | Gift from Dr. Silvana Guioli |
Additional files
-
Supplementary file 1
Complete lists of genes included in the 8 molecular pathways mentioned in Figure 2—figure supplement 2.
- https://doi.org/10.7554/eLife.15635.031
Download links
A two-part list of links to download the article, or parts of the article, in various formats.
Downloads (link to download the article as PDF)
Open citations (links to open the citations from this article in various online reference manager services)
Cite this article (links to download the citations from this article in formats compatible with various reference manager tools)
Sox9 and Sox8 protect the adult testis from male-to-female genetic reprogramming and complete degeneration
eLife 5:e15635.
https://doi.org/10.7554/eLife.15635


