Loss of presenilin function is associated with a selective gain of APP function
- The University of Chicago, United States
Figures
Figure 1 with 2 supplements
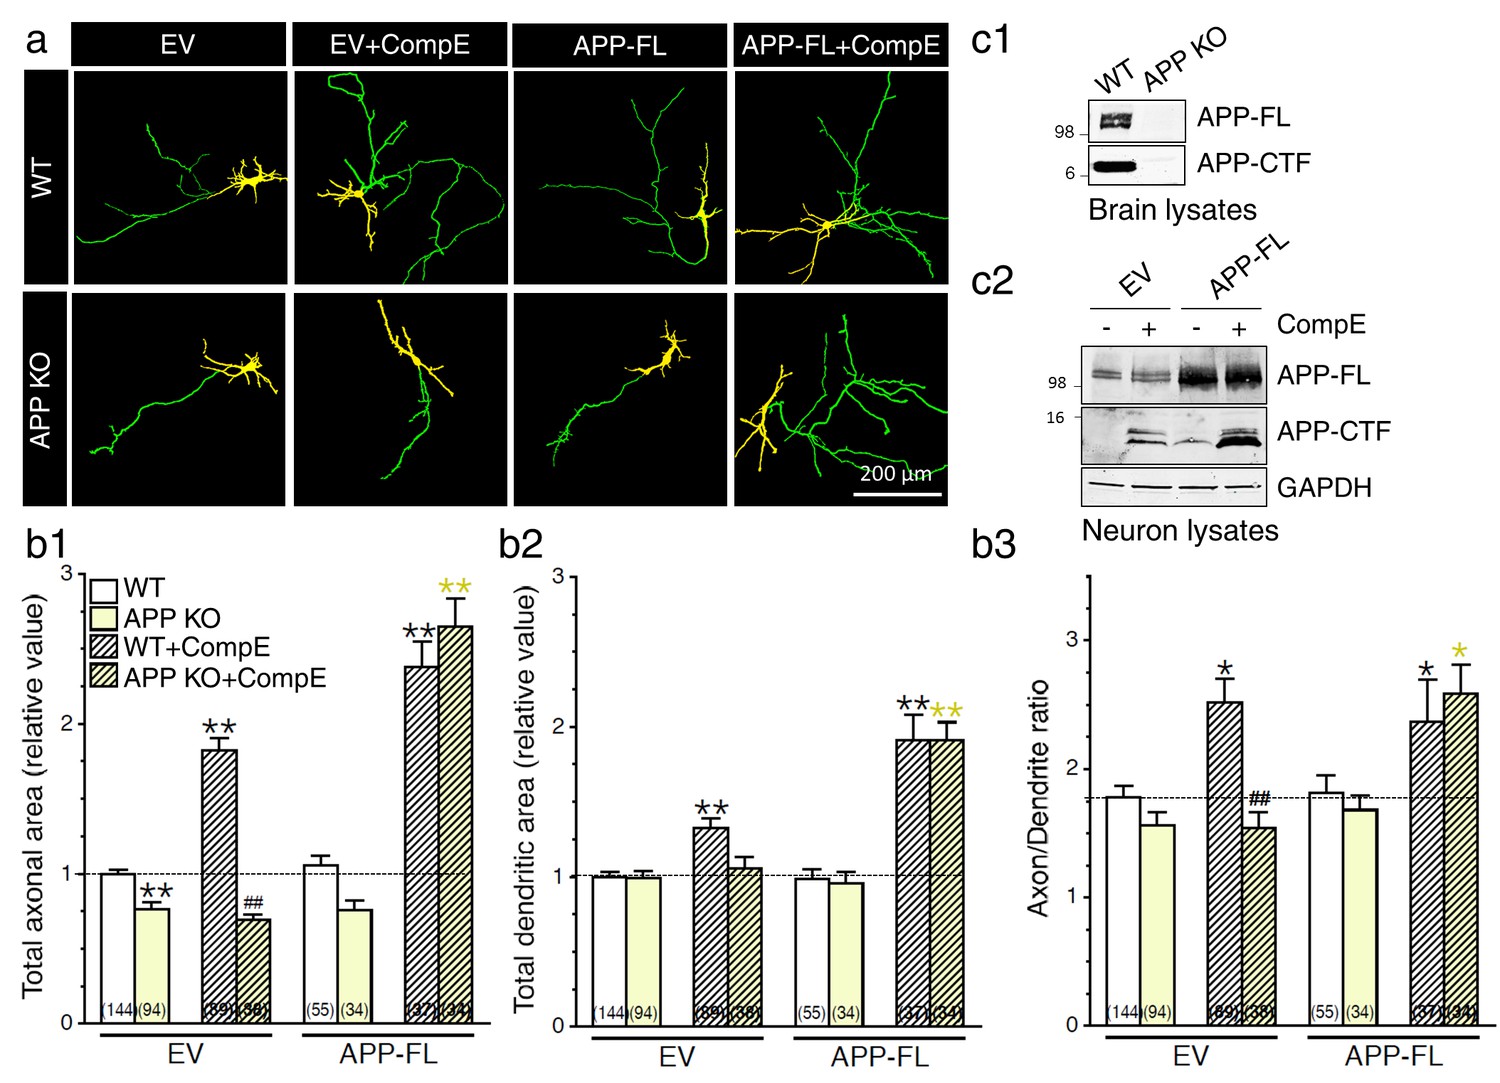
Exuberant axodendritic outgrowth associated with γ-secretase inhibition requires APP expression.
(a) WT or APP KO primary cortical neurons (8 DIV) coexpressing YFP and EV or APP-FL were treated with Compound E (CompE 10 nM, 24 hr) and immunostained with MAP2 antibody. (a) Representative overlay images of YFP and MAP2 staining reveal axon (green) and dendrites (yellow). (b) Quantitative analysis of neurite outgrowth is represented as relative changes in total axonal area (b1), dendritic area (b2), and axon/dendrite ratio (b3) in treated or untreated neurons with Compound E, expressing either EV or APP-FL as compared to WT-EV control group. (c1) Endogenous APP full-length (APP-FL) and accumulation of APP-CTF were detected by immunoblotting brain lysates from WT and APP KO mice with CTM1 antibody, which recognizes the C-terminus of APP (von Koch et al., 1997). (c2) Accumulation of APP-CTF in WT neurons overexpressing empty vector (EV) or APP-FL is detected by Western blot using a Tris-Tricine gel, before or after treatment with Compound E (CompE: 10 nM, 24 hr). GAPDH was used as loading control. Statistical analysis was performed using ANOVA Kruskal-Wallis test followed by Dunn’s post hoc multiple comparison analysis. *p<0.05, **p<0.001 compared to WT-EV; yellow *p<0.05, **p<0.001 compared to APP KO, and ##p<0.001 compared to WT treated with CompE. The total number of quantified cells is shown in parentheses (WT, n = 13 embryos; APP KO, n = 6 embryos; Compound E, n = 5 embryos). Error bars indicate SEM.
Figure 1—figure supplement 1

Changes in axodendritic outgrowth associated with γ-secretase inhibition requires APP expression.
Quantitative analysis of neurite outgrowth is represented as raw data (pixel number) in total axonal area (a), and dendritic area (b), in treated or untreated neurons with Compound E (CompE: 10 nM, 24 hr), expressing either EV or APP-FL as compared to WT-EV control group. Statistical analysis was performed using ANOVA Kruskal-Wallis test followed by Dunn’s post hoc multiple comparison analysis. **p<0.001 compared to WT-EV; yellow **p<0.001 compared to APP KO, and ##p<0.001 compared to WT treated with CompE. The total number of quantified cells is shown in parentheses (WT, n = 13 embryos; APP KO, n = 6 embryos; Compound E, n = 5 embryos). Error bars indicate SEM.
Figure 1—figure supplement 2
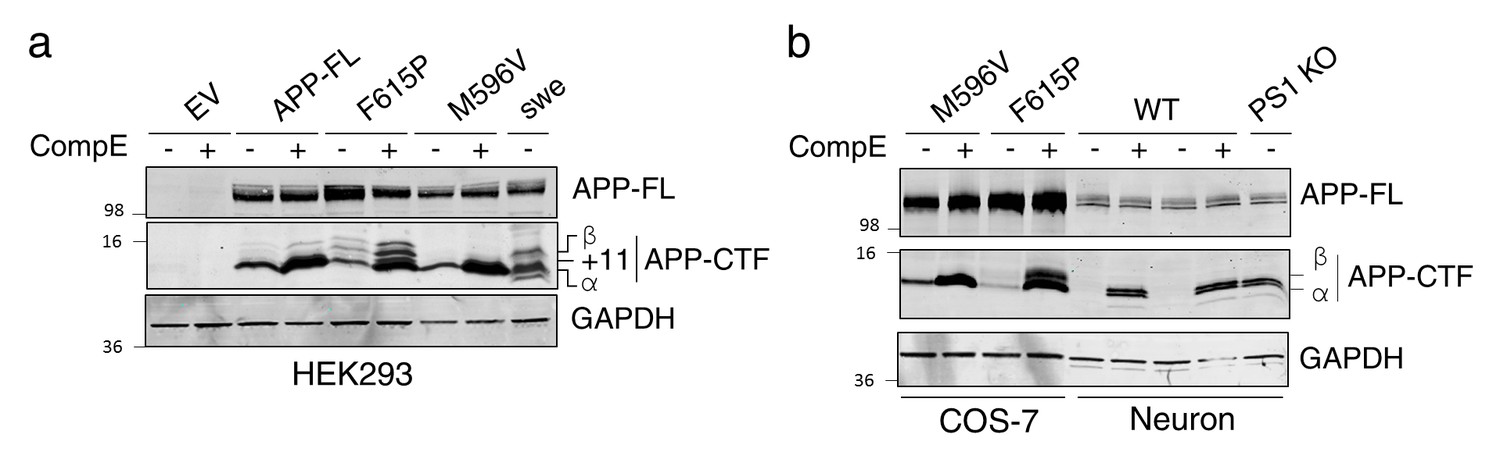
Identification of APP-CTF through differential processing of APP by secretases.
(a) HEK293 cells and (b) COS-7 cells, coexpressing empty vector (EV), APP-FL, APP-M596V (APP β-site cleavage mutant), APP-F615P (APP α-site cleavage mutant), or APPswe, were treated with or without γ-secretase inhibitor Compound E (CompE, 24 hr, 10 nM). Lysates from primary cortical neurons (14 DIV) generated from WT and PS1 KO mouse embryos were loaded adjacent to COS-7 transfected cells. Western blotting analysis from Tris-Tricine separation gel was performed to identify APP-CTF using rabbit polyclonal CTM1 antibody. Detection of APP-CTF α, +11 and β species is notified, as previously described (Vetrivel et al., 2011). GAPDH was used as loading control.
Figure 2
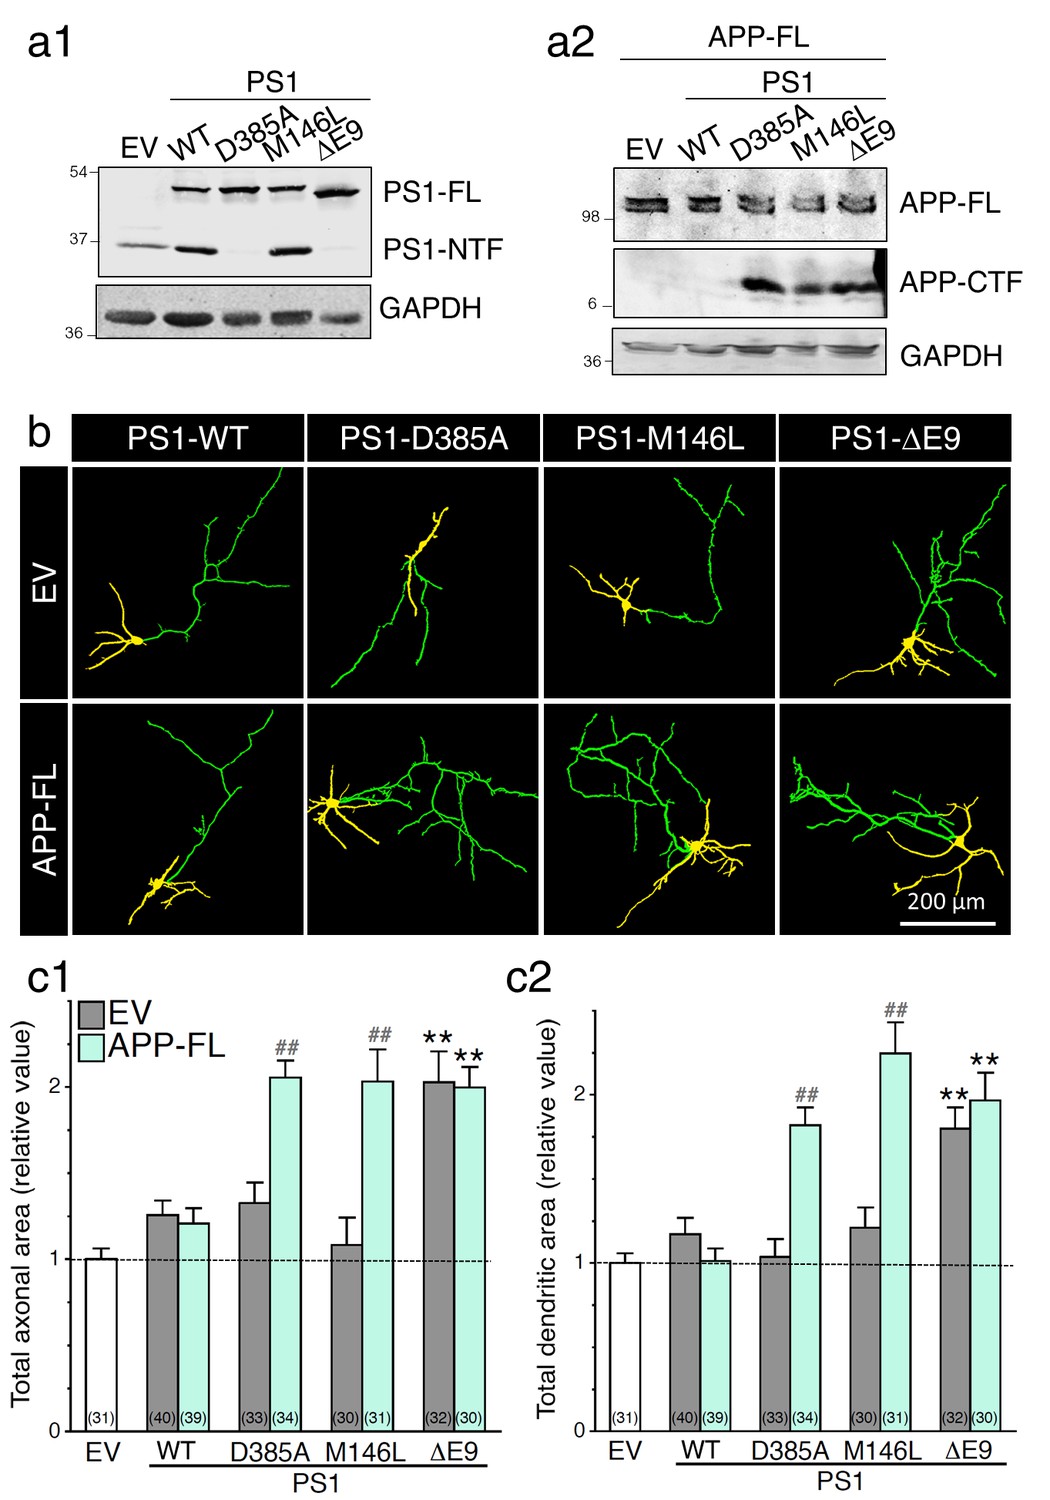
Expression of FAD-linked PS1 variants promotes neurite outgrowth.
FAD-linked PS1 mutations enhance axonal and dendritic arborization that correlates with APP C-terminal fragment (APP-CTF) accumulation. FAD-linked PS1 mutations affect APP processing in cells expressing APP full-length (APP-FL). (a) Stable HEK293 cells overexpressing FAD-linked PS1 variants (a1) were transiently transfected with APP-FL (a2). (a1) The PS1NT polyclonal antibody was used to detect PS1 full-length (PS1-FL) and PS1 N-terminal fragment (PS1-NTF). (a2) The CTM1 polyclonal antibody was used to detect APP-FL and APP-CTF accumulation. (b) GAPDH was used as loading control. (b) WT primary cortical neurons (8 DIV) coexpressing YFP, APP-FL and PS1 mutants were immunostained with MAP2 antibody. Representative overlay images of YFP and MAP2 staining reveal axonal (green) and dendritic (yellow) arbors. (c) Quantification of the total axonal (b1) and dendritic (b2) areas is shown in cortical neurons (7–8 DIV) 24 hr following transfection of PS1 variants (in gray) with APP-FL (in light green). The total number of quantified cells is shown in parentheses (n = 5 embryos for each transfected condition). Error bars indicate SEM.
Figure 3 with 4 supplements
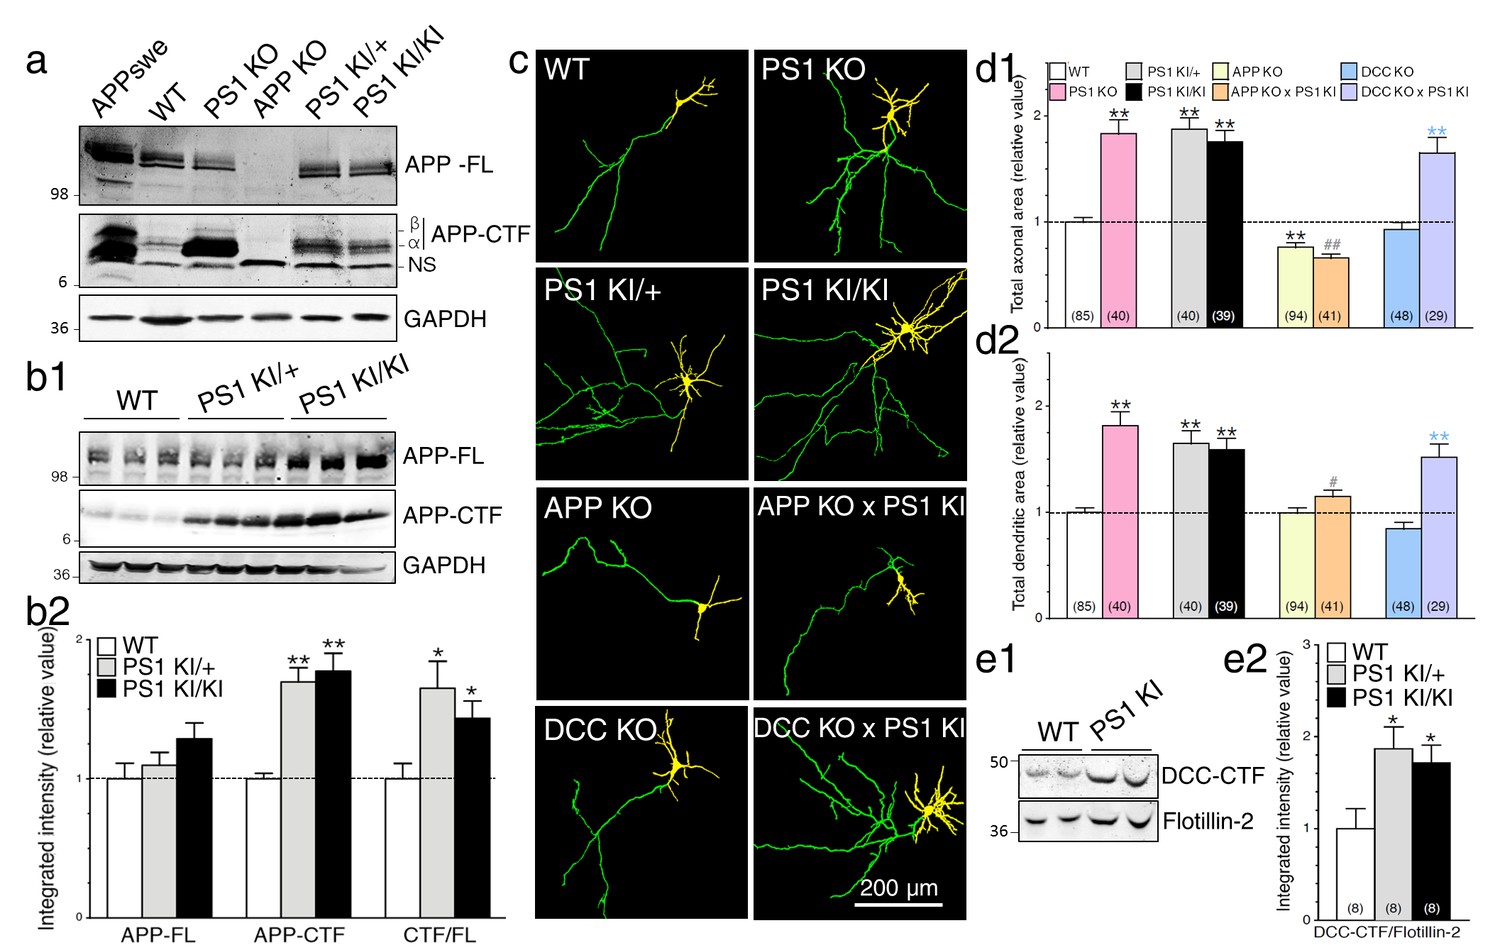
Neurons expressing FAD-linked PS1 mutations exhibit partial loss of γ-secretase activity associated with APP-dependent increases of neurite outgrowth.
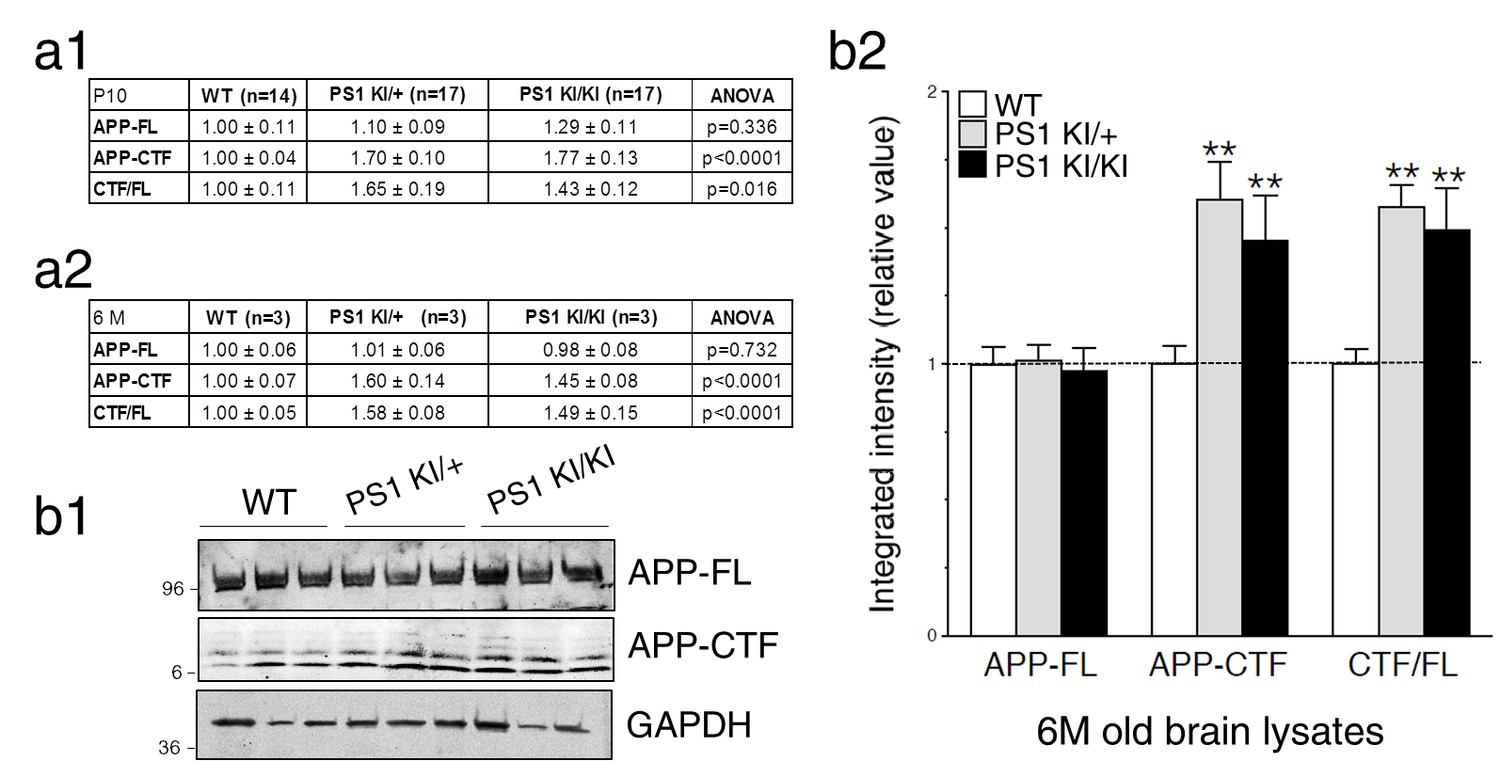
(a) Levels of APP full-length (APP-FL) and proteolytic C-terminal fragments APP-CTF (APP-CTFα and APP-CTFβ) accumulation were detected by high resolution Tris-Tricine Western blot analysis of lysates generated from WT, PS1 KO, APP KO, PS1 KI/+, and PS1 KI/KI mouse brains using CTM1 antibody. Lysate from HEK cells overexpressing APPswe and GAPDH antibody detection were used as control. Half amount of proteins was loaded for PS1 KO brain lysate. NS indicates a non-specific cross-reacting band. (b1) Endogenous APP-FL and accumulation of APP-CTF were detected with CTM1 antibody by immunoblotting brain lysates from postnatal day 10 (P10) transgenic PSEN1-M146V knock-in mice (PS1 KI). (b2) Quantitative analysis of APP-FL, APP-CTF accumulation and the ratio APP-CTF/APP-FL in PS1 KI is shown. Values are reported as a relative change in the intensity of the protein as compared with the WT littermates. (c) Primary cortical neurons (7–8 DIV) from WT, PS1 KO, PS1 KI (heterozygous PS1 KI/+ and homozygous PS1 KI/KI), APP KO, APP KO x PS1 KI, DCC KO and DCC KO x PS1 KI mice were transfected with YFP and immunostained with MAP2 antibody. Representative resulting overlay images reveal differences in axons (green) and dendrites (yellow). (d) Quantitative analysis of total axonal area (d1) and dendritic area (d2) are shown. Results are reported as relative values as compared to WT. (e) Western blot analysis of P10 brain lysates was performed to detect endogenous DCC-CTF fragments from WT and PS1 KI. (e1) Representative immunoblot lysate samples are shown. (e2) Quantitative analysis is shown as a relative change in the intensity of DCC-CTF expression as compared to WT littermates using Flotillin-2 as a loading control. Statistical analysis was performed using ANOVA Kruskal-Wallis test followed by Dunn’s post hoc multiple comparison analysis. *p<0.05, **p<0.001 compared to WT, blue **p<0.001 compared to DCC KO, and ##p<0.001 compared to PS1 KI. The total number of neurons (from at least 3 independent sets of cultures) used for quantification is shown in parentheses (WT, n = 6 embryos; PS1 KO, n = 5 embryos; PS1 KI/+, n = 6 embryos; PS1 KI/KI, n = 6 embryos; APP KO, n = 6 embryos; APP KO x PS1 KI, n = 6 embryos; DCC KO, n = 7 embryos; DCC KO x PS1 KI, n = 5 embryos). Error bars indicate SEM.
Figure 3—figure supplement 1
Intramembraneous proteolysis of APP in knock-in mice expressing FAD-linked PS1 variant.
FAD-linked PS1 mutations correlate with APP-CTF accumulation. (a) Levels of endogenous APP-full length (APP-FL) and accumulation of APP-CTF were evaluated by Western blot in brain lysates from WT, hetero- and homozygote PSEN1-M146V knock-in mice (PS1 KI/+ and PS1 KI/KI, respectively) using CTM1 antibody. APP-FL and APP-CTF band intensities were quantified using Odyssey Infrared Imaging software (Li-Cor Biosciences) as a measure of integrated intensity per count from Western blots. Quantitative analysis of endogenous protein levels is shown as relative value from WT conditions calculated within the same gel from lysates of P10 and 6M mouse brains (a1 and a2, respectively). P values of ANOVA comparison are shown. The total number of animals used for quantification is shown in parentheses. (b1) Tris-Tricine Western blot of brain lysates harvested at 6M is shown. (b2) Quantitative analysis of APP-FL, APP-CTF accumulation and the ratio APP-CTF/APP-FL in brains of PS1 KI is represented. Values are reported as a relative change in the intensity of the protein as compared with the WT littermates. Statistical analysis was performed using ANOVA Kruskal-Wallis test followed by Dunn’s post hoc multiple comparison analysis. **p<0.001 compared to WT. Error bars indicate SEM.
Figure 3—figure supplement 2

No additive effect of γ-secretase inhibition on neurite outgrowth in APP-deficient neurons expressing PS1 mutation.
Primary cortical neurons (7–8 DIV) from WT, PS1 KI, and APP KO x PS1 KI embryonic mouse brains were transfected with YFP, treated with or without γ-secretase inhibitor Compound E (CompE 10 nM, 24 hr), and immunostained with an MAP2 antibody. (a) Dual color images of YFP fluorescence and MAP2 staining were taken revealing axons (green) and dendrites (yellow). (b) Quantitative analysis is shown as relative changes in axonal (b1) and dendritic (b2) outgrowth in neurons as compared to WT littermates of PS1 KI mice. Statistical analysis was performed using ANOVA Kruskal-Wallis test followed by Dunn’s post hoc multiple comparison analysis. **p<0.001 compared to PS1 KI, ##p<0.001 compared to PS1 KI treated with CompE. The total number of neurons (PS1 KI, n = 6 embryos; APP KO x PS1 KI, n = 6 embryos from at least 5 independent sets of cultures) used for quantification is shown in parentheses. Error bars indicate SEM.
Figure 3—figure supplement 3

DCC is not an essential substrate in PS1-induced neurite outgrowth.
Primary cortical neurons generated from DCC KO and WT littermate mice were transfected with YFP, treated with γ-secretase inhibitor Compound E (10 nM, 24 hr), and immunostained with MAP2. (a) Overlay images of YFP fluorescence and MAP2 staining of neurons at 8 DIV reveal axons (green) and dendrites (yellow). Total axonal (b1) and dendritic (b2) areas were quantified and plotted relative to WT littermates. Statistical analysis was performed using ANOVA Kruskal-Wallis test followed by Dunn’s post hoc multiple comparison analysis. *p<0.05, **p<0.001 compared to WT, and blue *p<0.05, **p<0.001 compared to DCC KO. The total number of neurons (WT, n = 7 embryos; DCC KO, n = 7 embryos; from at least 4 independent sets of cultures) used for quantification is shown in parentheses. Error bars indicate SEM.
Figure 3—figure supplement 4
Intramembraneous proteolysis of DCC in brains of FAD-linked PS1 mutant knock-in mice.
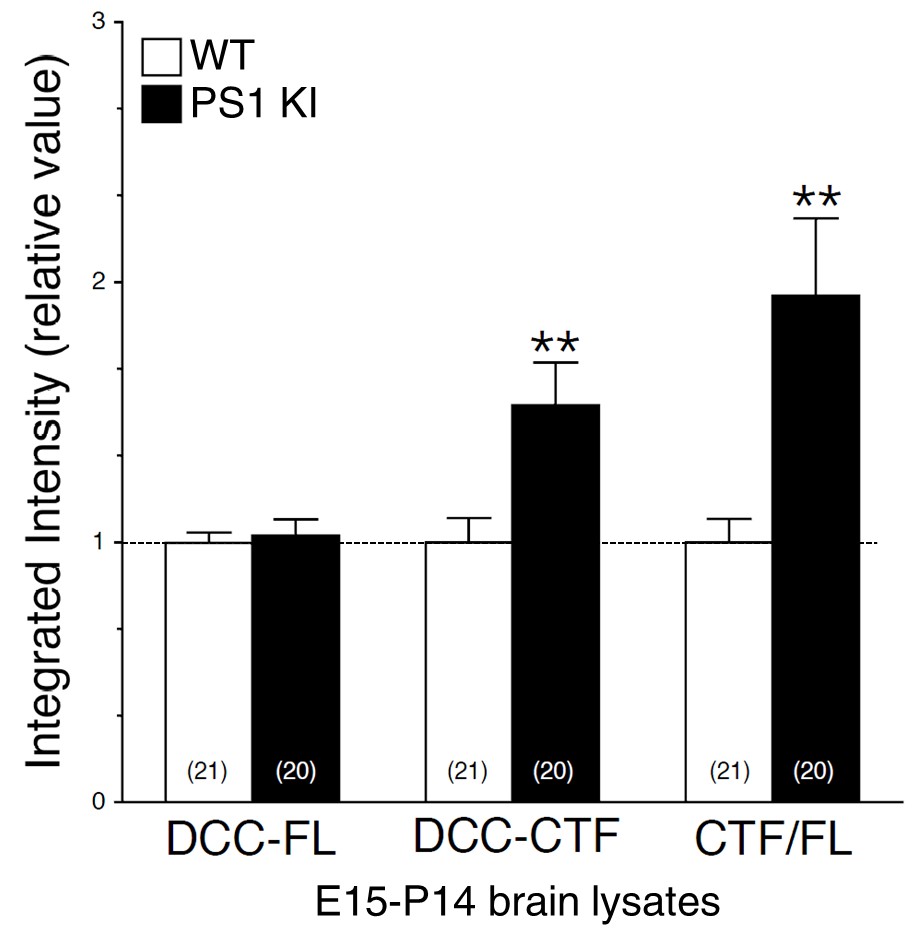
Expression of FAD-linked PS1-M146V mutation correlates with DCC-CTF accumulation. Endogenous DCC-FL and accumulation of DCC-CTF were detected by immunoblotting in brain lysates from embryonic day 15, postnatal day 7, 10 and 14 of knock-in mice expressing FAD-linked PS1-M146V variant (PS1 KI/KI), using G97-449 DCC antibody. Pooled results from various ages (E15-P14) are shown. Quantitative analysis of DCC-FL and DCC-CTF accumulation in homozygote PS1 KI/KI and WT littermates is shown. Values are reported as a relative change in the intensity of the protein as compared with WT littermates. Statistical analysis was performed using Mann-Whitney test comparison analysis. **p<0.001 compared to WT. The total number of animals used for quantification is shown in parentheses. Error bars indicate SEM.
Figure 4

APP-dependent axonal sprouting in the hippocampus of knock-in mice expressing FAD-linked PS1 variant.
(a) Immunohistochemistry of GAP-43 on coronal brain sections of 6 months-old WT, PS1 KI, and APP KO x PS1 KI mice is shown. (a1) Representative pseudocolor images of brain sections present GAP-43 staining intensity in several brain areas (Cx: cortex, alv: alveus, Or: oriens, Pyr: pyramidal layer, Rad: radiatum, LMol: lacunosum moleculare, OMoDG: outer molecular layer of the dentate gyrus, IMoDG: inner molecular layer of the dentate gyrus, GrDG: granular layer of the dentate gyrus, PoDG: polymorph layer of the dentate gyrus). (a2) Enlarged views of the dentate gyrus areas are shown. (a3) Representative line-scans (as indicated in a1) show levels of overlapping-peak intensity of GAP-43 immunostaining across cortical and hippocampal areas. More intense staining is noticeable especially in hippocampal areas of PS1 KI as compared to WT and APP KO x PS1 KI. (b) Quantitative analysis of GAP-43 staining intensity in several brain areas is represented as relative changes compared to WT. (c) Western blot analysis of steady-state levels of GAP-43 is examined using cortex and hippocampus lysates from WT, PS1 KI and APP KO x PS1 KI mouse brains taken at postnatal day 10 (P10). Flotillin-2 was used as loading control. (d) Confocal images of GAP-43 staining in 6 months-old mice showing the axonal sprouting in OMoDG layer of PS1 KI as compared to APP KO x PS1 KI mice. The boxed regions are shown as enlarged insets. Inverted images at the bottom show the surface rendered zoomed areas generated with Huygens software. Statistical analysis was performed using ANOVA Kruskal-Wallis test followed by Dunn’s post hoc multiple comparison analysis. *p<0.05, **p<0.001 compared to WT littermates, and #p<0.05, ##p<0.001 compared to PS1 KI littermates. The total number of animals used for quantification is shown in parentheses. Error bars indicate SEM.
Figure 5 with 2 supplements
Loss of γ-secretase activity is associated with a gain of APP-CTF signaling.
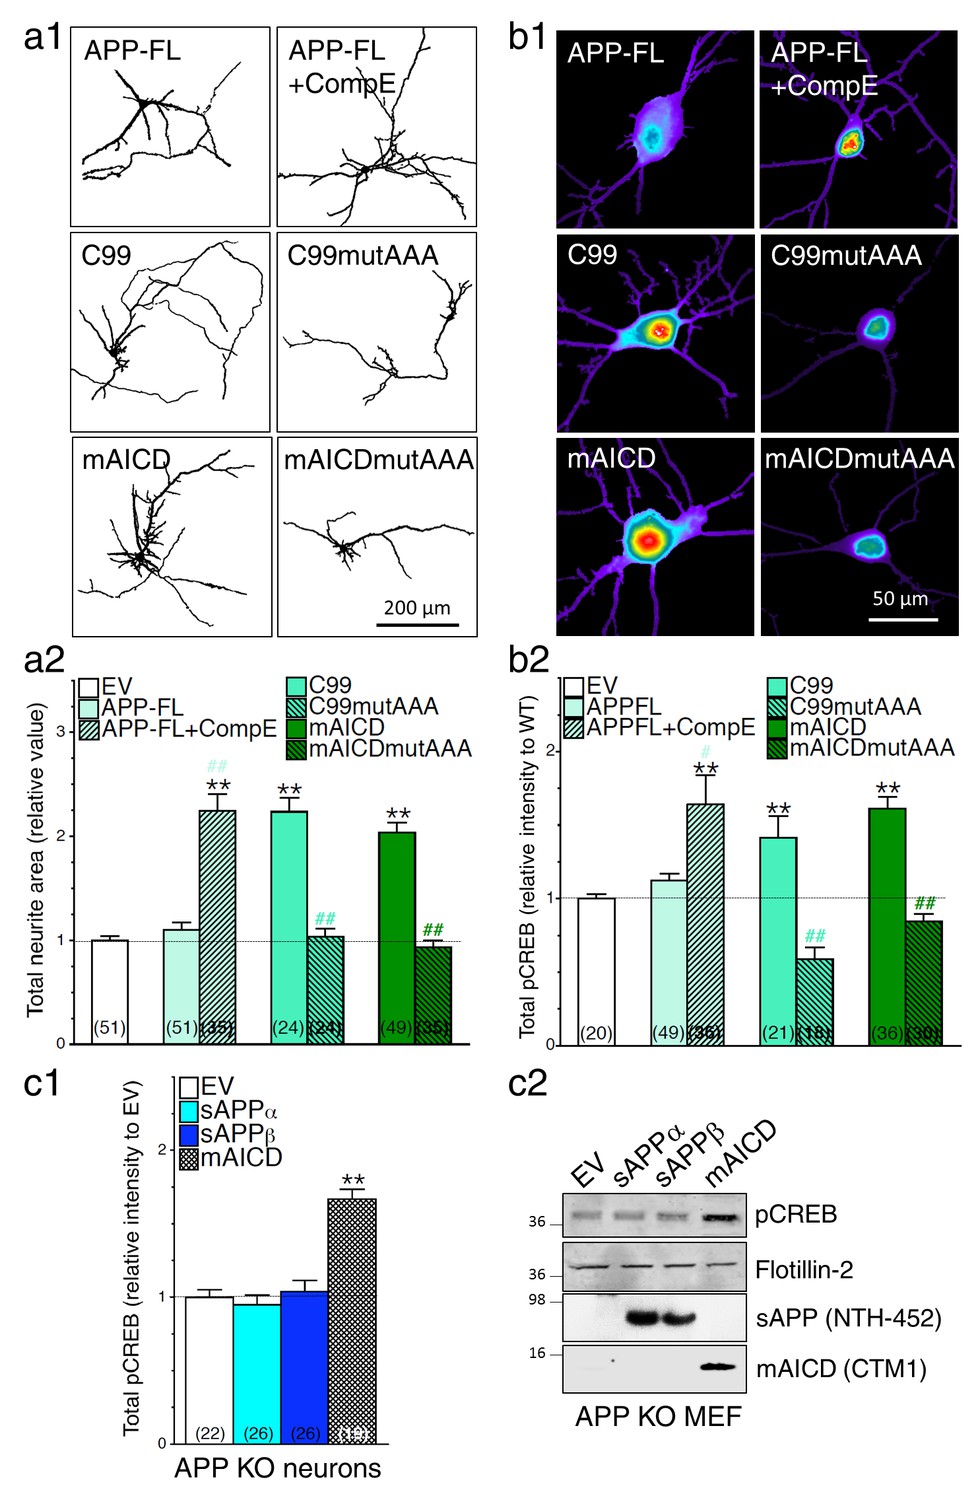
(a1) Representative inverted images of cortical neurons (8 DIV) coexpressing YFP and APP-FL, C99, membrane-tethered APP intracellular domain (mAICD) or mutants lacking GαS-protein interacting site (C99mutAAA and mAICDmutAAA) are shown. (a2) Analysis of total neurite area is presented as relative to the empty vector (EV) transfected control group. (b1) Representative pseudocolor images of phosphorylated CREB (pCREB) immunofluorescence are shown for WT neurons (14 DIV) expressing APP-FL (treated or not with γ-secretase inhibitor Compound E; 10 nM, 24 hr) or various APP-CTF constructs using polyclonal phospho-(Ser133) CREB antibody. (b2) Quantitative analysis of pCREB staining intensity is represented as relative changes as compared to EV. (c1) pCREB immunofluorescence intensity levels were analyzed in 14 DIV neurons expressing EV, soluble APPα (sAPPα), soluble APPβ (sAPPβ) or mAICD that were generated from APP KO mice. Quantitative analysis of pCREB staining intensity is represented as relative changes compared with EV transfected neurons. (c2) Western blot analysis of pCREB accumulation is shown in primary mouse embryonic fibroblasts (MEF) expressing EV, sAPPα, sAPPβ or mAICD that were generated from APP KO mice. The level of sAPP was examined in the conditioned media using the NTH-452 antibody that recognized the N-terminal fragment of APP. The expression level of pCREB, Flotillin-2, and mAICD (using CTM1 antibody) were examined in cell lysates. Statistical analysis was performed using ANOVA Kruskal-Wallis test followed by Dunn’s post hoc multiple comparison analysis. **p<0.001 compared to EV, and #p<0.05 and ##p<0.001 compared to the overexpressing condition within the same group. The total number of neurons (from at least 3 independent sets of cultures) used for quantification is shown in parentheses. Error bars indicate SEM.
Figure 5—figure supplement 1
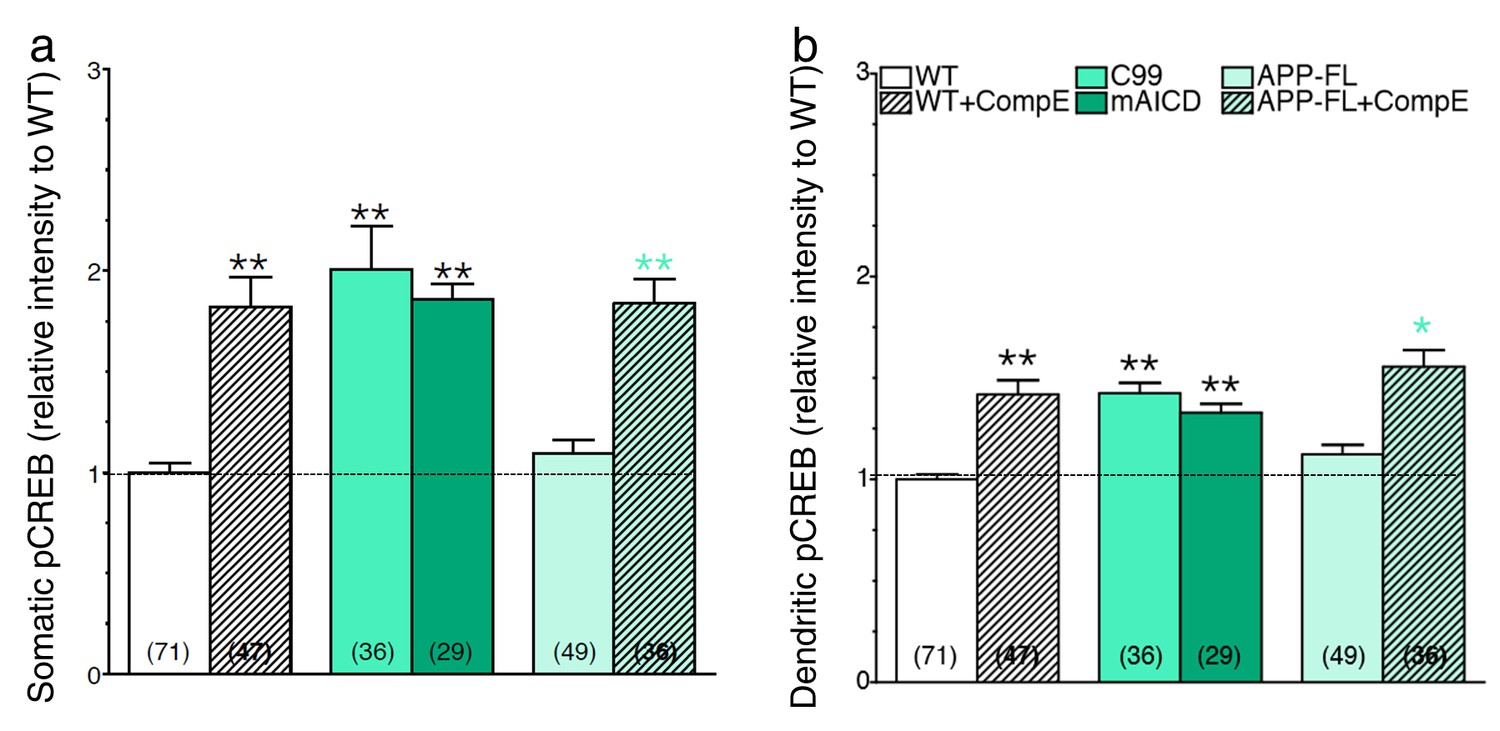
Accumulation of APP-CTF is associated with a larger increase in CREB signaling in the somatic area.
Mouse cortical neurons were transfected at 11 DIV. Cells were treated with Compound E (10 nM) 24 hr before fixation (14 DIV). Quantitative analysis of somatic (a) and dendritic (b) staining intensity of pCREB is shown under basal condition (WT neurons) and in conditions that accumulate APP-CTF through γ-secretase inhibition (CompE 10 nM, 24 hr) with endogenous or overexpression of APP-FL, or overexpression of APP-C99 (C99), or overexpression of membrane-tethered APP intracellular domain (mAICD). Quantitative analysis of pCREB staining intensity is represented as relative change as compared to WT. Statistical analysis was performed using ANOVA Kruskal-Wallis test followed by Dunn’s post hoc multiple comparison analysis. *p<0.05, **p<0.001 compared to WT basal condition. The total number of quantified cells is shown in parentheses (from at least 3 independent sets of cultures). Error bars indicate SEM.
Figure 5—figure supplement 2
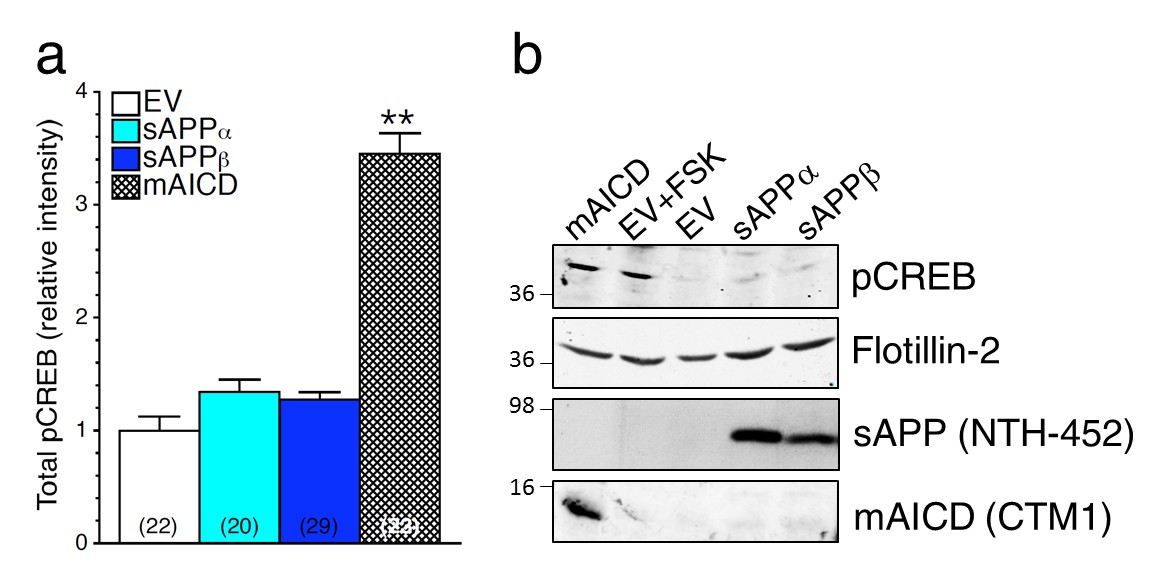
Soluble APP does not affect CREB signaling in HEK293 transfected cell lines.
Steady-state levels of pCREB were examined by immunostaining (a) and Western blot (b) in HEK293 cells transfected with empty vector (EV) treated with forskolin (FSK, 1 μM), and in overexpressing conditions using soluble APPα (sAPPα), soluble APPβ (sAPPβ) or mAICD plasmids. (a) Quantification of total phosphorylated CREB (pCREB) levels is shown as changes in relative intensity as compared to EV. (b) pCREB accumulation and mAICD expression were examined in cell lysates using phospho-(Ser133) CREB and APP CTM1 antibodies, respectively. The level of sAPP was examined in the media collected from transfected HEK293 cells using the NTH-452 antibody that recognized the N-terminal fragment of APP. Flotillin-2 was used as loading control. Statistical analysis was performed using ANOVA Kruskal-Wallis test followed by Dunn’s post hoc multiple comparison analysis. **p<0.001 compared to EV. The total number of quantified cells is shown in parentheses. Error bars indicate SEM.
Figure 6 with 2 supplements
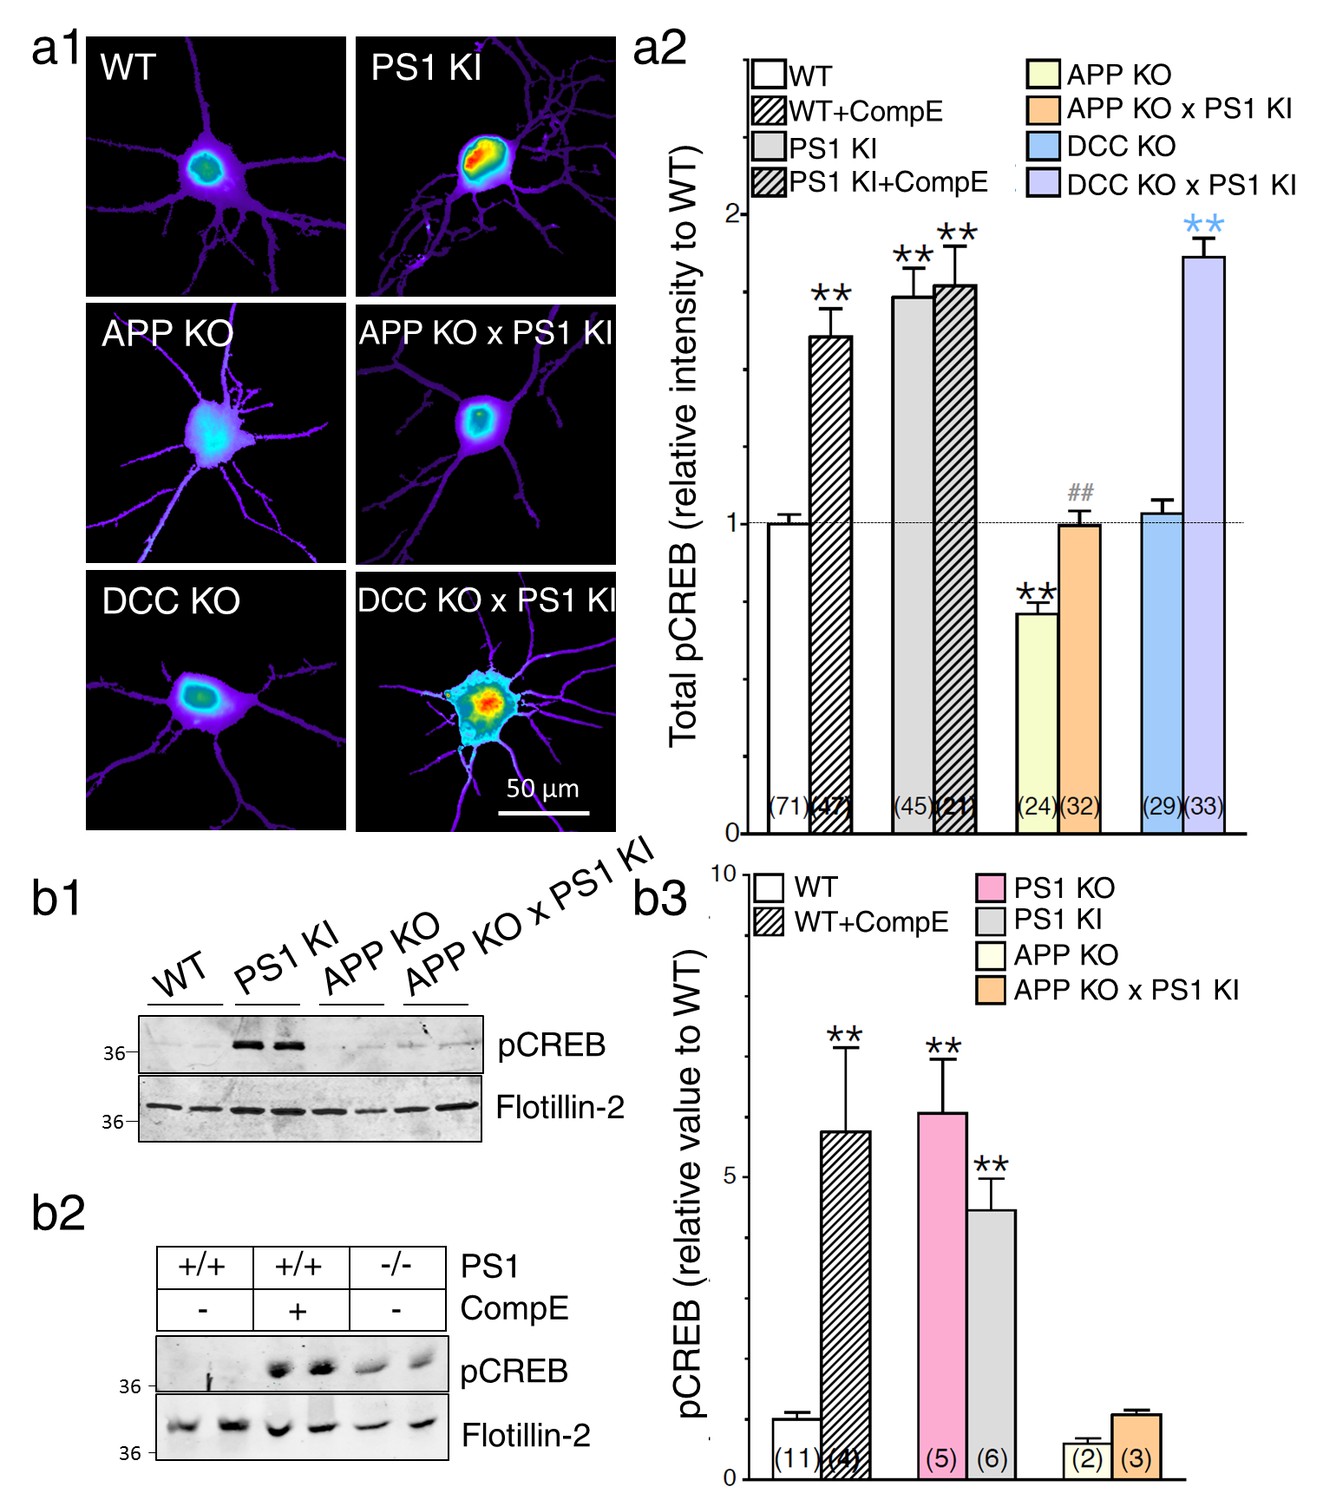
APP-dependent enhancement of CREB signaling in neurons expressing FAD-linked PS1 variant.
(a) Phosphorylated CREB (pCREB) immunofluorescence staining was performed in neurons at 14 DIV using polyclonal phospho-(Ser133) CREB antibody. (a1) Representative pseudocolor images of pCREB immunostaining levels at steady-state are shown in neurons generated from PS1 KI, APP KO, APP KO x PS1 KI, DCC KO, and DCC KO X PS1 KI embryonic brains, and treated with γ-secretase inhibitor Compound E (10 nM, 24 hr). (a2) Quantitative analysis of pCREB staining intensity is represented as relative changes as compared to WT. (b) Steady-state levels of pCREB were examined in neuronal lysates at 14 DIV cortical neurons by Western blot analysis in PS1 KI neurons (b1) and in γ-secretase deficient neurons (b2). Flotillin-2 was used as loading control. (b3) The ratio of pCREB intensity over the intensity of Flotillin-2 as compared to WT is shown. Results were quantified from at least 2 independent cultures. Statistical analysis was performed using ANOVA Kruskal-Wallis test followed by Dunn’s post hoc multiple comparison analysis. **p<0.001 compared to WT, blue **p<0.001 compared to DCC KO, and ##p<0.001 compared to PS1 KI. The total number of quantified cells is shown in parentheses (WT, n = 6 embryos; PS1 KI, n = 6 embryos; APP KO, n = 4; APP KO x PS1 KI, n = 4 embryos; DCC KO, n = 4; DCC KO x PS1 KI, n = 7 embryos). Error bars indicate SEM.
Figure 6—figure supplement 1
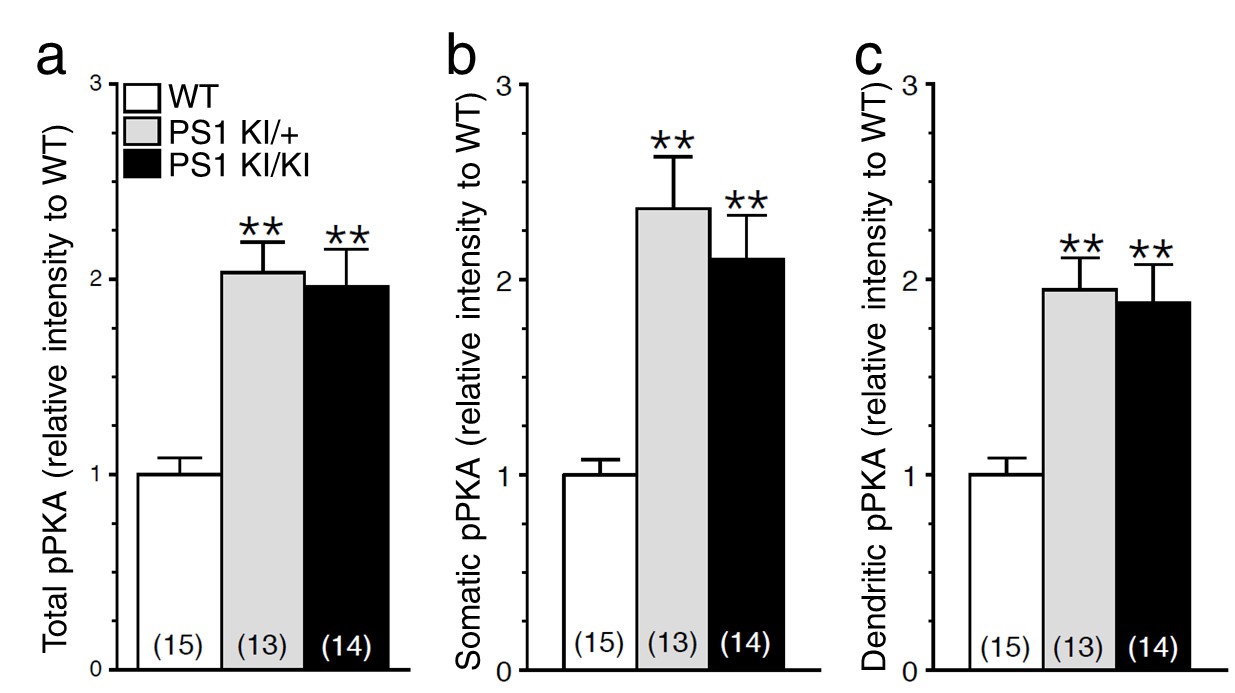
Increase in cAMP/PKA signaling in neurons expressing FAD-linked PS1 mutant.
Cortical cultures (14 DIV), generated from PSEN1-M146V knock-in mouse (PS1 KI/+ and PS1 KI/KI) and WT littermates, were immunostained with a polyclonal antibody directed against phosphorylated Ser/Thr PKA substrates (pPKA). (a) Relative levels of total pPKA staining intensity are shown in somatic (b) and dendritic (c) areas. Statistical analysis was performed using ANOVA Kruskal-Wallis test followed by Dunn’s post hoc multiple comparison analysis. **p<0.001 compared to WT. The total number of neurons used for quantification is shown in parentheses (WT, n = 2 embryos; PS1 KI /+, n = 2 embryos; PS1 KI/KI, n = 2 embryos). Error bars indicate SEM.
Figure 6—figure supplement 2
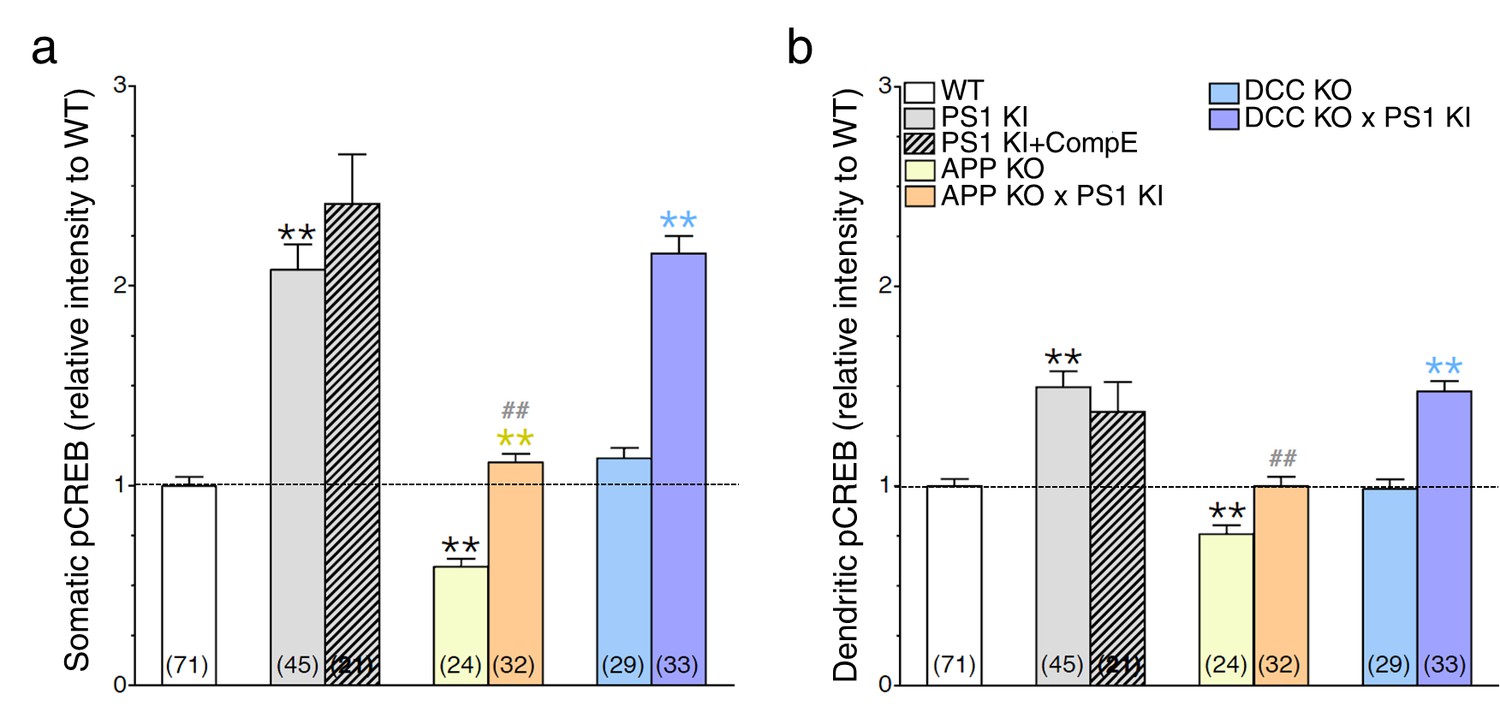
The APP-dependent increases of CREB signaling in somatic and dendritic areas.
Mouse cortical neurons were transfected at 11 DIV. 24 hr before fixation (14 DIV), cells were treated with Compound E (10 nM, 24 hr). pCREB staining intensity was performed in neurons generated from PS1 KI, APP KO, APP KO x PS1 KI, DCC KO and DCC KO x PS1 KI. Quantitative analysis of pCREB staining intensity in the soma (a) and in dendrites (b) is represented as relative change as compared to WT. Statistical analysis was performed using ANOVA Kruskal-Wallis test followed by Dunn’s post hoc multiple comparison analysis. **p<0.001 compared to WT, yellow **p<0.001 compared to APP KO, blue **p<0.001 compared to DCC KO, and ##p<0.001 compared to PS1 KI. The total number of quantified cells is shown in parentheses (WT, n = 6 embryos; PS1 KI, n = 6; APP KO, n = 4; APP KO x PS1 KI, n = 4; DCC KO, n = 4; DCC KO x PS1 KI, n = 7 embryos). Error bars indicate SEM.
Figure 7
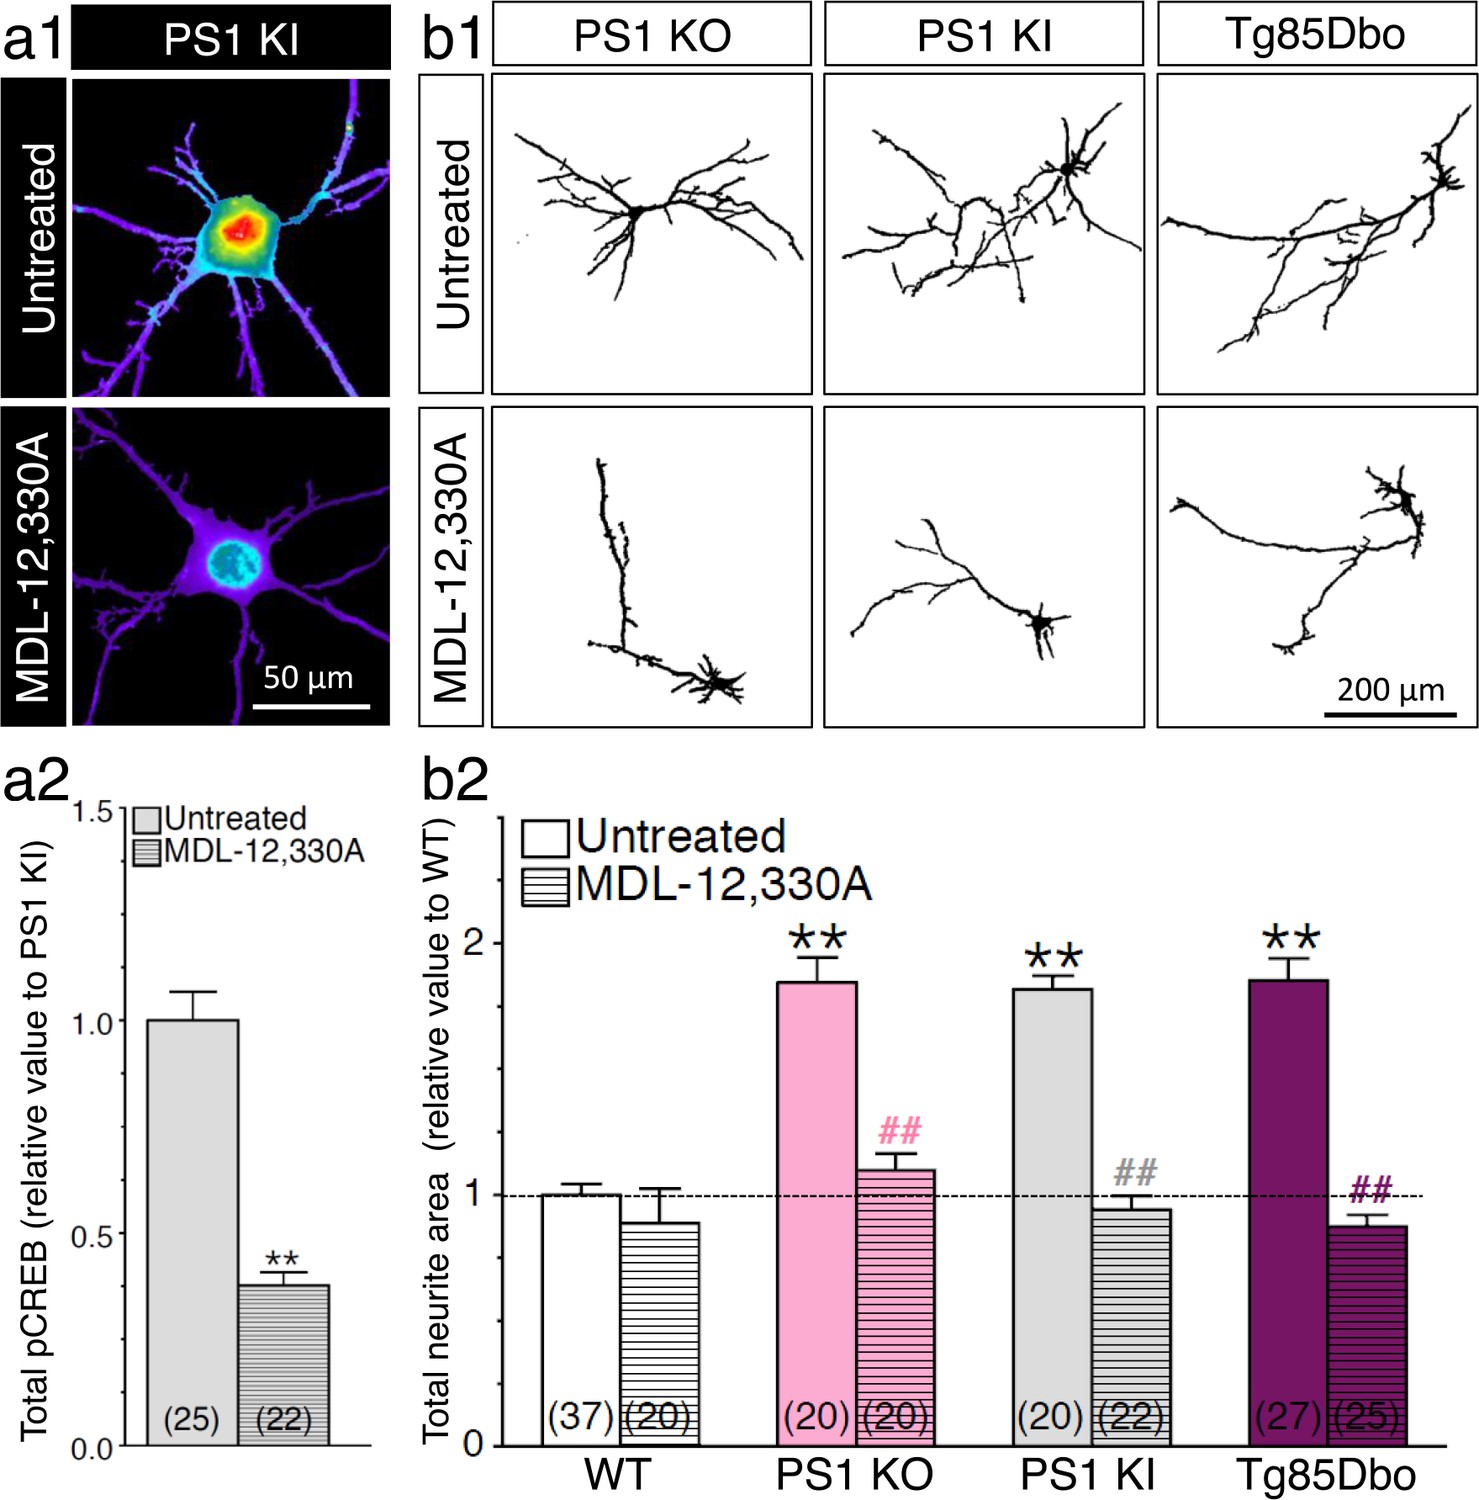
PS1-induced neurite outgrowth and associated CREB signaling require adenylate cyclase activation.
(a1) Representative pseudocolor images of phosphorylated CREB (pCREB) immunofluorescence is shown in 14 DIV neurons generated from PS1 KI mice treated with adenylate cyclase inhibitor MDL-12,330A (100 nM, 30 min) using polyclonal phospho-(Ser133) CREB antibody. (a2) Quantitative analysis of pCREB staining intensity is represented as relative changes as compared to untreated PS1 KI neurons. **p<0.001 compared to PS1 KI. (b1) Representative inverted images of YFP fluorescence in cortical neurons (8 DIV) generated from PS1 KO, PS1 KI, andTg85Dbo mice are shown after 24 hr treatment with MDL-12,330A (10 nM). (b2) Analysis of neurite extension is represented as relative changes in total neurite area as compared to WT littermates. **p<0.001 compared to WT, ##p<0.001 compared to untreated condition for each group. The total number of neurons (from at least 3 independent sets of cultures) used for quantification is shown in parentheses (WT, n = 5 embryos; PS1 KO, n = 3 embryos; PS1 KI, n = 3 embryos; Tg85Dbo, n = 3 embryos). Error bars indicate SEM.
Tables
Table 1
Summary results of characterized mouse models. The mouse breeding to obtain the experimental genotyped, the effect on axodendritic outgrowth, CREB signaling, and APP-CTF accumulation are summarized. Changes are indicated as strongly increase (↑↑), slightly increase (↑), slightly reduce (↓), no-change (-), or not determined (ND). Axodendritic components and associated CREB signaling alterations were evaluated in loss or partial loss of γ-secretase activity using γ-secretase inhibitor Compound E, PS1 KO, APPswe/PS1-ΔE9 (Tg85Dbo) and FAD-linked PSEN1-M146V knock-in (PS1 KI) mouse lines crossed to APP KO and DCC KO mice. Axonal as well as dendritic arborizations were increased in cortical neurons generated from PS1 KO, PS1 KI and Tg85Dbo mice. Augmentation of neurite extension correlates with the increase in CREB signaling and APP-CTF accumulation. Lack of APP expression in PS1 KI mice selectively alters axonal outgrowth that parallels a reduction in CREB signaling, as compared to their PS1 KI littermates. Lack of DCC expression in PS1 KI mice does not affect neurite outgrowth and CREB signaling, as compared to their PS1 KI littermates, therefore supporting the idea that APP is an essential substrate, but not DCC, in γ-secretase-mediated axodendritic plasticity.
| Mouse models | Parental strains | Axonal outgrowth | Dendritic outgrowth | CREB signaling | APP-CTF |
|---|---|---|---|---|---|
| Compound E | WT | ||||
| PS1 KO | PS1+/- x PS1+/- | ||||
| PS1 KI/KI | PS1 KI/+ x PS1 KI/+ | ||||
| Tg85Dbo | APPswe x PS1-ΔE9 | ND | |||
| APP KO | APP+/- x APP+/- | none | |||
| APP KO x PS1 KI | APP+/- x APP+/- PS1 KI/KI | none | |||
| DCC KO | DCC+/- x DCC+/- | ND | |||
| DCC KO x PS1 KI | DCC+/- x DCC+/- PS1 KI/KI | ND |
Download links
A two-part list of links to download the article, or parts of the article, in various formats.
Downloads (link to download the article as PDF)
Open citations (links to open the citations from this article in various online reference manager services)
Cite this article (links to download the citations from this article in formats compatible with various reference manager tools)
Loss of presenilin function is associated with a selective gain of APP function
eLife 5:e15645.
https://doi.org/10.7554/eLife.15645


