An integrative transcriptomic atlas of organogenesis in human embryos
- University of Manchester, United Kingdom
- Central Manchester University Hospitals NHS Foundation Trust, United Kingdom
Figures
Figure 1 with 5 supplements

Profiling the transcriptomes underlying organogenesis in human embryos.
(a) Human embryo showing the 15 tissues and organs subjected to RNA-seq. (b) High dynamic range of human embryonic RNA-seq. The combined dataset (black) included expression of >90% of annotated protein-coding genes (GENCODE18 [Harrow et al., 2012]). (c) Human embryogenesis possesses a distinctive transcriptome. Human embryonic read counts were compared with equivalent fetal datasets from NIH Roadmap (Roadmap Epigenomics Consortium, 2015) using edgeR (Robinson et al., 2010) and a false discovery rate (FDR) of 0.05 (see Materials and methods, Supplementary file 1B). Negative log10 p-values are shown for selected biological process Gene Ontology (GO) terms with significant enrichment in either the embryonic or fetal gene sets following Fisher's exact test applied using the elimination algorithm (Alexa and Rahnenfuhrer, 2010) (Supplementary file 1C contains the full list of enriched terms). (d) Selected sites illustrate the highly specific expression of HOX genes within the human embryo.
Figure 1—figure supplement 1
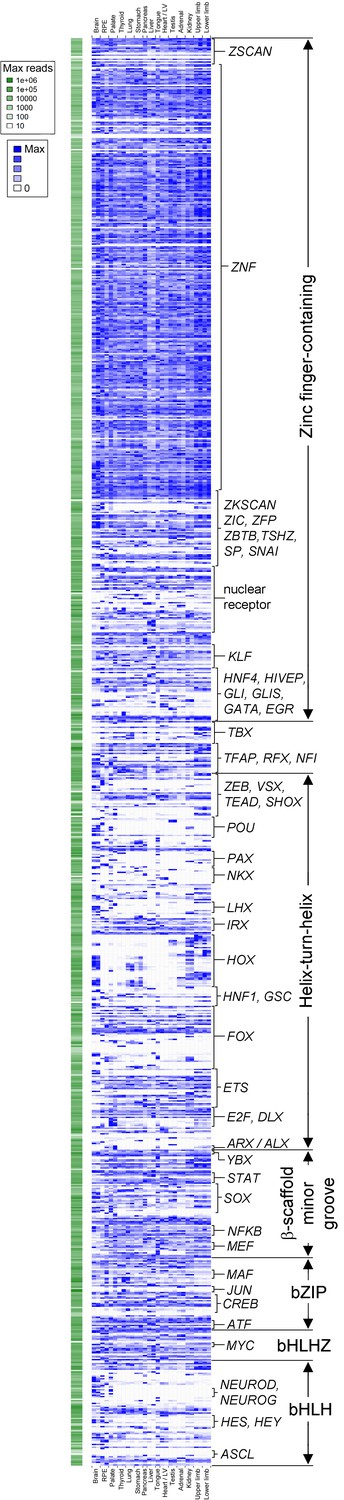
Transcription factor atlas of human organogenesis.
Heatmap of gene expression for all transcription factors annotated on KEGG (http://www.genome.jp/kegg-bin/get_htext?hsa03000) across the fifteen different human embryonic organs and tissues. Absolute maximum values of expression for each gene are represented to the left (green). The relative expression of each transcription factor across tissues is shown to the right (blue) set against its own maximum value (threshold for inclusion, read count >100 in at least one tissue). A high resolution version, text-searchable for each individual transcription factor, is available as Supplementary file 5. B, brain; R, retinal pigmented epithelium; P, palate; Th, thyroid / parathyroid; Lu, lung; S, stomach; Pan, pancreas; L, liver; To, tongue; H, heart / left ventricle; Te, testis; A, adrenal; K, kidney; UL, upper limb; and LL, lower limb.
Figure 1—figure supplement 2
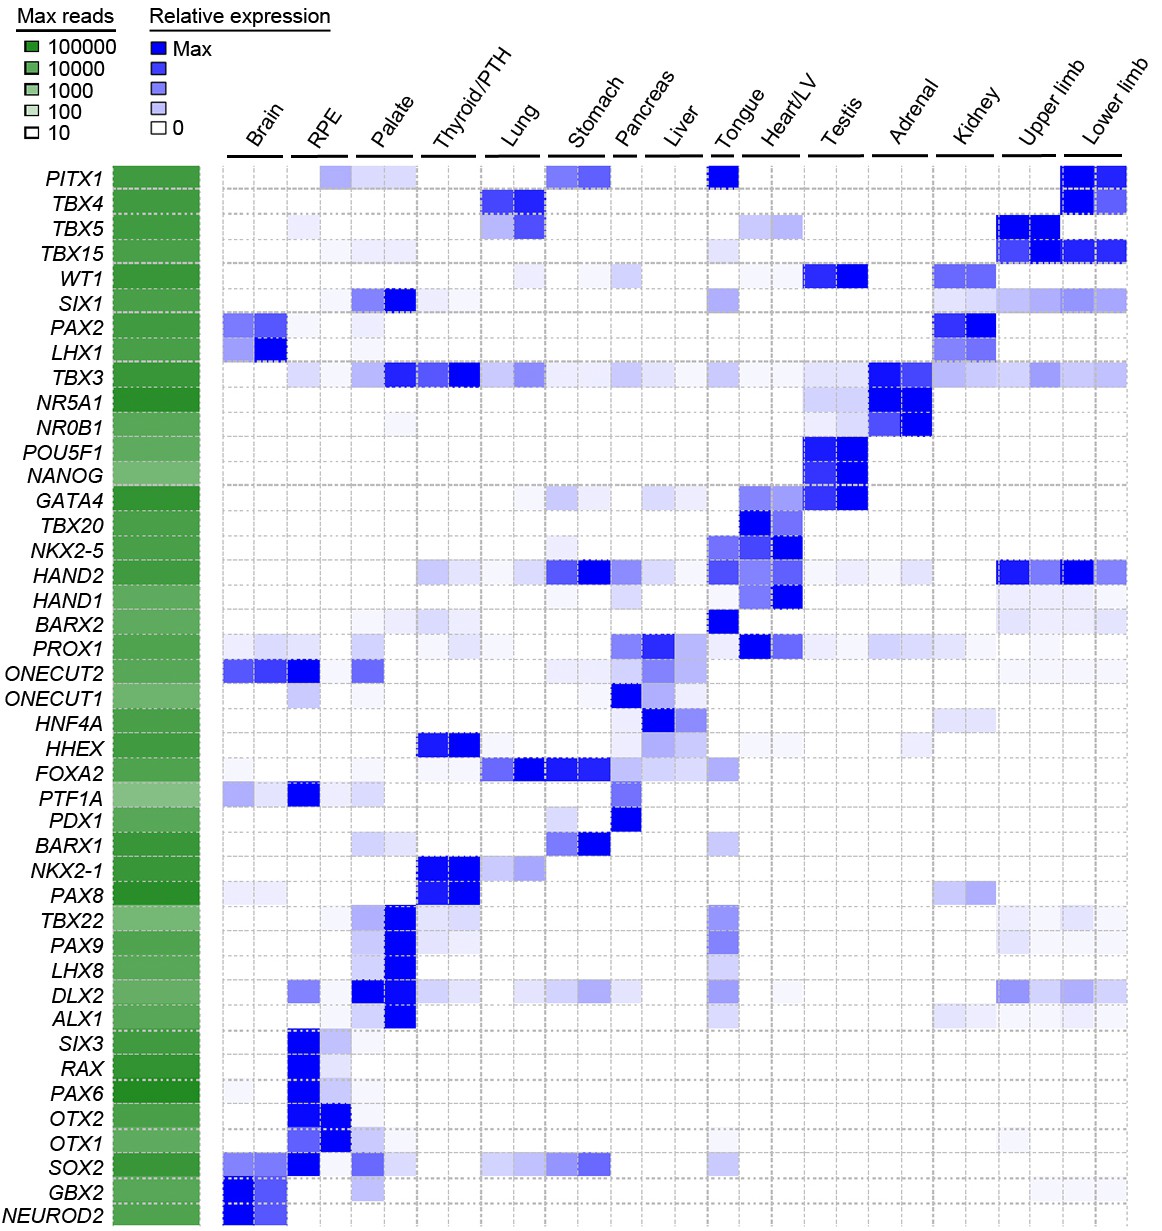
Heatmap of user-defined transcription factors indicates organ and tissue specificity during human organogenesis.
To validate that tissue-specific signatures should be readily attainable from the global dataset several transcription factors for each organ or tissue were selected based on recognized published roles and mutant mouse phenotypes (data available from Mouse Genome Informatics, www.informatics.jax.org). The heatmap demonstrates clear tissue-specificity.
Figure 1—figure supplement 3
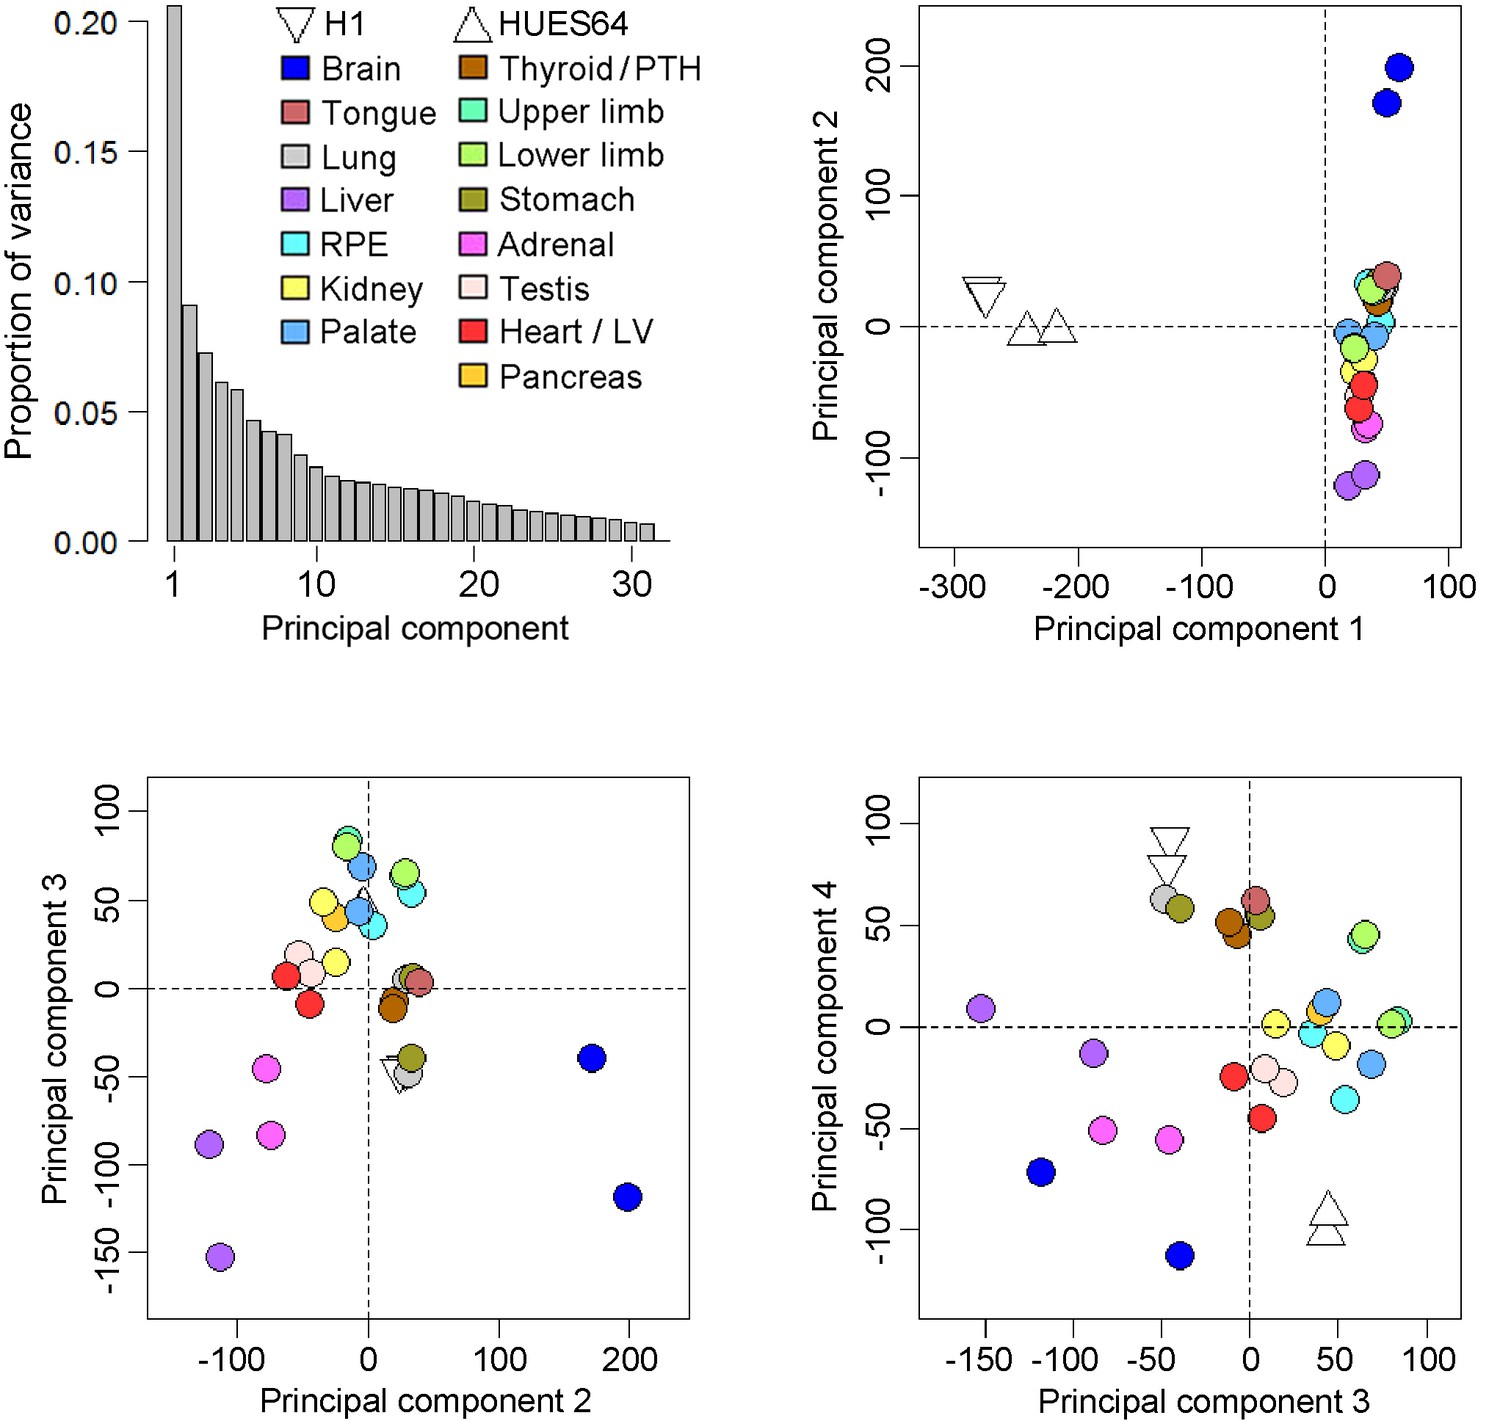
Principal components analysis of the human embryonic transcriptomes.
Across the four principal components biological replicates clustered together but from global pairwise correlations only the brain and to a lesser extent the liver were clearly distinct from the other organs and tissues (either extreme of principal component 2). As part of the reason why the liver was distinctive the five most abundant genes (ALB, AFP and three fetal hemoglobins) accounted for >20% of the data whereas in the other datasets the top 5 genes were responsible for only ~5% of transcription. The overall conclusion was that the simple principal components analysis failed to segregate clearly the individual transcriptomes of the different organs and tissues, an outcome that led to the development of the LgPCA methodology. Four samples from two human pluripotent stem cell (PSC) lines, H1 and HUES64 (NIH Roadmap datasets), are included here because they were subsequently included in the LgPCA analysis (Figure 2). The PSC lines are clearly distinct from the primary human embryonic tissue samples (negative loadings in principal component 1).
Figure 1—figure supplement 4
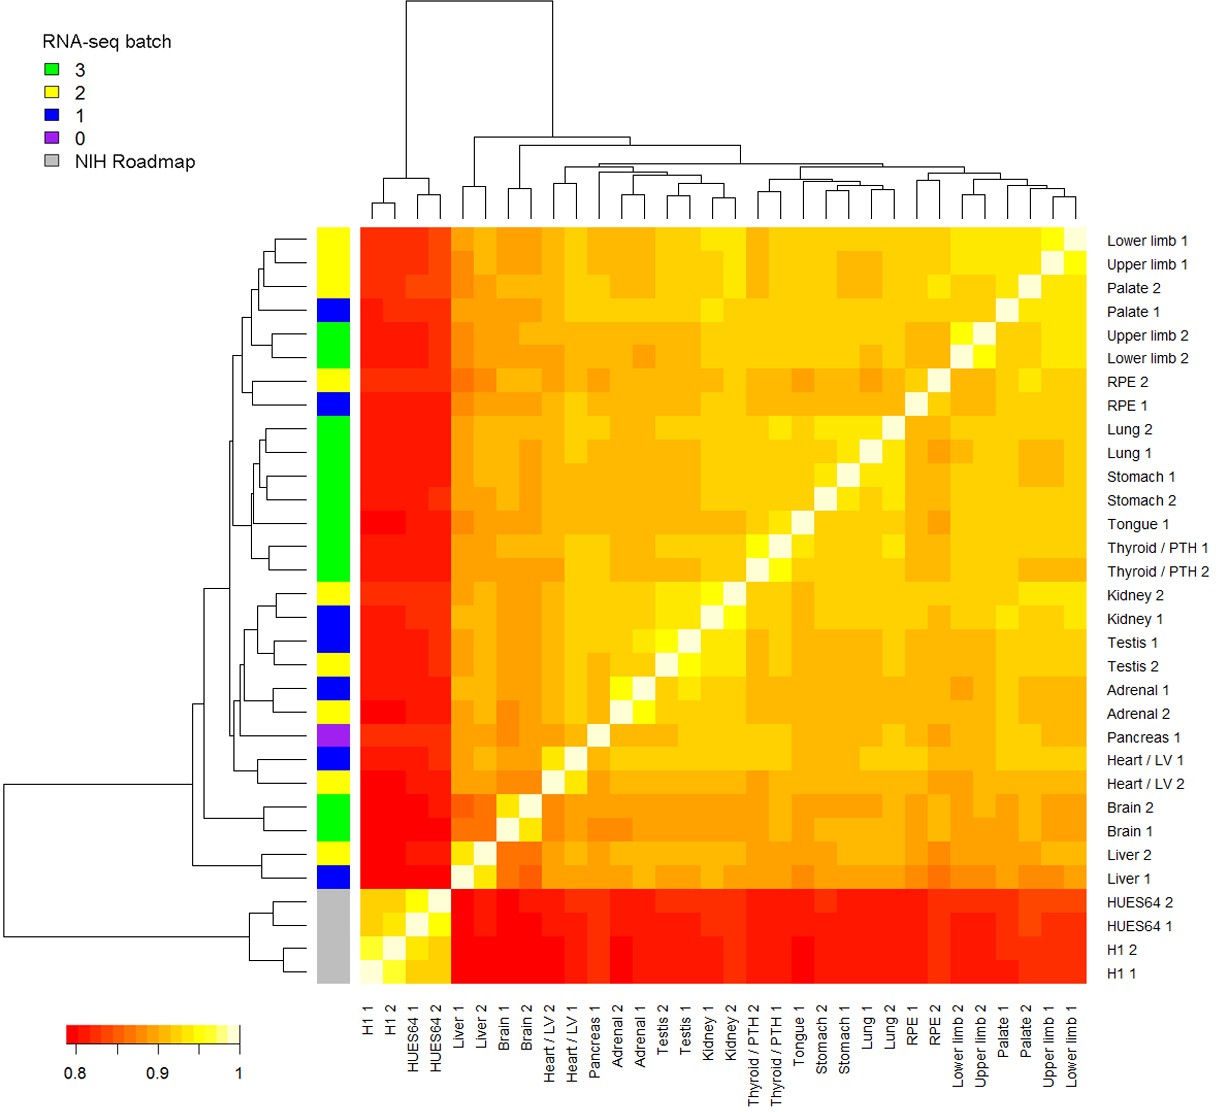
Heatmap of RNA-seq samples.
Samples are clustered based on Spearman’s rank correlation across all annotated genes. RNA-seq batch is indicated in the colored key to the left. In this study, RNA sequencing was performed in 3 batches. The pancreas RNA-seq was re-used from a previous study (Cebola et al., 2015). Four samples from two human pluripotent stem cell (PSC) lines, H1 and HUES64 (NIH Roadmap datasets), are included here because they were subsequently included in the LgPCA analysis (Figure 2). The PSC lines are clearly distinct from the primary human embryonic tissue samples.
Figure 1—figure supplement 5
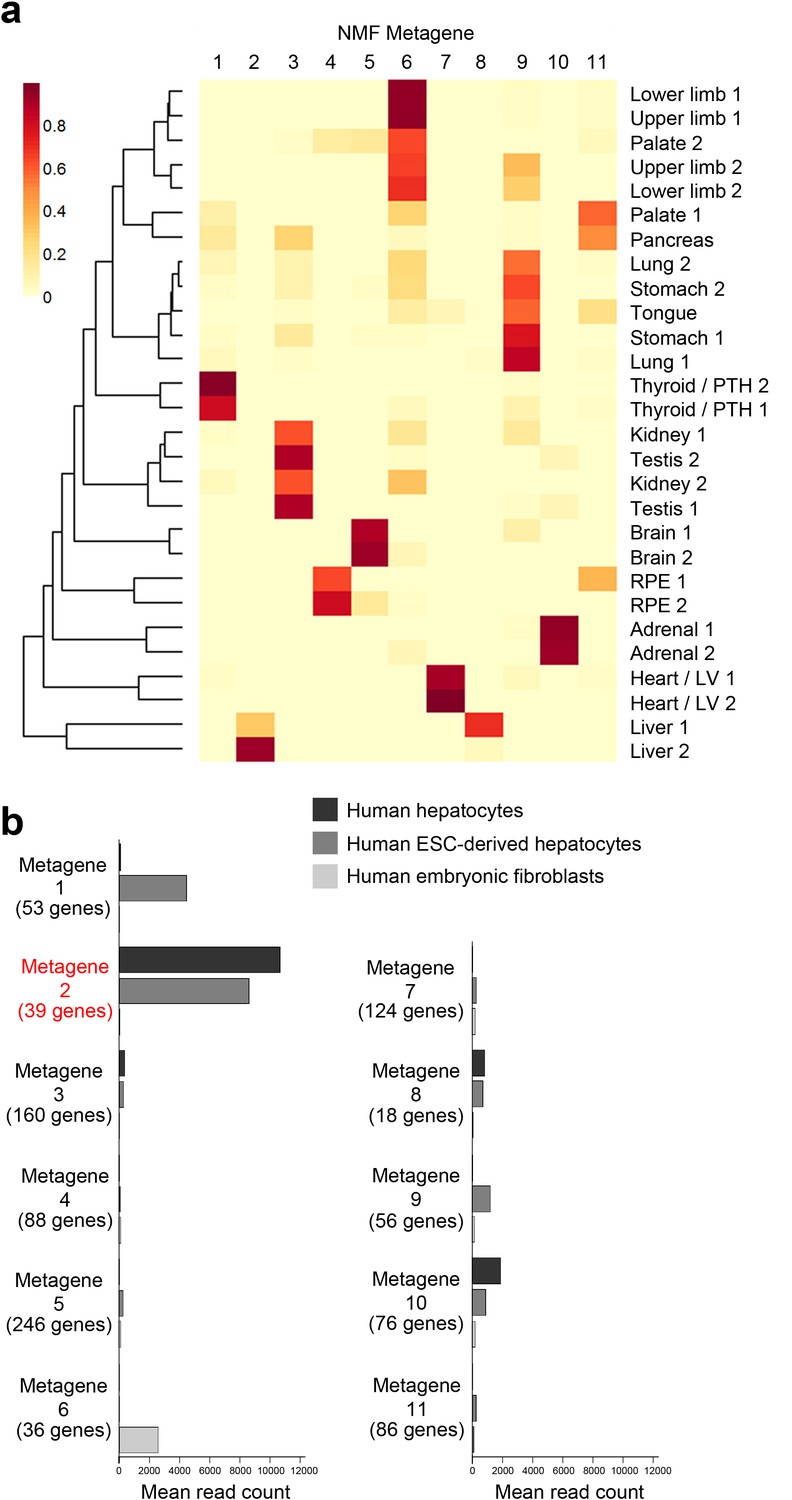
NMF Metagene analysis.
(a) Subsets of tissue-specific genes (‘metagenes’) were found using non-negative matrix factorisation (NMF) (Gaujoux and Seoighe, 2010). The initial screen using the co-phenetic distance suggested 11 exclusive metagenes. The NMF was re-run 200 times to assess consistency of sample groupings between runs. The resulting metagenes were discriminatory for liver, heart / left ventricle, adrenal gland, RPE, brain and thyroid / parathyroid while others sample types formed heterogeneous clusters: for instance, lung, stomach and tongue (metagene 9); kidney & testis (metagene 3); and limbs and palate (metagene 6). (b) NMF metagene analysis demonstrates enrichment of expression for those genes comprising metagene 2 (liver) in fresh human hepatocytes and human embryonic stem cells differentiated towards hepatocytes but not in human embryonic fibroblasts [sequence data from (Du et al., 2014)] compared to the other metagenes.
Figure 2 with 1 supplement
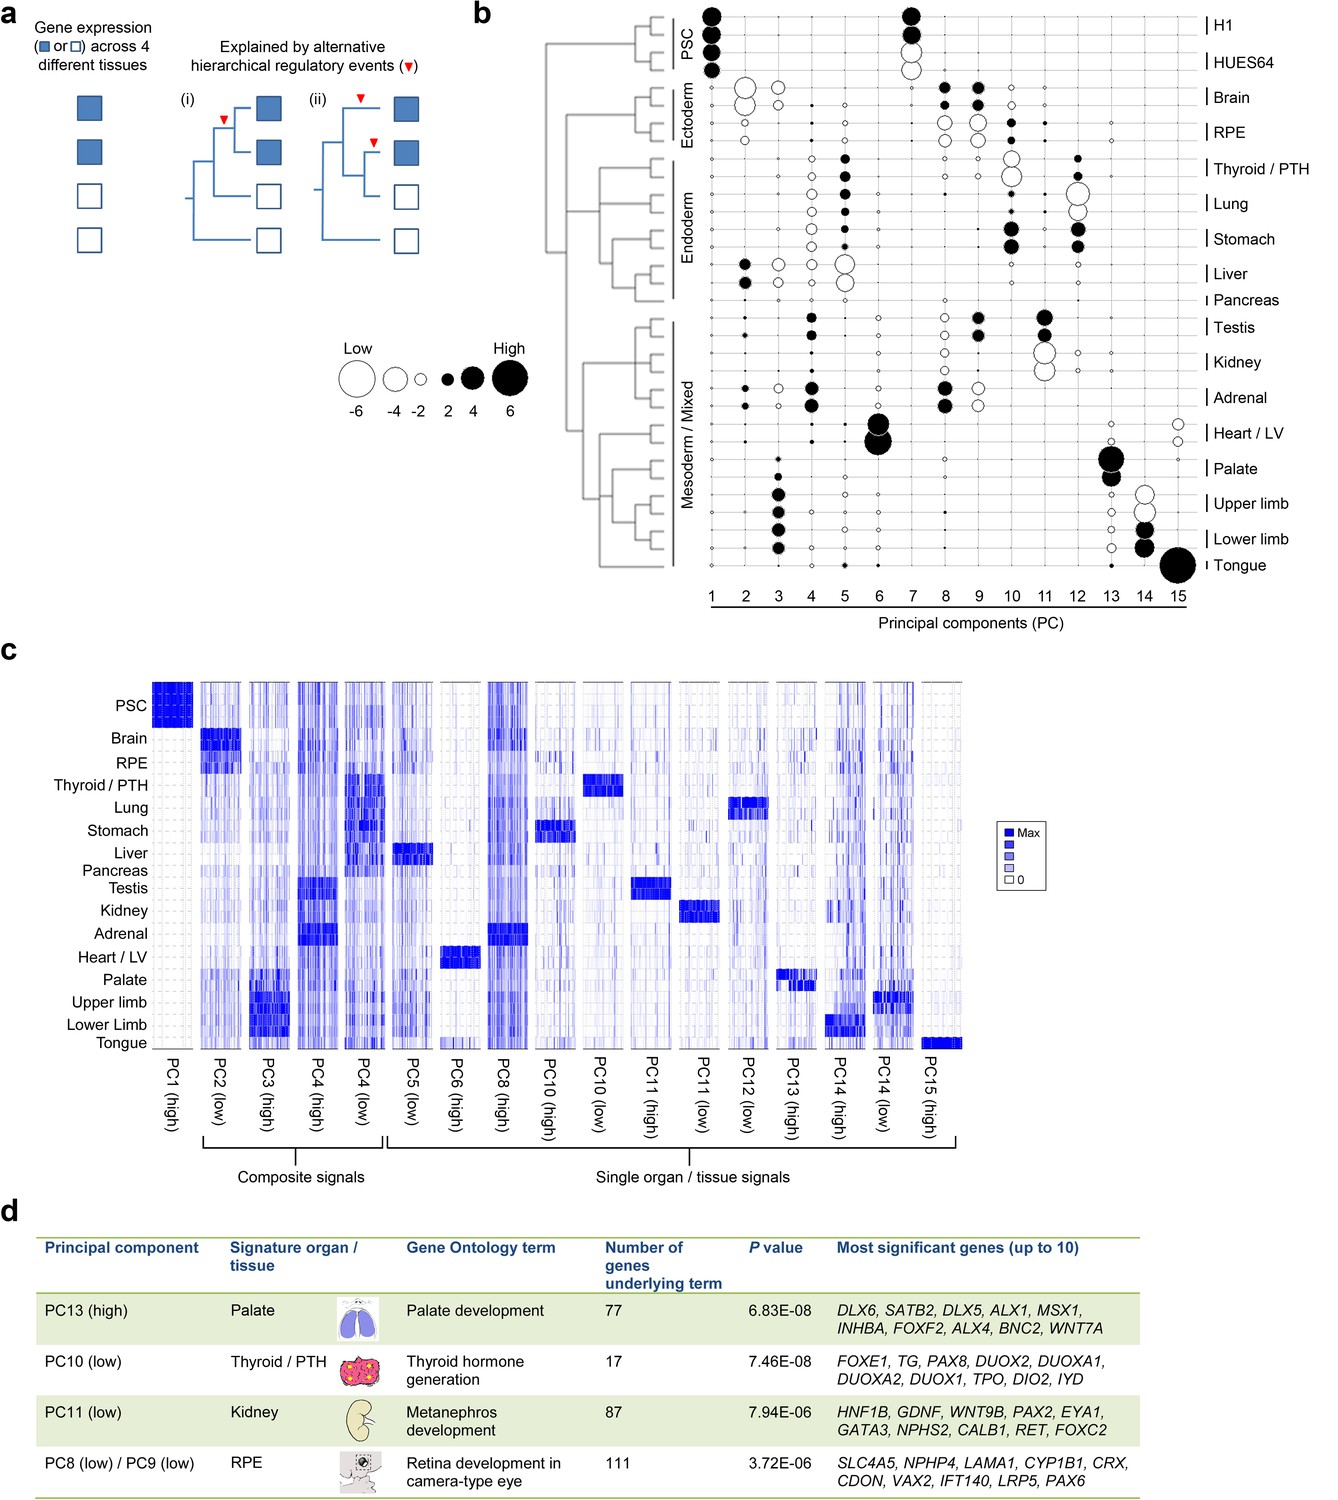
Lineage-guided PCA discovers unique transcriptional signatures regulating human organogenesis.
(a) Interpreting gene expression profiles is dependent upon the underlying developmental lineage. Similar expression profiles in closely related tissues imply fewer regulatory events. (b) Lineage-guided principal components analysis (LgPCA) constrains PCA by imposing a developmental lineage on the different organs and tissues. The first 15 PCs are shown including biological replicates for the human embryonic organs and tissues integrated with human embryonic stem cell data (Roadmap Epigenomics Consortium, 2015). PC scores for the 15 different dimensions are shown in black (positive/high) or white (negative/low) with scale (extremeness) indicated by circle size (sign/direction is arbitrary). Unique transcriptional signatures were resolved for broad organ groupings (e.g. foregut endoderm derivatives, low scores in PC4), single organs or tissues (e.g. palate, high scores in PC13) or across tissues unrelated by germ layer but connected by multisystem congenital disorders (e.g. heart and limb, low scores in PC13). (c) Heatmaps of quantile normalised expression values of the most extreme 50 genes for selected PCs from the LgPCA. (d) Gene Ontology (GO) terms and their underlying genes illustrate the specific signatures from the LgPCA (further examples in Supplementary file 1F).
Figure 2—figure supplement 1
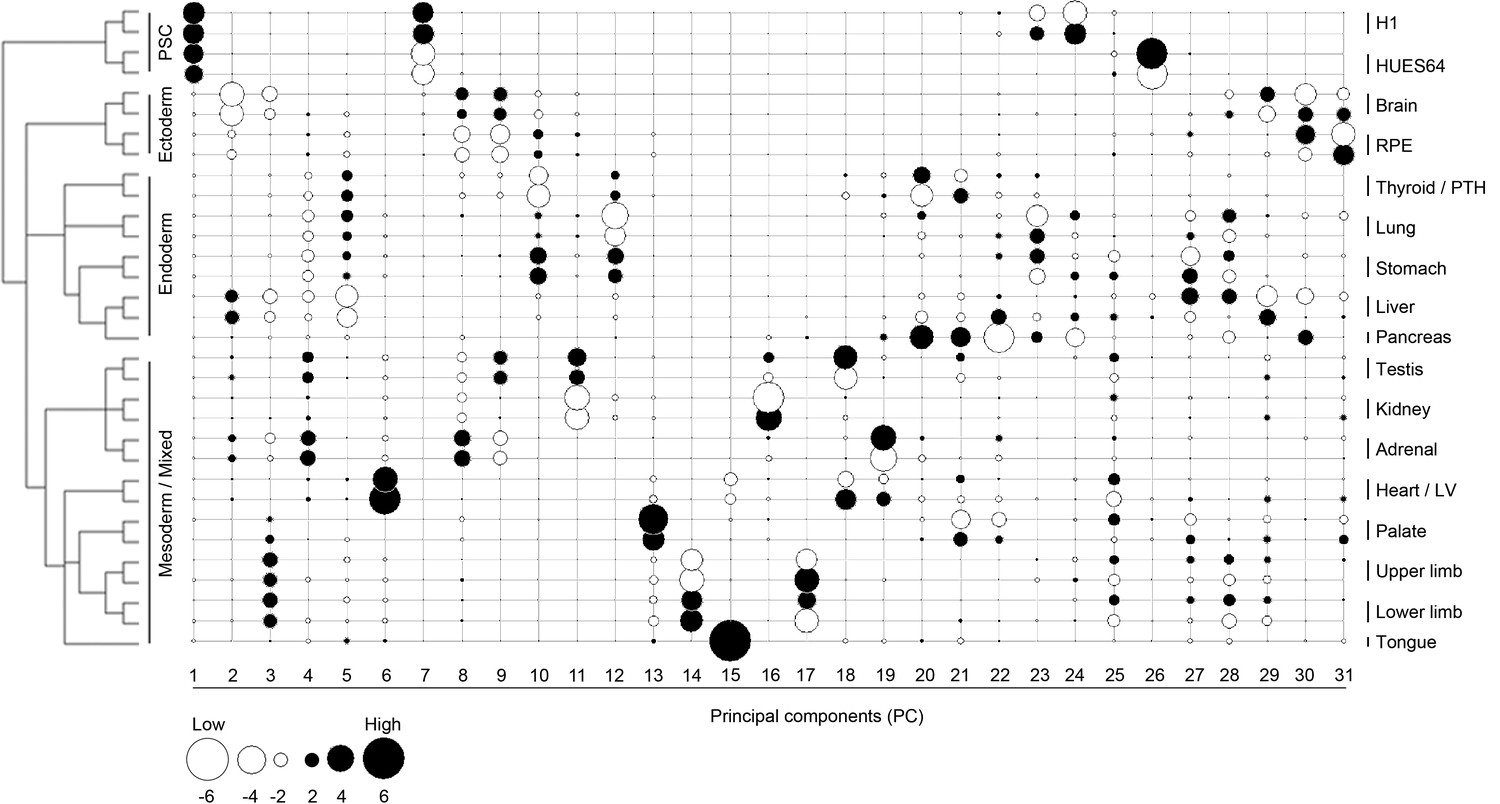
Lineage-guided principal components analysis (LgPCA) for all 31 PCs.
LgPCA showing all 31 PCs illustrating that global patterns (i.e. strong lineage and organ or tissue level signatures) emerge from the earlier PCs (≤PC15 to the left) while local patterns (e.g. heterogeneity between samples) become evident at ≥PC16, to the right). Many individual PCs gave very clear organ or tissue-specific signatures, however, the transcriptomes of most organs and tissues can also be represented by a composite of patterns visible across a number of different PCs.
Figure 3
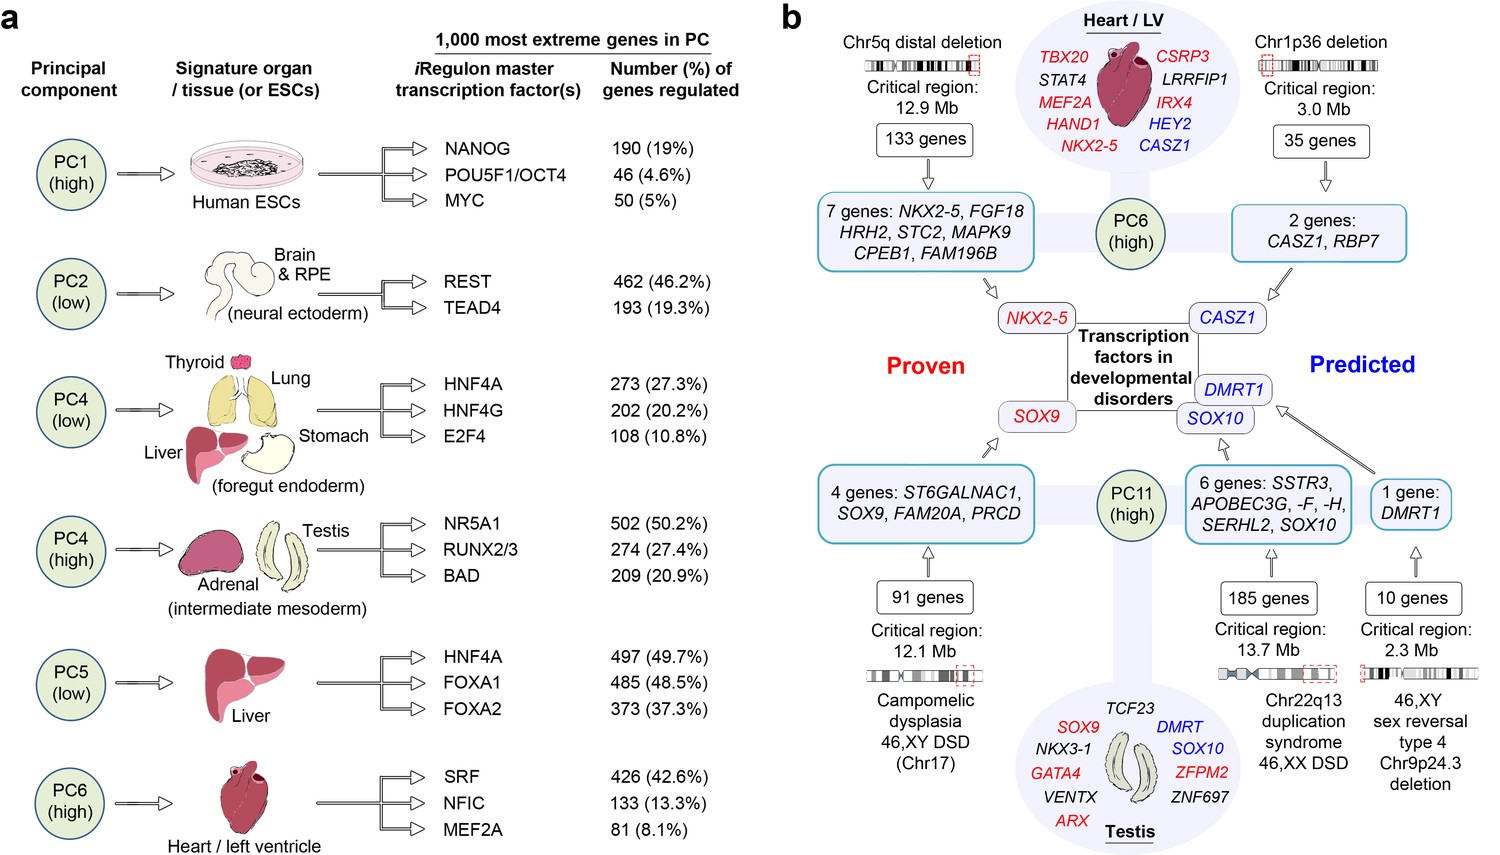
LgPCA points to master regulators of human organogenesis and the causes of human congenital disorders.
(a) Predicted regulation by iRegulon (Janky et al., 2014) of the most extreme 1000 genes for different PCs identifies known and unexpected transcription factors regulating human organogenesis. In several examples, individual transcription factors (e.g. REST, NR5A1, HNF4A, FOXA1 and SRF) were predicted to regulate nearly half of the most extreme 1000 genes. (b) Transcription factors at the extremes of individual PCs in the LgPCA are responsible for a diverse range of congenital disorders (red names in the ovals for heart and testis; full details in Supplementary file 1G). To validate the utility of these data, we conservatively selected some of the earliest critical regions for these disorders (two ‘Proven’ examples on the left; all 53 listed in Supplementary file 1H). LgPCA frequently isolated the correct transcription factor from an average of 111 genes across >10 Mb, shown for NKX2-5 in congenital heart disease and SOX9 in campomelic dysplasia. Beyond this validation LgPCA similarly predicts causative transcription factors (blue) for many unresolved congenital disorders such as developmental heart abnormalities in Chr1p36 deletion syndrome and sex reversal / disorders of sex differentiation (DSD) (all 13 examples in Supplementary file 1H).
Figure 4 with 1 supplement
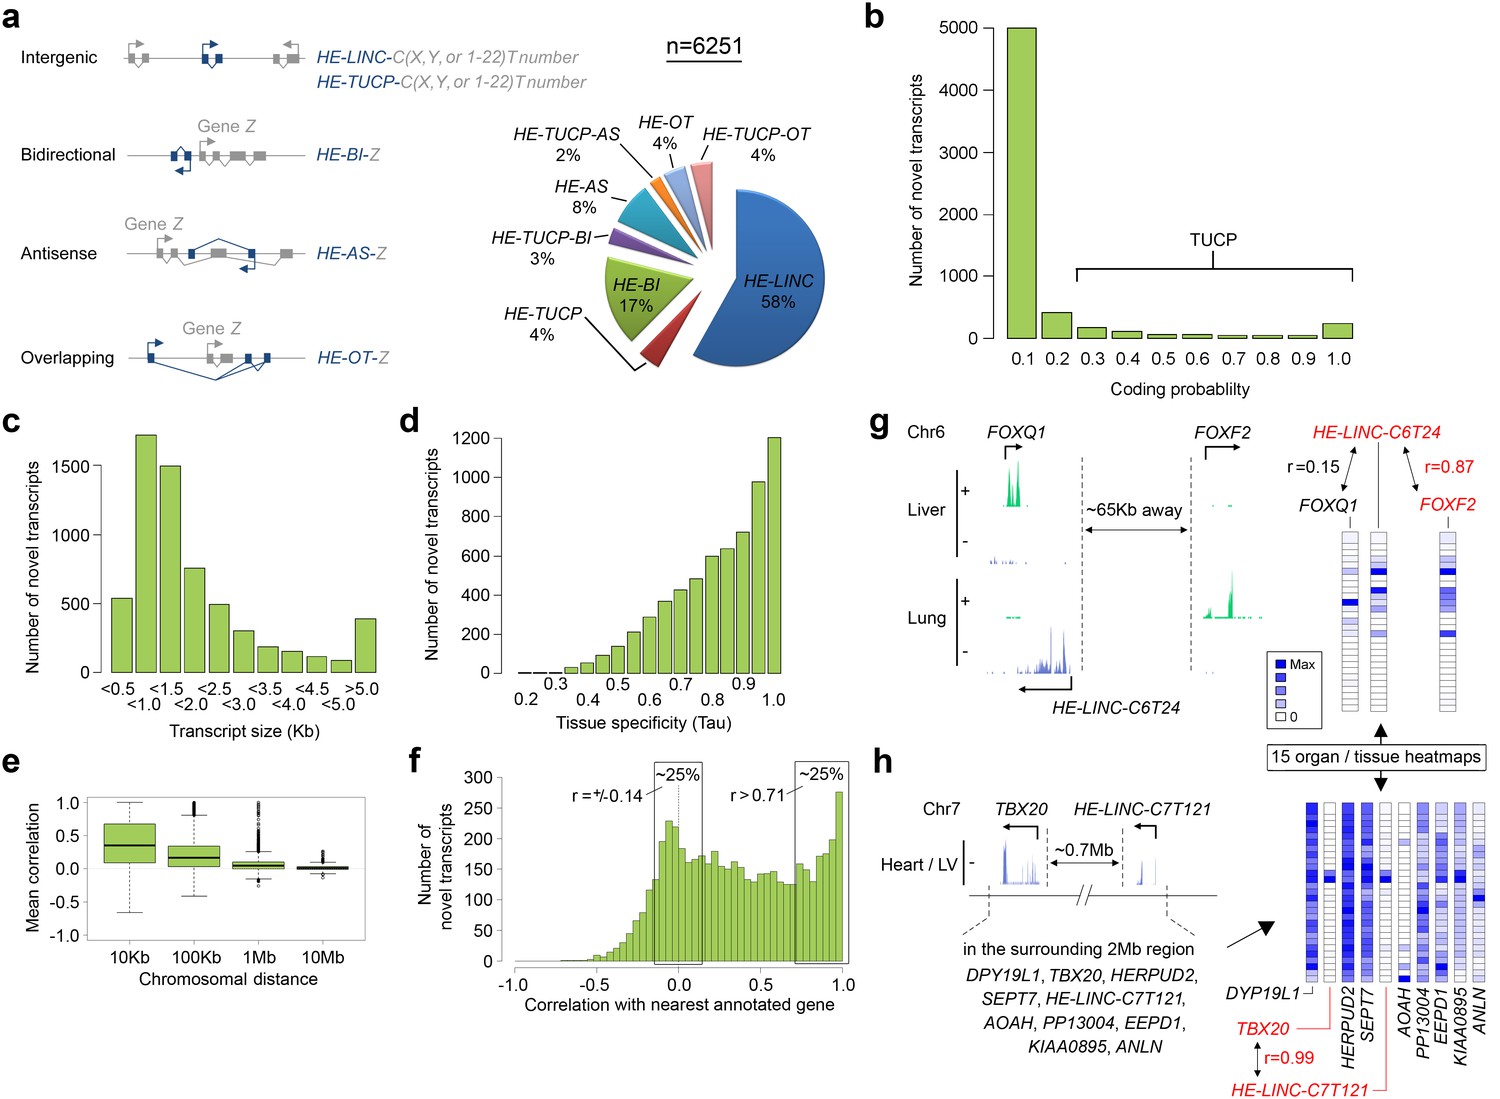
6251 novel transcripts identified during human organogenesis show low coding probability and high tissue-specificity.
(a) Novel transcript models were merged across tissues (n = 9180; Supplementary file 4), assessed for coding potential using CPAT and classified (Mattick and Rinn, 2015) as overlapping (OT), antisense (AS), bidirectional (BI), intergenic noncoding (LINC) and/or transcripts of uncertain coding potential (TUCP, if CPAT >0.2). LINC or TUCP transcripts were numbered sequentially (T number) along each chromosome (C, either X, Y or 1–22) whereas BI, AS and OT transcripts were named by association with the annotated gene (‘Z’). A small proportion of transcripts fulfilled dual criteria as BI/AS/OT and TUCP. 6251 unique, non-overlapping, filtered transcript models were identified (the longest from each locus, >200 bp; Supplementary file 1I). (b) Histogram of coding probability determined using CPAT (Wang et al., 2013). 9% of transcripts were classed as TUCP. The small proportion with clear open reading frames (CPAT score = 1.0) were predominantly OT transcripts. (c) Distribution by size of transcript. 114 transcripts were >10 Kb. (d) Tissue specificity was calculated using Tau (Yanai et al., 2005) based on the mean normalized read counts for each tissue or organ site. 80% of transcripts showed Tau values >0.7 indicating high tissue specificity. Details on exon and read counts, and proximity to surrounding genes are shown in Figure 4—figure supplement 1. (e) Box and whisker plots show the correlation between expression of the novel transcripts and surrounding annotated genes within set chromosomal distances of the novel transcriptional start site. Mean correlation was near zero beyond 1 Mb. (f) Histogram showing the correlation (r) between expression of each novel transcript and its closest annotated gene. One quarter of novel transcripts show a correlation (r > 0.71) with the nearest gene; another quarter shows minimal correlation (r = ±0.14). There was no strong anticorrelation. g-h, Expression of the novel transcript is not always correlated with the immediately adjacent gene, illustrated by heatmaps across the 15 organs and tissues. (g) Expression of the novel transcript, HE-LINC-C6T24, located just over 2 Kb from FOXQ1, correlates strongly with FOXF2, approximately 65 Kb distant. (h) Heatmap demonstrates the poor correlation of expression between HE-LINC-C7T121 and most of the nine genes within 1 Mb on Chr7 but near perfect correlation with TBX20 located ~0.7 Mb away beyond two intervening genes.
Figure 4—figure supplement 1
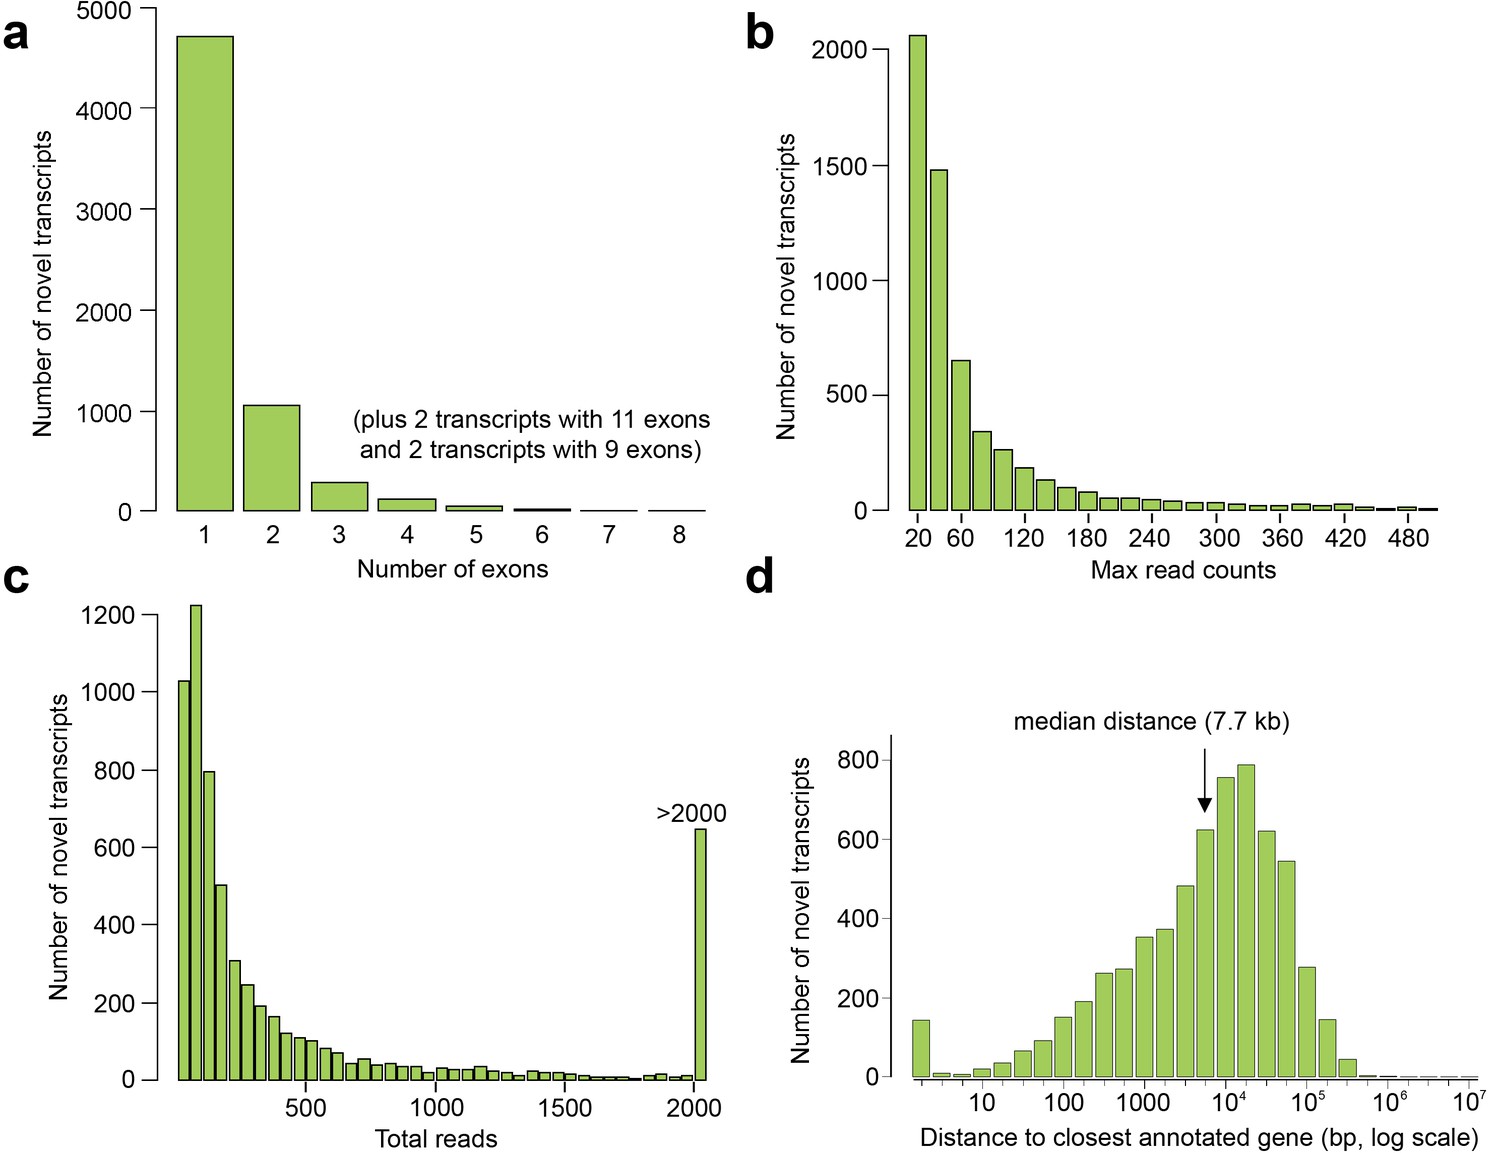
Exon and read counts and distance to the nearest annotated gene for the novel human embryonic transcripts.
(a–c) Histograms showing the number of exons (a), maximum read count for each transcript in any one tissue (b), and total reads (i.e. summed across all tissues) for each transcript (c). (d) Distance to the transcriptional start site (TSS) of the nearest annotated gene (GENCODE18) from the TSS of the novel transcript.
Additional files
-
Supplementary file 1
Supplementary tables.
(A) Samples used in this study. Details on the material derived from individual human embryos (each listed according to the Carnegie Stage (CS)) used in the biological replicates and the sequencing statistics for each sample. A conversion of Carnegie Stage to an approximate days post-conception is available in Jennings et al. (2015) (open access). Gene level read counts are available for download as a TSV file in Supplementary file 2. (B) Differential gene expression between paired embryonic and fetal RNA-seq data. The R package edgeR (Robinson et al., 2010) was used to test for differential gene expression between embryonic and fetal (Roadmap Epigenomics Consortium, 2015) datasets. Shared tissues were adrenal gland, heart, lung, stomach, kidney, upper limb, lower limb and testis. The table is sorted by FDR (column H) and can be filtered by log fold change (column E) to give embryo-enriched genes (negative values) or fetal-enriched genes (positive values). (C) Gene Ontology (GO) terms and the genes underlying them for embryonic vs.fetal (Roadmap) up-regulated genes. Genes up-regulated in embryonic tissues versus fetal tissues (edgeR, FDR < 0.05, see Supplementary file 1B) were tested for GO term enrichment using Fisher’s exact test and the elimination algorithm implemented in the R package topGO (Alexa and Rahnenfuhrer, 2010). Separate tests were run for embryo up-regulated and fetal up-regulated genes. The table is sorted by enrichment in embryonic genes. (D) Tissue-specific genes contributing to metagenes. All genes with relative basis contribution (across metagenes) greater than 0.8 are listed. (E) The most extreme 1000 genes (high and low) for all principal components (PC1-31) of the LgPCA. The dataset is derived from genes annotated in GENCODE18. Raw gene-level loadings for each principal component are available for download as a TSV file in Supplementary file 3. (F) Gene Ontology (GO) terms and the genes underlying them for organ and tissue-specific transcriptomic signatures from the extremes of the LgPCA. GO terms were identified as enriched in extreme scoring genes (annotated in GENCODE 18) in the principal components (PCs) of the LgPCA. Due to the very large number of terms returned at p<0.0001 by Wilcoxon test (the topGO 'elim' method, see Materials and methods) an illustrative selection are listed with raw gene-level loadings available for download in Supplementary file 3. (G) Transcription factors in the extremes of the LgPCA and their links to developmental morbidity. The most extreme 1000 annotated genes (GENCODE 18) of the LgPCA dataset were filtered for transcription factors based on KEGG and PHANTOM5 annotations and for read counts >500. To identify disease associations each gene was entered as a search term in OMIM (www.ncbi.nlm.nih.gov/omim) and in PubMed. Batch queries were undertaken at Mouse Genome Informatics (MGI, www.informatics.jax.org) with 'Mammalian phenotype' as the output. (H) LgPCA predictions of causal genes for critical regions in either solved or unsolved developmental disorders. Fifty-three developmental disorders (Column A, 'solved') with causally associated transcription factors identified in the appropriate transcriptomic signature of Supplementary file 1G were originally defined by critical regions (Column C with hyperlink). These critical regions were identified by searching OMIM and usually derived from mapping data on affected families or chromosomal deletions in affected patients. Larger critical regions were preferentially selected to test more meaningfully whether the LgPCA model could have pinpointed the causal gene based solely on transcriptomic signatures that involved an affected organ(s) or tissue(s) (Column B). The average critical region was 13.7 Mb (Column D) and contained an average of 111 protein-coding genes (Column E; identified from searching BIOMART on ENSEMBL). In 48/53 instances (91%), LgPCA narrowed the field down to three or fewer transcription factors and in 37 instances (73%) excluded all except the correct transcription factor. Therefore, the same approach was applied to 13 unsolved developmental disorders (mostly deletion syndromes) with predictions made in each case for any type of protein-coding gene (Column H) and transcription factor(s) (Column I). In many instances the transcription factor in Column I possesses an appropriate mutant mouse phenotype. (I) 6251 unannotated transcripts identified during human organogenesis. These are the 6251 novel and distinct transcripts underlying Figure 4 of the main text, which also describes the transcript classification: Anti-sense (AS), Overlapping (OT), Bidirectional (BI), Long-intergenic non-coding (LINC) and / or Transcripts of uncertain coding potential (TUCP) (based on Mattick and Rinn, 2015). Intergenic transcripts are numbered sequentially within each chromosome. Exon lengths and starts (blocks) are recorded here in UCSC BED12 format. Correlations in expression profile were calculated for annotated genes with transcript transcriptional start sites situated within 1 Mb of the novel transcript TSS; the total number of genes in this window is listed. Columns AF-AT (organs and tissues) represent mean, quantile-normalised read counts across tissue replicates. Correlations (and distance) are shown for the closest, best correlated or best anti-correlated genes and were generated using only embryonic RNA-seq data. The pipeline to generate transcripts, distinguish them from previous annotations, name, characterise and filter is described in the Materials and methods. (J) NIH roadmap samples (Kundaje et al., 2015) used in this study.
- https://doi.org/10.7554/eLife.15657.014
-
Supplementary file 2
Gene level non-normalised RNA-seq read counts by sample for 42,423 gene annotations in GENCODE18.
Gene details are given plus the minimum, maximum, median and standard deviation of read counts. Additionally, tissue-specificity is scored using Tau (Yanai et al., 2005) where ‘0’ is equally expressed across all organs and tissues and ‘1’ indicates absolute specificity to one site.
- https://doi.org/10.7554/eLife.15657.015
-
Supplementary file 3
LgPCA scores.
Raw gene-level scores for each principal component of the LgPCA.
- https://doi.org/10.7554/eLife.15657.016
-
Supplementary file 4
Unfiltered novel transcripts.
Prior to filtering a total of 9180 transcripts were detected during human organogenesis that are not annotated in GENCODE 18. The 6251 transcripts summarised in Figure 4 of the main text and listed in Supplementary file 1I (Excel file) are marked by column ‘filter_score’. The data include quantile normalized read counts for all embryonic samples in this study and a mean for each organ or tissue type. In addition to the correlations in Supplementary file 1I, the distances to, and correlations with, both the closest upstream transcription termination site (TTS) and downstream transcription start sites (TSS) of adjacent, same-strand genes are given to aid filtering for potential 5’ and 3’ run-ons. For comparison, the NIH Roadmap sample (adult and fetal) with most reads for each novel transcript is listed separately.
- https://doi.org/10.7554/eLife.15657.017
-
Supplementary file 5
Transcription factor atlas of human organogenesis (high resolution).
High resolution version of Figure 1—figure supplement 1 where each individual transcription factor is text searchable. (Please note that this opens at 25 x 200 inches / 64 x 508 cm).
- https://doi.org/10.7554/eLife.15657.018
Download links
A two-part list of links to download the article, or parts of the article, in various formats.
Downloads (link to download the article as PDF)
Open citations (links to open the citations from this article in various online reference manager services)
Cite this article (links to download the citations from this article in formats compatible with various reference manager tools)
An integrative transcriptomic atlas of organogenesis in human embryos
eLife 5:e15657.
https://doi.org/10.7554/eLife.15657


