Bile salt receptor complex activates a pathogenic type III secretion system
- University of Texas Southwestern Medical Center, United States
- Howard Hughes Medical Institute, University of Texas Southwestern Medical Center, United States
Figures
Figure 1 with 2 supplements
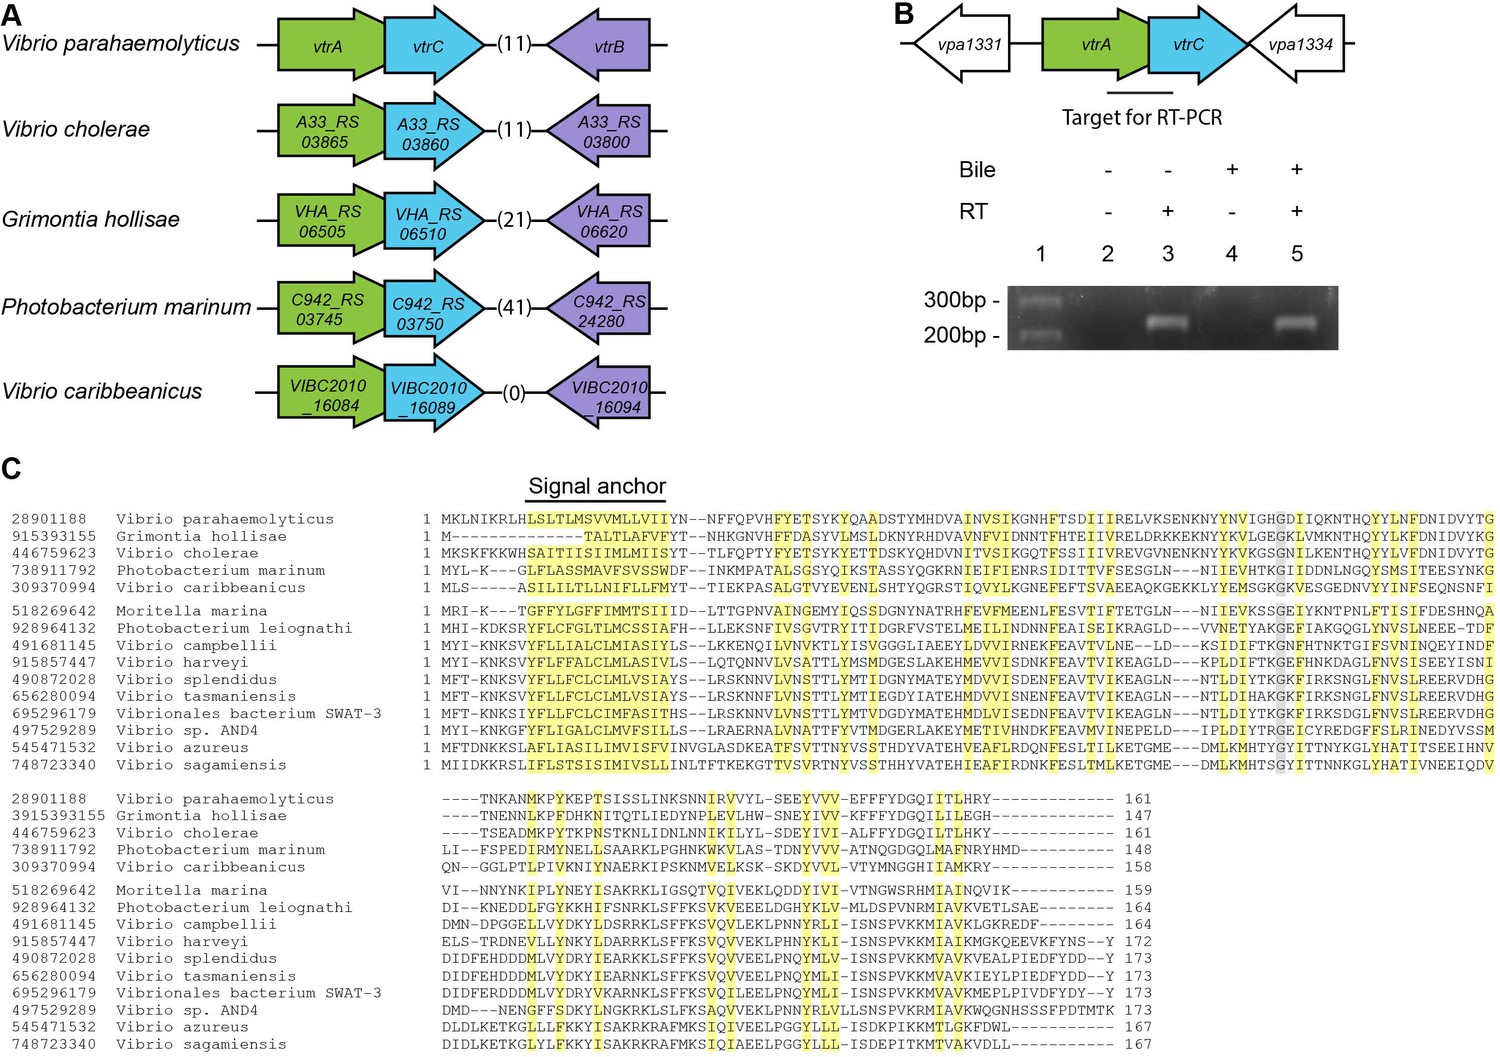
VtrC is conserved in various Vibrio and other species with VtrA-like sequences.
(A) The gene organization of vtrA, vtrC, and vtrB is conserved in the T3SS2-like pathogenicity island of Vibrionaceae family species, with variable numbers of inserted genes (indicated by numbers in parentheses) between vtrC (or its homologous gene) and vtrB (or its homologous gene). (B) RT-PCR to amplify the target region shown by the bar that spans vtrA and vtrC. - Bile, Vibrio parahaemolyticus POR1 strain growing in LB without bile salts; + Bile, POR1 growing in LB supplemented with 0.05% bile salts. - RT, without reverse transcriptase; + RT, with reverse transcriptase; lane 1: DNA marker. RT-PCR is representative of three independent experiments. (C) Multiple protein sequence alignment of VtrC and its homologues. GI number of each protein is listed before the species names. Residues are highlighted according to group-wise conservations: mainly hydrophobic (yellow) and small (gray). Signal anchor: the predicted N-terminal transmembrane domain. An empty line is inserted between the species that contain (top) or lack (bottom) vtrB (or vtrB homologous gene). *marks protein sequences that were translated from nucleotide to include the entire N-terminus.
Figure 1—figure supplement 1
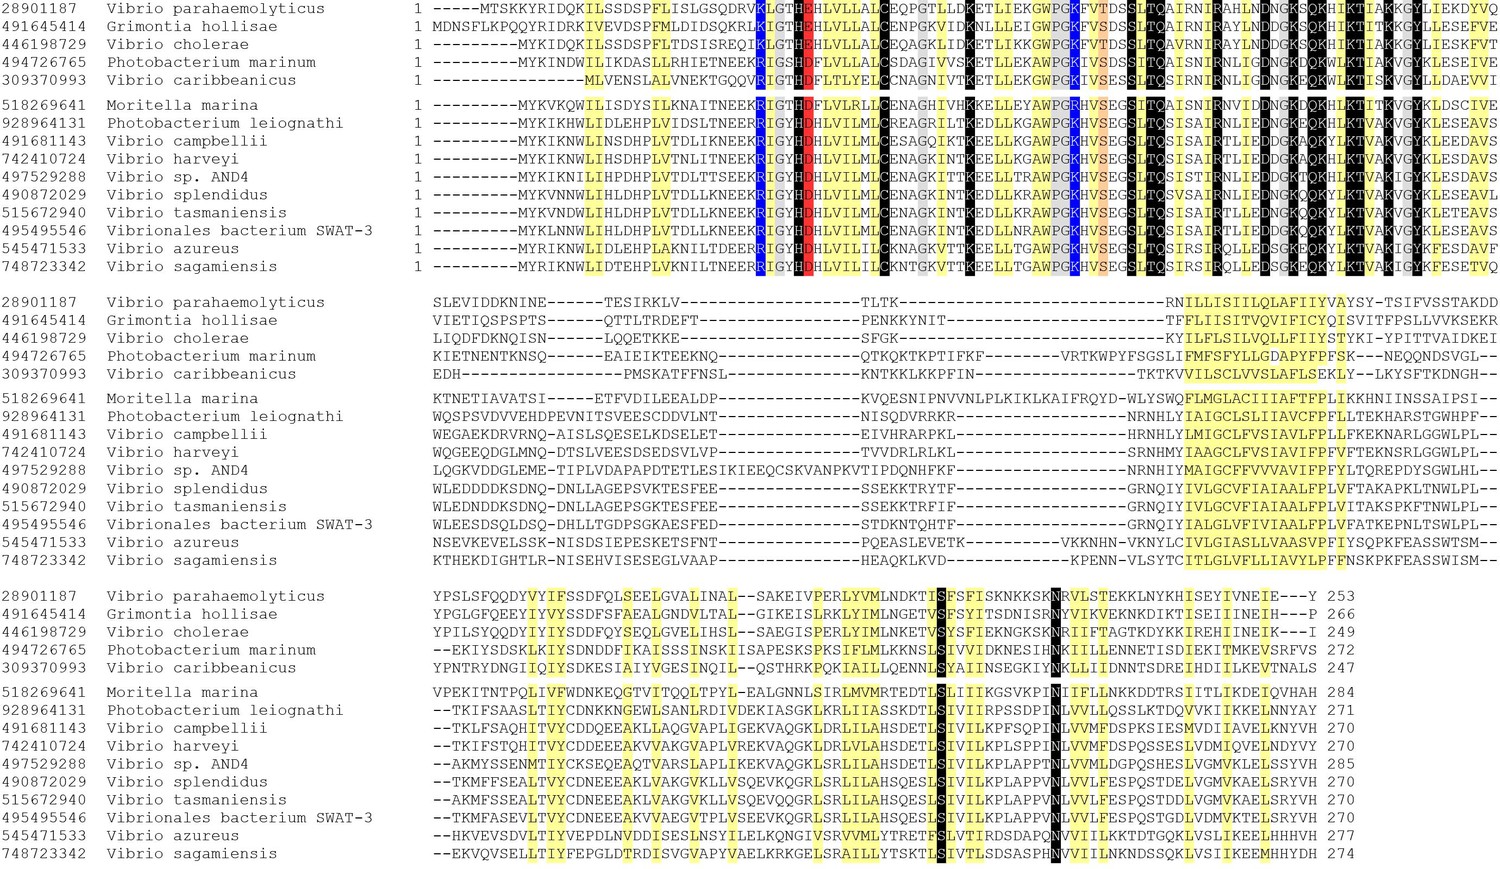
Multiple protein sequence alignment of VtrA and its homologues.
GI number of each protein is listed before the species names. Residues are highlighted according to group-wise conservations: mainly hydrophobic (yellow), small (gray), conserved positive charge (blue), conserved negative charge (red), conserved S/T (orange), and invariant polar position (black). An empty line is inserted between the two groups of species that either contain (top) or lack (bottom) vtrB (or vtrB homologous gene).
Figure 1—figure supplement 2
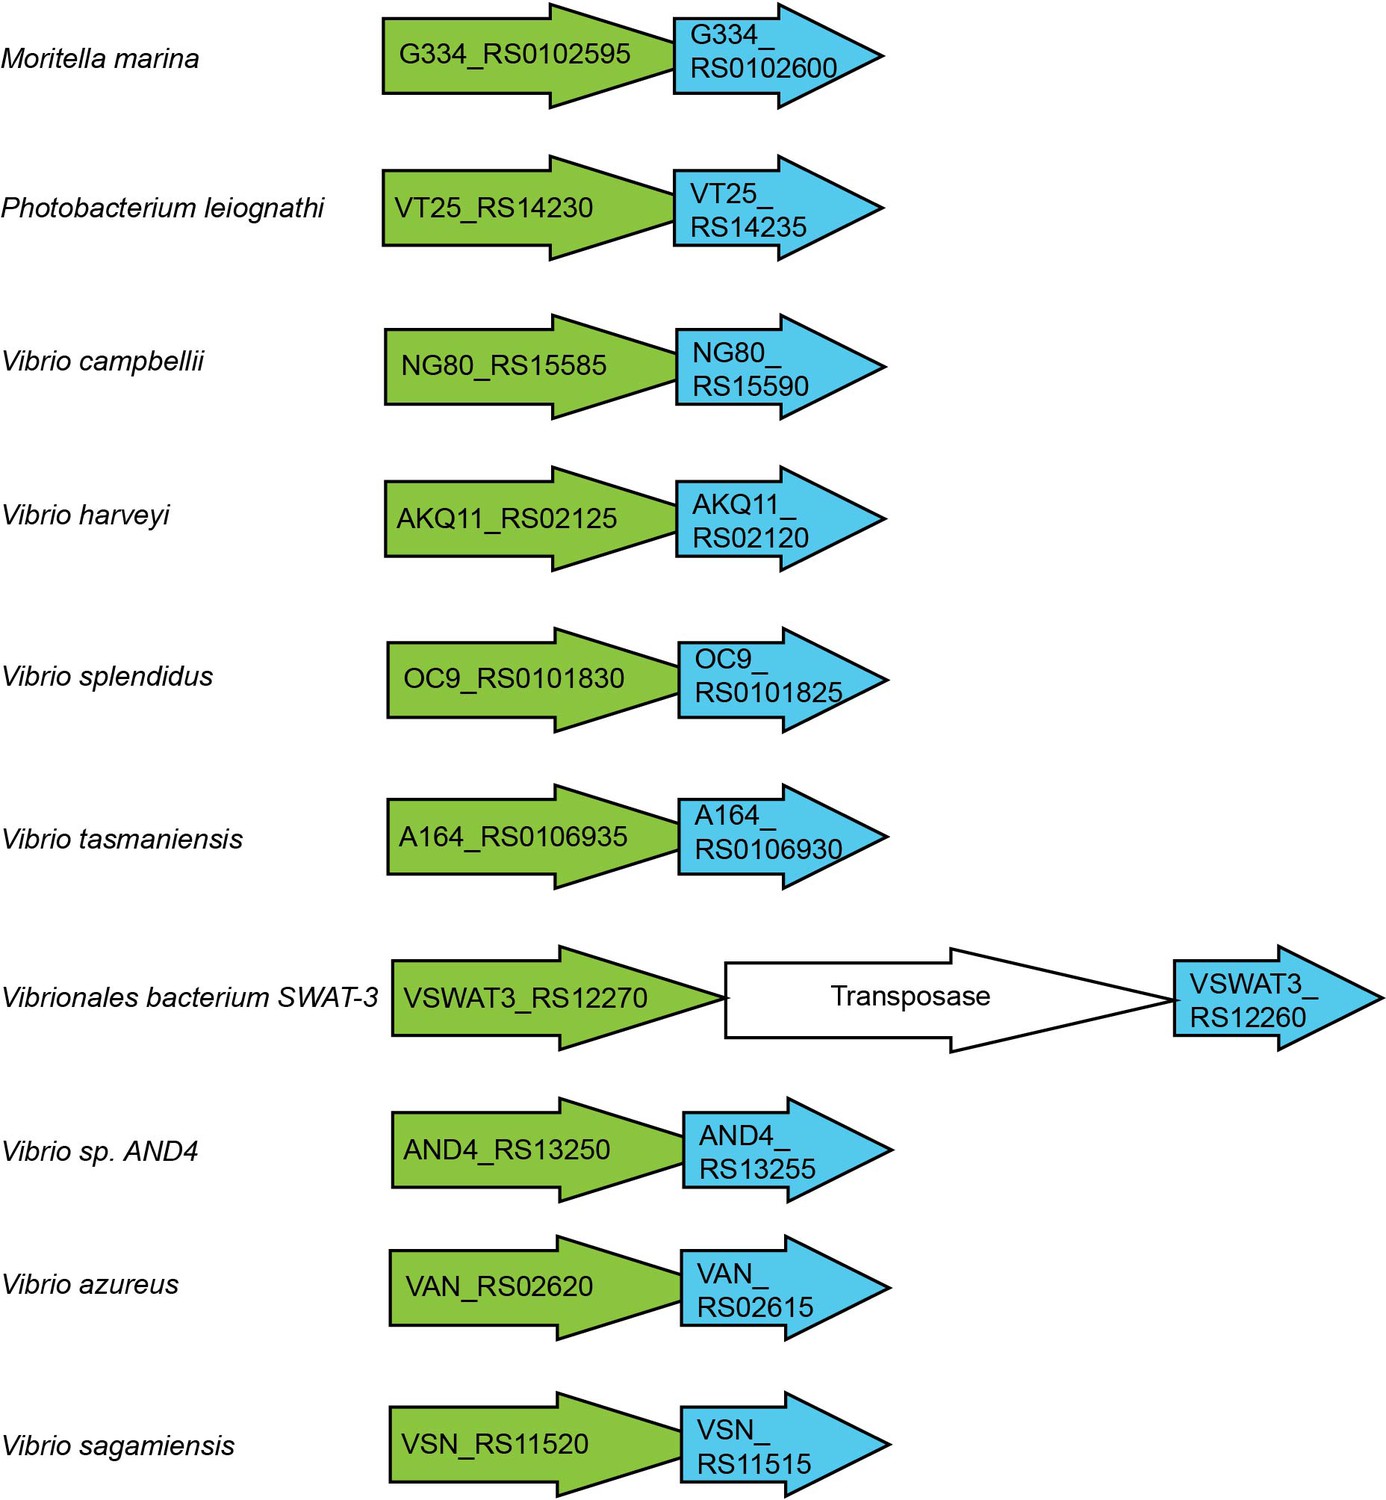
The gene organization of vtrA and vtrC in species that lack vtrB.
The gene organization of vtrA and vtrC homologous genes is conserved in Vibrionaceae and Moritellaceae family species.
Figure 2
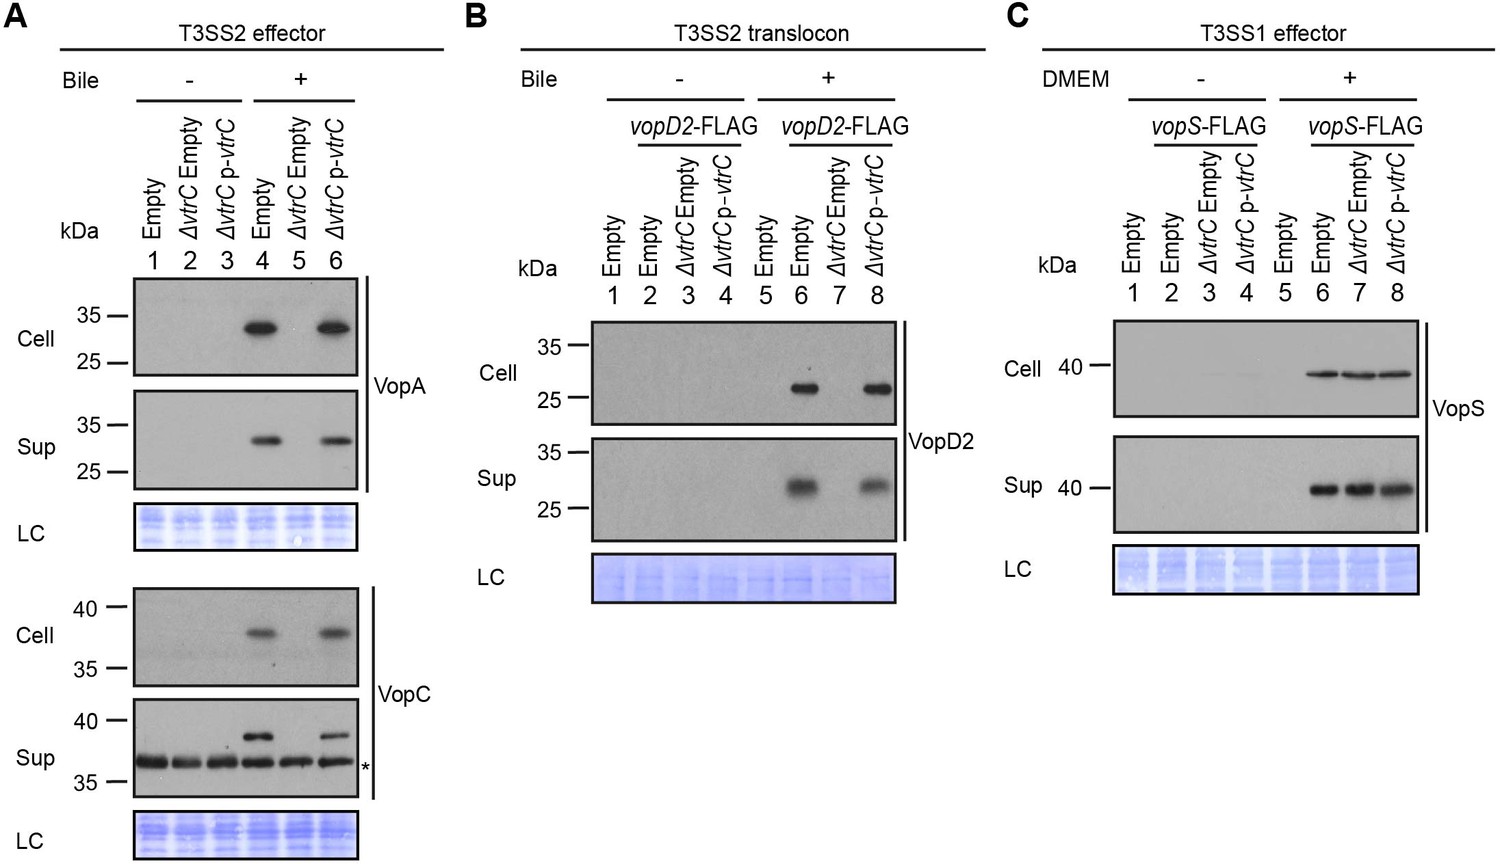
VtrC is essential for the activity of V. parahaemolyticus T3SS2 in the presence of bile salts.
Expression (Cell) and secretion (Sup) of V. parahaemolyticus T3SS components were analyzed by Western blot. Loading control (LC) is shown for total protein lysate. (A–B) Expression and secretion of T3SS2 effectors VopA and VopC, and translocon VopD2 by V. parahaemolyticus POR1 derivative strains with the empty pBAD vector (Empty), vtrC deletion (ΔvtrC Empty) or vtrC complementation (ΔvtrC p-vtrC) containing a pBAD vector expressing VtrC under the putative promoter of its operon (1kb upstream of vtrA). Protein-specific antibodies were used to detect VopA and VopC. Anti-FLAG antibody was used to detect C-terminal endogenously FLAG-tagged VopD2. -/+ Bile, V. parahaemolyticus grown in LB without bile salts (-) or supplemented with 0.05% bile salts (+). Non-specific band is indicated with an asterisk. (C) Expression and secretion of T3SS1 effector VopS by V. parahaemolyticus POR1 derivative strains with the empty pBAD vector (Empty), vtrC deletion (ΔvtrC Empty) or vtrC complementation (ΔvtrC p-vtrC). Anti-FLAG antibody was used to detect endogenously C-terminal FLAG-tagged VopS. -/+ DMEM, V. parahaemolyticus grown in LB (-) or DMEM (+). Data is representative of three independent experiments.
Figure 3
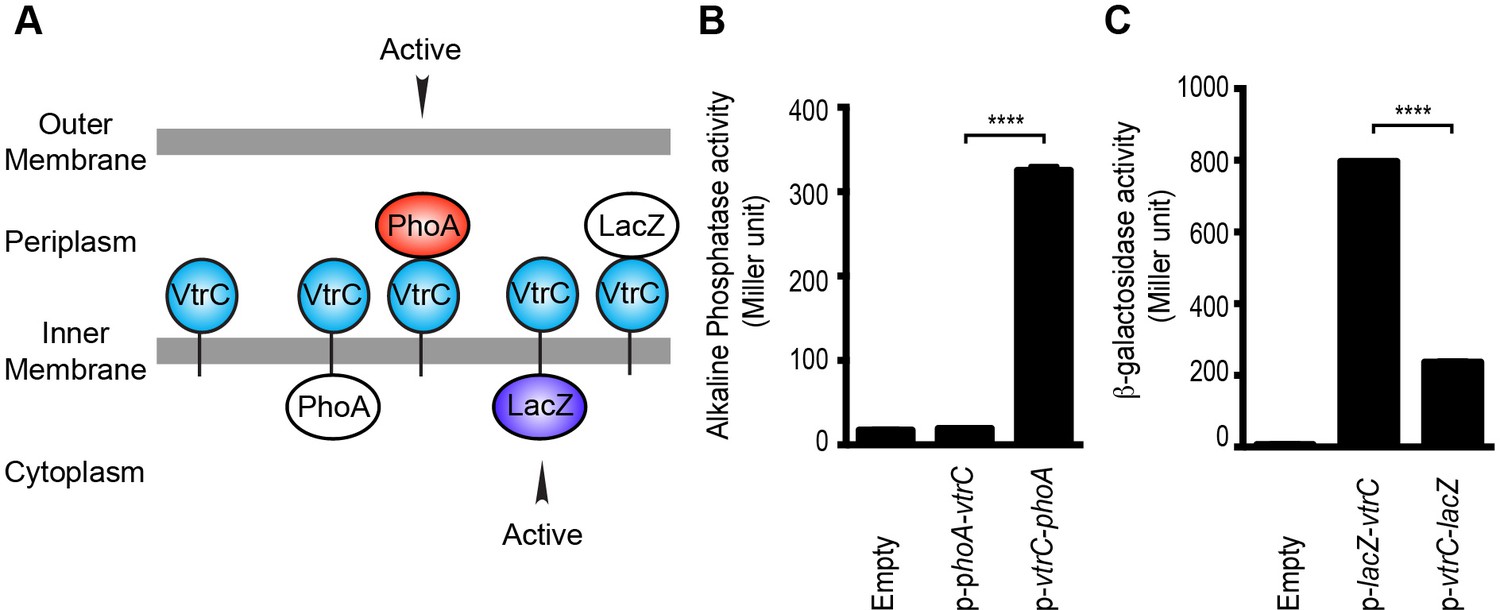
VtrC is an inner membrane protein with the N-terminus in the cytoplasm and the C-terminus in the periplasm.
(A) Predicted cellular localization and orientation of VtrC. Active form of PhoA or LacZ fused to VtrC based on prediction. (B) Alkaline phosphatase PhoA activity of POR1 with the empty pBAD vector (Empty), expressing N terminal PhoA-VtrC (p-phoA-vtrC) or C terminal VtrC-PhoA (p-vtrC-phoA) fusion protein. (C) β-galactosidase LacZ activity of POR1 with the empty pBAD vector (Empty), expressing N terminal LacZ-VtrC (p-lacZ-vtrC) or C terminal VtrC-LacZ (p-vtrC-lacZ) fusion protein. ****p<0.0001, n = 3, +/- S.E.M. Data is representative of three independent experiments.
Figure 4
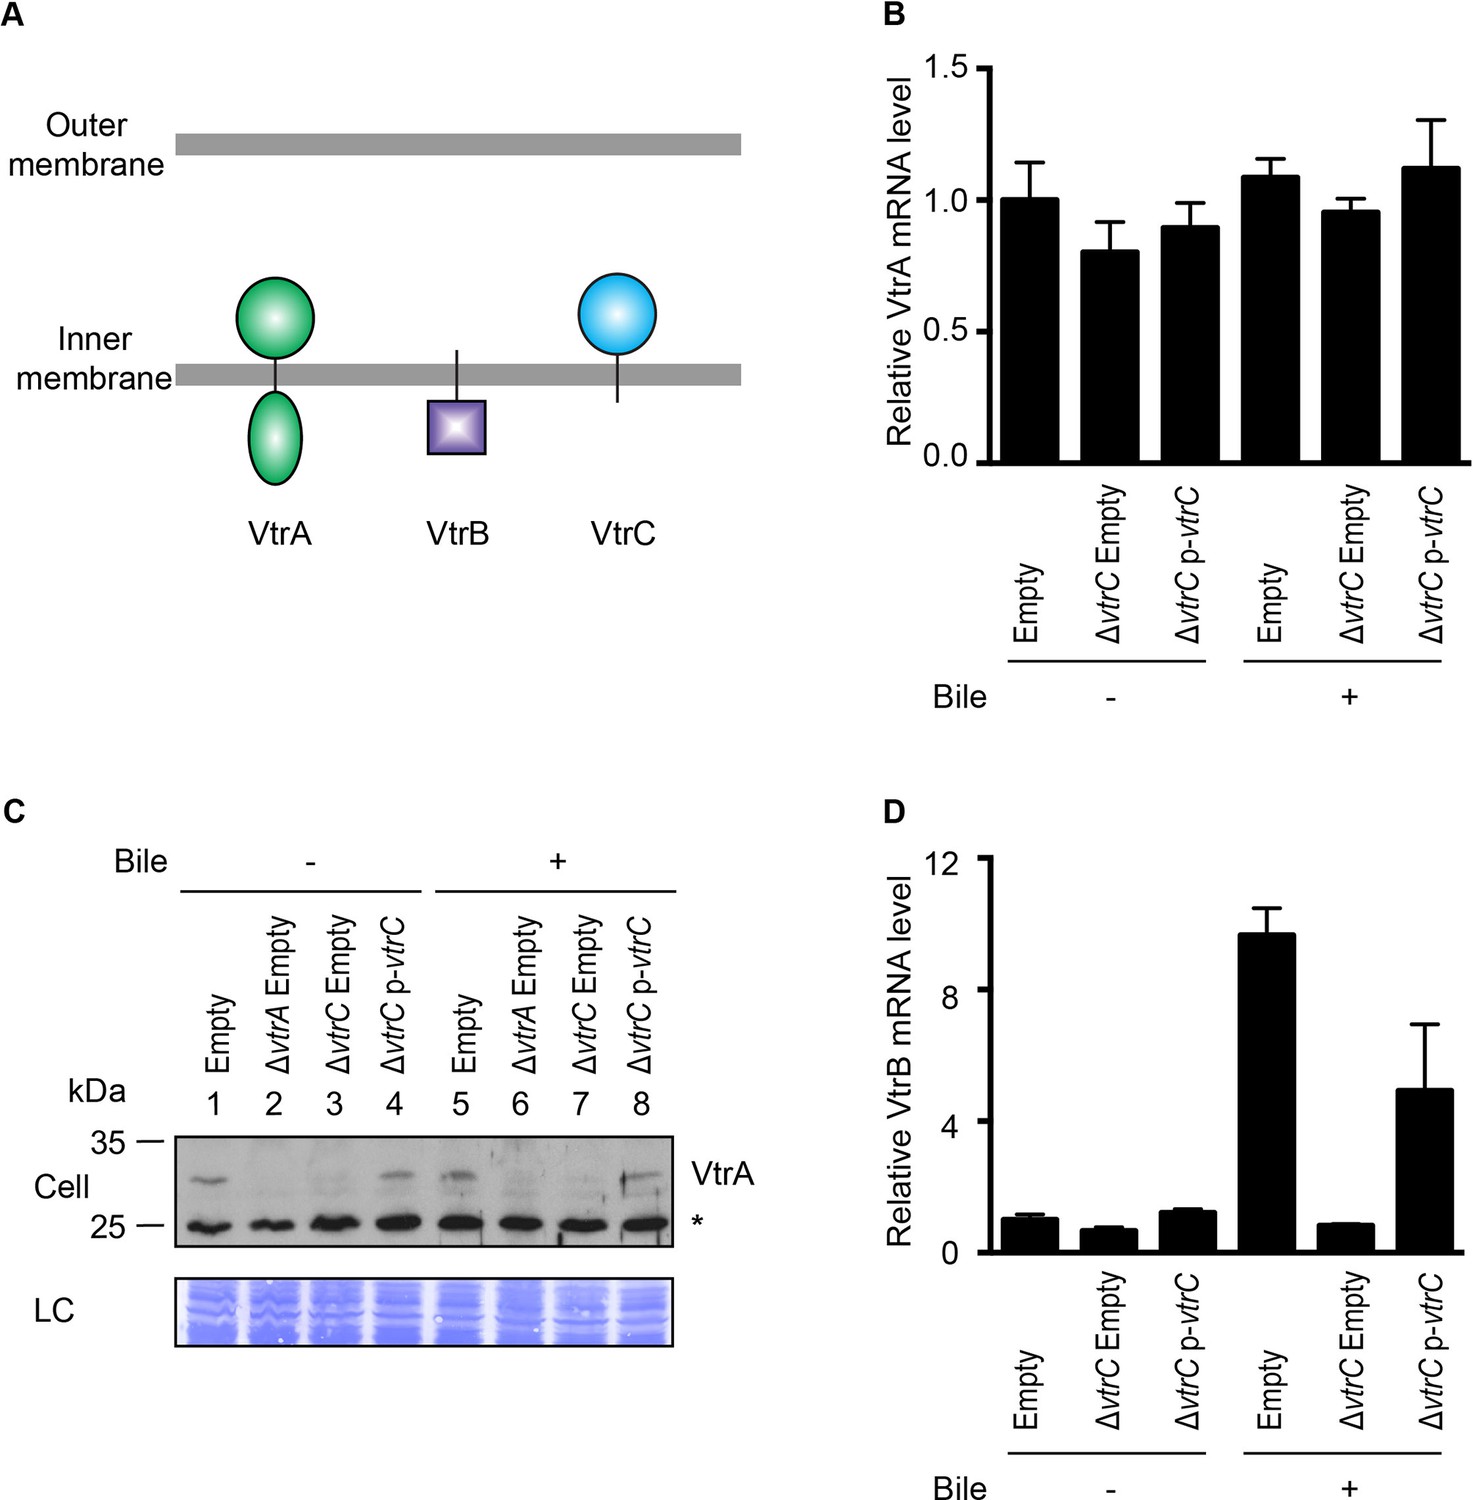
VtrC is necessary for maintaining VtrA protein level and the induction of VtrB.
The effects of VtrC on VtrA and VtrB were characterized using V. parahaemolyticus POR1 derivative strains with the empty pBAD vector (Empty), vtrA deletion (ΔvtrA Empty), vtrC deletion (ΔvtrC Empty) or vtrC complementation (ΔvtrC p-vtrC) containing a pBAD vector expressing VtrC under the putative promoter of its operon (1kb upstream of vtrA). (A) Cellular localization and orientation of VtrA, VtrB and VtrC. (B) qRT-PCR analysis of VtrA mRNA level relative to POR1 with the empty pBAD vector (Empty) grown in LB without bile salts. (C) Western blot analysis of VtrA protein level. Protein specific antibody was used to detect VtrA. Non-specific band is indicated with an asterisk. (D) qRT-PCR analysis of VtrB mRNA level relative to POR1 with the empty pBAD vector (Empty) grown in LB without bile salts. -/+ Bile, V. parahaemolyticus grown in LB without bile salts (-) or supplemented with 0.05% bile salts (+). For qRT-PCR analysis, expression of vtrA and vtrB was normalized to the expression of the control gene fliA. Data is representative of three independent experiments.
Figure 5 with 1 supplement
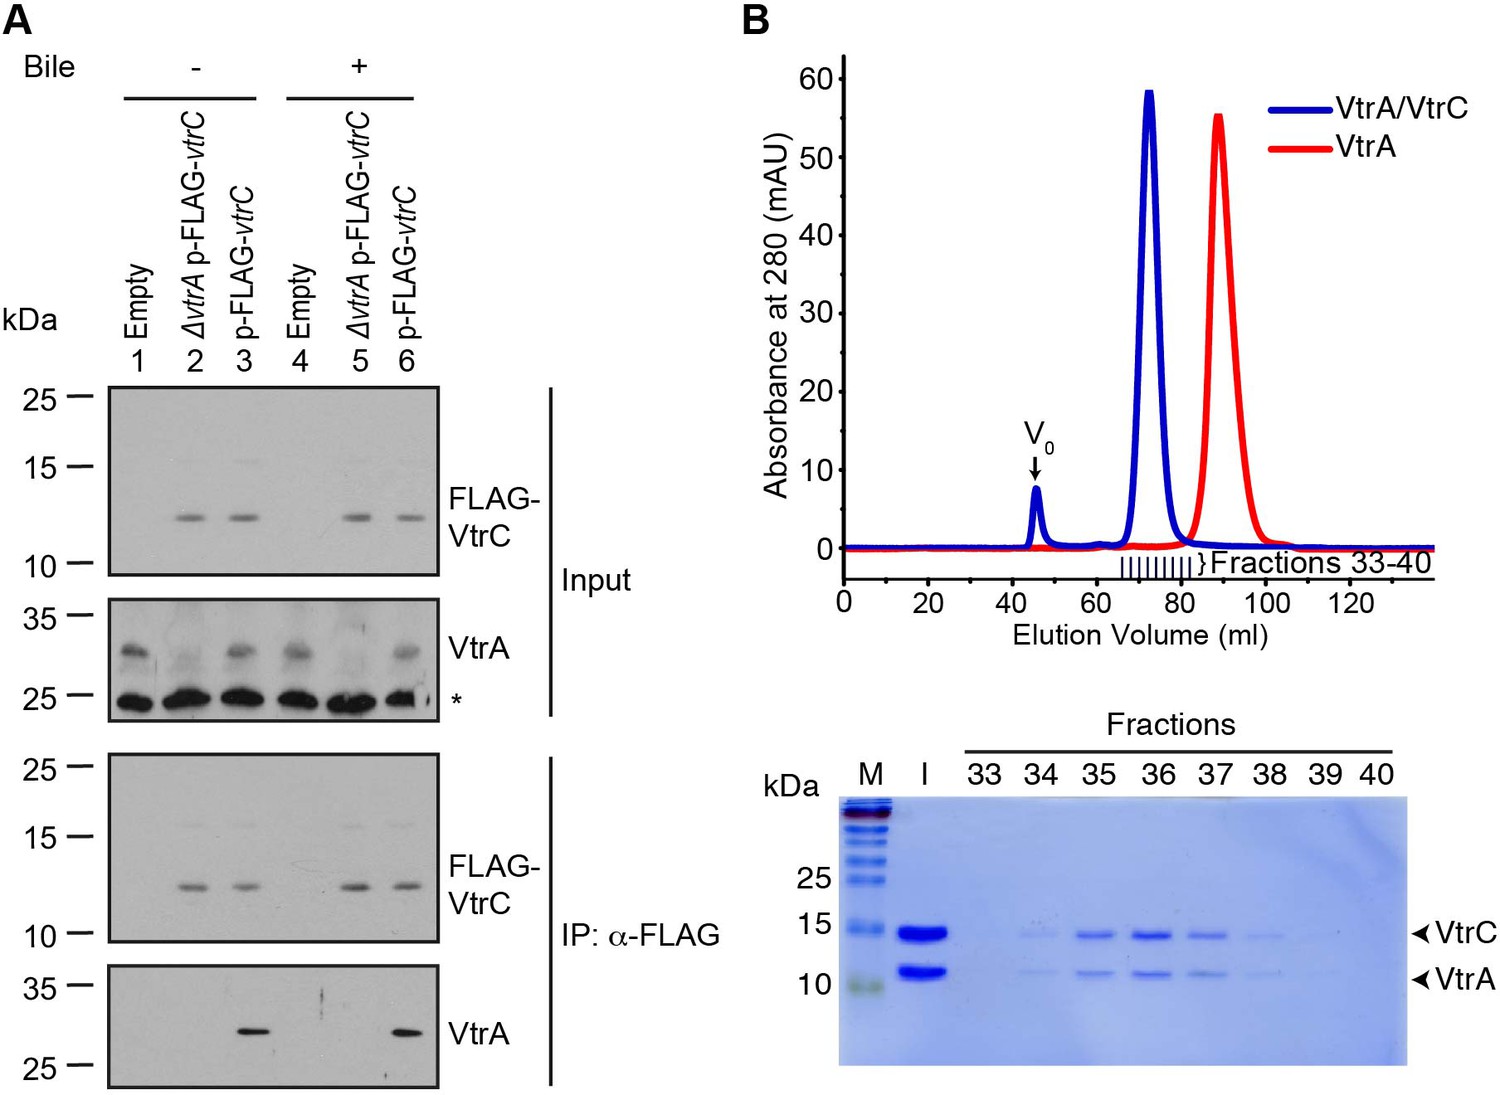
VtrA and VtrC form a complex.
(A) Co-immunoprecipitation (Co-IP) of endogenous VtrA and vector induced FLAG-VtrC. pBAD vector induced N-terminal FLAG-tagged VtrC was immunoprecipitated with anti-FLAG affinity gel from V. parahaemolyticus POR1 derivative strains that express only VtrA (Empty), only N-terminal FLAG-tagged VtrC (ΔvtrA p-FLAG-vtrC), or both (p-FLAG-vtrC). Protein-specific antibody was used to detect VtrA. Anti-FLAG antibody was used to detect FLAG-VtrC. -/+ Bile, V. parahaemolyticus grown in LB without bile salts (-) or supplemented with 0.05% bile salts (+). Non-specific band is indicated with an asterisk. Data is representative of three independent experiments. (B) Top, gel filtration analysis of the VtrA/VtrC periplasmic domain complex, void volume of the column is indicated as V0. Bottom, SDS-PAGE analysis of samples from the fractions corresponding to the elution peak of the complex.
Figure 5—figure supplement 1
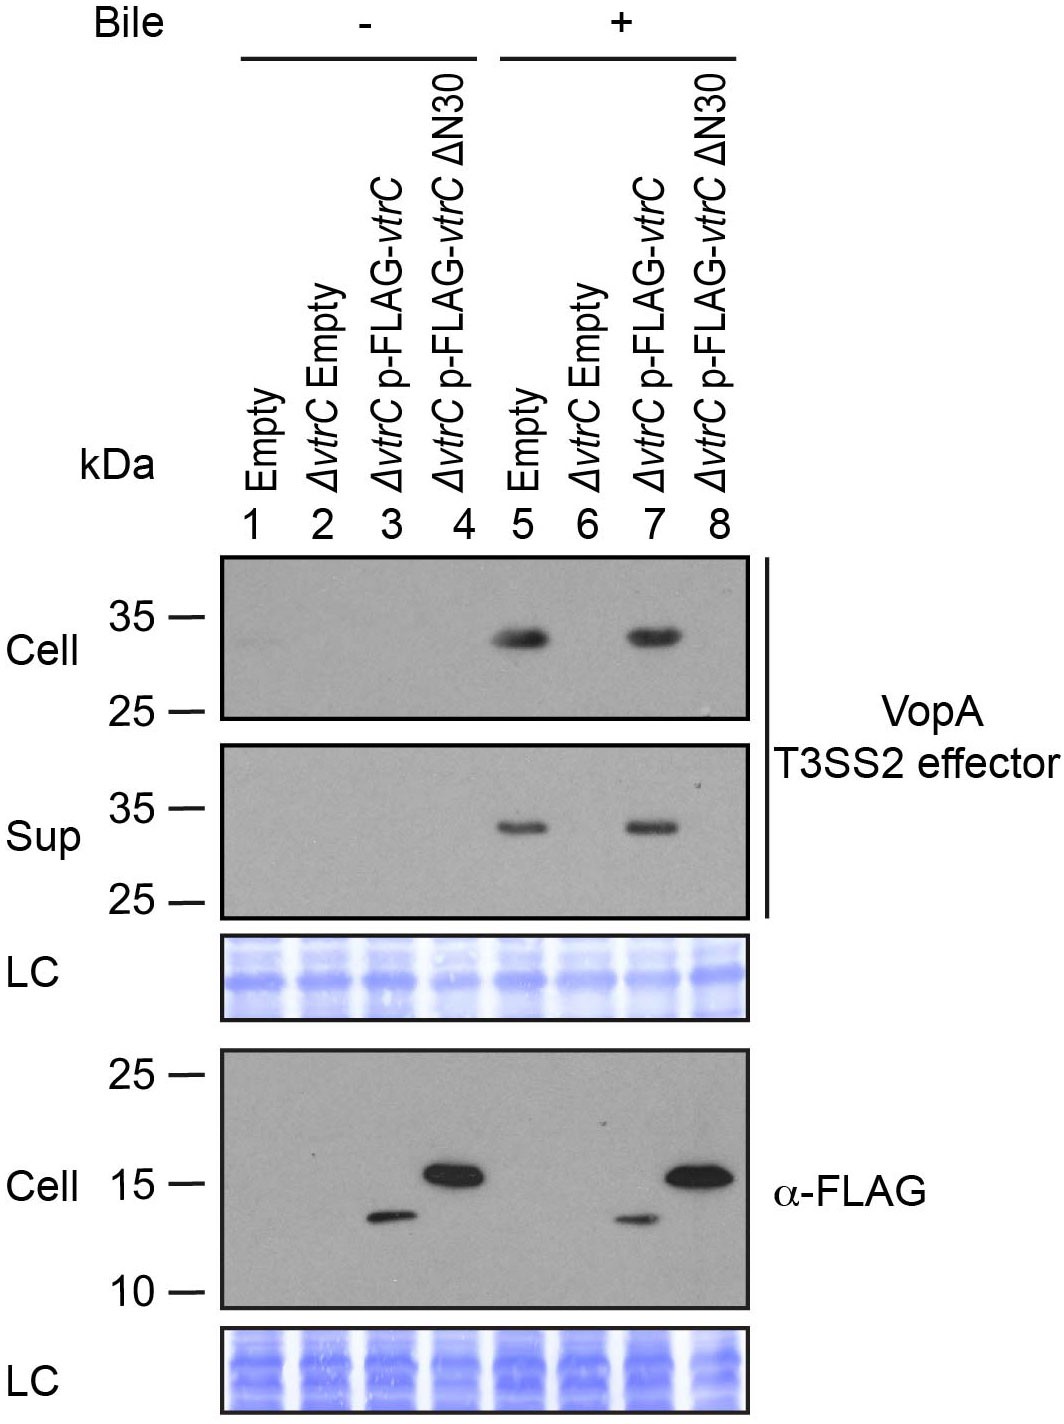
N-terminal FLAG-tagged VtrC is functional.
Expression (Cell) and secretion (Sup) of V. parahaemolyticus T3SS2 effector VopA by POR1 derivative strains with the empty pBAD vector (Empty), vtrC deletion (ΔvtrC Empty), vtrC complementation by N-terminal FLAG-tagged wild type (ΔvtrC p-FLAG-vtrC) or mutant vtrC (ΔvtrC p-FLAG-vtrC ΔN30) that expresses pBAD vector induced protein under the arabinose inducible promoter. Protein-specific antibody was used to detect VopA. Anti-FLAG antibody was used to detect N-terminal FLAG-tagged VtrC (both wild type and ΔN30 mutant). -/+ Bile, V. parahaemolyticus grown in LB without bile salts (-) or supplemented with 0.05% bile salts (+). Loading control (LC) is shown for total protein lysate. Data is representative of three independent experiments.
Figure 6 with 1 supplement
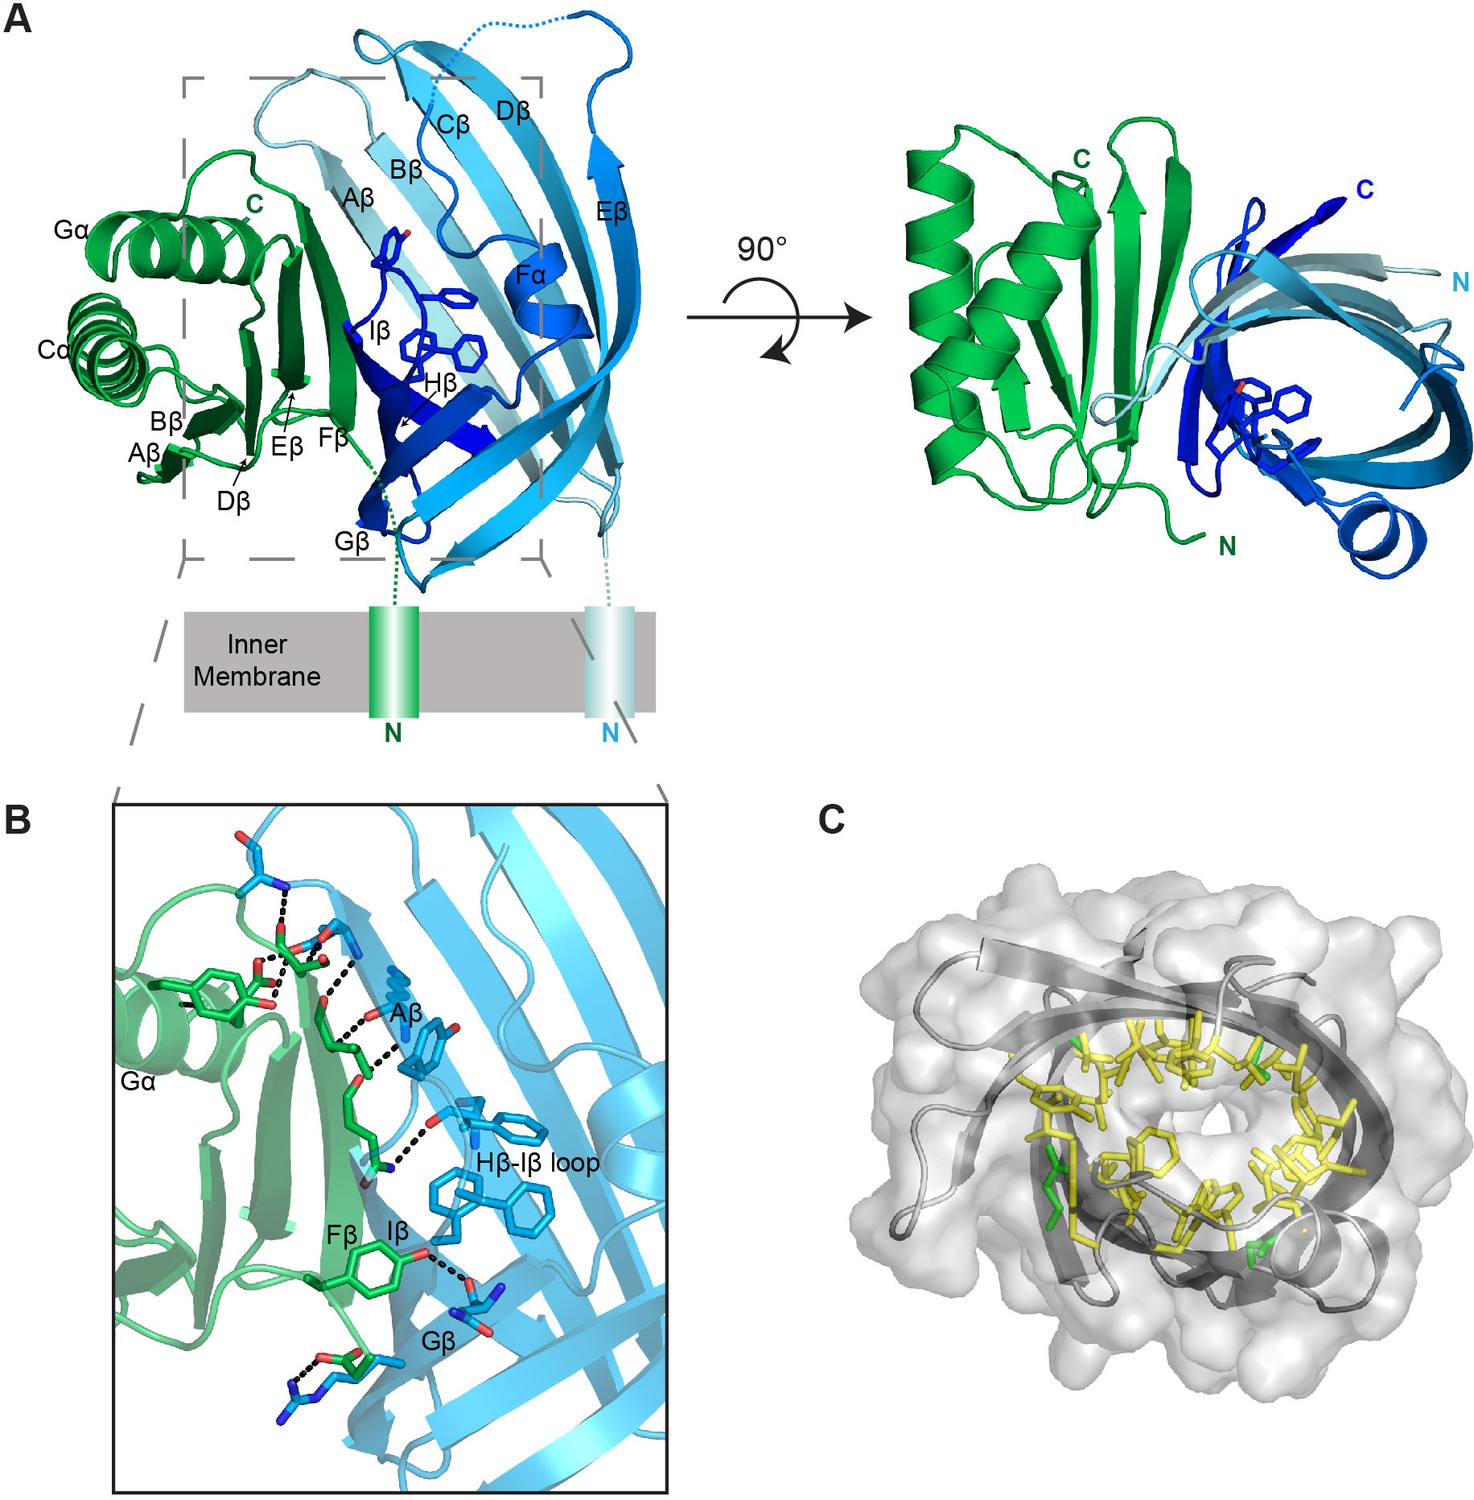
Structure of the VtrA/VtrC heterodimer.
(A) Cartoon representation of the periplasmic domain complex formed by VtrA (green) and VtrC (blue, light to dark gradient from N-terminus to C-terminus). Side chains of Hβ-Iβ loop residues are shown as sticks. (B) Detailed view of the VtrA/VtrC interface. Selected residues that form polar contacts (black dashed lines), as well as potential bile salt binding residues are shown as sticks. (C) Overlay of surface and ribbon models of VtrC showing interior cavity. Side chains of residues lining the cavity are shown as sticks in yellow for hydrophobic residues (Ala, Val, Ile, Leu, Met, Phe, Tyr, Trp) and green for all other.
Figure 6—figure supplement 1
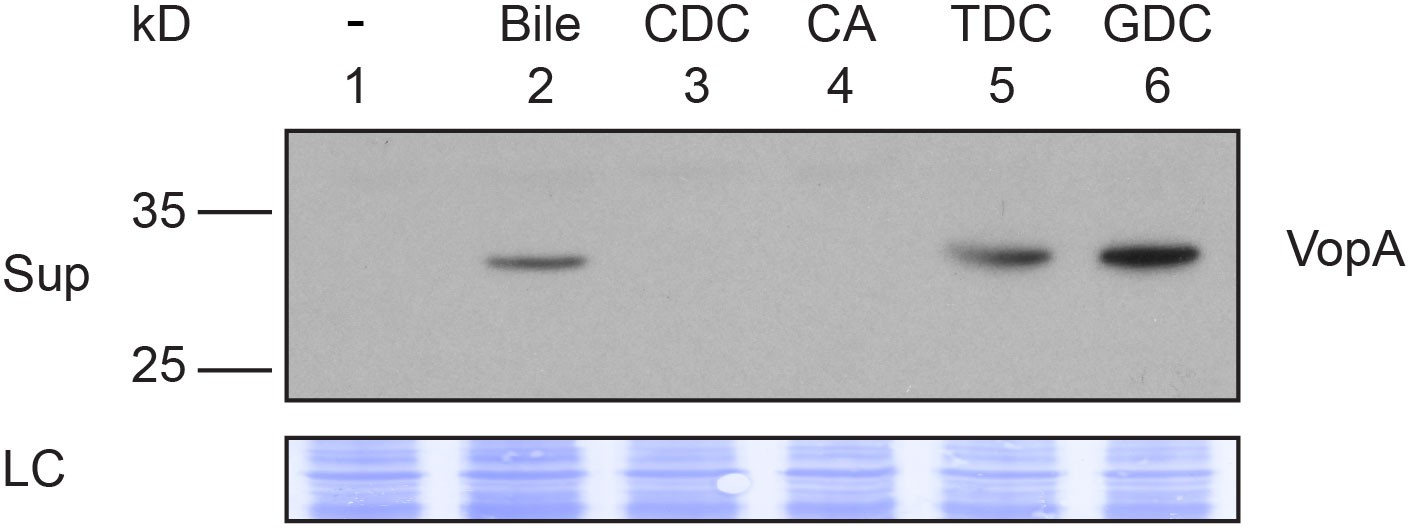
Activation of T3SS2 by individual bile acid.
Secretion (Sup) of V. parahaemolyticus T3SS2 effector VopA by POR1. Protein-specific antibody was used to detect VopA. V. parahaemolyticus grown in LB without bile salts (-), supplemented with 0.05% crude bile (Bile) or 0.5 mM individual bile acids. CDC: chenodeoxycholate, CA: cholate, TDC: taurodeoxycholate, GDC: glycodeoxycholate. Loading control (LC) is shown for total protein lysate. Data is representative of three independent experiments.
Figure 7
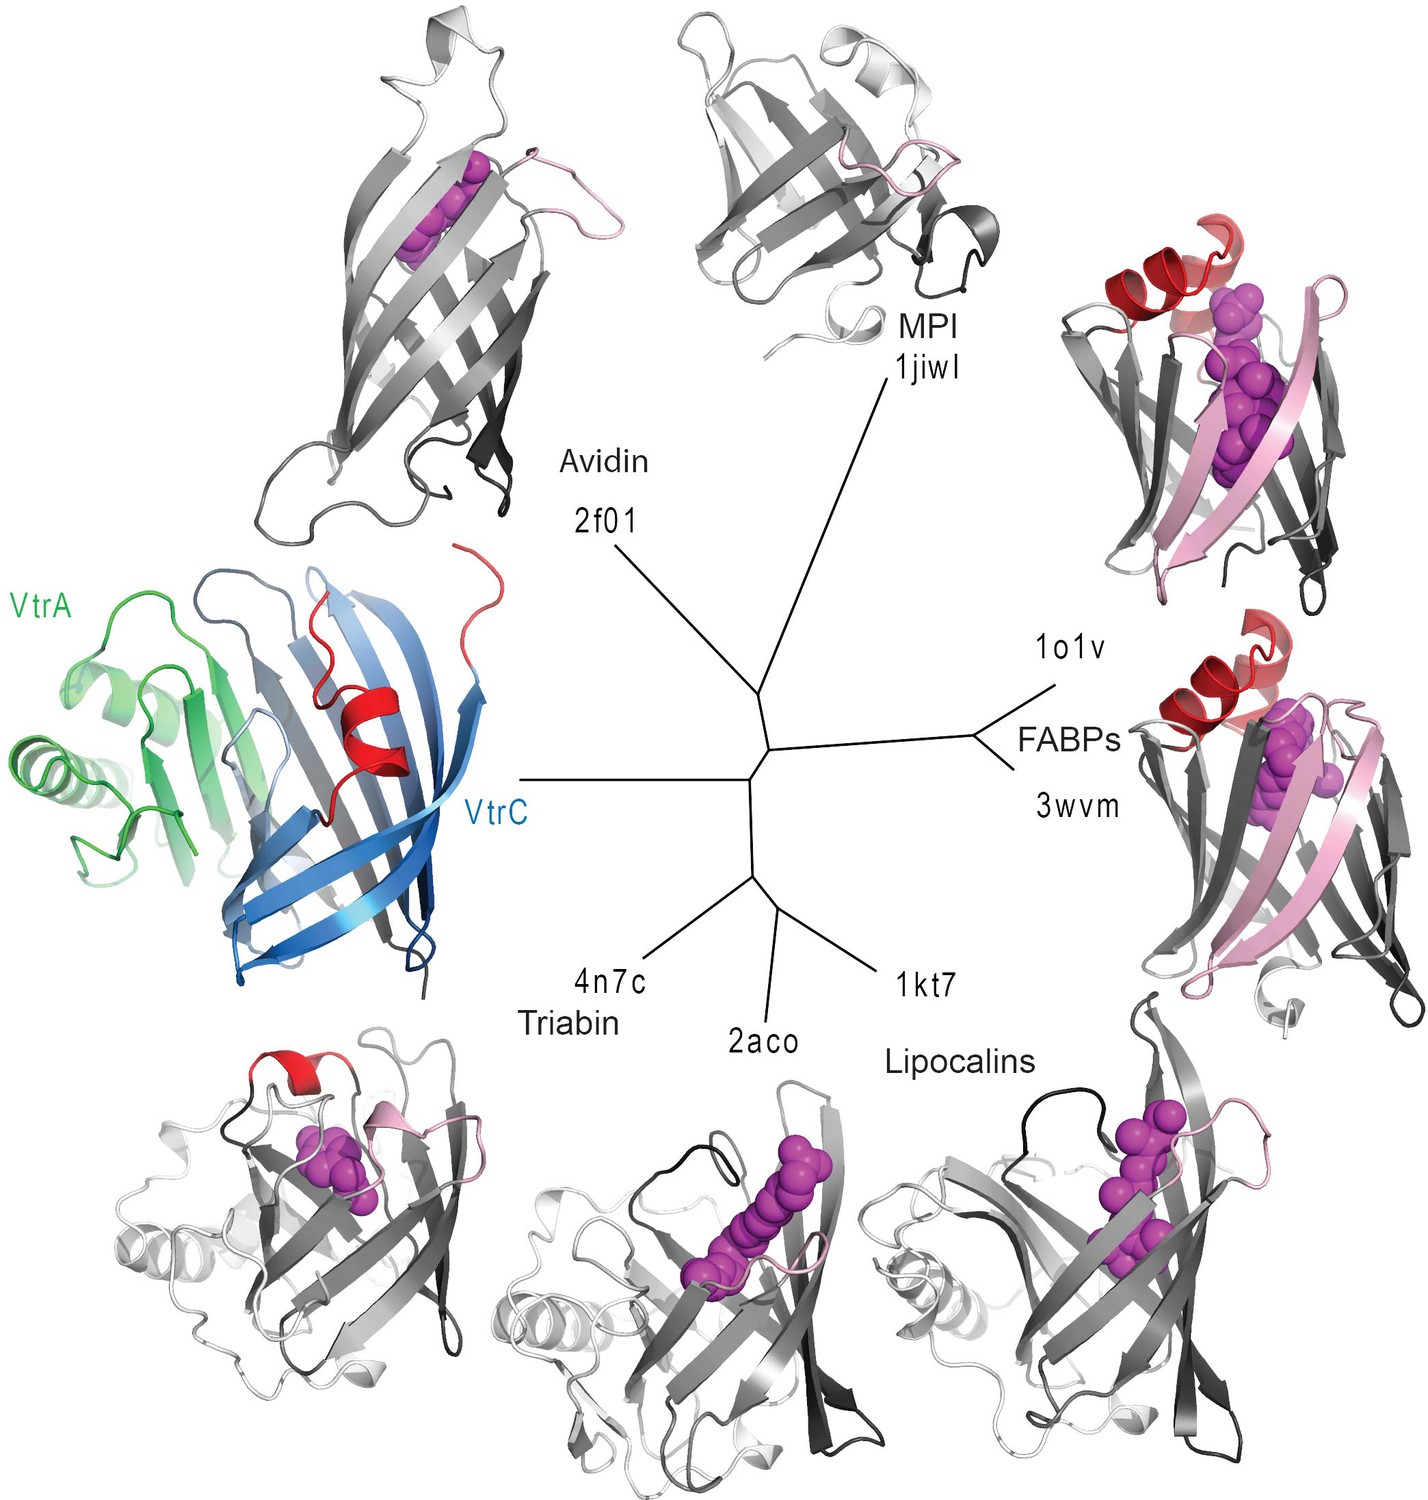
Structure based distance tree of VtrA/VtrC heterodimer and members of the calycin superfamily.
Structures representatives of calycin superfamilies: MPI, avidin, FABPs, lipocalins, and triabin with bound ligands in the centers of the barrels (magenta spheres) were chosen. The conserved 8-stranded barrel core found in all structures is colored from dark to light grey for all representatives and dark to light blue for VtrC. The Hβ-Iβ loop containing the presumed VtrC helical lid (red) is unique to the subunit, as compared to the corresponding loops from representative structures (light pink). This loop also corresponds to the position of the inserted FABP β-hairpin (light pink). The functionally analogous helical lid in FABPs (red) is located after the first β-strand of the barrel. The triabin structure closes the binding pocket with hydrophobic residues from both the FABP lid loop (red) and the VtrC loop (pink).
Figure 8 with 2 supplements
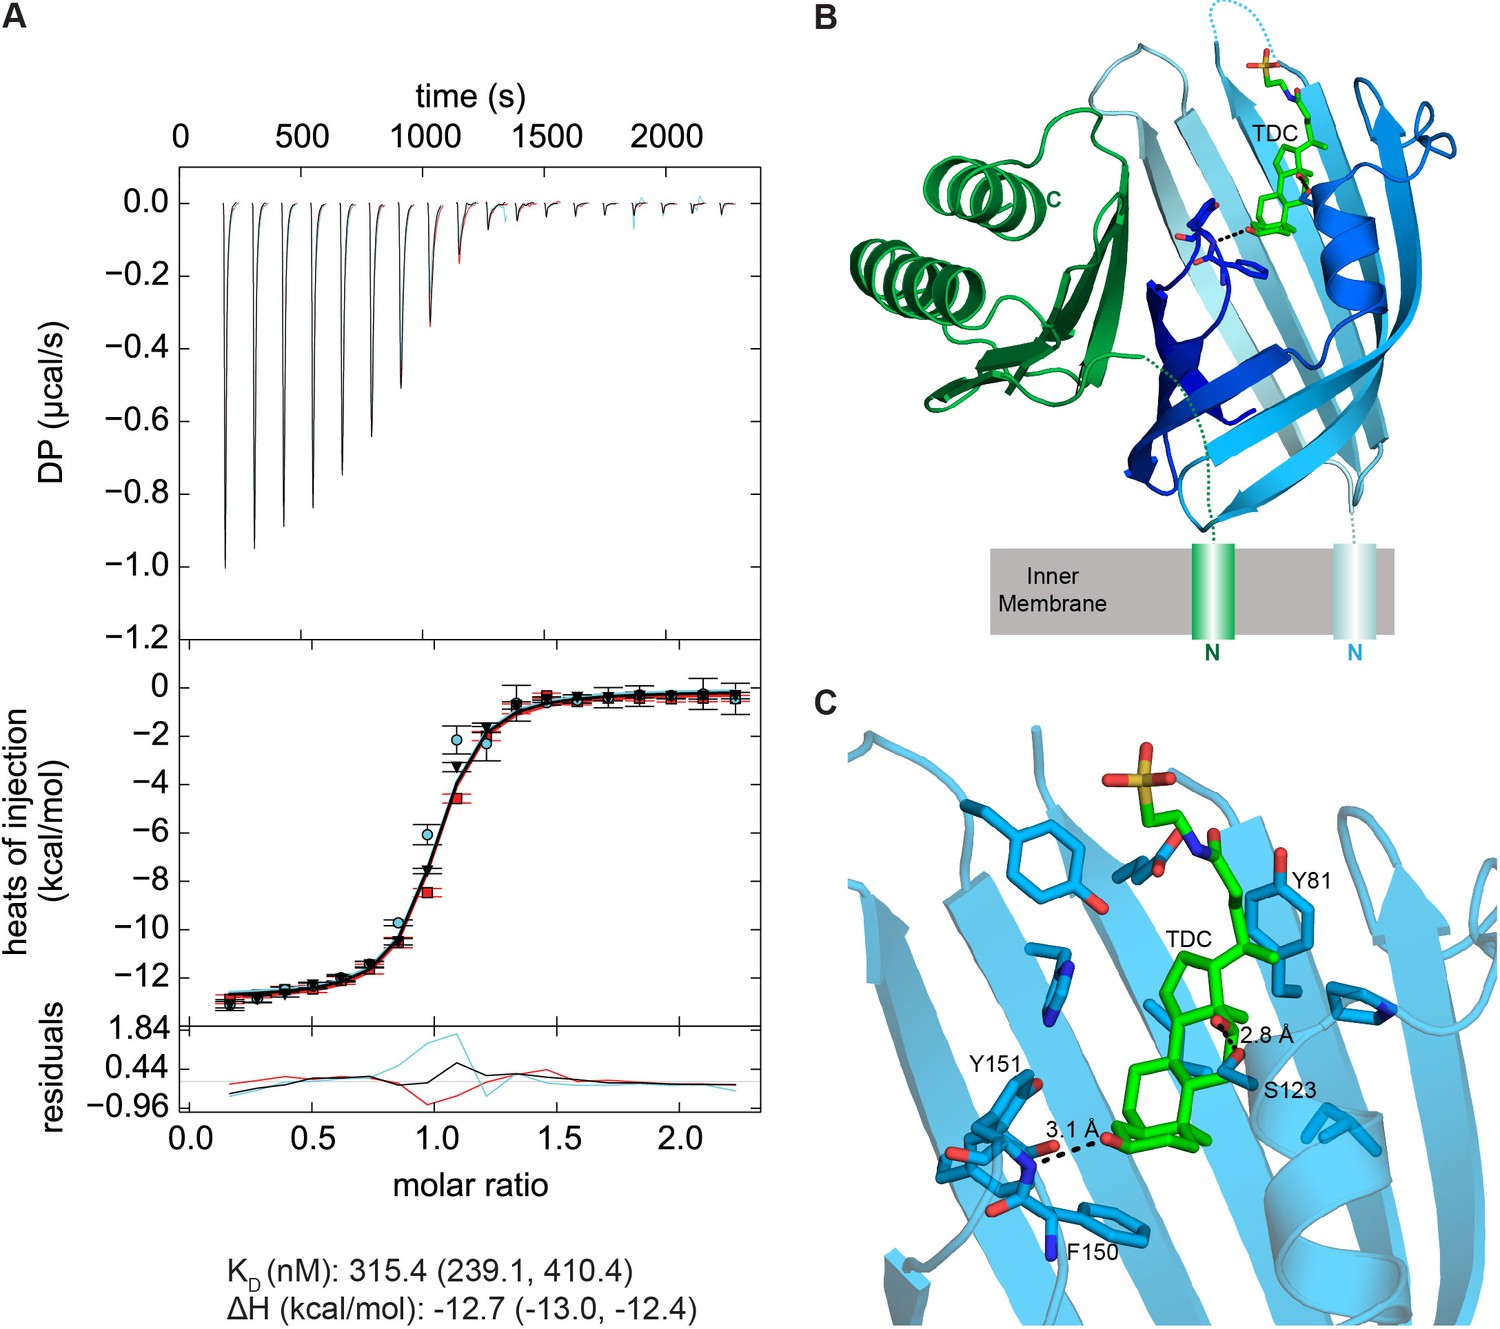
VtrA/VtrC periplasmic domain complex binds the bile salt taurodeoxycholate (TDC).
(A) ITC-derived binding curves of the VtrA/VtrC complex with TDC. Thermodynamic parameters were determined by global fitting of triplicate isotherms (presented in black, red, and cyan). The dissociation constant (KD) and enthalpy (ΔH) values are reported followed by the 1σ error intervals in parenthesis. Data is representative of two independent experiments. (B) Structure of the VtrA/VtrC periplasmic domain complex binding TDC (green). VtrA and VtrC follow same coloring scheme as in Figure 6. (C) Detailed view of the TDC binding site. Hydrogen bonds between protein and TDC are represented as dashed lines.
Figure 8—figure supplement 1
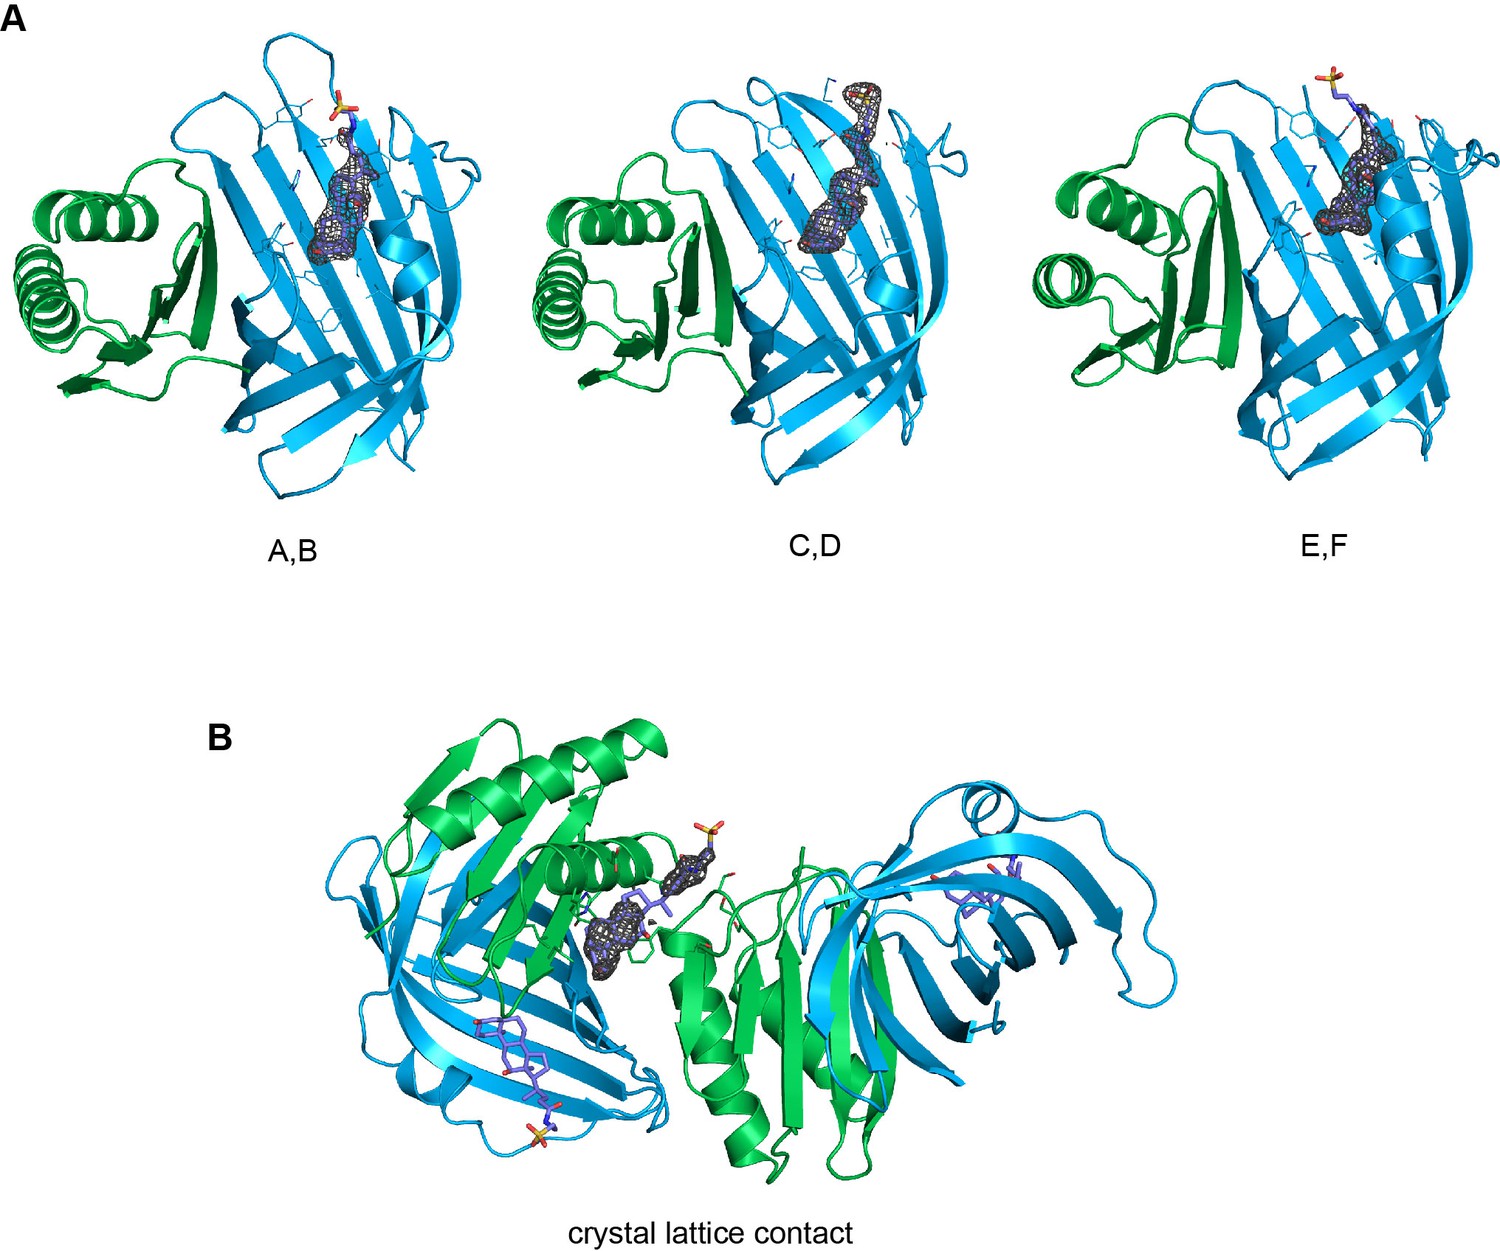
Electron density around TDC molecules.
Kicked Fo-Fc omit maps of the three TDC molecules bound to the A/B, C/D and E/F heterodimers (A) and the TDC mediating lattice contacts (B) in the TDC-containing crystal. The maps are shown as grey mesh (contoured at 3 σ in A and 1.5 σ in B) and carved around the ligand at a 1.6 Å radius.
Figure 8—figure supplement 2
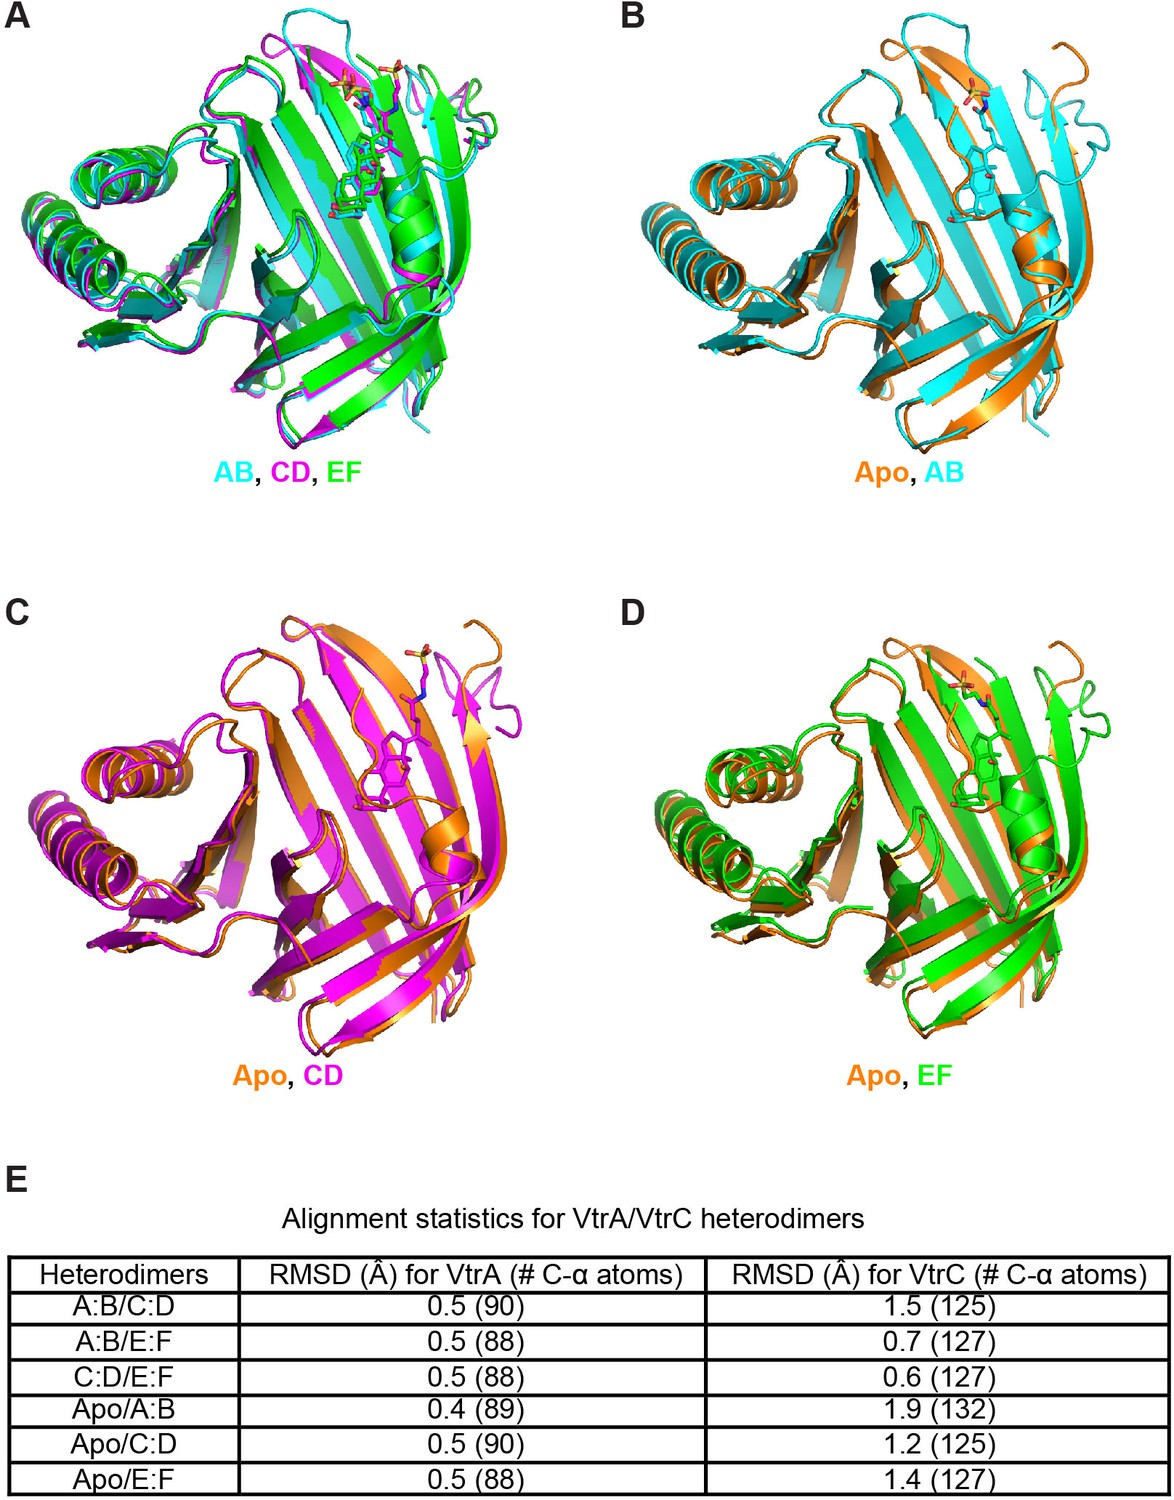
Comparison between apo and TDC bound structure heterodimers.
(A) Superposition of all the heterodimers in the asymmetric unit of the TDC-bound crystal. (B–D) Superposition of AB (B), CD (C) and EF (D) heterodimers from the TDC-bound complex crystal structure and apo heterodimer. (E) Root-mean-square deviations (RMSD) for each superposition with the number of aligned α-carbon atoms in parethesis. Superpositions were made via the DaliLite server (http://ekhidna.biocenter.helsinki.fi/dali_lite/start) (Holm and Park, 2000).
Figure 9
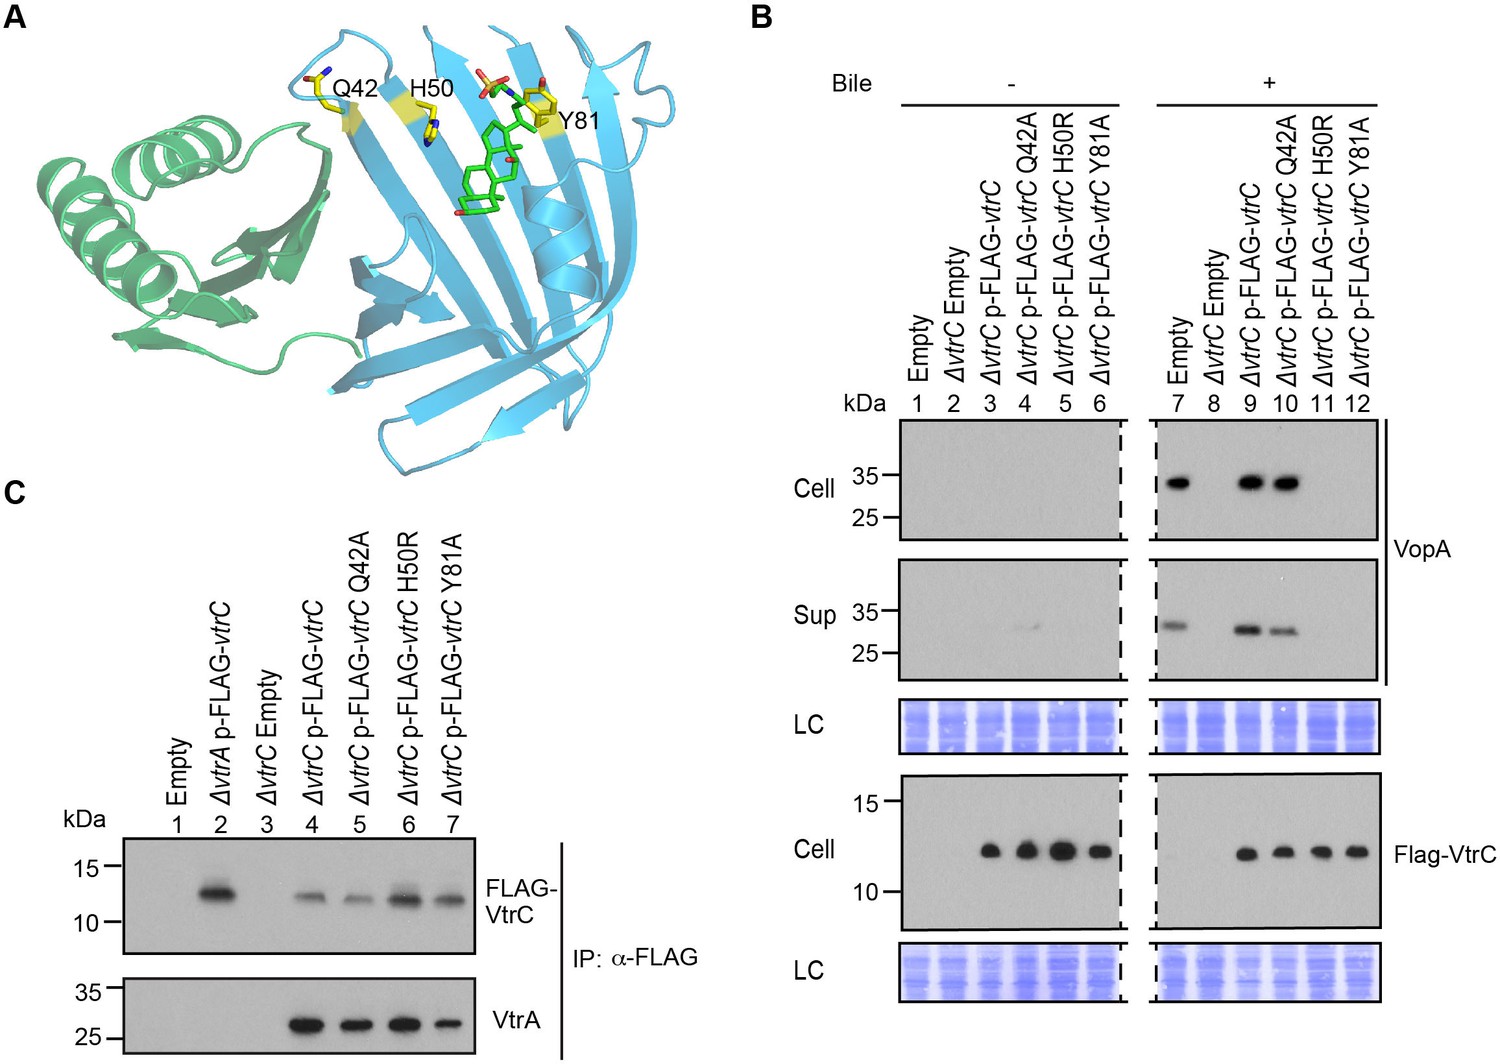
Mutations in the hydrophobic chamber of VtrA/VtrC heterodimer disrupt signaling mediated by bile salts.
(A) Structure of VtrA/VtrC heterodimer. Q42, H50 and Y81 of VtrC are highlighted in yellow. (B) Restoration of T3SS2 activation in POR1ΔvtrC by VtrC mutant Q42A but not H50R or Y81A. Expression (Cell) and secretion (Sup) of V. parahaemolyticus T3SS2 effector VopA by POR1 derivative strains with the empty pBAD vector (Empty), vtrC deletion (ΔvtrC Empty), vtrC complementation by N-terminal FLAG-tagged wild type (ΔvtrC p-FLAG-vtrC) or mutant (Q42A, H50R or Y81A) VtrC that expresses pBAD vector induced protein under the arabinose inducible promoter. Protein-specific antibody was used to detect VopA. Anti-FLAG antibody was used to detect N-terminal FLAG-tagged VtrC. -/+ Bile, V. parahaemolyticus grown in LB without bile salts (-) or supplemented with 0.05% bile salts (+). Loading control (LC) is shown for total protein lysate. Dashed lines indicate lane that was deleted from the gel. (C) Co-IP demonstrating that all three VtrC mutants form a stable complex with VtrA.
Figure 10
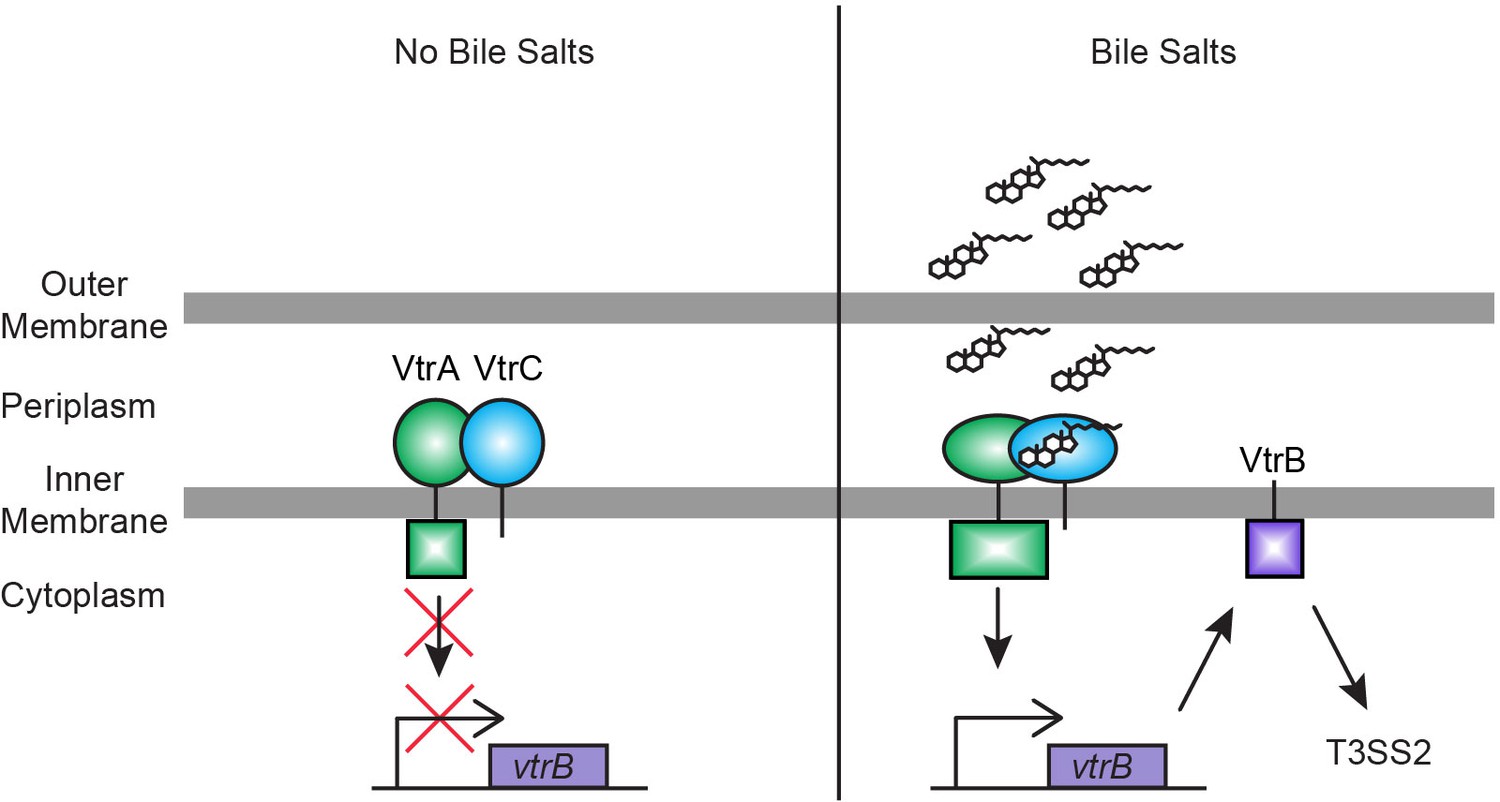
Model for bile salts sensing and T3SS2 regulation in V. parahaemolyticus.
In the absence of bile salts, VtrA (green) and VtrC (blue) form a complex where the VtrA cytoplasmic DNA binding domain is kept inactive. Upon binding of bile salts, the VtrA/VtrC complex activates the VtrA DNA binding domain by a yet to be determined mechanism, which induces VtrB (purple) expression. VtrB, in turn, activates T3SS2.
Author response image 1
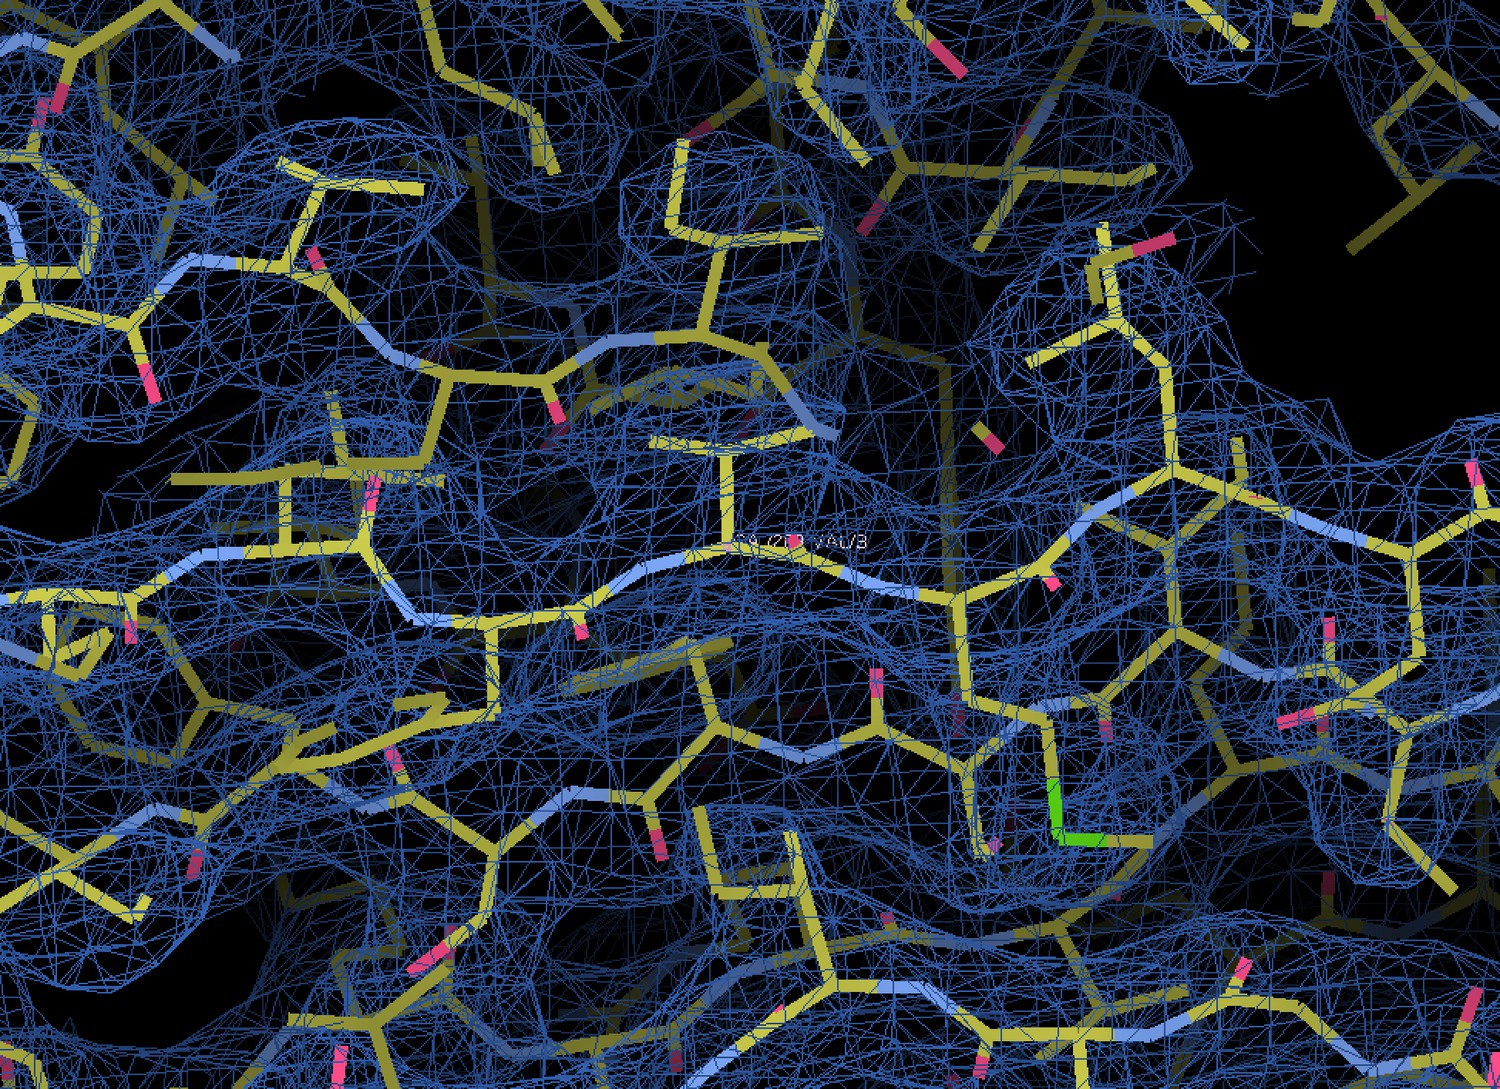
Typical good quality electron density as seen in the β-sheet of VtrA.
Shown is the 2mFo-DFc map (this is a σA-map, where m is the figure of merit, and D is the model error and scale between Fo and Fc) (Afonine PV, Grosse-Kunstleve RW, Echols N, Headd JJ, Moriarty NW, Mustyakimov M, Terwilliger TC, Urzhumtsev A, Zwart PH, Adams PD. (2012) Towards automated crystallographic structure refinement with phenix.refine. Acta Crystallogr D Biol Crystallogr 68:352-367.), from the final round of refinement in PHENIX contoured at the 1.0 σ level.
Author response image 2
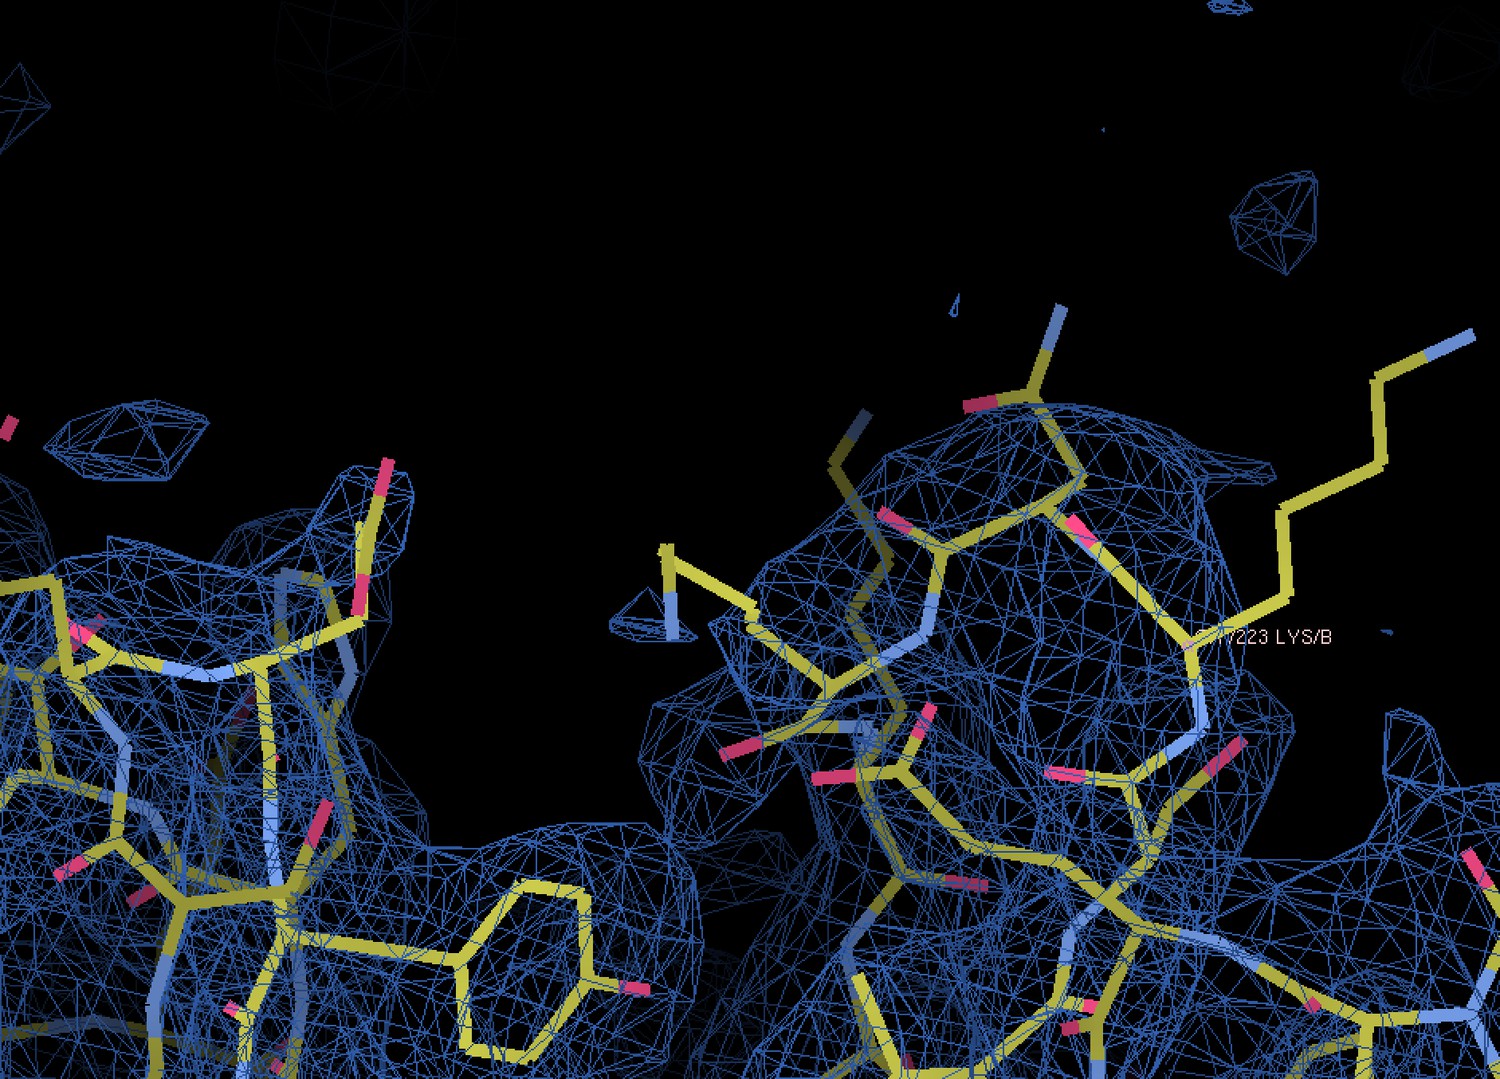
Typical poor density as seen at the solvent-exposed surface of VtrA.
Shown is the 2mFo-DFc map from the final round of refinement in PHENIX contoured at the 1.0 σ level.
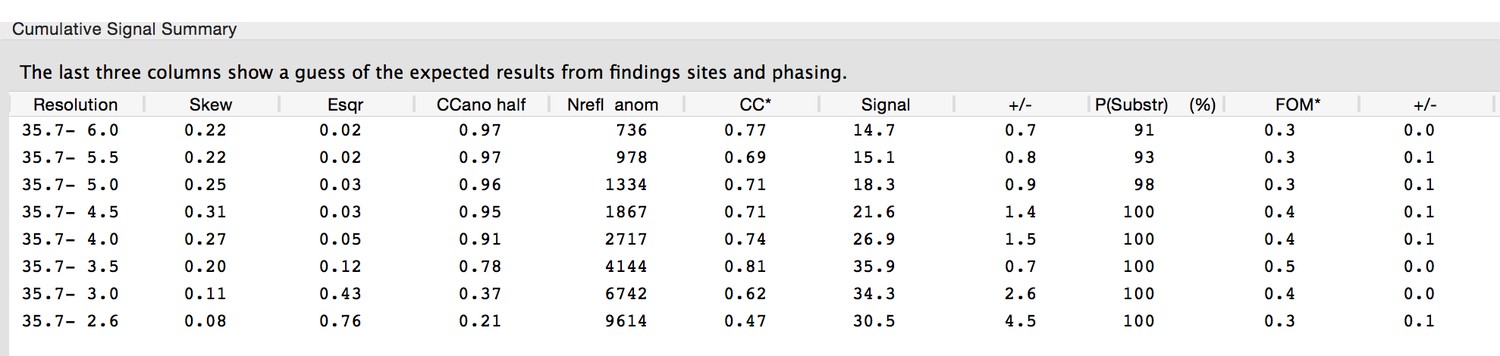
Author response image 3
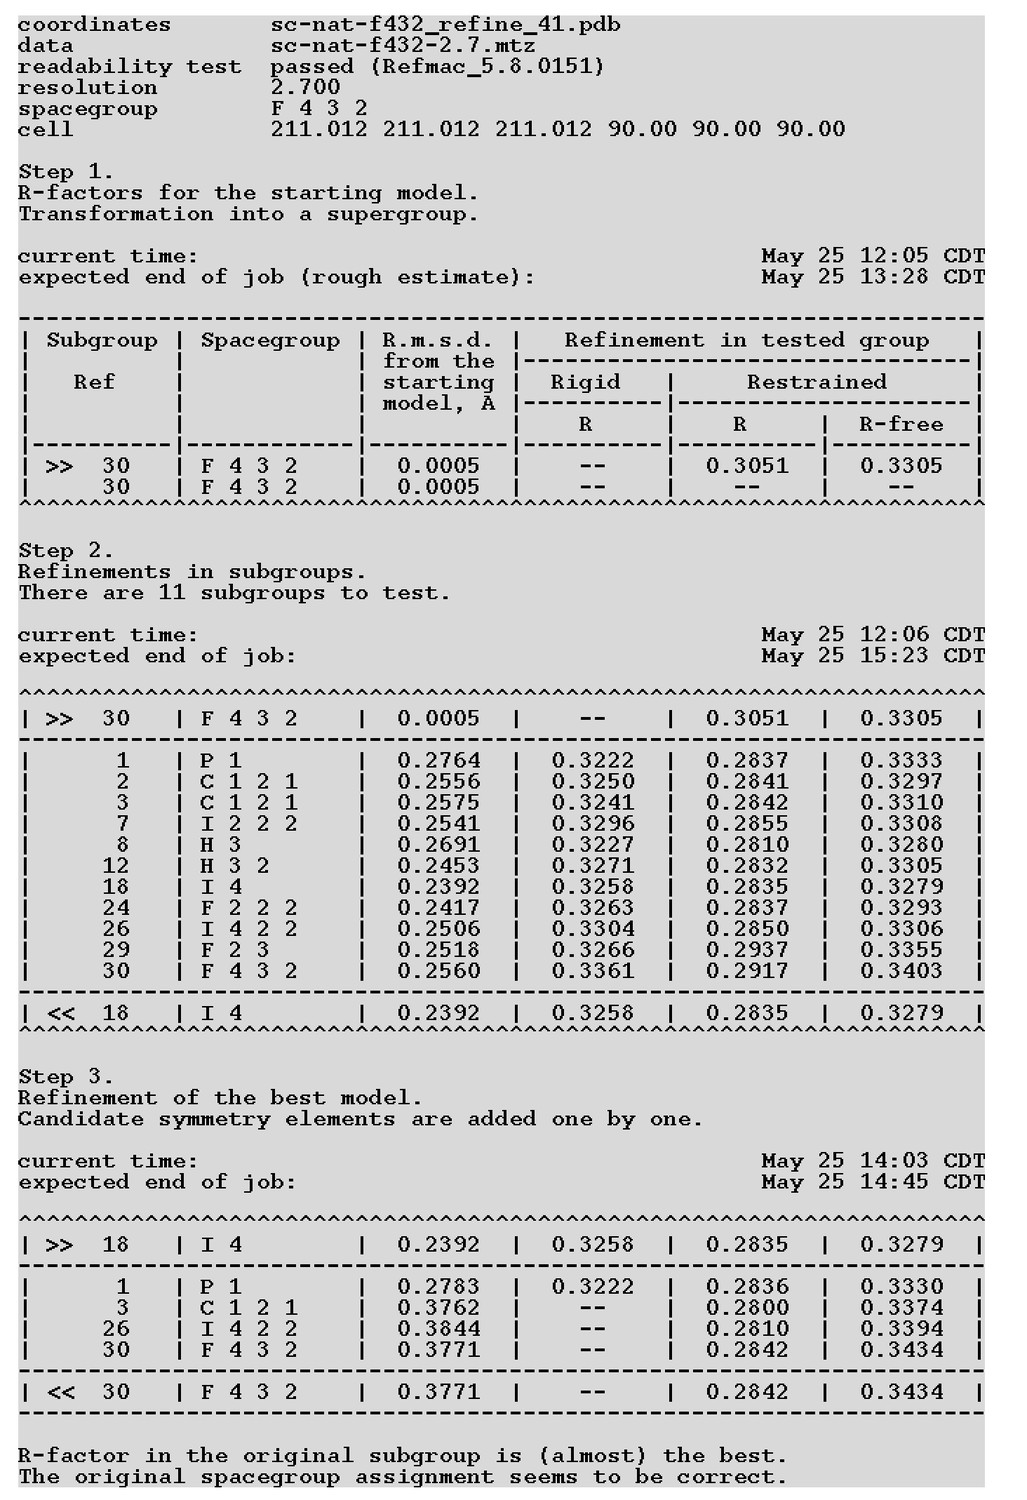
Author response image 4
Videos
Video 1
Structure of the VtrA/VtrC heterodimer.
Rotation of VtrA/VtrC heterodimer demonstrates the binding cavity of the beta-barrel. Further rotation shows how VtrA contributes a strand to the ‘open’ beta barrel formed by VtrC. Extensive hydrogen bonding is observed between VtrA and VtrC.
Tables
Table 1
Data collection and refinement statistics, VtrC/VtrA complex.
| Data collection | |||||
|---|---|---|---|---|---|
| Crystal | SeMetpeak* | SeMet inflection point* | Native | Native + bile salt | |
| Space group | F432 | F432 | F432 | P212121 | |
| Cell constants (Å) | a = 211.01 | a = 211.46 | a = 211.39 | a = 55.39, b = 71.28, c = 203.73 | |
| Wavelength (Å) | 0.97927 | 0.97943 | 0.97935 | 0.97926 | |
| Resolution range (Å) | 35.67–2.60 (2.64–2.60) | 35.74–2.65 (2.70–2.65) | 40.68–2.65(2.70–2.65) | 35.64–2.10 (2.14–2.10) | |
| Unique reflections | 12,839 (620) | 12,267 (593) | 12,322 (594) | 45,762 (1868) | |
| Multiplicity | 22.6 (20.2) | 22.7 (21.8) | 36.1 (36.5) | 3.9 (2.8) | |
| Data completeness (%) | 99.9 (100.0) | 99.9 (100.0) | 99.9 (100.0) | 95.6 (79.4) | |
| Rmerge (%)† | 7.2 (369.2) | 7.7 (292.5) | 7.6 (172.4) | 7.9 (36.2) | |
| Rpim (%)‡ | 1.5 (83.7) | 1.7 (63.5) | 1.3 (28.8) | 4.3 (24.9) | |
| CC1/2 (last resolution shell) | 0.448 | 0.520 | 0.934 | 0.754 | |
| I/σ(I) | 49.9 (0.8) | 46.8 (1.1) | 63.6 (4.2) | 15.9 (2.5) | |
| Wilson B-value (Å2) | 79.0 | 78.6 | 77.6 | 31.1 | |
| Wilson B-value, sharpened (Å2)§ | 35.8 | 35.4 | 37.5 | 24.2 | |
| Phase determination | |||||
| Anomalous scatterers | selenium, 2 out of 5 possible sites | ||||
| Figure of merit (121.8–2.60 Å) | 0.25 after Selenium MAD phasing; 0.88 after density modification | ||||
| Refinement statistics | |||||
| Resolution range (Å) | 40.68–2.70(2.79–2.70) | 35.64–2.10 (2.16–2.10) | |||
| No. of reflections Rwork/Rfree | 11,593/1,470 (899/129) | 41,304/2,000(1,807/91) | |||
| Data completeness (%) | 99.9 (100.0) | 86.3 (57.0) | |||
| Atoms (non-H protein/ions/ligands/solvent) | 1,797/5/NA/NA | 5,411/NA/375/204 | |||
Rwork (%) | 26.0 (34.0) | 20.1 (22.3) | |||
Rfree (%) | 29.8 (39.2) | 23.3 (28.3) | |||
| R.m.s.d. bond length (Å) | 0.002 | 0.002 | |||
| R.m.s.d. bond angle (°) | 0.42 | 0.51 | |||
| Mean B-value (Å2) (protein chain ID) (ligands/ions/solvent) | VtrA(A): 77.2 VtrC(B): 62.2. ions: 70.2 | VtrA(A): 25.7 VtrC(B): 29.8 VtrA(C): 34.9 VtrC(D): 37.8 VtrA(E): 39.1 VtrC(F): 36.2 ligands: 43.3 ions: 86.2 solvent: 37.0 | |||
| Ramachandran plot (%) (favored/additional/disallowed)# | 94.3/5.2/0.5 | 96.5/3.2/0.3 | |||
| Maximum likelihood coordinate error | 0.36 | 0.23 | |||
| Missing residues, protein (chain ID) | VtrA(A): 161– 163. VtrC(B): −13 –0, 113–117. | VtrA(A): 161–164. VtrC(B): −13–0. VtrA(C): 161–163. VtrC(D): 13–0, 119–124. VtrA(E): 161–165. VtrC(F): 13–0. | |||
-
Data for the outermost shell are given in parentheses.
-
*Bijvoet-pairs were kept separate for data processing.
-
†, where the outer sum () is over the unique reflections and the inner sum (i) is over the set of independent observations of each unique reflection.
-
‡ is the precision indicating R-factor, i.e , where is the number of observations of reflections (Evans, 2011).
-
§B-factor sharpening was performed in the autocorrection mode of HKL3000 (Borek et al., 2013).
-
#Asdefined by the validation suite MolProbity (Chen et al., 2010).
Download links
A two-part list of links to download the article, or parts of the article, in various formats.
Downloads (link to download the article as PDF)
Open citations (links to open the citations from this article in various online reference manager services)
Cite this article (links to download the citations from this article in formats compatible with various reference manager tools)
Bile salt receptor complex activates a pathogenic type III secretion system
eLife 5:e15718.
https://doi.org/10.7554/eLife.15718


