An inhibitory corticostriatal pathway
- University of Texas at San Antonio, United States
Figures
Figure 1
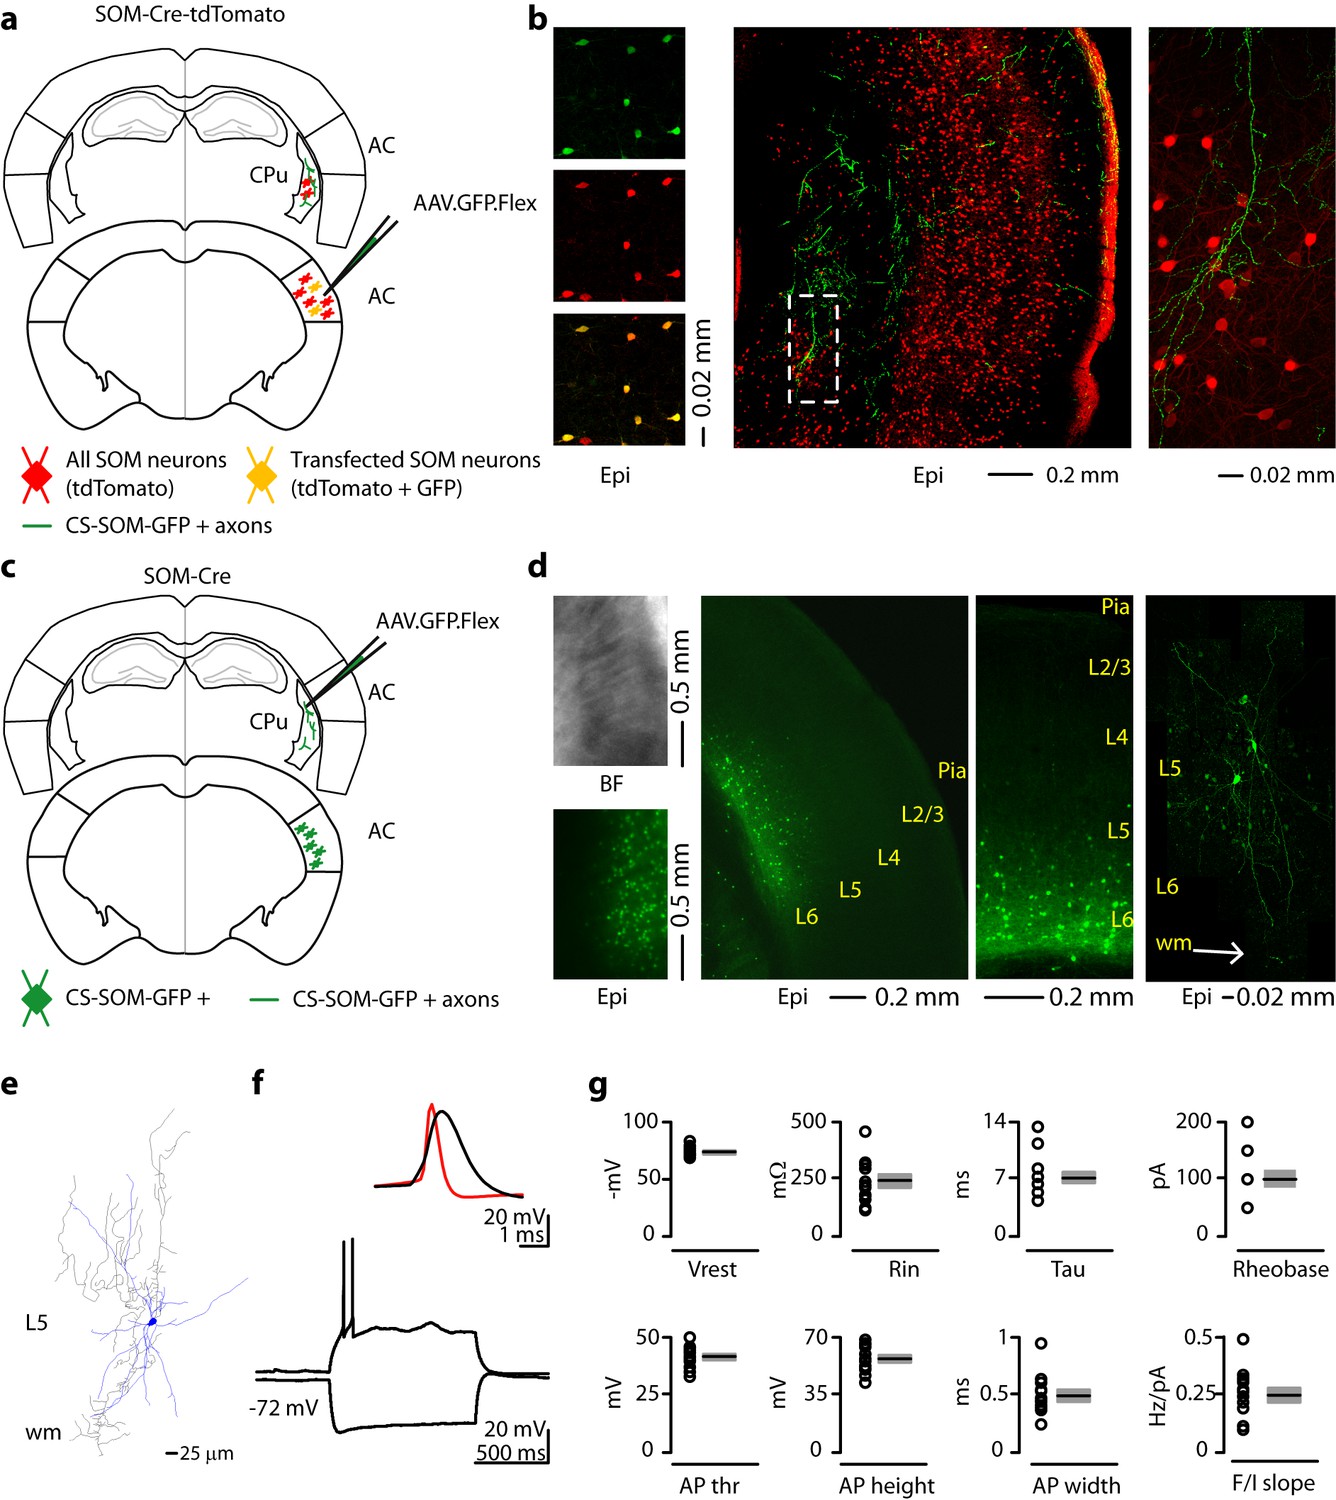
Morphological characteristics, axonal projections and electrical properties of long-range CS-SOM neurons in the mouse auditory cortex.
(a) Schematic depicting injection site using the SOM-Cre-tdTomato transgenic mouse line to identify CS-SOM neurons and their projections to the dorsal striatum. Bottom, auditory cortex: AAV.GFP.Flex injection site; yellow CS-SOM somata coexpressing GFP and tdTomato. Top, dorsal striatum: green CS-SOM GFP-positive axons; red SOM tdTomato-positive interneurons. (b) Epifluorescence images of SOM GFP-positive neurons. Top, left: GFP-positive SOM neurons in the auditory cortex identified by viral injection of AAV.GFP.Flex in the SOM-Cre-tdTomato transgenic mouse line. Middle, left: tdTomato-expressing SOM neurons in the SOM-Cre-tdTomato transgenic mouse line. Bottom, left: overlay of GFP and tdTomato images. Middle, the dashed box indicates the location GFP-positive axons from CS-SOM neurons in the dorsal striatum and the location of image in the right panel. Right, higher magnification of GFP fluorescence of CS-SOM axons in the dorsal striatum. (c) Schematic depicting injection site using the SOM-Cre transgenic mouse line to identify CS-SOM neurons by anatomical retrograde transfection. Top, striatum: AAV.GFP.Flex injection site. Bottom, auditory cortex: green CS-SOM GFP positive somata. (d) Bright-field (top left) and epifluorescence (bottom left) images of striatal SOM interneurons transfected with AAV.GFP.Flex. Middle (left and right), epifluorescence image of laminar distribution of CS-SOM neurons in the auditory cortex identified by anatomical retrograde transfection. Right, high-resolution image of a biocytin-labeled CS-SOM neuron. (e) Morphological reconstruction of one CS-SOM neuron (dendrites, blue; axons, gray). (f) Bottom, train of action potentials recorded in a GFP-positive CS-SOM neuron during step current injection (1.0 s, 100 pA pulse). Top, single action potential from GFP-positive CS-SOM neuron (black); compare to an action potential from a fast-spiking interneuron (red). (g) Summary plot of Vrest: resting membrane potential; Ri: input resistance; Tau: membrane time constant; Rheobase, the smallest current step evoking an action potential; AP thr: action potential threshold; AP height: action potential height; AP half-width: action potential half-width; and F/I slope from CS-SOM neurons (n = 13), including group averages (± s.e.m.).
Figure 2
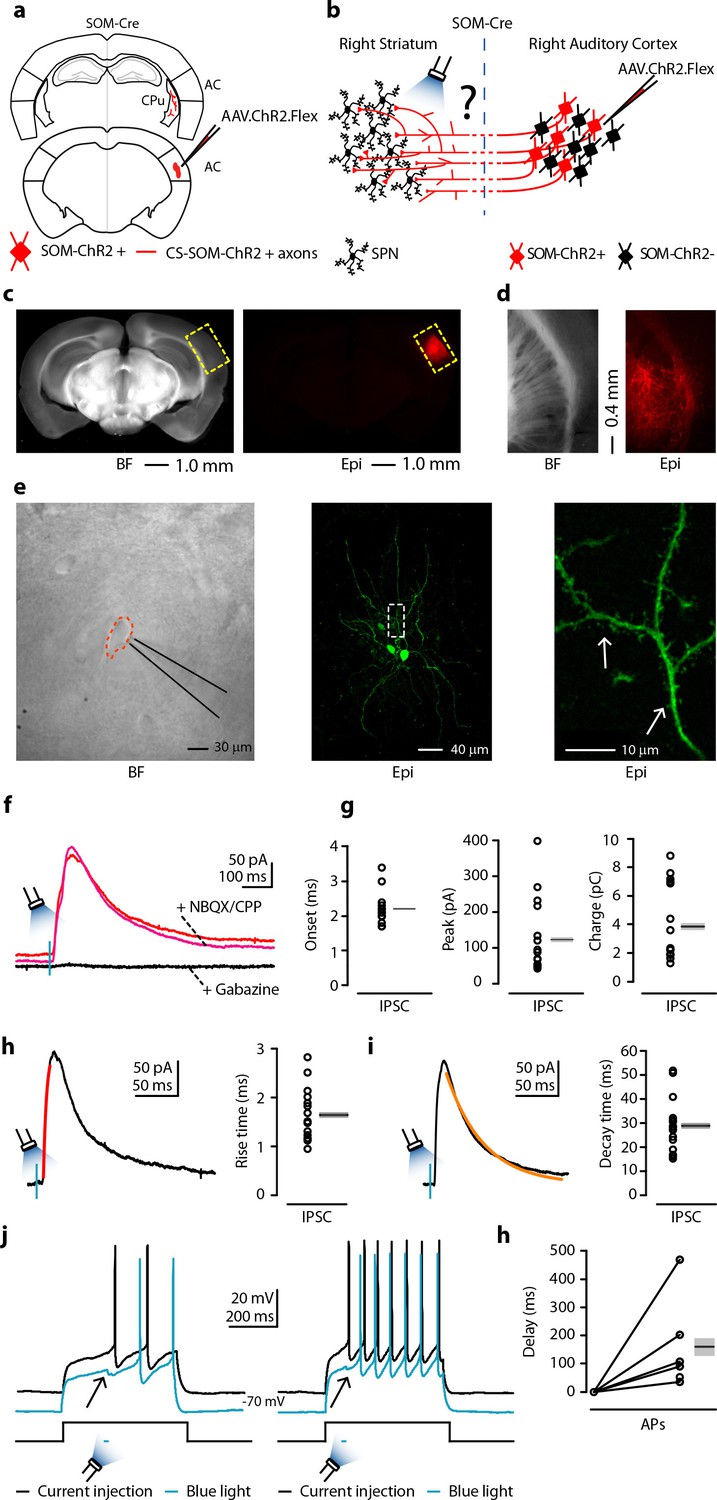
Photostimulation of auditory CS-SOM projections elicits direct inhibition and modulates action potentials in striatal SPNs.
(a) Schematic depicting injection site using the SOM-Cre transgenic mouse line to transfect CS-SOM projections to the dorsal striatum with ChR2. Bottom, auditory cortex: AAV.ChR2.flex injection site. Top, dorsal striatum: red CS-SOM ChR2-tdTomato-positive axons. (b) Experimental paradigm for photostimulating ChR2-positive CS-SOM projections while recording from SPNs. (c) Bright-field (left) and epifluorescence (right) images of a slice containing the auditory cortex injection site for AAV.ChR2.Flex. (d) Bright-field (left) and epifluorescence (right) images of a slice containing the dorsal striatum showing expression of ChR2-tdTomato following injection of AAV.ChR2.Flex into the auditory cortex. (e) Left, bright-field image of neurons as seen in bright-field microscopy during patch recordings. Middle, high-resolution epifluorescence image of a biocytin-labeled SPN. The dashed box indicates the location of the image in the right panel. Right, high-resolution epifluorescence image of spines from the biocytin-labeled SPN. (f) Example of IPSCs recorded at 0 mV from an SPN before (red trace) and after application of ionotropic glutamate receptor antagonists (NBQX 10 μM, CPP 5 μM: magenta trace) and GABAA receptor antagonist (gabazine 25 μM: black trace). (g) Left, plot of onset latencies recorded in SPNs (n = 16) including group averages (± s.e.m.). Middle, plot of IPSCs peaks calculated for SPNs, including group averages (± s.e.m.). Right, plot of IPSCs charge transfer calculated for individual IPSCs for SPNs, including group averages (± s.e.m.). (h) Left, example of IPSCs (black trace) and rising time course (red trace) recorded at 0 mV from an SPN. Right, plot of IPSCs rising time course recorded in SPNs (n = 16) including group averages (± s.e.m.). (i) Left, example of IPSCs (black trace) and decay time course (amber trace) recorded at 0 mV from an SPN. Right, plot of IPSCs decay time course recorded in SPNs (n = 16) including group averages (± s.e.m.). (j) Left (black trace), response of an SPN in the whole-cell current-clamp configuration to current injection (250 pA, 500 ms; n = 6). Left (blue trace), response of the SPN to current injection with photostimulation of CS-SOM projections (blue bar, 5–20 ms). Right (black trace), response of an SPN in the whole-cell current-clamp configuration to current injection (350 pA, 500 ms; n = 6). Left (blue trace), response of the SPN to current injection with photostimulation of CS-SOM projections (blue bar, 5–20 ms). (k) Summary of ChR2-mediated delay of action potential generation in SPNs (n = 6) during current injection combined with photostimulation of the ChR2 CS-SOM projections. Delay was relative to the onset of the first action potential measured during the current injection alone.
Figure 3
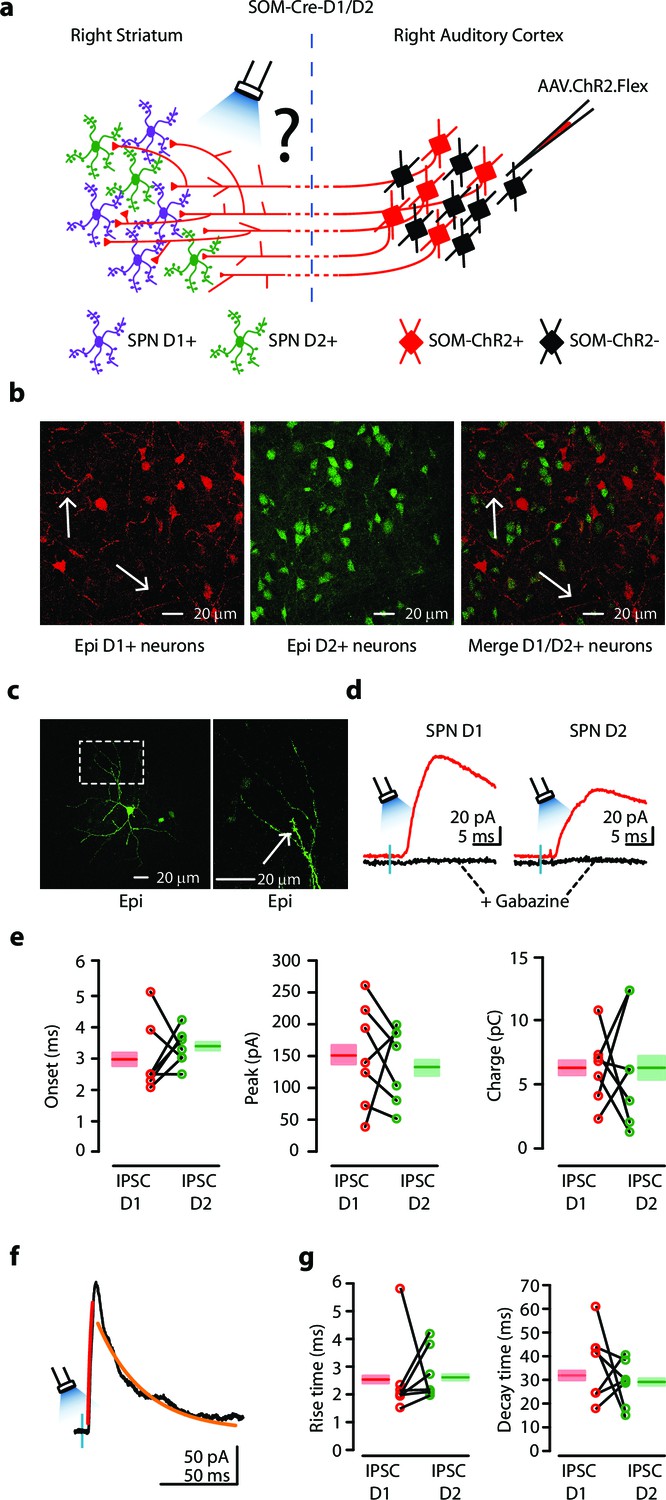
Auditory CS-SOM neurons innervate both dSPNs and iSPNs.
(a) Experimental paradigm for photostimulating ChR2-positive CS-SOM projections while recording from genetically labeled dSPNs and iSPNs. (b) Left, epifluorescence image of dSPNs expressing D1-tdTomato (white arrows indicate CS-SOM ChR2-tdTomato-positive axons). Middle, epifluorescence image of iSPNs expressing D2-EGFP. Right, overlay of D1-tdTomato (dSPNs) and D2-GFP (iSPNs). Note that the two sub-types of SPNs have a different distribution with no overlap when located in the same region of the dorsal striatum (white arrows indicate CS-SOM ChR2-tdTomato-positive axons). (c) Left, high-resolution epifluorescence image of a biocytin-labeled dSPN. The dashed box indicates the location of the image in right panel. Right, high-resolution epifluorescence image of spines from the biocytin-labeled dSPN. (d) Example of IPSCs recorded at 0 mV from a dSPN (left) and iSPN (right) after application of ionotropic glutamate receptor antagonists (NBQX 10 μM, CPP 5 μM: red traces) and GABAA receptor antagonist (gabazine 25 μM: black traces). (e) Left, plot of IPSCs onset latencies recorded in dSPNs (n = 7; red circles) and iSPNs (n = 7; green circles), including group averages (± s.e.m.). Middle, plot of IPSCs peaks calculated for dSPNs (n = 7; red circles) and iSPNs (n = 7; green circles), including group averages (± s.e.m.). Right, plot of IPSCs charge calculated for dSPNs (n = 7; red circles) and iSPNs (n = 7; green circles), including group averages (± s.e.m.). (f) Example of IPSCs (black trace), rising time course (red trace) and decay time course (amber trace) recorded at 0 mV from a dSPN. (g) Left, plot of IPSCs rising time course calculated for dSPNs (n = 7; red circles) and iSPNs (n = 7; green circles), including group averages (± s.e.m.). Right, plot of IPSCs decay time course calculated for dSPNs (n = 7; red circles) and iSPNs (n = 7; green circles), including group averages (± s.e.m.).
Figure 4
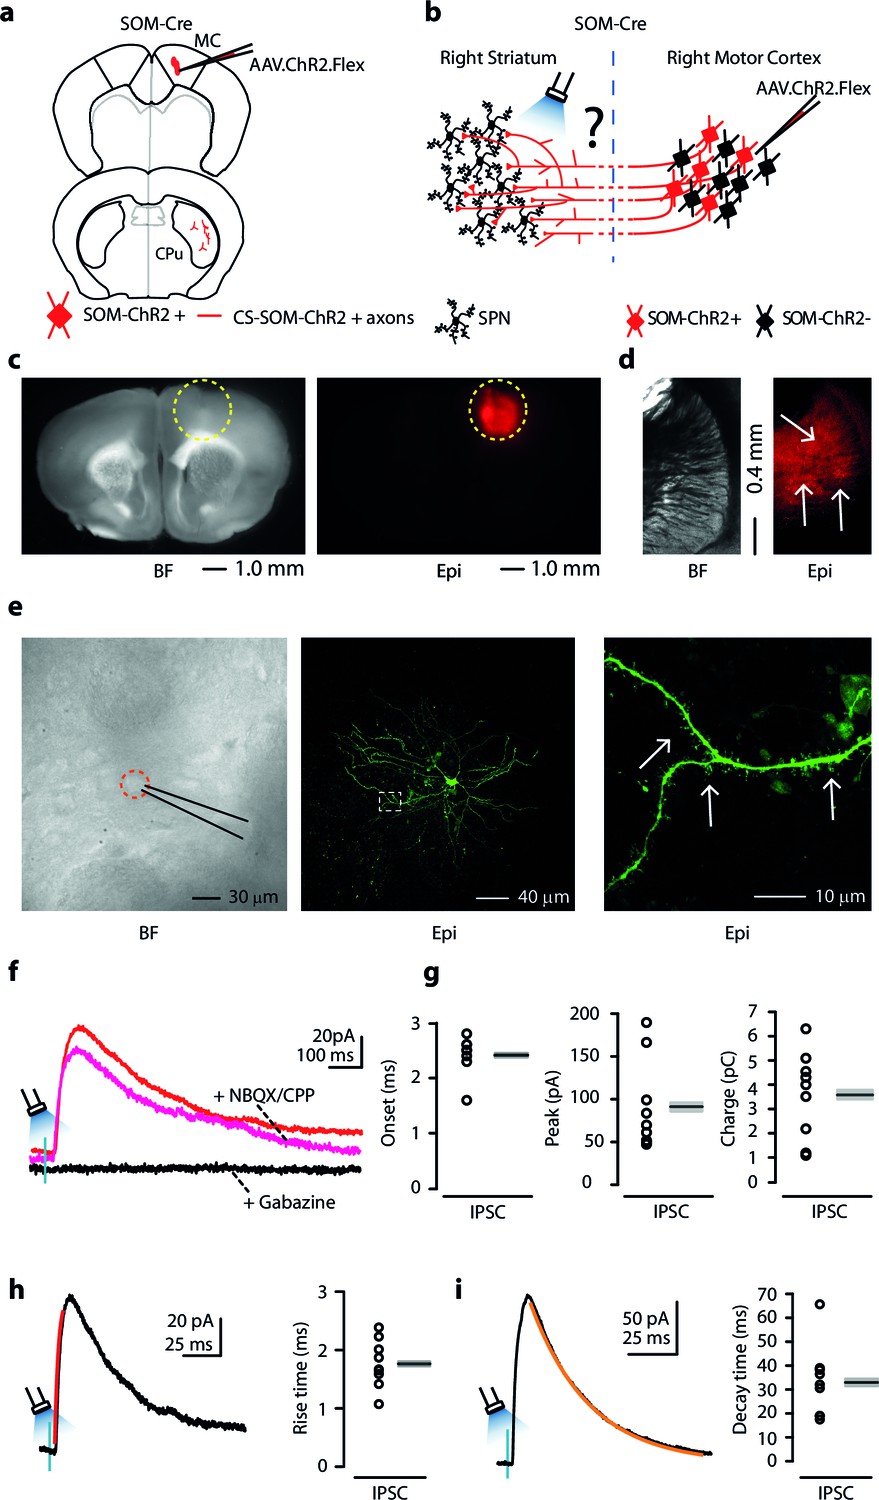
Photostimulation of motor CS-SOM projections elicits direct inhibition of striatal SPNs.
(a) Schematic depicting injection site using the SOM-Cre transgenic mouse line to transfect CS-SOM projections to the dorsal striatum with ChR2. Top, motor cortex: AAV.ChR2.flex injection site. Bottom, dorsal striatum: red CS-SOM ChR2-tdTomato-positive axons. (b) Experimental paradigm for photostimulating ChR2-positive CS-SOM projections while recording from SPNs. (c) Bright-field (left) and epifluorescence (right) images of a slice containing the motor cortex injection site for AAV.ChR2.Flex. (d) Bright-field (left) and epifluorescence (right) images of a slice containing the dorsal striatum showing expression of ChR2-tdTomato following injection of AAV.ChR2.Flex into the motor cortex. (e) Left, bright-field image of neurons as seen in bright-field microscopy during patch recordings. Middle, high-resolution epifluorescence image of a biocytin-labeled SPN. The dashed box indicates the location of the image in the right panel. Right, high-resolution epifluorescence image of spines from the biocytin-labeled SPN. (f) Example of IPSCs recorded at 0 mV from an SPN before (red trace) and after application of ionotropic glutamate receptor antagonists (NBQX 10 μM, CPP 5 μM: magenta trace) and GABAA receptor antagonist (gabazine 25 μM: black trace). (g) Left, plot of onset latencies recorded in SPNs (n = 9) including group averages (± s.e.m.). Middle, plot of IPSCs peaks calculated for SPNs, including group averages (± s.e.m.). Right, plot of IPSCs charge transfer calculated for individual IPSCs for SPNs, including group averages (± s.e.m.). (h) Left, example of IPSCs (black trace) and rising time course (red trace) recorded at 0 mV from an SPN. Right, plot of IPSCs rising time course recorded in SPNs (n = 9) including group averages (± s.e.m.). (i) Left, example of IPSCs (black trace) and decay time course (amber trace) recorded at 0 mV from an SPN. Right, plot of IPSCs decay time course recorded in SPNs (n = 9) including group averages (± s.e.m.).
Figure 5

Summary diagram: CS-SOM neurons directly inhibit striatal SPNs.
Auditory and motor CS-SOM projections modulate the activity of striatal SPNs by direct inhibition. Green lines: excitatory inputs from intratelencephalic (IT-type) and projecting-type (PT-type) layer 5 pyramidal neurons; red line: inhibitory input from CS-SOM neurons.
Download links
A two-part list of links to download the article, or parts of the article, in various formats.
Downloads (link to download the article as PDF)
Open citations (links to open the citations from this article in various online reference manager services)
Cite this article (links to download the citations from this article in formats compatible with various reference manager tools)
An inhibitory corticostriatal pathway
eLife 5:e15890.
https://doi.org/10.7554/eLife.15890


