Insights into HIV-1 proviral transcription from integrative structure and dynamics of the Tat:AFF4:P-TEFb:TAR complex
- University of California, Berkeley, United States
- University of California, San Francisco, United States
- University of California San, Francisco, United States
- Lawrence Berkeley National Laboratory, United States
Figures
Figure 1 with 3 supplements
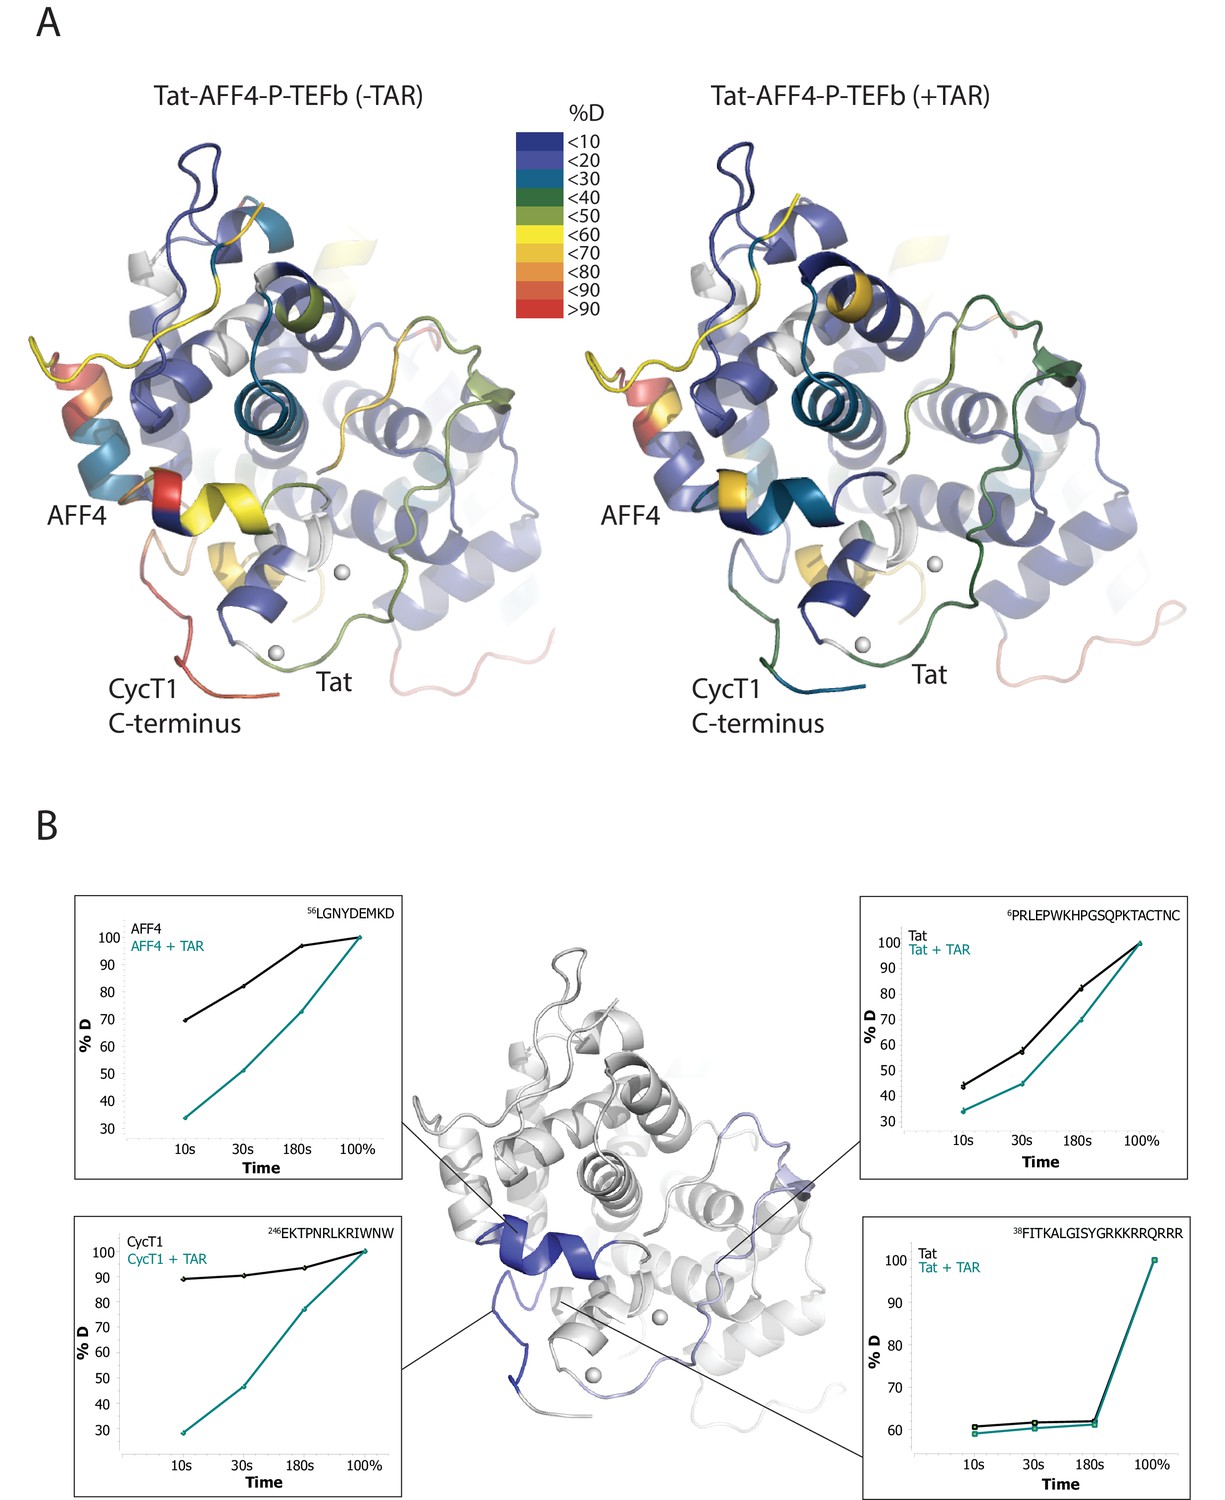
TAR-dependent changes in the Tat:AFF4:P-TEFb complex.
(A) Structure of the Tat:AFF4:P-TEFb complex colored according to the absolute percentage of deuterons incorporated in the presence and absence of TAR after 30 s in D2O. (B) TAR-dependent HDX kinetics of selected segments of Tat:AFF4:P-TEFb complex. Segments with more than 2.5 and 1 amide hydrogens protected in the presence of TAR at time‐point 10 s are colored in dark and light blue, respectively. The HDX kinetics for these segments in the absence of TAR (black) and the presence of TAR (cyan) are shown.
Figure 1—figure supplement 1
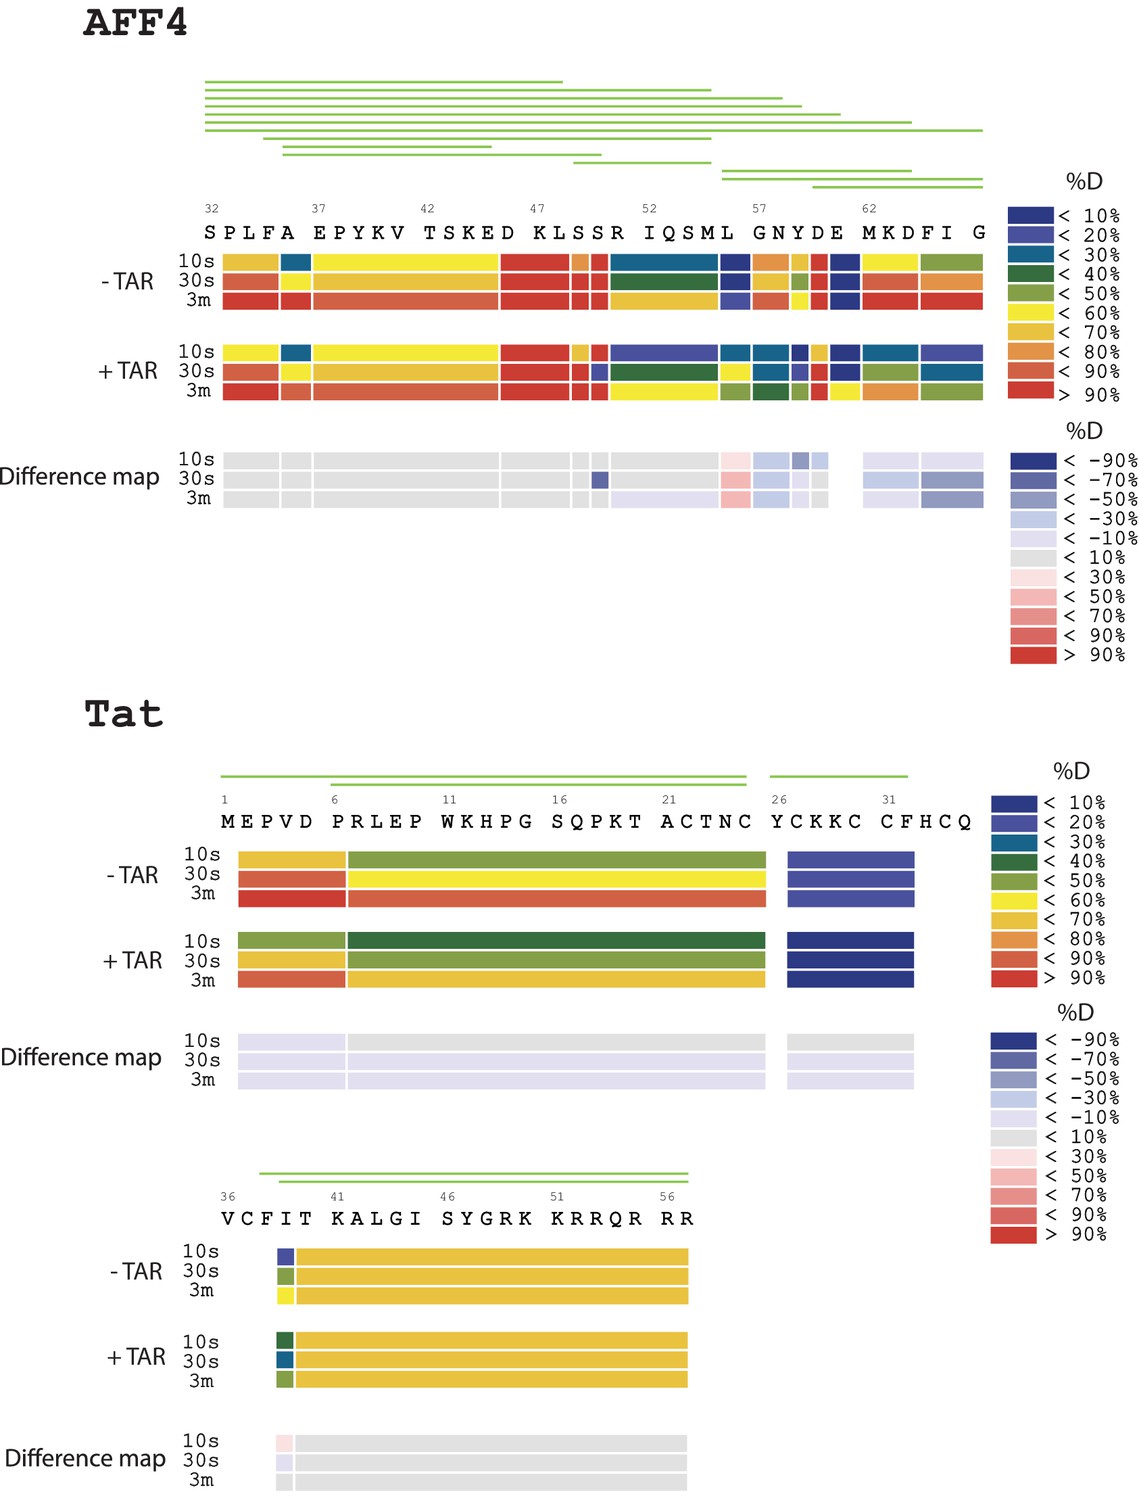
Amide HD exchange results of AFF4 and TAT in the absence and presence of TAR.
Each block indicates peptide analyzed. Each block contains three time-points; from the top, 10 s, 30 s and 3 min. The absolute deuteration levels of each segment and corresponding difference map at each time-point are shown by different colors, as indicated on the right of the Figure. Peptide coverage is shown above the deuteration map.
Figure 1—figure supplement 2
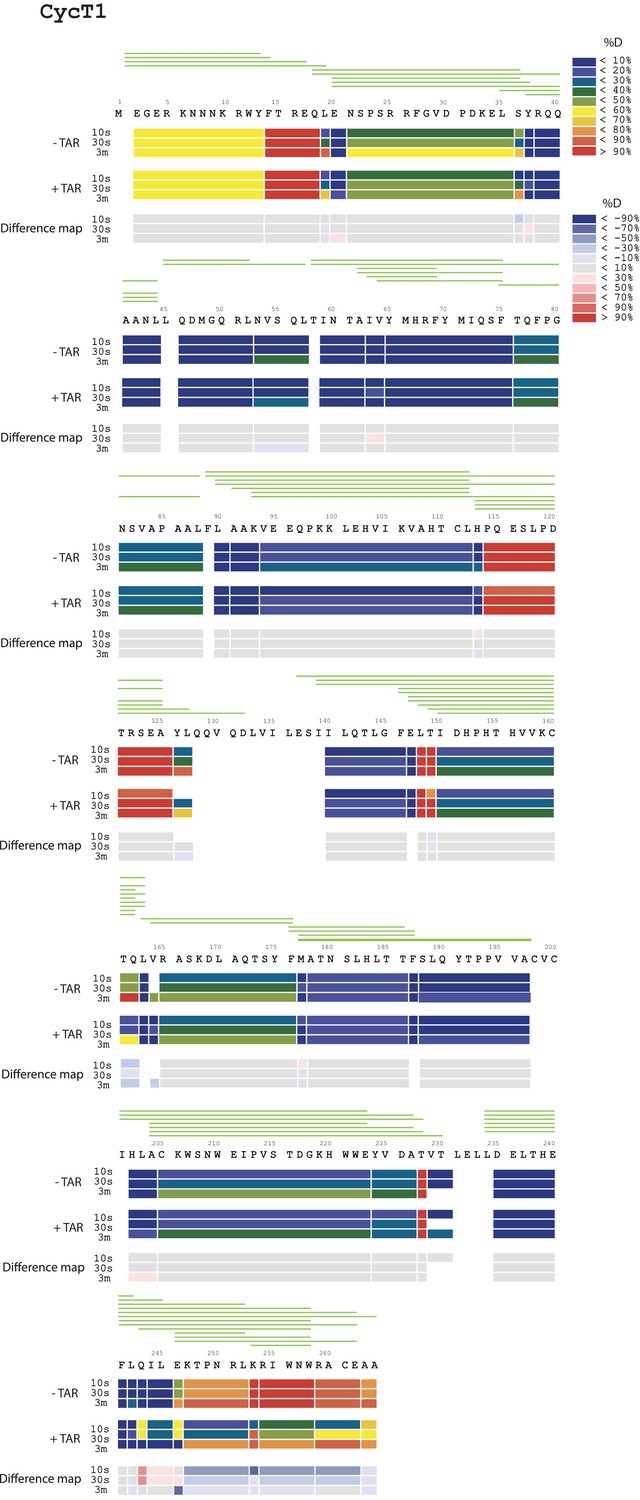
Amide HD exchange results of CycT1 in the absence and presence of TAR.
Each block indicates peptide analyzed. Each block contains three time points; from the top, 10 s, 30 s and 3 min. The absolute deuteration levels of each segment and corresponding difference map at each time point are shown by different colors, as indicated on the right of the Figure. Peptide coverage is shown above the deuteration map.
Figure 1—figure supplement 3
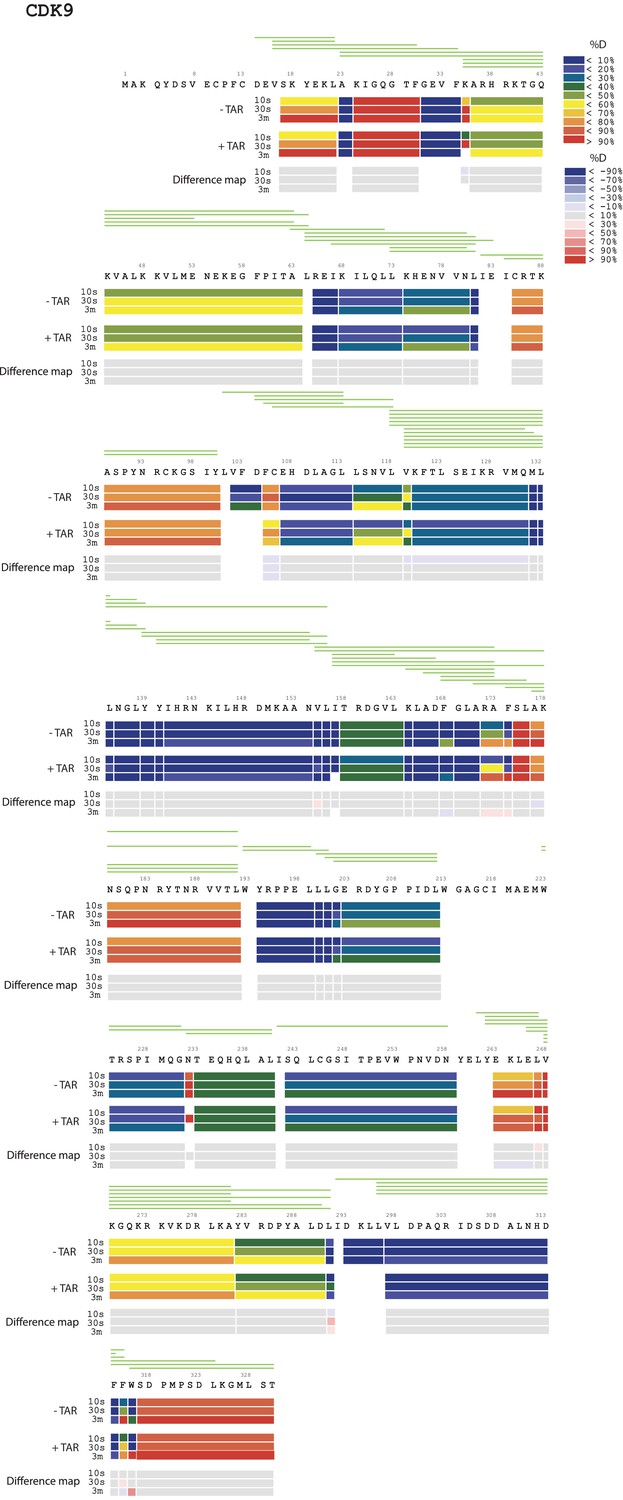
Amide HD exchange results of CDK9 in the absence and presence of TAR.
Each block indicates peptide analyzed. Each block contains three time-points; from the top, 10 s, 30 s and 3 min. The absolute deuteration levels of each segment and corresponding difference map at each time-point are shown by different colors, as indicated on the right of the Figure. Peptide coverage is shown above the deuteration map.
Figure 2 with 1 supplement
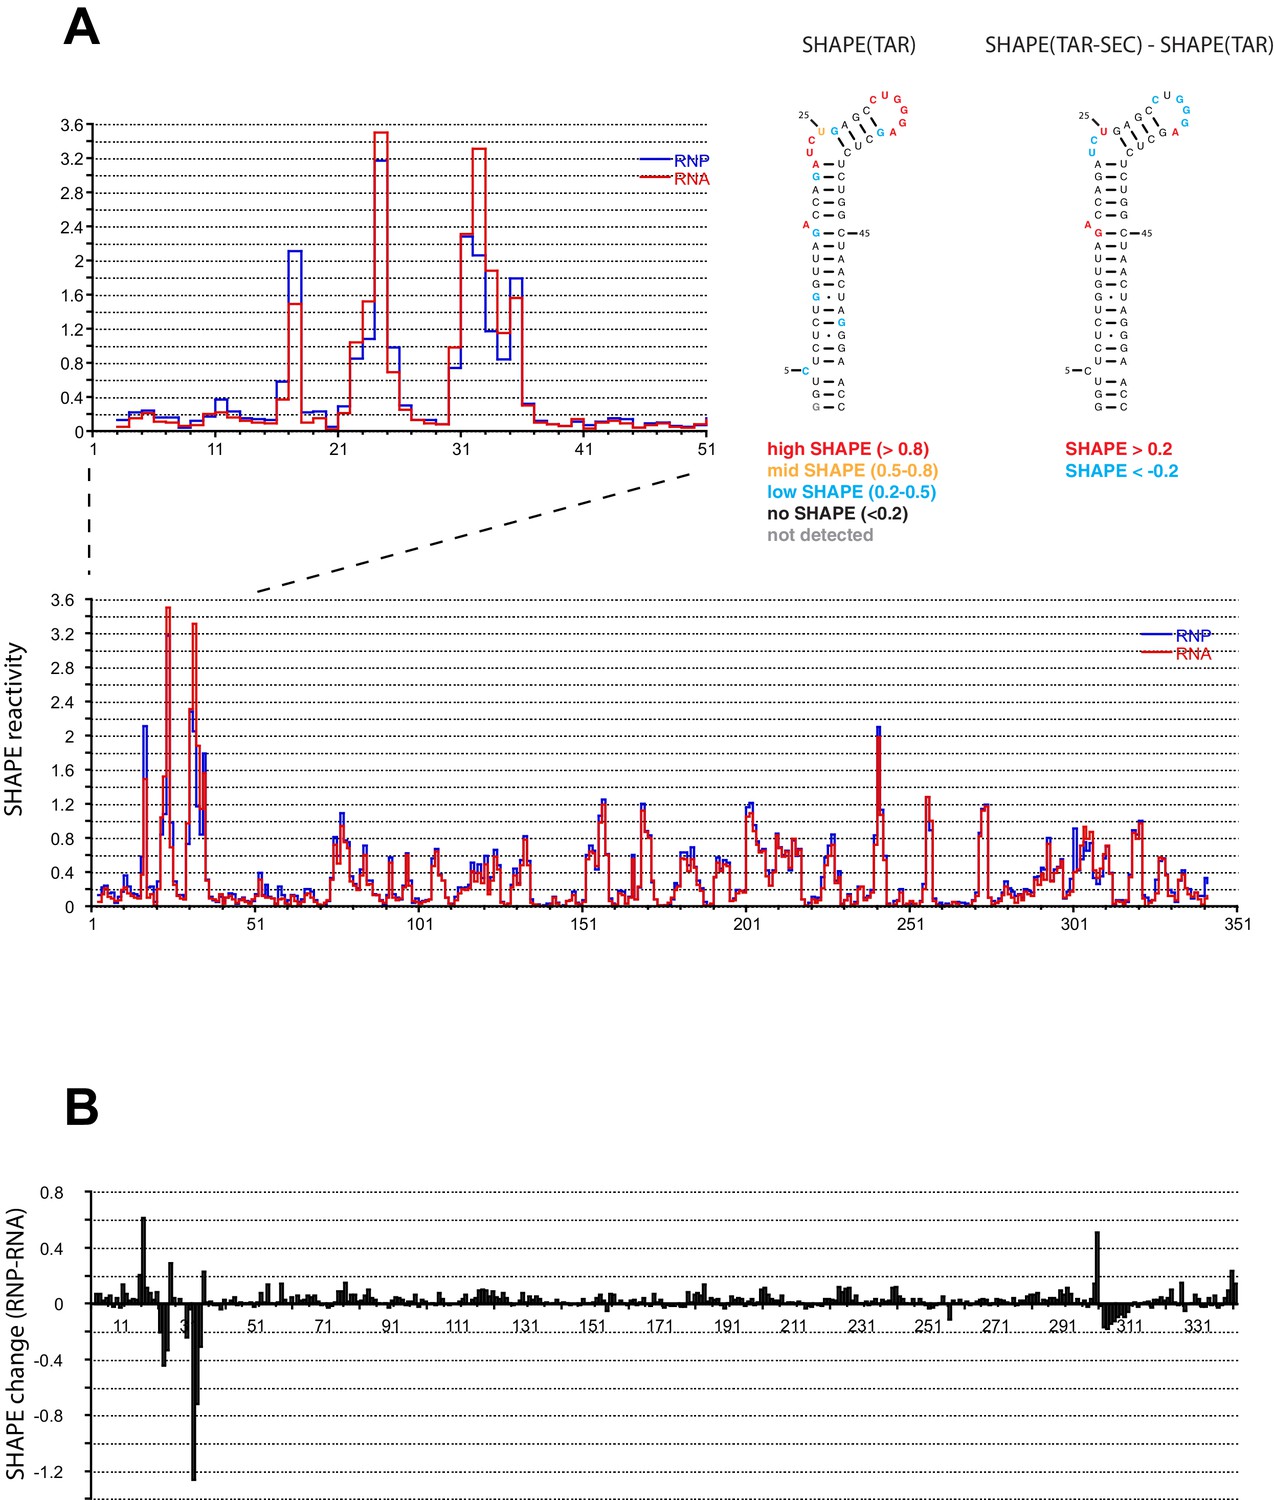
SHAPE profiles of the HIV-1 5’UTR in the presence and absence of the SEC.
(A) SHAPE reactivity of the entire HIV-1 5’UTR either alone or in complex with the SEC are shown in red and blue, respectively. SHAPE reactivity profiles are normalized using the 2/8 rule, where the top 2% of reactive nucleotides are excluded and the average of the next 8% of reactive nucleotides is used as the normalization factor. The left insert is a zoomed-in view of the TAR region. The right insert shows the secondary structure of TAR color-coded by the SHAPE profile of the TAR region alone and the SHAPE changes in the TAR region upon SEC binding. (B) SHAPE changes of the HIV-1 5’UTR upon SEC binding.
Figure 2—figure supplement 1
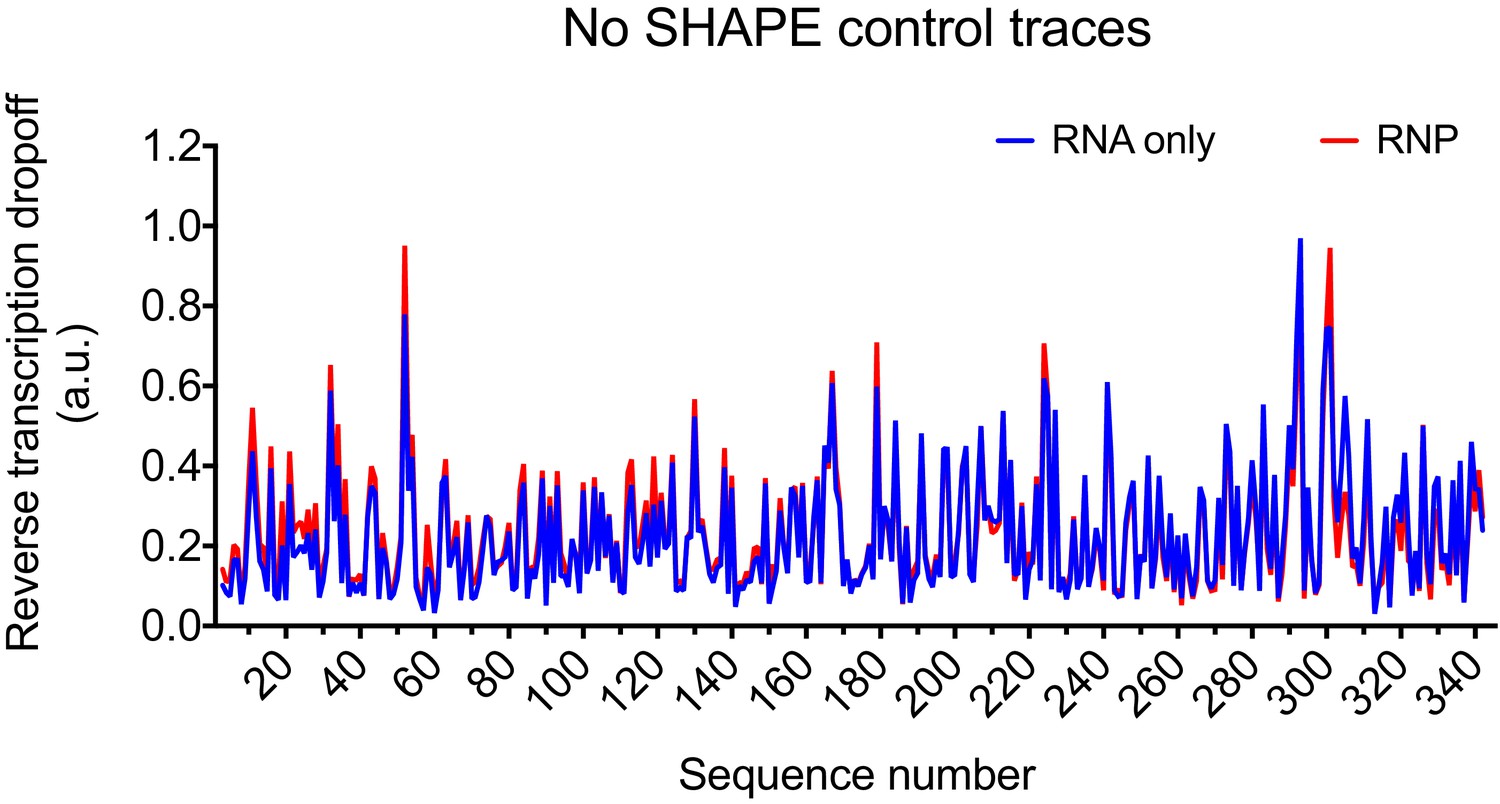
Control trace for reverse transcription reaction with HIV-1 5’UTR without SHAPE reagent.
https://doi.org/10.7554/eLife.15910.007
Figure 3
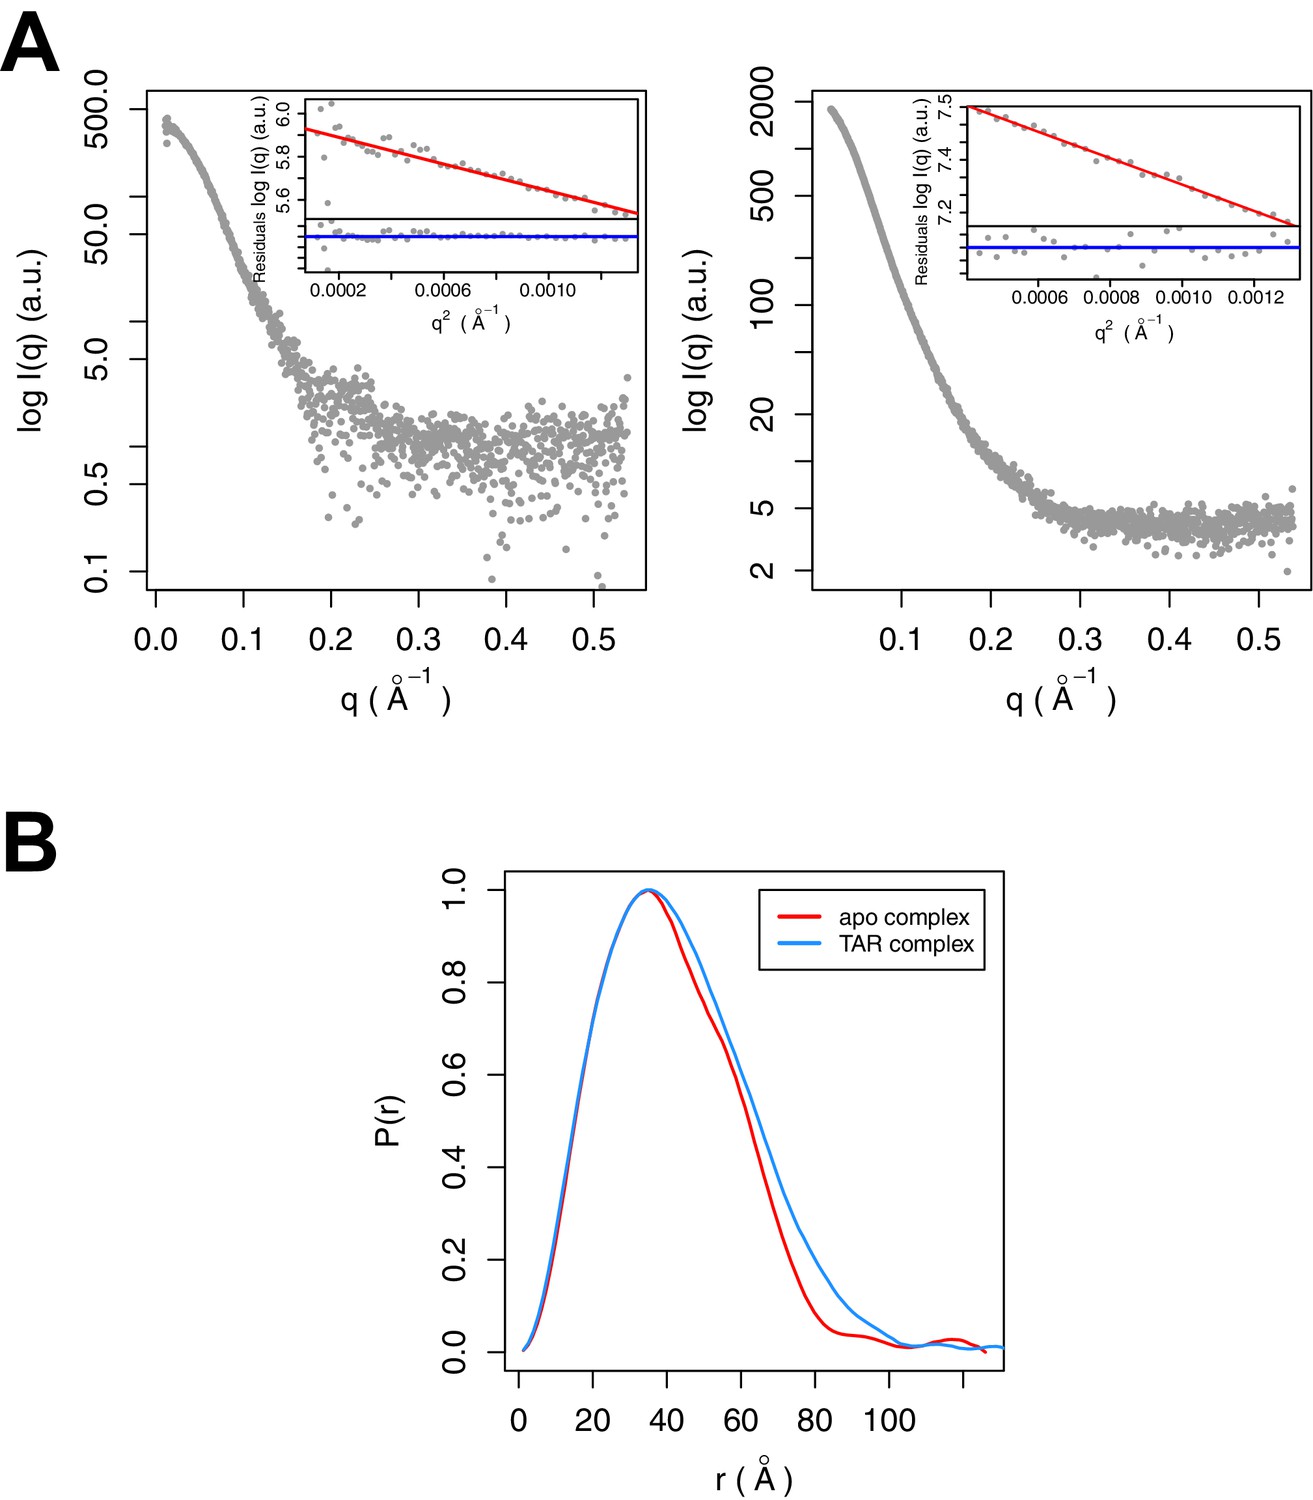
SAXS analysis of the apo and TAR-bound Tat:AFF4:P-TEFb complexes.
(A) Experimental intensities for the apo complex (left) and the TAR complex (right). Inserts in the top right corner show the Guinier plots for each data set. (B) The distance distribution plots were computed from the experimental data and normalized to the maximum value of unity.
Figure 4 with 2 supplements
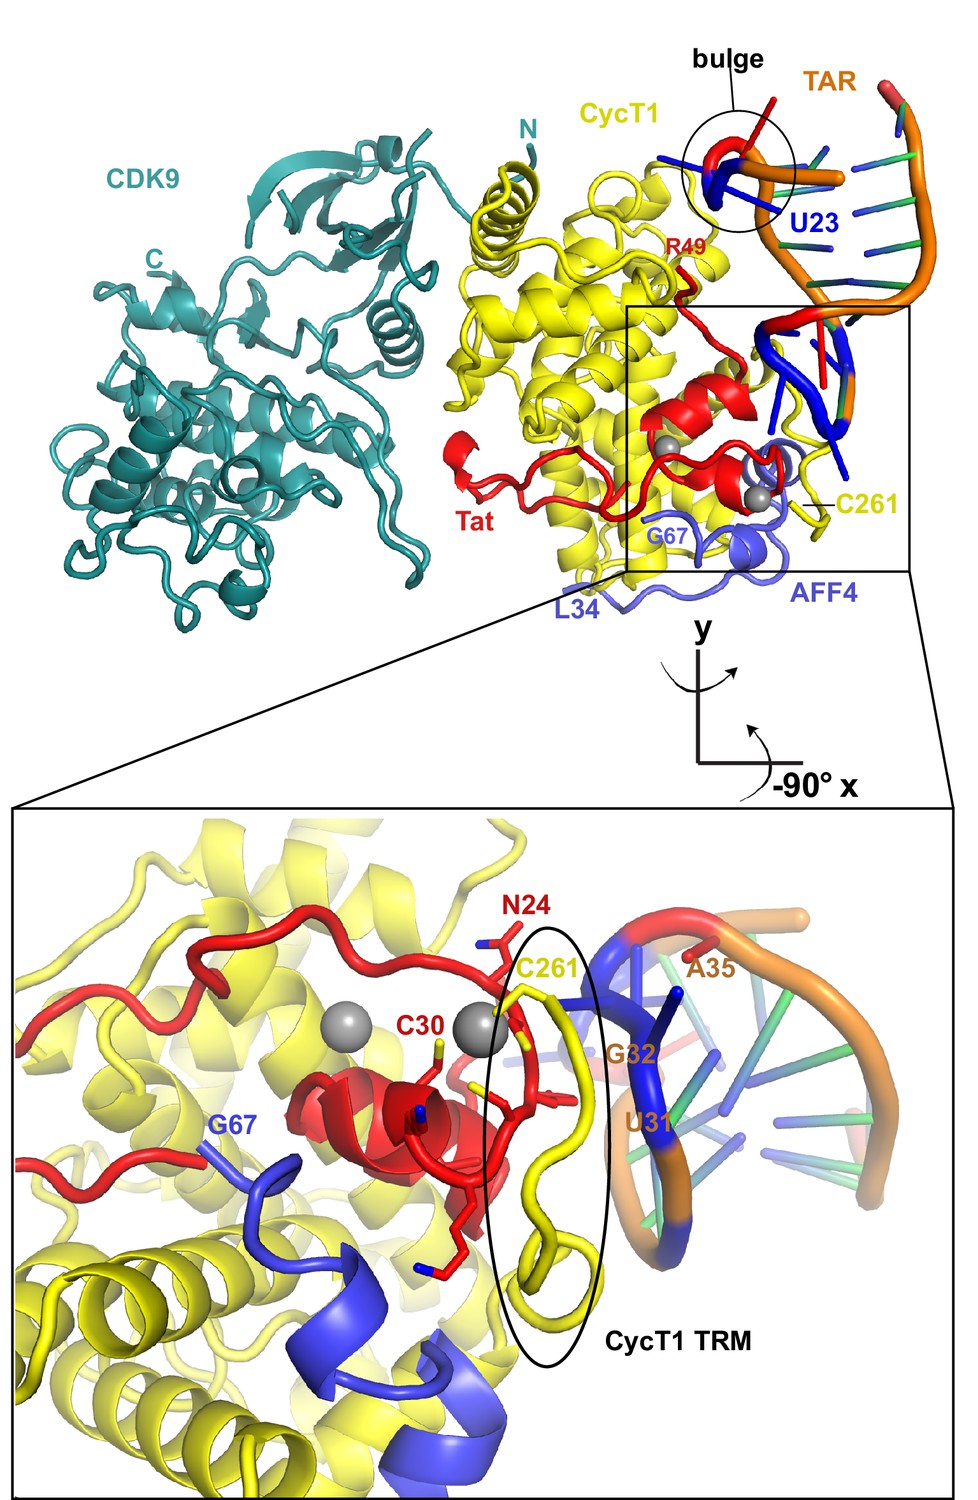
Ribbon diagram of the crystal structure of HIV-1 TAR in complex with Tat:AFF4:P-TEFb.
The top panel shows an overview of the complex with the TAR loop next to CycT1 TRM (yellow) and Tat (red), and the TAR bulge close to Tat R49, the start of the Tat ARM. Zn2+ ions are shown as grey spheres. The close-up view below highlights the interactions of the Zn2+ binding loop and CycT1 TRM with the TAR-loop and the role of AFF4 (blue) in indirectly stabilizing the Tat-CycT1 surface involved in TAR interactions. TAR nucleotides with reduced SHAPE activity (< −0.2) in the presence of SEC are colored blue, those with increased SHAPE activity (> 0.2) are colored red.
Figure 4—figure supplement 1
Fo-Fc density map (2σ) after molecular replacement and refinement with Tat:AFF4:P-TEFb only.
Clear density for TAR allowed placement of a TAR molecule (PDB ID 1ARJ). TAR is mediating important crystal contacts by interacting with a symmetry related TAR (grey).
Figure 4—figure supplement 2
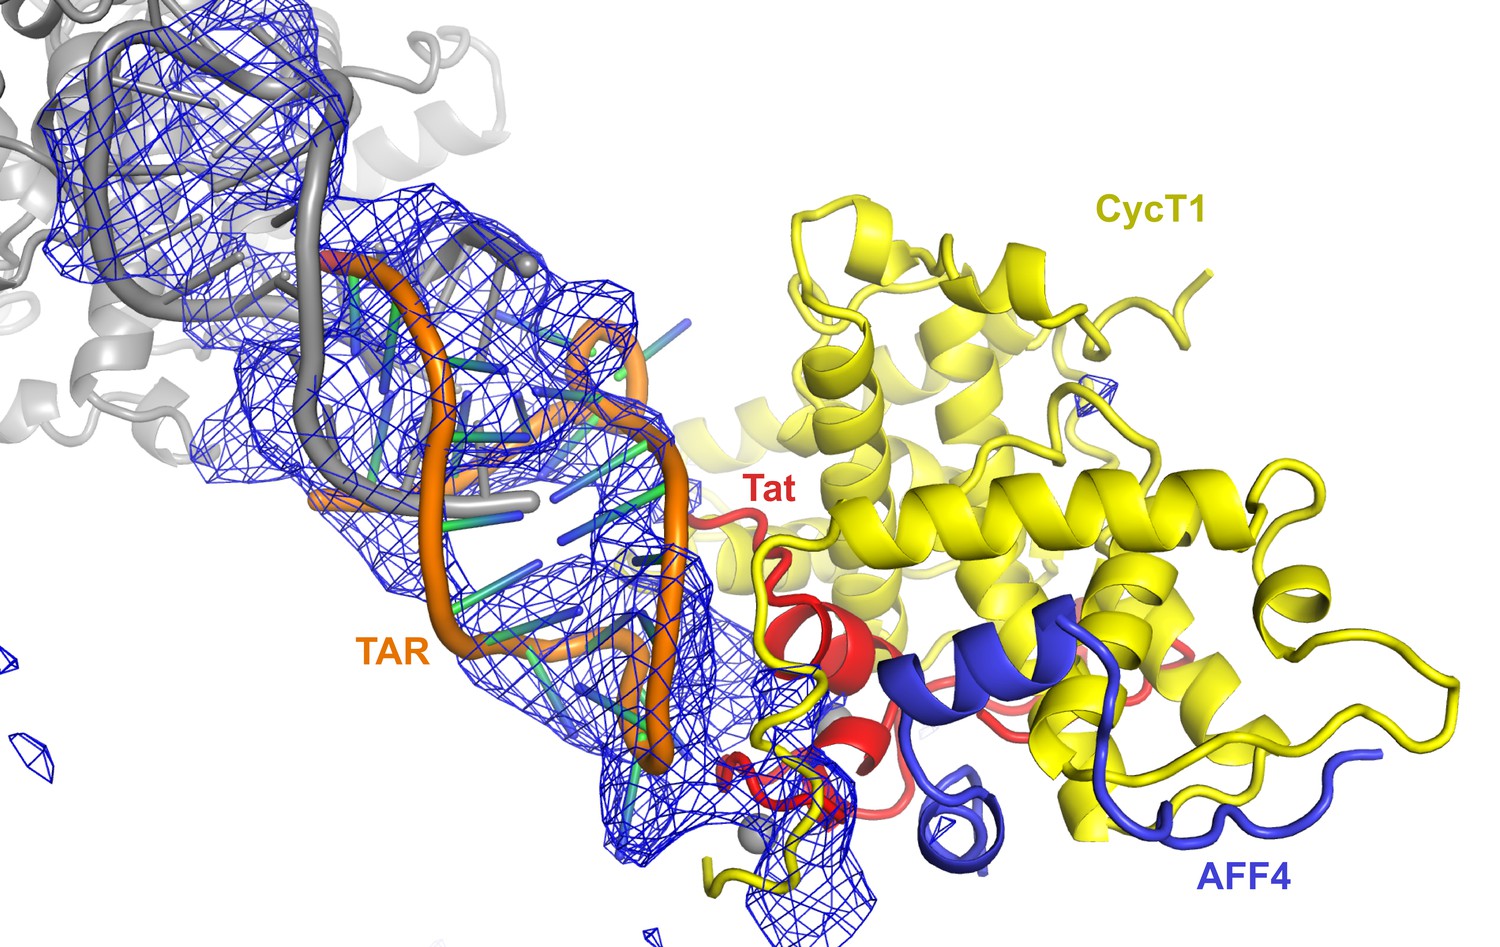
2Fo-Fc electron density map for the refined Tat:AFF4:P-TEFb complex with TAR.
Density around Cyclin T1, Tat, and TAR is contoured at 1.4 sigma (A). Density for CDK9 (B) is contoured at 1.3 sigma.
Figure 5 with 1 supplement
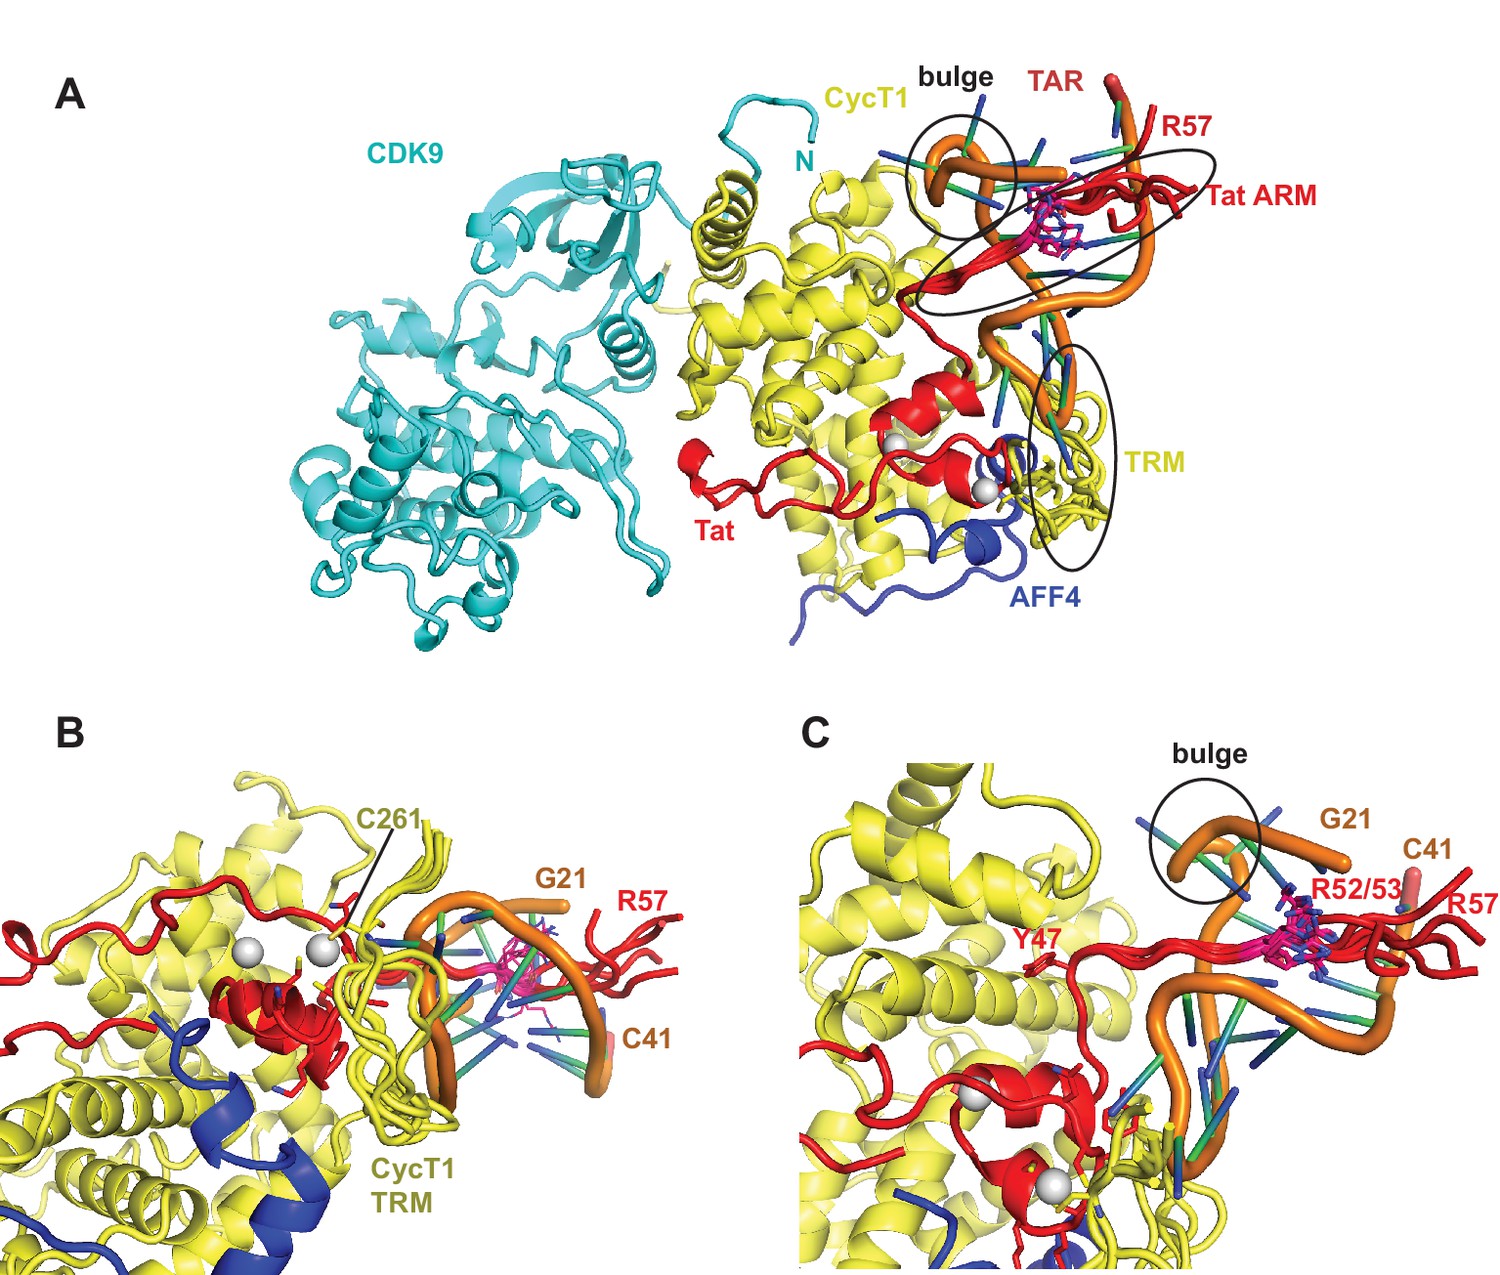
Ribbon diagram of the crystal structure of the TAR-SEC complex including modeled Tat ARM and CycT1 TRM regions.
(A) Overview of the whole complex with multiple conformations for ARM and TRM, using the same color coding as in Figure 4. (B) Closeup of the interactions between TAR–loop and CycT1 TRM. The complex is rotated 90 degree around x relative to (A). (C) Tat ARM is N-terminally anchored by Tat Y47 to CycT1. The extended ARM is located in the TAR major groove, positioning R52 and R53 close to the TAR bulge and TAR phosphate backbone.
Figure 5—figure supplement 1

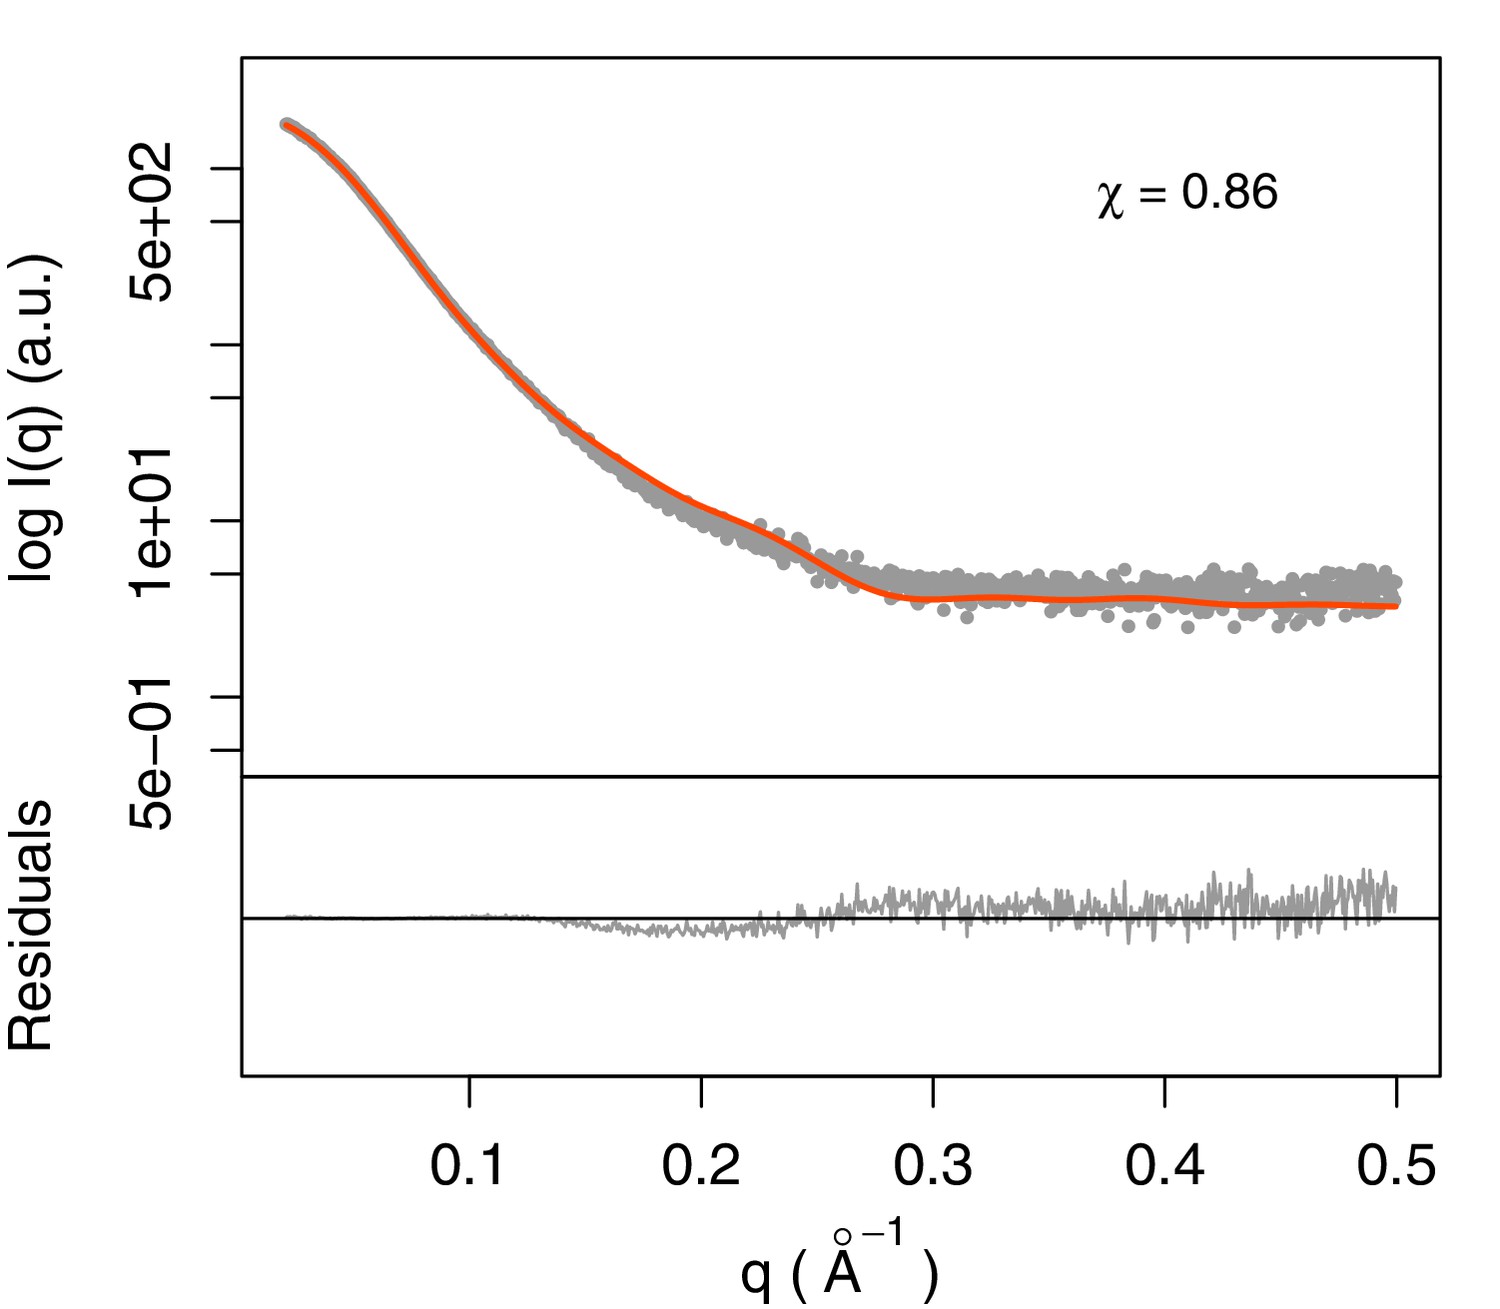
Fit of integrative model and SAXS profile.
The scattering profile calculated from the model matches the experimental profile with χ = 0.86.
Figure 6
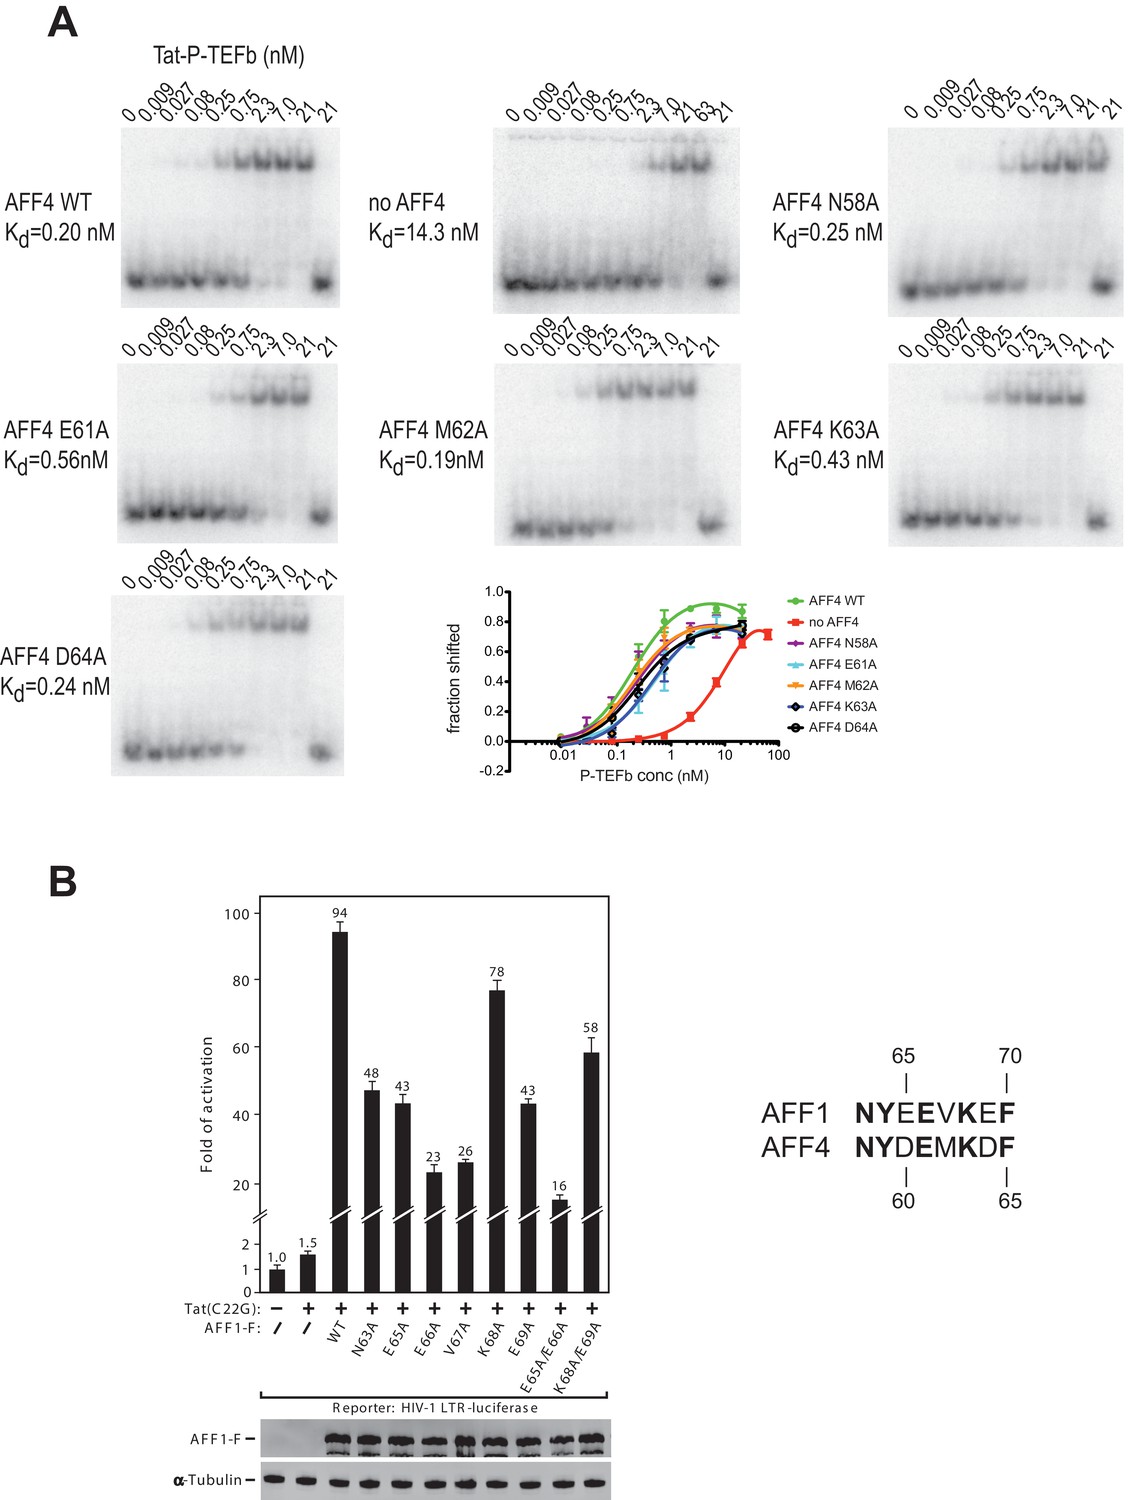
AFF4 mutants in helix α2 affect TAR binding.
(A) Electrophoretic mobility shift assays with 32P-labeled TAR and increasing concentrations of Tat:P-TEFb in the absence or presence of excess AFF4 WT fragment (resides 2–73) or mutant AFF4 fragment. In the absence of AFF4, affinity for TAR is reduced 50-fold. Single site mutants E61A and K63A reduce TAR affinity 3 and 2-fold, respectively. (B) HeLa-based NH1 cells containing the integrated HIV-1 LTR-luciferase reporter gene were transfected with the Tat(C22G)- and/or AFF1-expressing construct as labeled. Luciferase activities were measured in cell extracts, with the level of activity detected in cells transfected with an empty vector (-) set to 1. The error bars represent ± one standard deviation from three independent measurements.
Figure 7
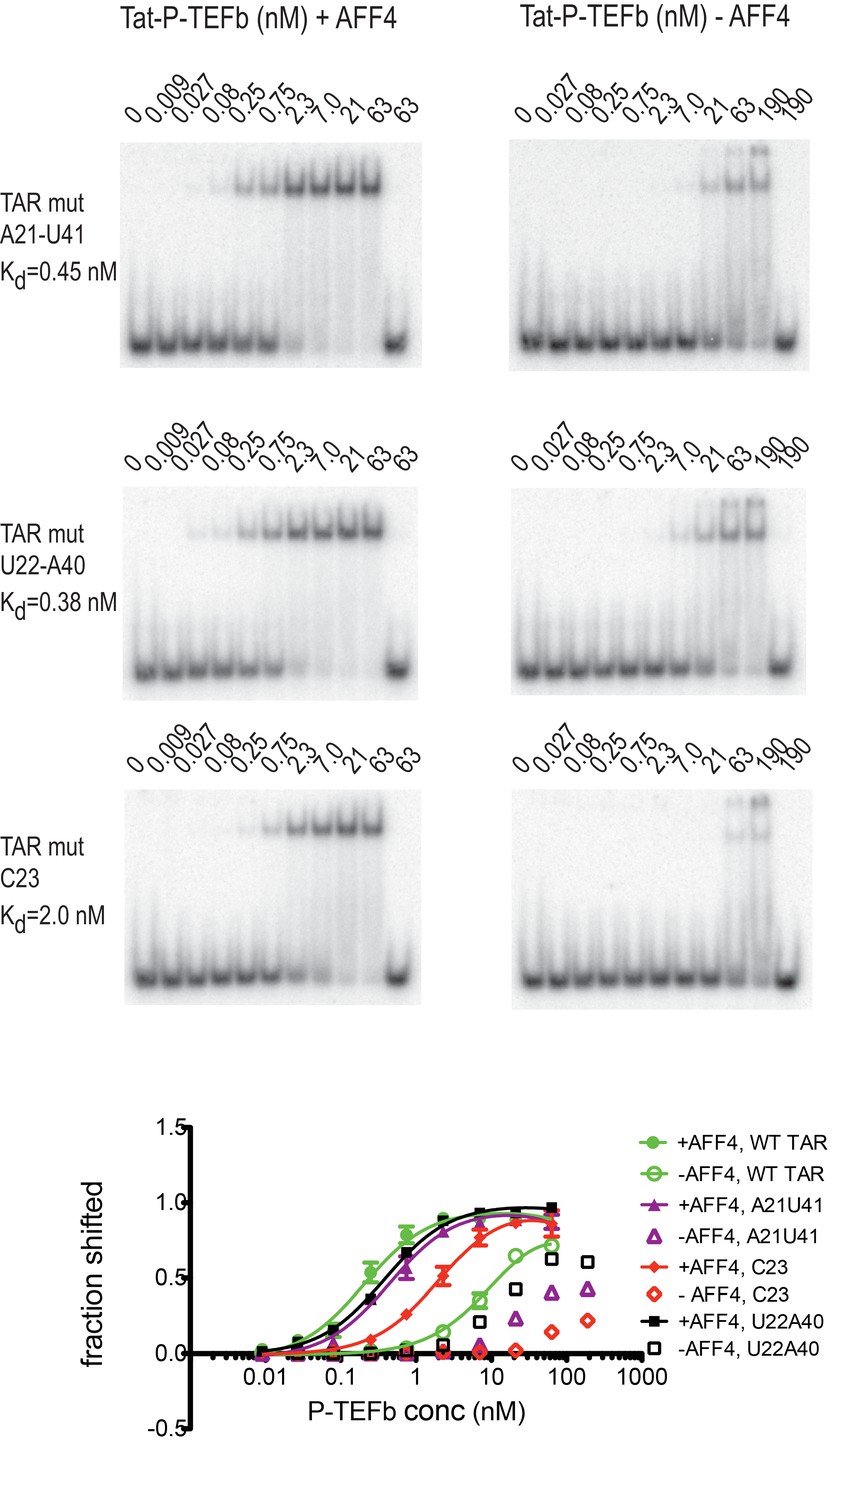
Effect of TAR mutations on Tat:P-TEFb binding in the absence and presence of AFF4.
Electrophoretic mobility shift assays with 32P-labeled TAR were performed as in Figure 6. TAR mutants G21–C41→A21–U41, A22–U40 → U22–A40, and U23C (Churcher et al., 1993) show large defects in binding to Tat:P-TEFb, but can be rescued in the presence of AFF4. Experiments were performed in triplicate. The error bars represent the standard deviation from three independent measurements.
Author response image 1
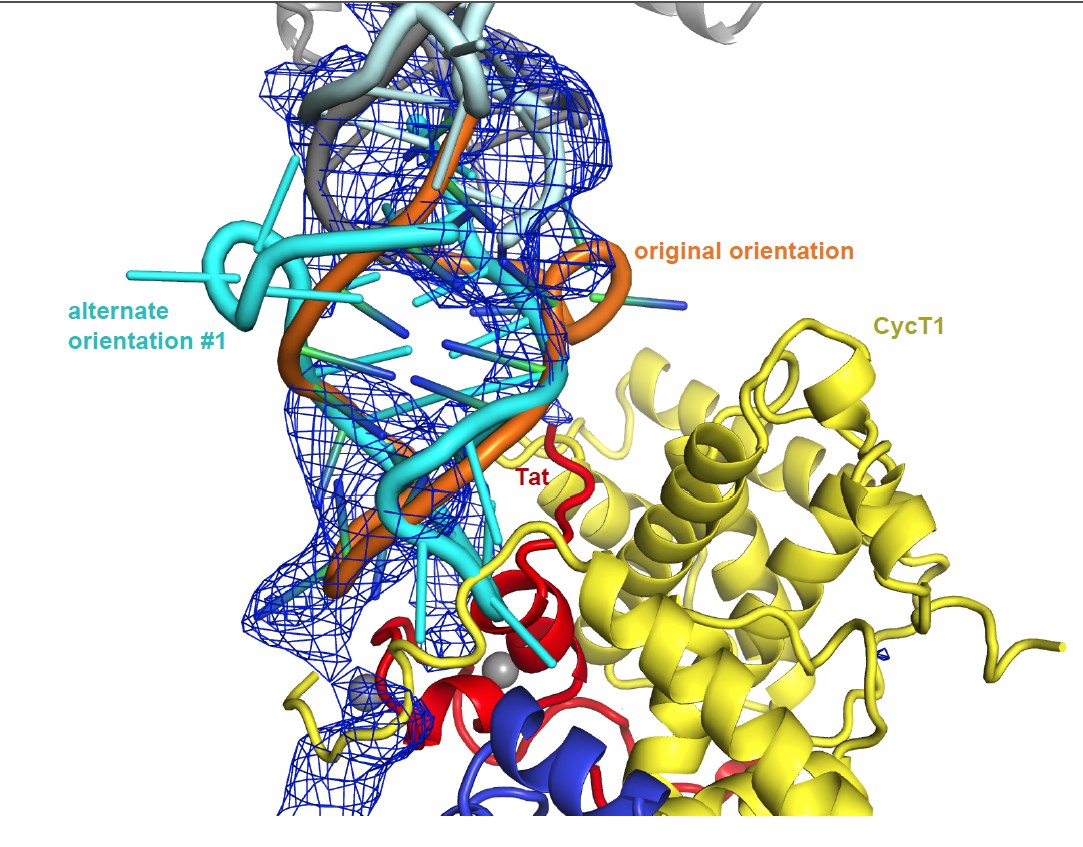
Unbiased difference electron density contoured at 2.4 sigma.
https://doi.org/10.7554/eLife.15910.020
Author response image 2
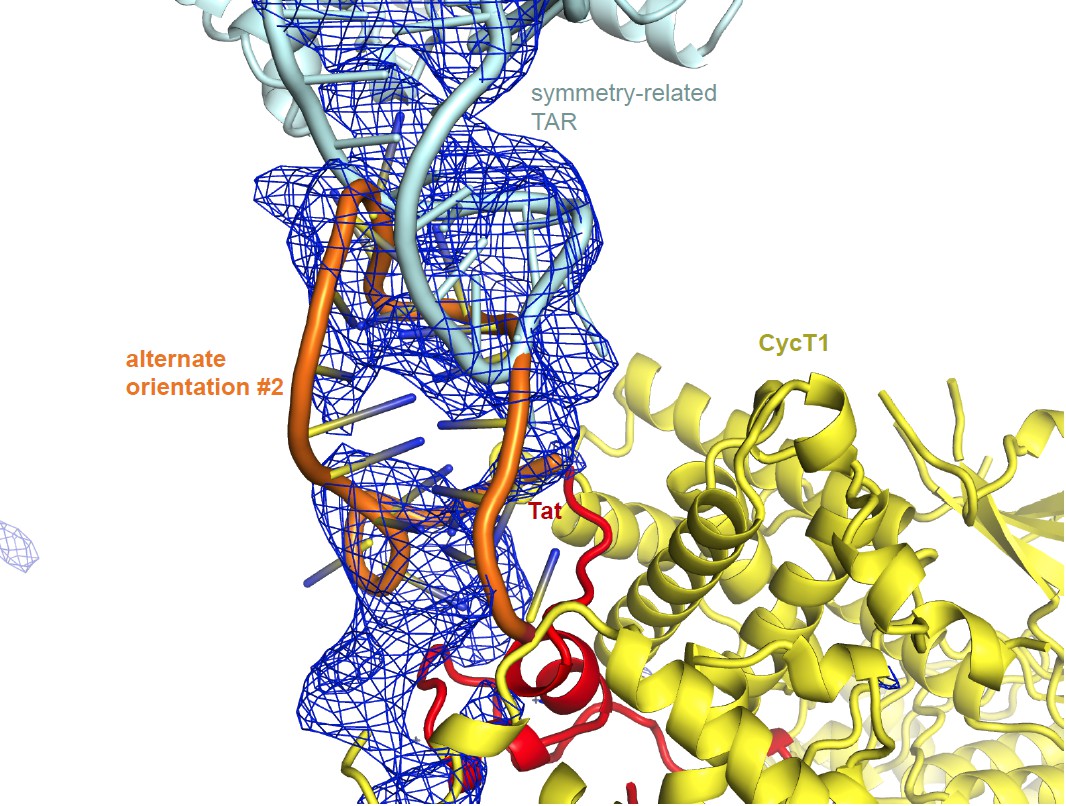
Unbiased difference electron density contoured at 2.3 sigma.
https://doi.org/10.7554/eLife.15910.021
Author response image 3
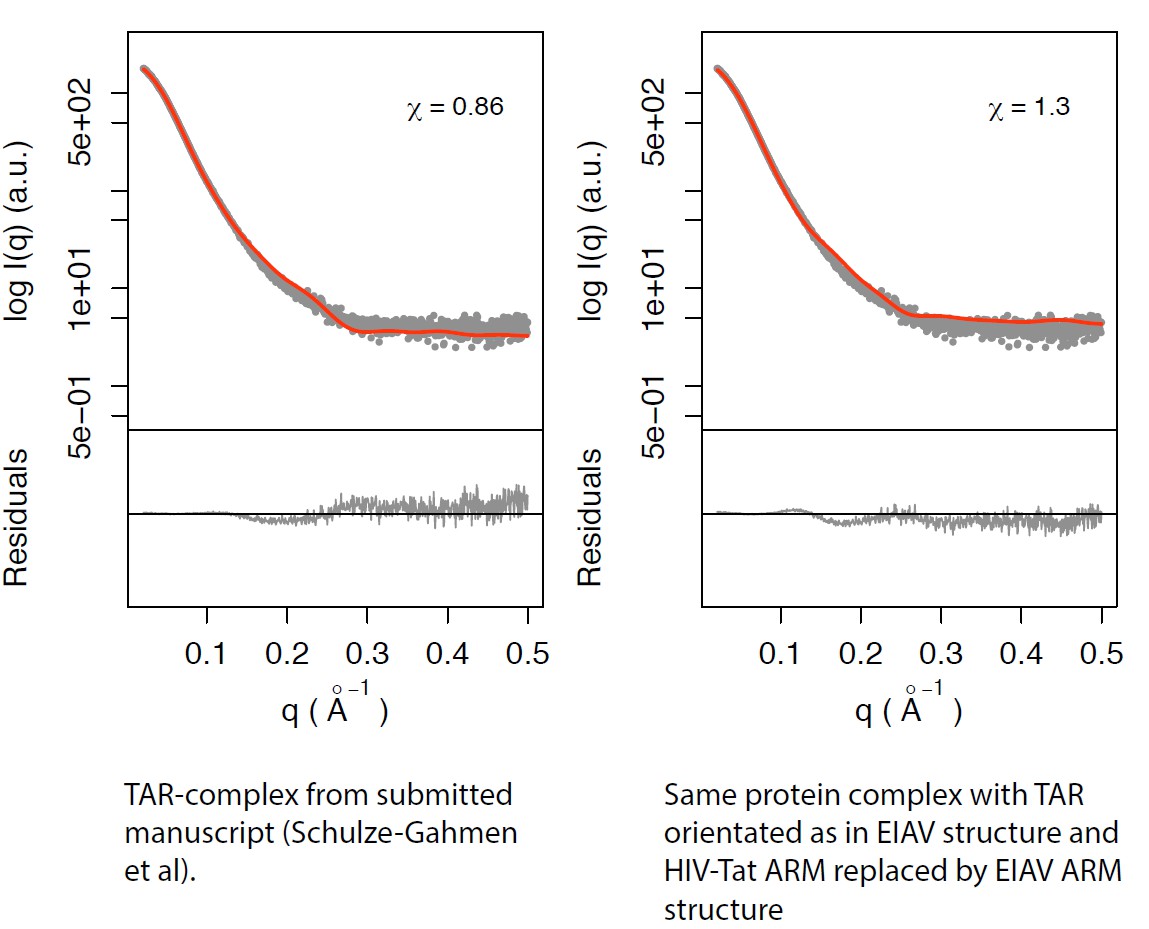
Left panel: TAR-complex from the manuscript (Schulze-Gahmen et al; Figure 5—figure supplement 1).
Right panel: Same protein complex with TAR orientated as in EIAV structure and HIV-Tat ARM replaced by EIAV ARM structure.
Author response image 4
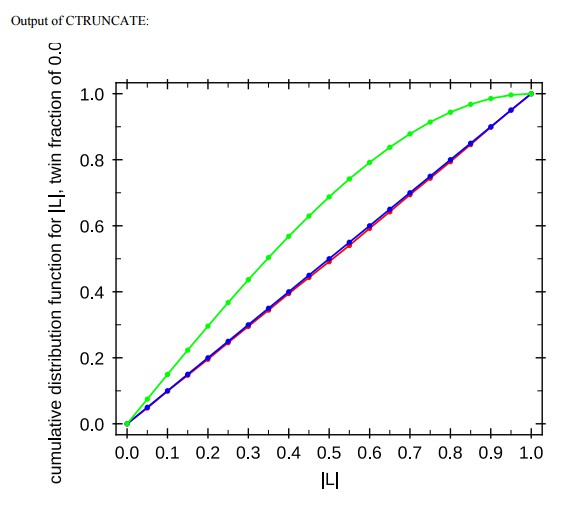
Output of CTRUNCATE
https://doi.org/10.7554/eLife.15910.023Tables
Table 1
Overall parameters of Tat:AFF4:P-TEFb complexes determined by SAXS
| Complex | RG, Å* | Dmax, Å* | Porod exponent* |
|---|---|---|---|
| Tat:AFF4:P-TEFb | 31.2 | 126 | 3.6 |
| TAR:Tat:AFF4:P-TEFb | 33.9 | 134 | 3.4 |
-
* Parameters were determined using the program SCÅTTER (Förster et al., 2010).
Table 2
X-ray data collection and refinement statistics for Tat:AFF4:P-TEFb with TAR21.
| Data collection | |
|---|---|
| Space group | P3221 |
| Cell dimensions: a, b, c | 146.87, 146.87, 103.75 |
| Resolution (Å)* | 50.0-5.9 (6.1–5.9) |
| Unique reflections* | 3607 (339) |
| I/σ(I)* | 10.22 (0.35) |
| Rsym (%)* | 17.8 (>100) |
| CC1/2 high resolution shell | 0.24 |
| Completeness (%)* | 100.0 (100.0) |
| Redundancy* | 9.68 (10.25) |
| Twin fraction† | 0.03 |
| Temperature (K) | 100 |
| Mosaicity (°) | 0.175 |
| Refinement | |
|---|---|
| Resolution (Å) | 50.0-5.9 |
| No. reflections | 3595 |
| DEN refinement parameter§ | γ=0, wDEN=300 |
| Rwork/Rfree | 0.223/0.315 |
| Average B-factor (Å2) | 400 |
| R.m.s. deviations | |
| Bond lengths (Å) | 0.0027 |
| Bond angles (º) | 0.81 |
| Ramachandran plot# | |
| Favored (%) | 92.01% |
| Allowed (%) | 6.43% |
| Disallowed (%) | 1.57% |
-
*Values in parentheses are for the highest resolution shell.
-
†Value from Ctruncate (see Table 2—source data 1)
-
§parameter for DEN refinement in CNS (see Table 2—source data 1)
-
#Values from COOT.
-
Table 2—source data 1
Diffraction data and refinement analysis.
Twinning analysis by L-test in Ctruncate (A) and Xtriage indicate no twinning. Blue curve is acentric untwinned data, green curve acentric twinned data, and red curve observed data from Tat:AFF4:P-TEFb-TAR co-crystal. (B, C) Optimization of DEN refinement parameters using the web service for low resolution crystal structure refinement (https://portal.sbgrid.org/d/apps/den/). (D) Log-file of twinning analysis in CNS.
- https://doi.org/10.7554/eLife.15910.011
-
Table 2—source data 2
RSCC and RSR=sum|r-r_calc|/sum[r+r_calc| using 2fofc map and D*Fcalc.
- https://doi.org/10.7554/eLife.15910.012
Download links
A two-part list of links to download the article, or parts of the article, in various formats.
Downloads (link to download the article as PDF)
Open citations (links to open the citations from this article in various online reference manager services)
Cite this article (links to download the citations from this article in formats compatible with various reference manager tools)
Insights into HIV-1 proviral transcription from integrative structure and dynamics of the Tat:AFF4:P-TEFb:TAR complex
eLife 5:e15910.
https://doi.org/10.7554/eLife.15910


