Distinct lateral inhibitory circuits drive parallel processing of sensory information in the mammalian olfactory bulb
- University of Pittsburgh, United States
- Carnegie Mellon University, United States
Figures
Figure 1 with 1 supplement
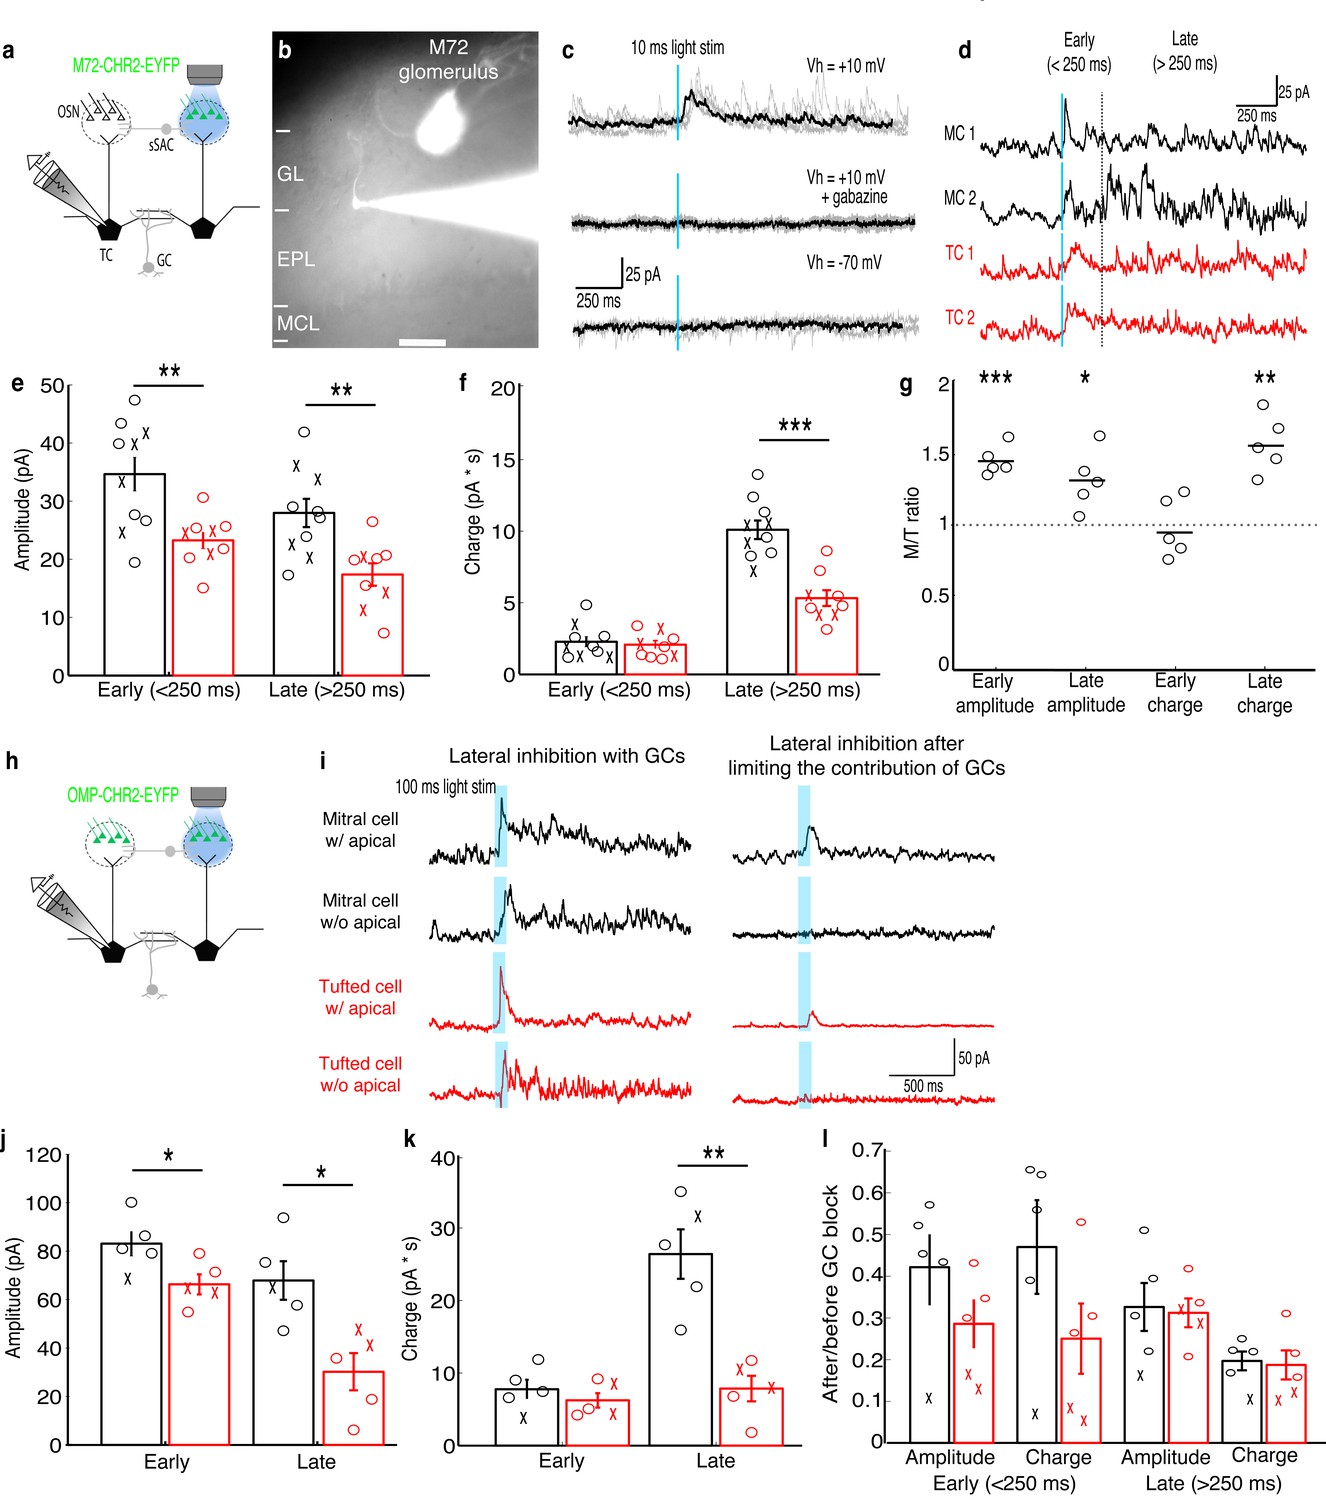
MCs receive stronger lateral inhibition than TCs.
(a–b) Schematic and example of recording from a TC that projects to a glomerulus near the M72 glomerulus to measure lateral inhibition in M72-ChR2-YFP mice (GL: glomerular layer, EPL: external plexiform layer, MCL: mitral cell layer). Scale bar –100 µm. (c) Light stimulation evoked reliable inhibitory currents in recorded TC (TOP; 5 trials – grey, average – black) that are abolished by gabazine (MIDDLE) but did not evoke excitatory currents (BOTTOM). (d) Examples of average inhibitory currents in 2 MCs and 2 TCs. Inhibitory responses were grouped into early phase (<250 ms) and late phase (>250 ms). (e) The peak amplitude was significantly larger in MCs (n = 10) than in TC (n = 10) during both the early and late phases of inhibition. (f) Charge transferred was significantly larger in MCs than TCs during the late phase only. (‘x’ indicates cells lacking apical dendrites). (g) MCs and TC recorded sequentially in the same slice (n = 5 slices) show similar differences in inhibition. (h–i) Analogous experiment measuring lateral inhibition in OMP-ChR2-YFP mice before and after limiting GC-mediated inhibition by bath applying APV and LY36785. (j,k) Similar differences in the peak amplitude (j) and charge (k) in MCs (n = 5) and TCs (n = 5) were found. (l) Ratio of early and late phase amplitude and charge after and before limiting GC-mediated inhibition. Data are presented as mean ± s.e.m. Statistical tests in e,f,j,k,l were two-tailed, unpaired t tests and tests in g were paired t tests. (*p<0.05, **p<0.01, ***p<0.001)
Figure 1—figure supplement 1
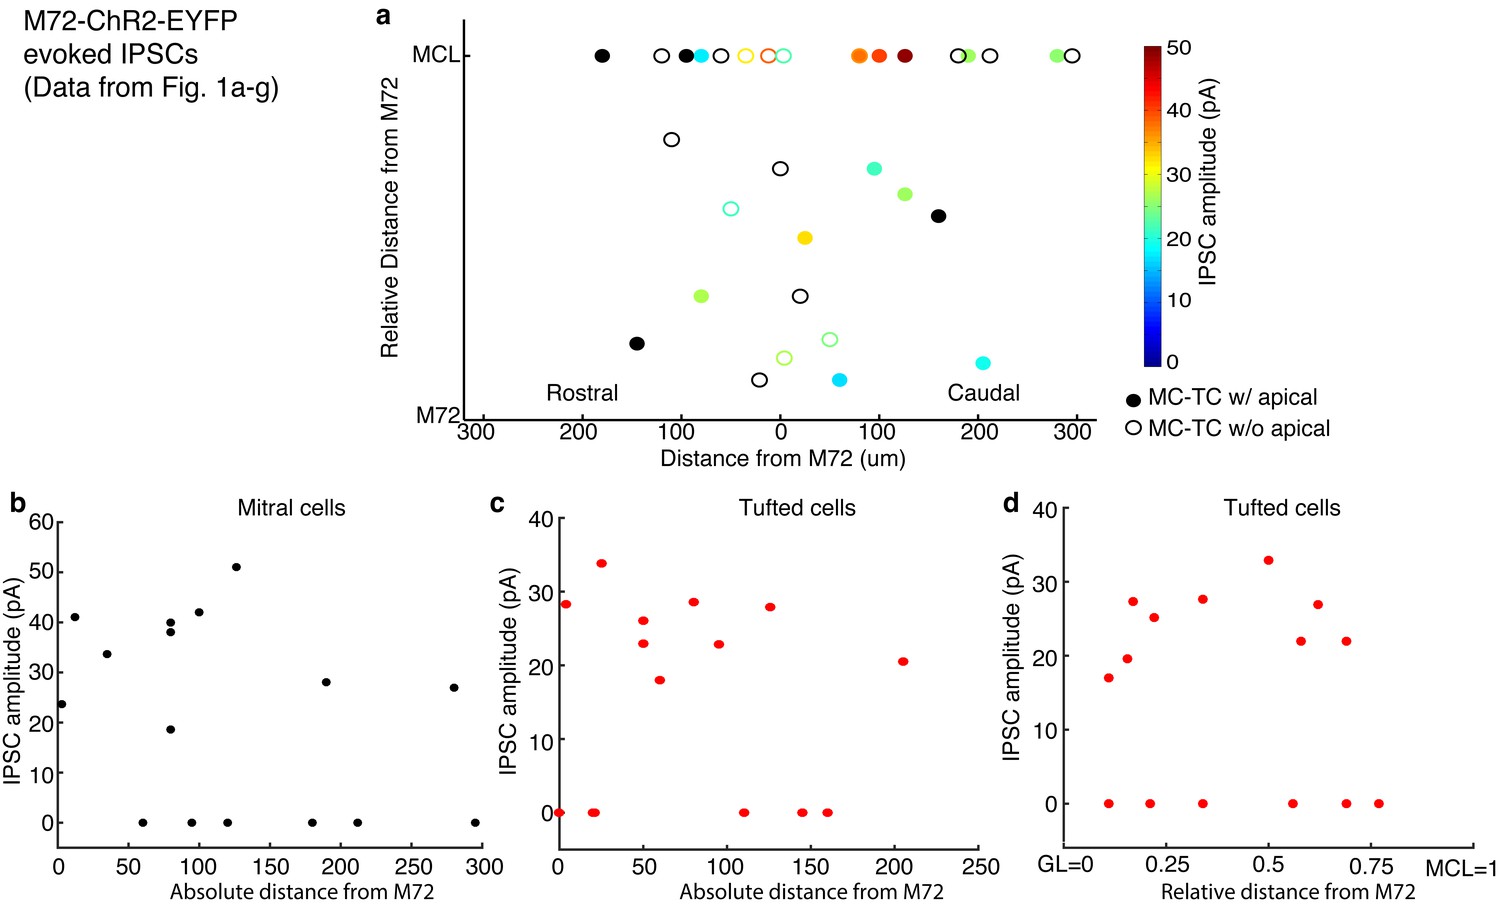
Distance dependence of lateral inhibition onto MCs and TCs.
(a–d) Lateral distance dependence of inhibitory current amplitude from data taken from Figure 1a–g. (a) Map of where recorded MCs and TCs resided with respect to the M72 glomerulus. TC position on the y axis is the relative distance between the glomerular layer and the mitral cell layer (MCL). Unfilled circles indicate MC/TCs that lack an apical dendrite. (b–c) Plot of lateral inhibition amplitude vs absolute lateral distance from the M72 glomerulus in MCs (b; r = 0.17, p = 0.52) and TCs (c; r = 0.25, p= 0.36). (d) Plot of lateral inhibition amplitude vs relative radial distance from the M72 glomerulus in TCs (r = –0.09, p = 0.76). Significance determined using Pearson’s correlation.
Figure 2 with 1 supplement

Examples show a TC and MC affected by lateral inhibition at low and intermediate firing rates, respectively.
(GL: glomerular layer, EPL: external plexiform layer, MCL: mitral cell layer). (a) Fluorescent image of a recorded MC that projects to a glomerulus near the M72 glomerulus. (b–f) The impact of lateral inhibition on one example MC (b, e) and one example TC (c, d, f) was assessed by constructing FI curves for each cell via somatic current injections of increasing amplitudes. At each current step, the number of action potentials evoked with and without M72 photostimulation was determined (10 ms pulses at 15 Hz). (b–c) Examples of voltage traces in a MC (b) or TC (c) at 2 different firing rates with and without M72 photostimulation. (d) The effect of lateral inhibition is illustrated by comparing the FI curves for the light off (grey) versus light on (red) trials in the TC. (e–f) Plots of the percent decrease in firing rate (TOP) or absolute firing rate (BOTTOM) in light on trials for a MC (e) or TC (f). Asterisks signify firing rates that are reduced by more than 10% in at least 2 consecutive light on trials.
Figure 2—figure supplement 1
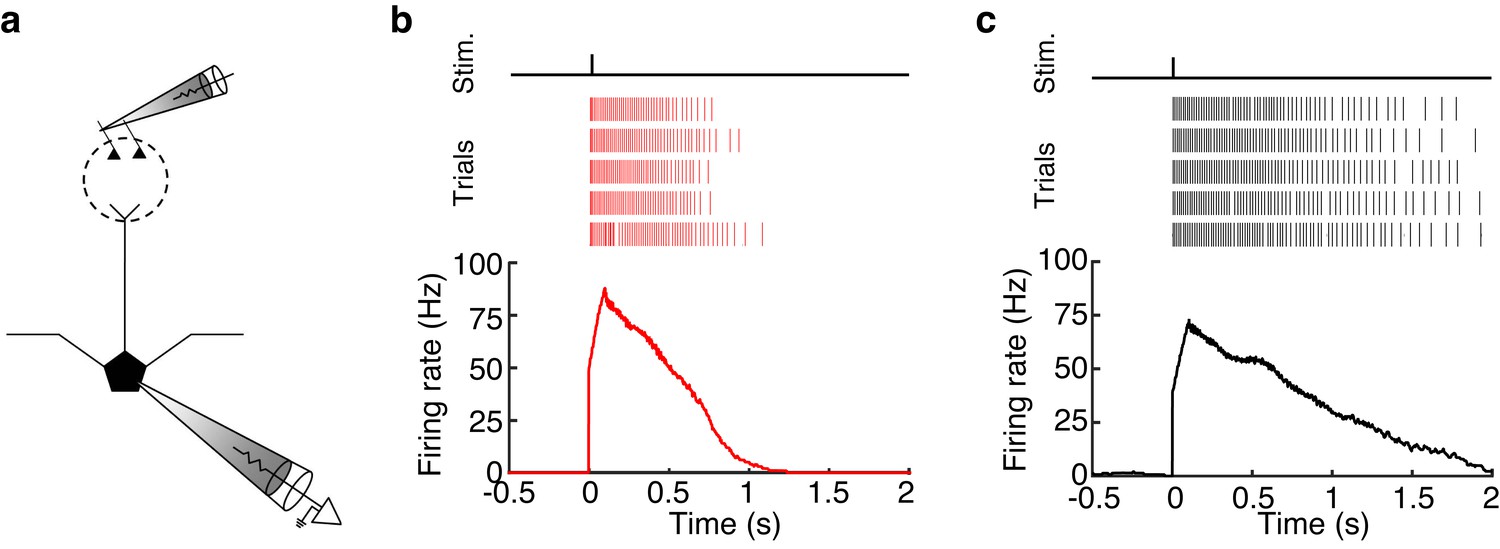
MCs and TCs can sustain high firing rates (>50 Hz) for long periods (>500 ms) following glomerular stimulation.
(a) Schematic of experiment in which we electrically stimulated the home glomerulus of a MC or TC. (b–c) Spike raster (TOP) and PSTH (BOTTOM) of the response in one MC (b) and one TC (c) to a single electrical pulse (100 μA, 600 μs) to the OSN layer.
Figure 3 with 3 supplements

Summary results show that TCs are influenced by lateral inhibition at low rates while MCs are influenced at intermediate rates.
(a) The range of firing rates that are significantly influenced by lateral inhibition is plotted with respect to the firing rate in light off trials. Outer rectangle for each cell indicates the total range of firing rates evoked during light off trials. Inner (shaded) rectangle indicates the range of firing rates that are reduced during light on trials. Asterisks indicate cells that lack apical dendrites. ($ - MC used in Figure 2, # - TC used in Figure 2). (c) Percentage of cells that are significantly inhibited is plotted with respect to the firing rate in light off trials. (c–d) Average decrease in firing rate (c – plotted as percent, d – plotted as Hz) across the population of MCs (black) and TCs (red). Grey dotted line in c represents the 10% threshold used to indicate significant inhibition. Shaded areas represent s.d. (e) The lower (LEFT, unpaired t-test, p = 2.8 × 10⁻⁷) and upper bound (RIGHT, unpaired t-test, p = 1.7 × 10⁻⁵) of the range of rates affected by lateral inhibition are significantly lower in TCs compared to MCs. (f) There is no change in the average decrease in firing rate (Hz) between MCs and TCs (unpaired t test, p = 0.87). In f, decreases in firing rate were calculated as the average decrease across all significantly affected firing rates. Data are presented as mean ± s.e.m.
Figure 3—figure supplement 1
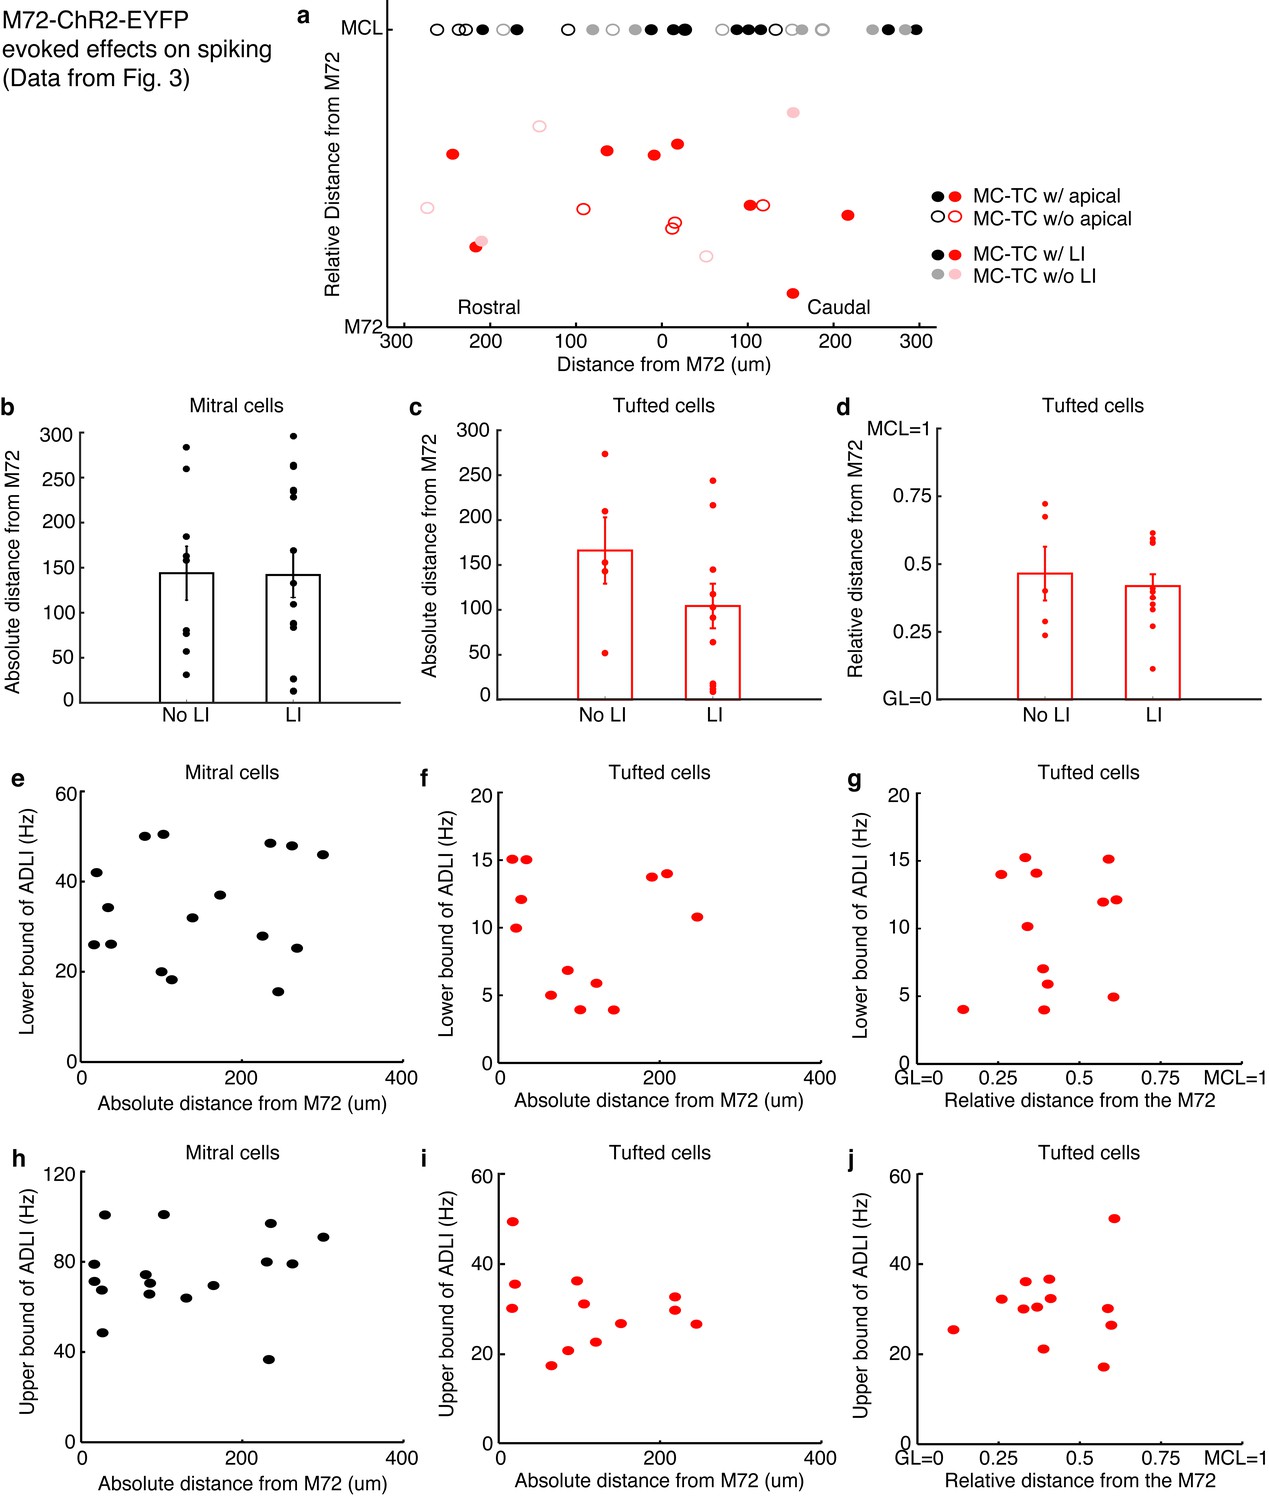
Distance dependence of lateral inhibition onto MCs and TCs.
(a–d) Lateral distance dependence of effect of lateral inhibition on spiking from data taken from Figure 3. (a) Map of where recorded MCs and TCs resided with respect to the M72 glomerulus. TC position on the y axis is the relative distance between the glomerular layer and the mitral cell layer (MCL). Unfilled circles indicate MC/TCs that lack an apical dendrite. (b–c) Plot of lateral inhibition amplitude vs. absolute lateral distance from the M72 glomerulus in MCs (b, p = 0.28; unpaired t-test) and TCs (c,p = 0.31; unpaired t-test) with and without lateral inhibition. (d) Plot of lateral inhibition amplitude vs. relative radial distance from the M72 glomerulus in TCs (p = 0.62; unpaired t-test) with and without lateral inhibition. (e–f) Plot of lower bound of ADLI vs absolute distance from the M72 glomerulus in MCs (e–r = 0.16, p = 0.56) and TCs (f–r = 0.005, p = 0.99). (g) Plot of lower bound of ADLI vs. relative distance from the M72 glomerulus in TCs (r = 0.20, p = 0.54). (h–j) Same as e-g, only with the upper bound of ADLI (h–r = 0.21, p=0.44; i–r = −0.30, p = 0.34; j–r = 0.11, p = 0.72). In e–j, significance was determined using Pearson’s correlation. Error bars in b–d indicate mean ± SEM.
Figure 3—figure supplement 2
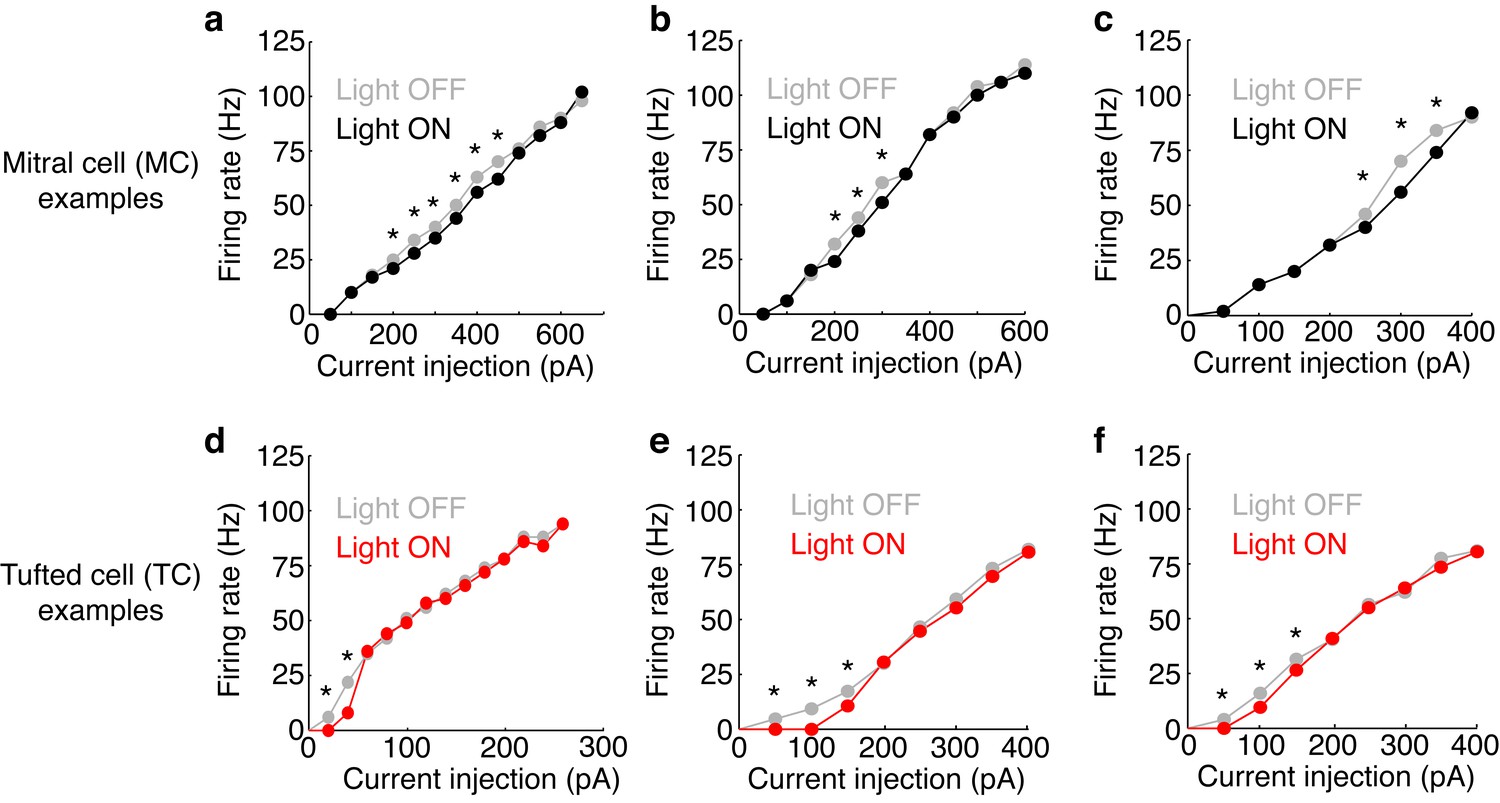
Examples of FI curves with and without photostimulation of the M72.
(a–c) Current intensity vs. firing rate (FI curve) is plotted in 3 MCs in light off (grey) and light on (black) conditions. (d–f) Same as a–c, only in 3 TCs. Asterisks indicate current intensities in which the firing rate during light on conditions is reduced by more than 10% compared to light off conditions – indicating significant effects of lateral inhibition.
Figure 3—figure supplement 3
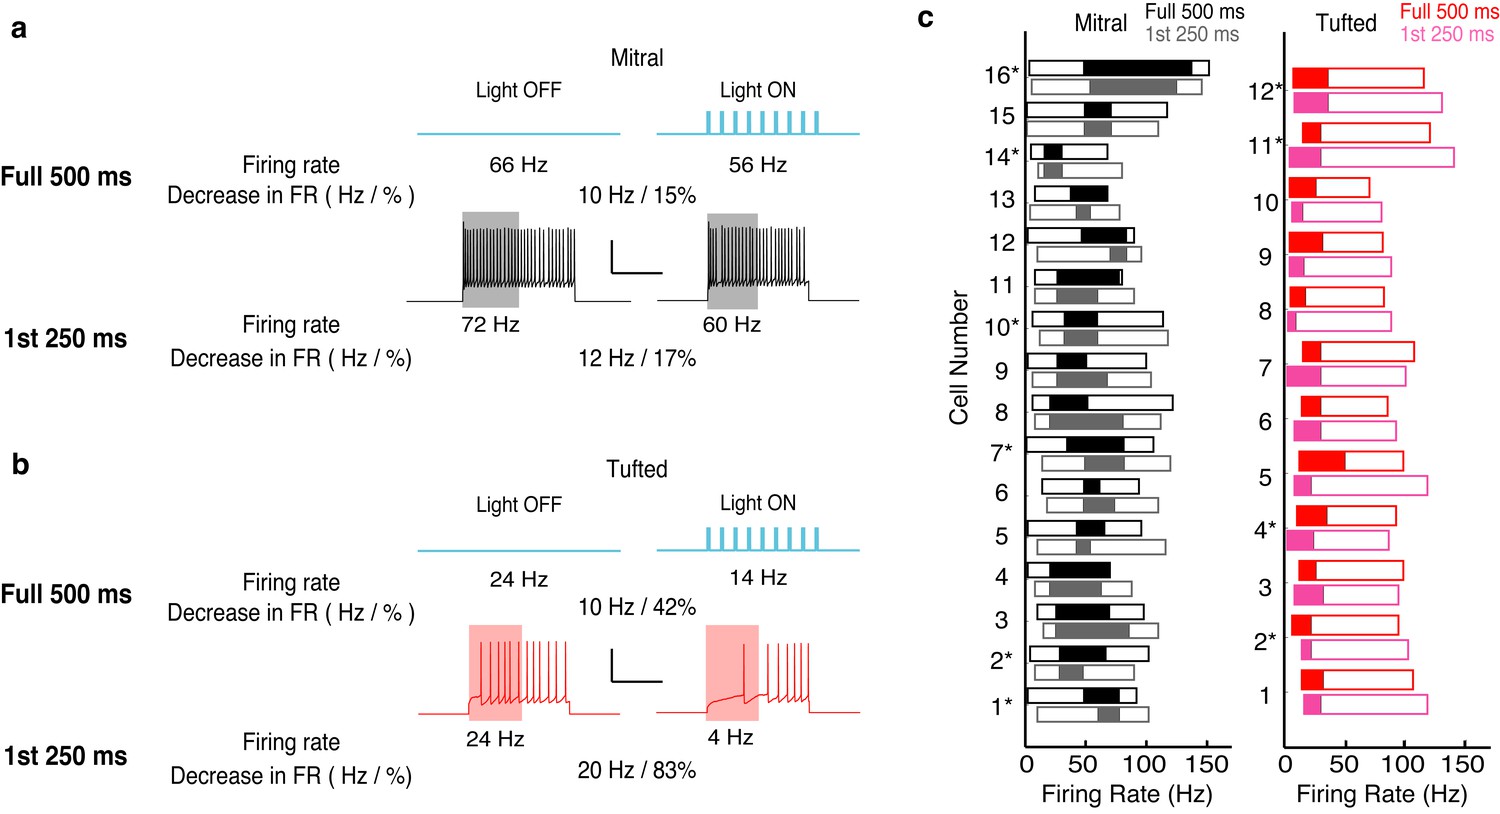
The effects of lateral inhibition are maintained on the physiologically relevant timescale of a single 4 Hz (250 ms) sniff.
We reanalyzed the data presented in Figure 3, and only calculated the effect of lateral inhibition for the first 250 ms of spiking. (a–b) Example of the analysis in one MC (a) and one TC (b). (c) The range of firing rates that are significantly influenced by lateral inhibition is plotted with respect to the firing rate in light off trials. Outer rectangle for each cell indicates the total range of firing rates evoked during light off trials. Inner (shaded) rectangle indicates the range of firing rates that are reduced during light on trials. Asterisks indicate cells that lack apical dendrites. Gray and pink data indicates analysis of the first 250 ms of the trial while black and red data indicate analysis from the full 500 ms of the trial.
Figure 4 with 2 supplements
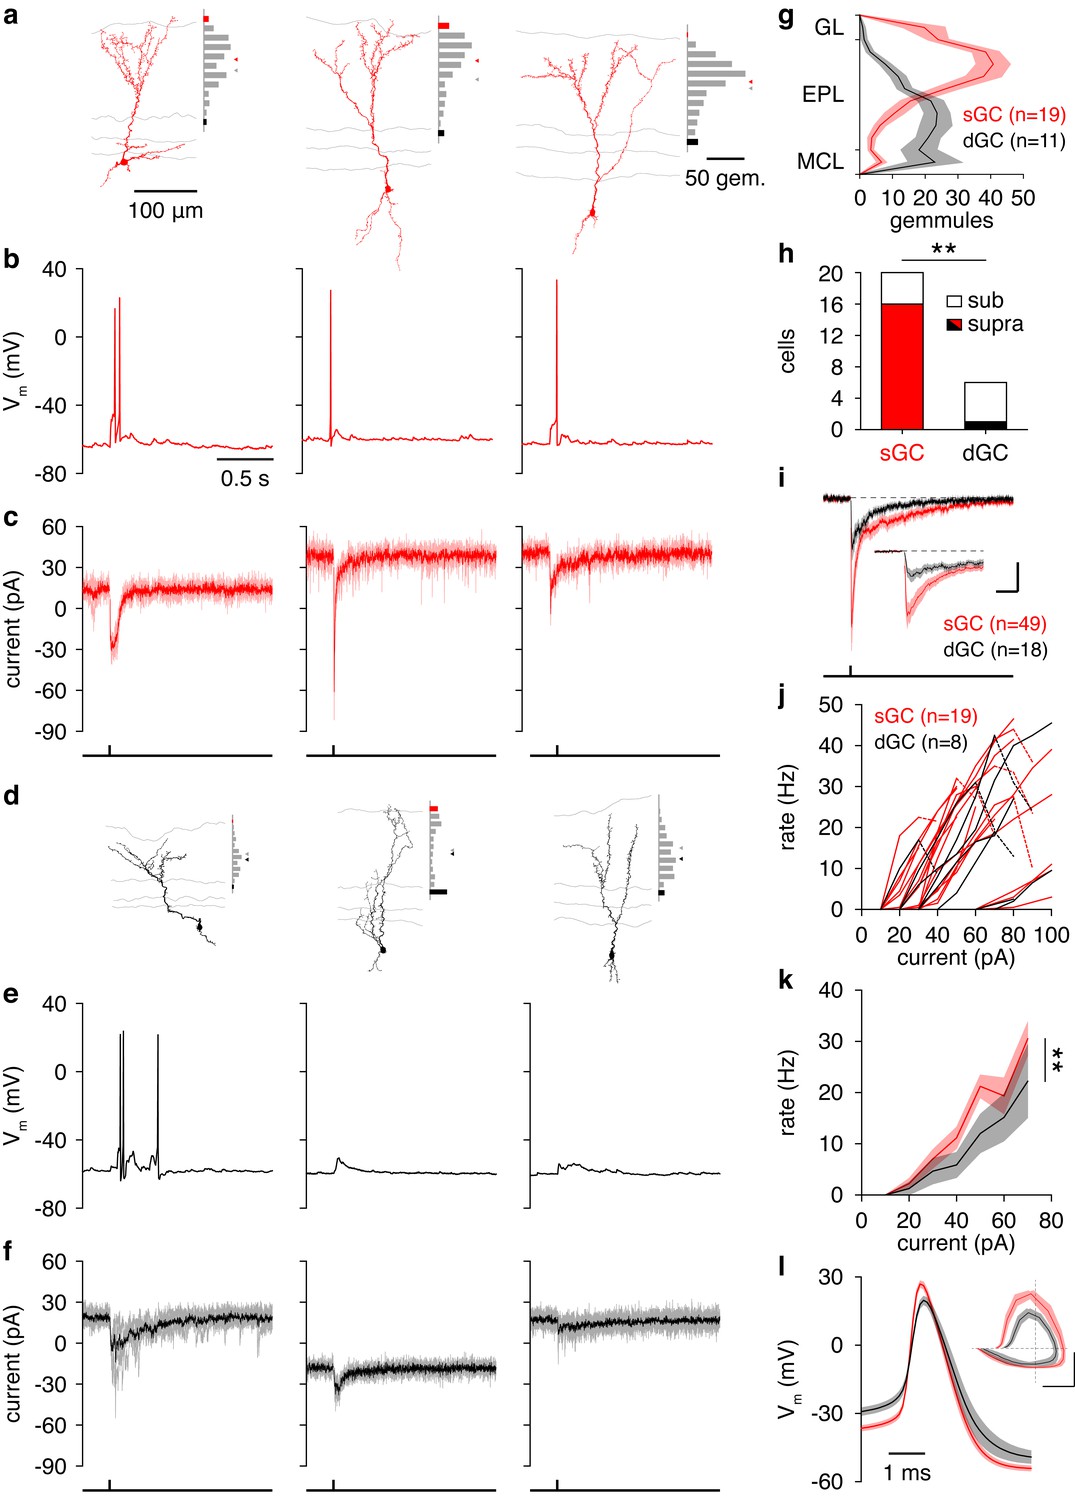
Synaptic and intrinsic differences regulate sGC vs. dGC recruitment following glomerular activation.
(a) Reconstructed morphologies and distribution of apical dendritic gemmules across the MCL (black bars), EPL (grey bars), and GL (red bars) of 3 representative sGCs. Grey/red ticks represents the midpoint of the EPL/mean of the cell’s gemmule distribution. (b,c) Spiking response (b) and synaptic input (c) of the 3 sGCs shown in a following activation of a single glomerulus superficial to the targeted GC. (d−f) Same as a-c for 3 representative dGCs. (g) Distribution of apical dendritic gemmules across reconstructed sGCs and dGCs. (h) A greater proportion of sGCs than dGCs fired in response to glomerular activation (Chi-square test, p = 4.2 × 10⁻³). (i) Excitatory input to sGCs exhibited larger peak currents (rank-sum test, p = 8.5 × 10⁻³) and charge transferred (rank-sum test, p = 0.046) than excitatory input to dGCs. No difference in excitation latency was observed (6.6 ± 11.6 vs. 9.7 ± 11.4 ms; rank-sum test, p = 0.12). Scalebar: 0.2 s/10 pA (inset: 40 ms/20 pA). (j,k) sGCs and dGCs showed significantly different firing rate-current (FI) curves in response to somatic step current injection (2-way ANOVA, p = 4.1 × 10⁻³). Individual (j) and mean (k) FI curves shown. Dashed lines show diminished firing due to depolarization block. (l) sGC action potentials exhibited more hyperpolarized thresholds (unpaired t test, p = 4.8 × 10⁻³), larger amplitudes (unpaired t test, p = 1.1 × 10⁻⁴), and faster rising slopes (unpaired t test, p = 2.9 × 10⁻⁴) than dGC action potentials. Inset: action potential phase plot. Scalebar: 30mV/100 mVms−1; dashed lines show origin. Shaded regions show mean ± SEM.
-
Figure 4—source data 1
Tables of GC properties.
- https://doi.org/10.7554/eLife.16039.012
Figure 4—figure supplement 1
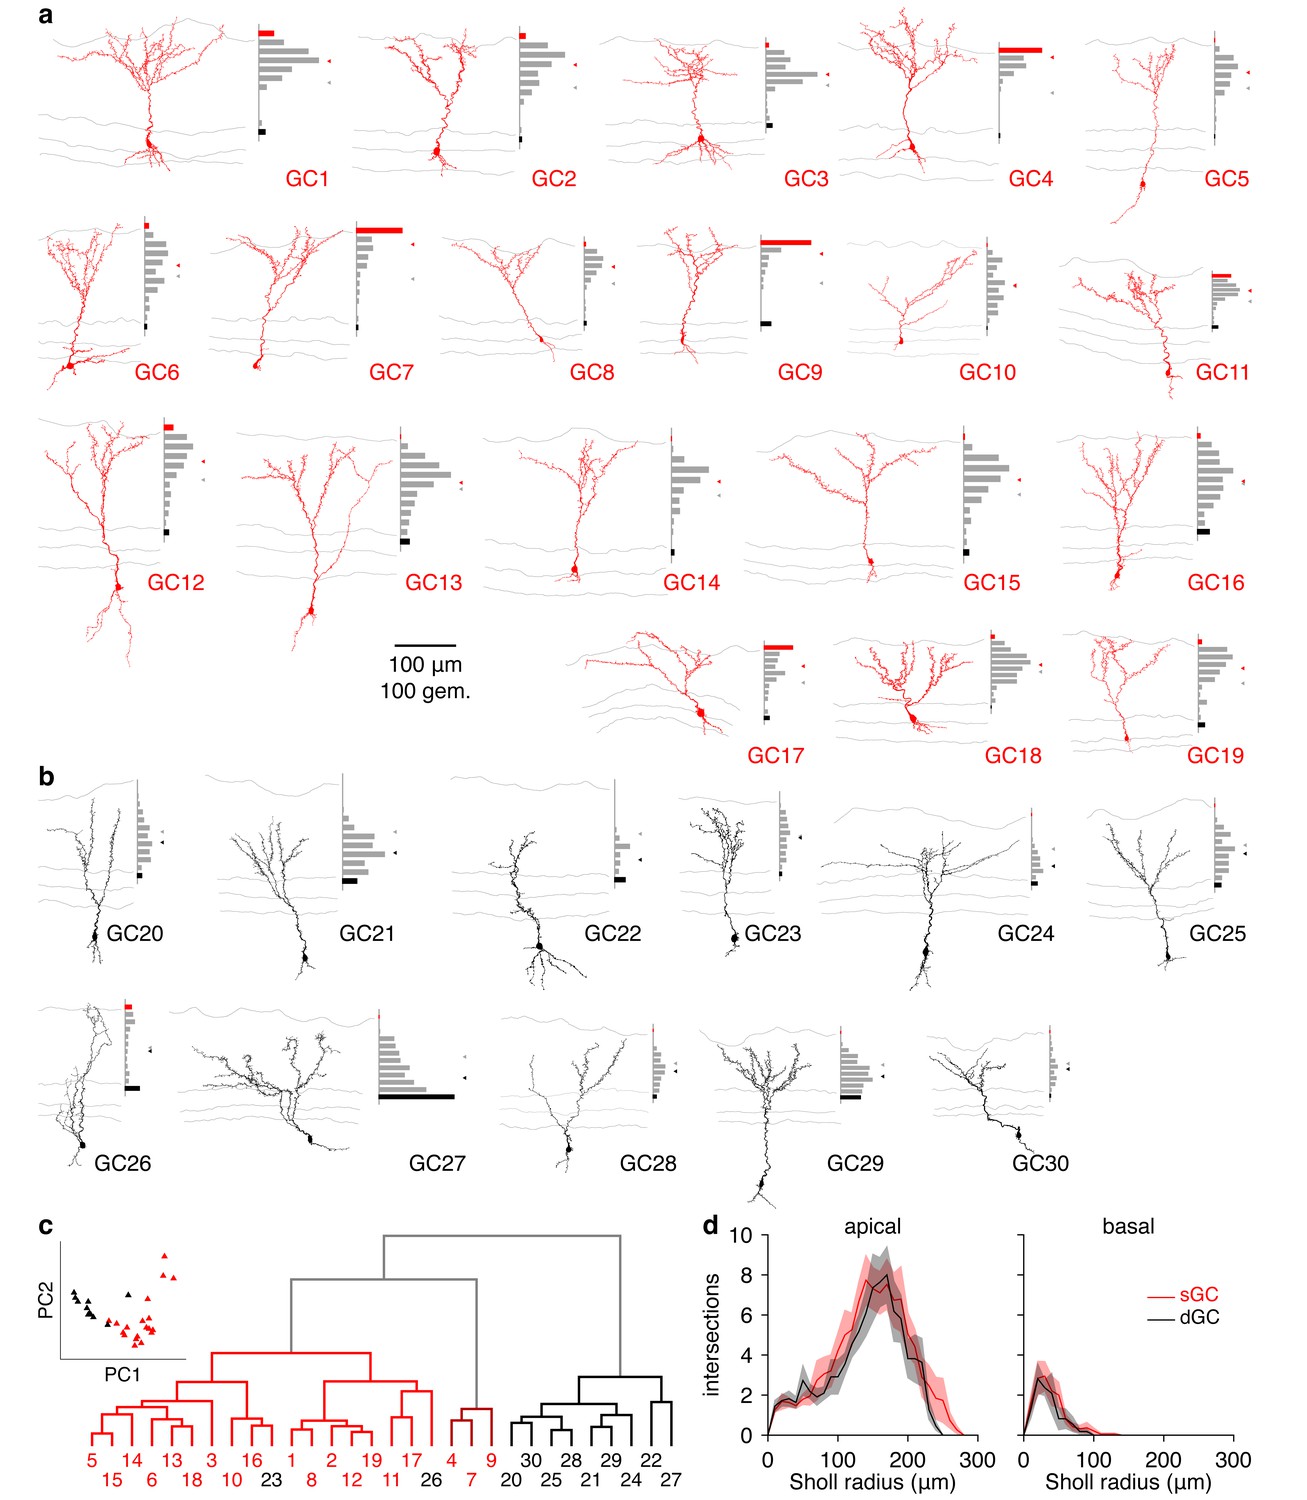
Morphological analysis of superficial and deep GCs.
(a) Reconstructed morphologies and distribution of apical dendritic gemmules across the MCL (black bars), EPL (grey bars), and GL (red bars) for 19 sGCs whose response to single glomerular activation was examined (see Figure 4). Grey/red ticks represents the midpoint of the EPL/mean of the cell’s gemmule distribution. (b) Same as a for 11 dGCs. (c) Dendrogram of clustered GC morphologies. Line colors correspond to the 3 significant clusters. Numbers correspond to the reconstructed morphologies shown in a,b, with number colors reflecting GC classification by visual inspection (sGC: red; dGC: black). Inset: projection of GCs across the first 2 principal components (74.0% of total variance) calculated from the normalized gemmule distributions. (d) Sholl analysis of GC dendritic morphologies. sGCs and dGCs exhibited no significant difference in apical (p = 0.21) or basal (p = 0.56) dendritic complexity (unpaired t-tests of area under Sholl curves). Shaded regions show mean ± SEM.
Figure 4—figure supplement 2
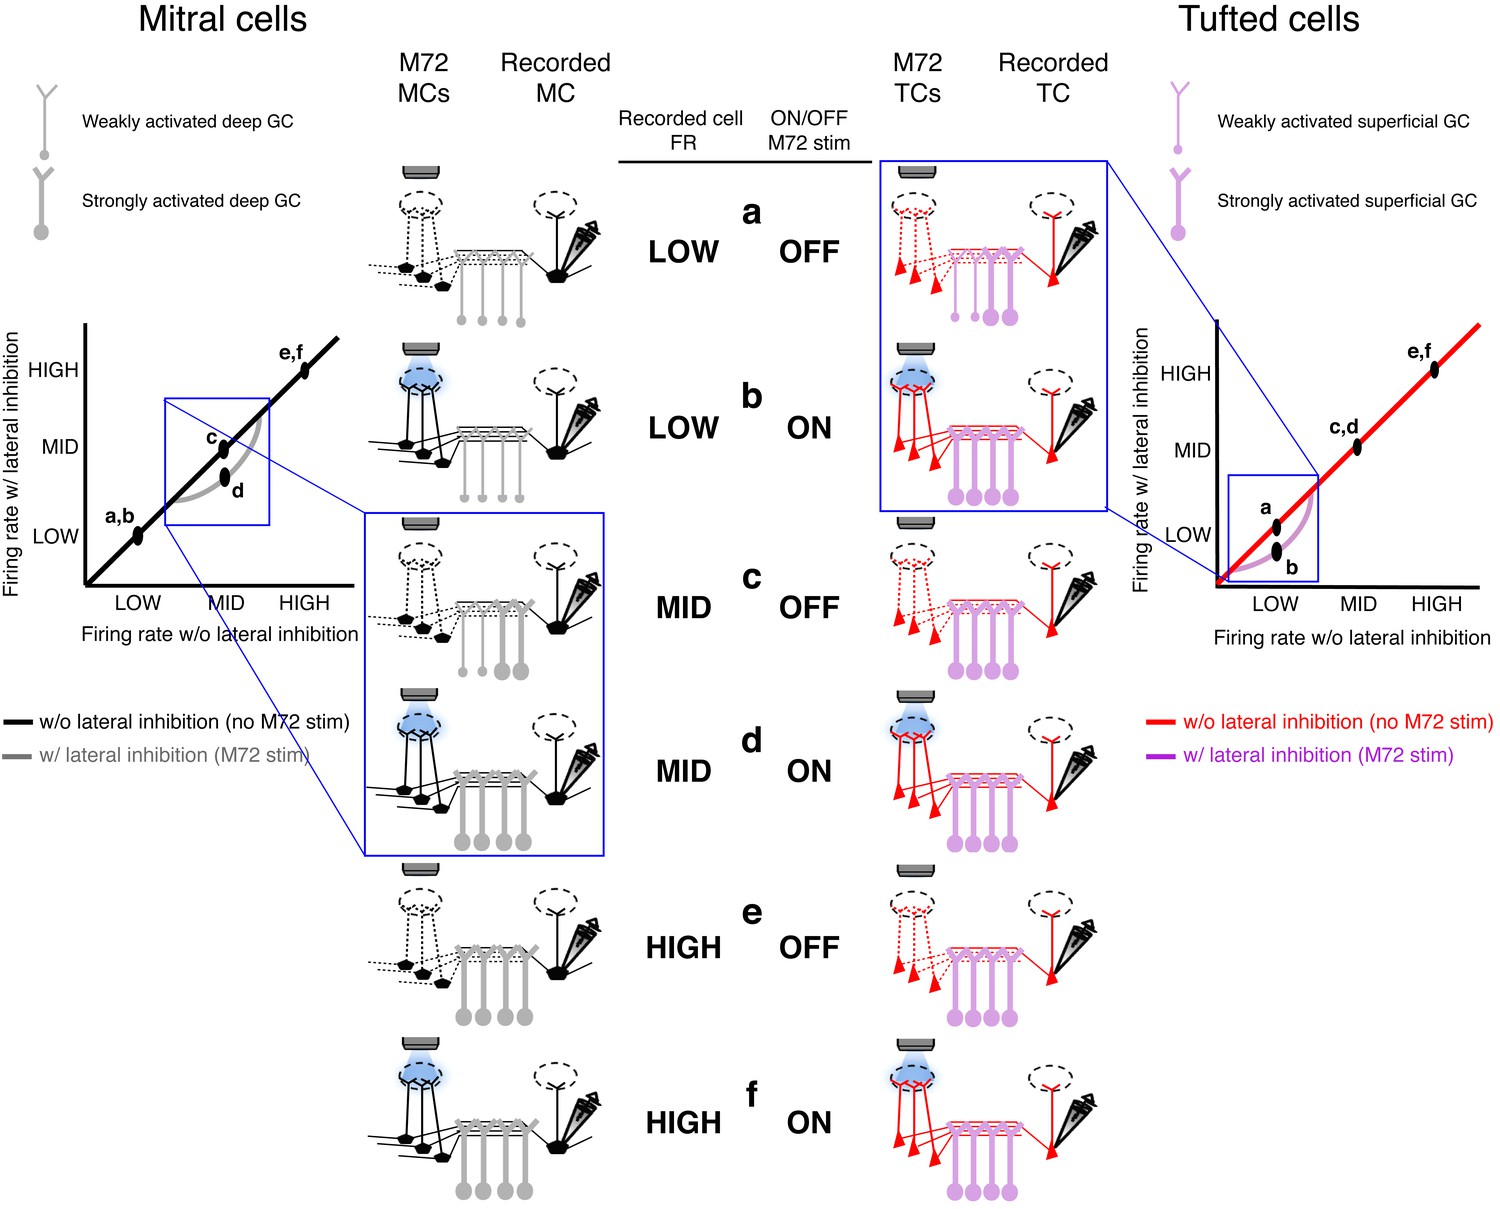
Proposed mechanism of activity-dependent lateral inhibition in mitral (MCs) and tufted cells (TCs).
(a–f) Schematics of the levels of activity in the olfactory bulb circuit consisting of M72 M/TCs (presynaptic M/TCs) and the recorded M/TCs (postsynaptic M/TCs) and the associated GCs. ACTIVITY-Dependent lateral inhibition in MCs (left panels): Low rates (a,b): When the recorded MC is unstimulated or firing at low rates, no additional GCs are recruited during the photostimulation of the M72 glomerulus, so no lateral inhibition is evoked. Intermediate rates (c,d): When the recorded MC is firing at intermediate firing rates, additional GCs are activated during the photostimulation of the M72 glomerulus and generate lateral inhibition.High rates (e,f): When the recorded MC is firing at high firing rates, all shared GCs are maximally recruited so that M72 photostimulation is unable to activate any additional GCs or generate additional lateral inhibition.Activity-dependent lateral inhibition in tcs (right panels):Low rates (a,b): When the recorded TC is firing at low firing rates, additional GCs are activated selectively during the photostimulation of the M72 glomerulus and generate lateral inhibition.INTERMEDIATE AND HIGH RATES (c,d,e,f): When the recorded TC is firing at intermediate or high firing rates, all shared GCs are maximally recruited so that M72 photostimulation is unable to activate any additional GCs or generate lateral inhibition.
Figure 5 with 1 supplement
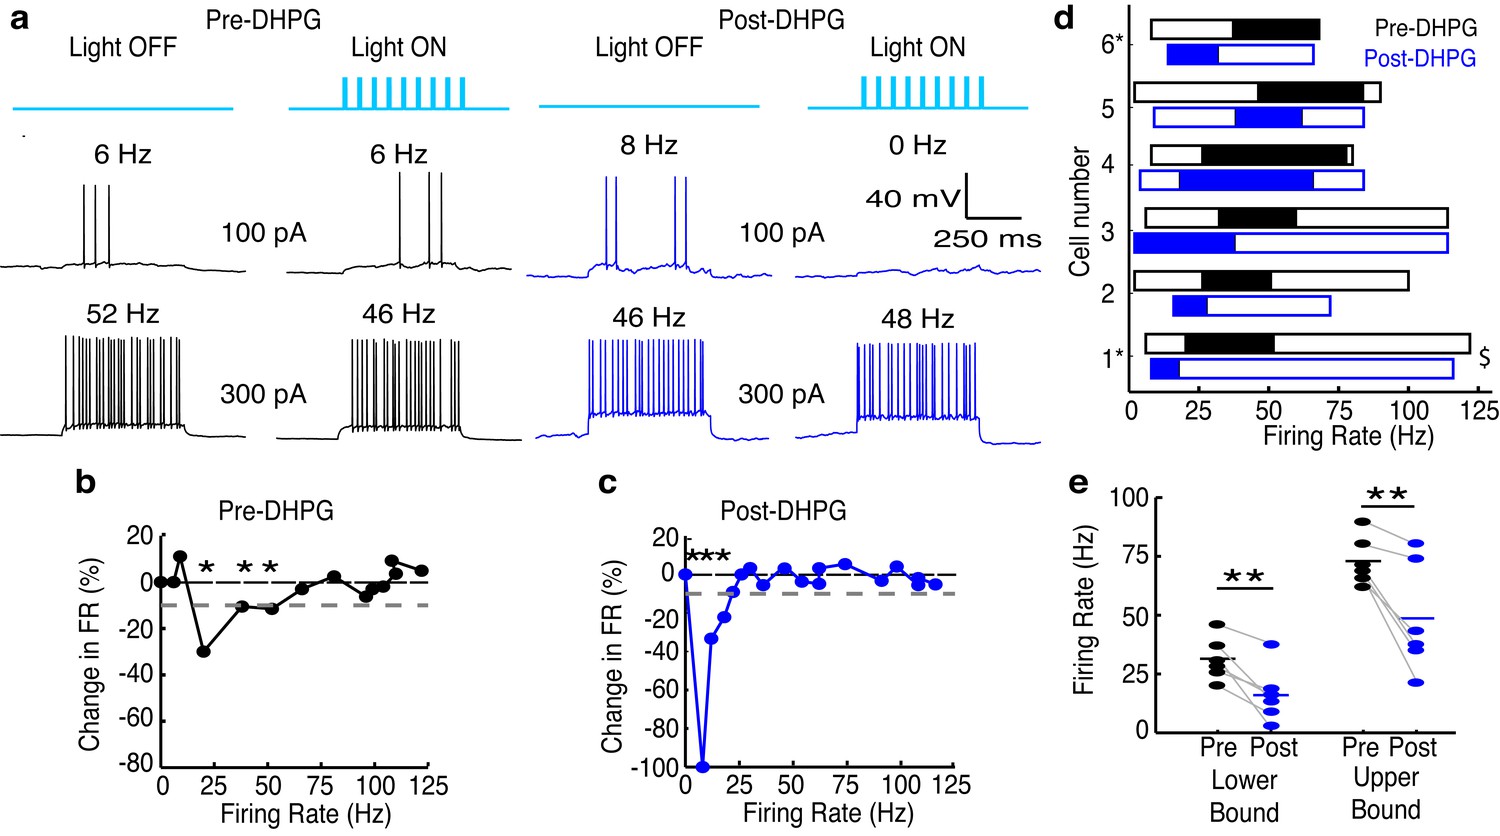
Increasing GC excitability shifts the effective activity range of lateral inhibition in MCs to lower frequencies.
(a–c) Example of lateral inhibition in one example MC before and after bath applying mGluR agonist, DHPG (10 µM). (a) Example voltage traces from one MC. LEFT: Before application of DHPG, intermediate firing rates are affected by lateral inhibition. RIGHT: After application of DHPG, low firing rates are affected. (b–c) The effect of lateral inhibition is illustrated by comparing the FI curves for the light off versus light on trials in a MC before (b) and after (c) applying DHPG. Plot of the percent decrease in firing rate vs. the firing rate of light off trials. Dotted line in b,c represents the 10% threshold used to indicate significant inhibition. Asterisks signify firing rates which are reduced by more than 10% in light on trials. (d) Summary of 6 cells recorded before (black) and after (blue) bath application of DHPG ($ - cell depicted in a–c). (e) The lower (LEFT, paired t-test, p = 0.009) and upper bound (RIGHT, paired t-test, p = 0.009) of the effective activity range of lateral inhibition are significantly lower after application of DHPG.
Figure 5—figure supplement 1
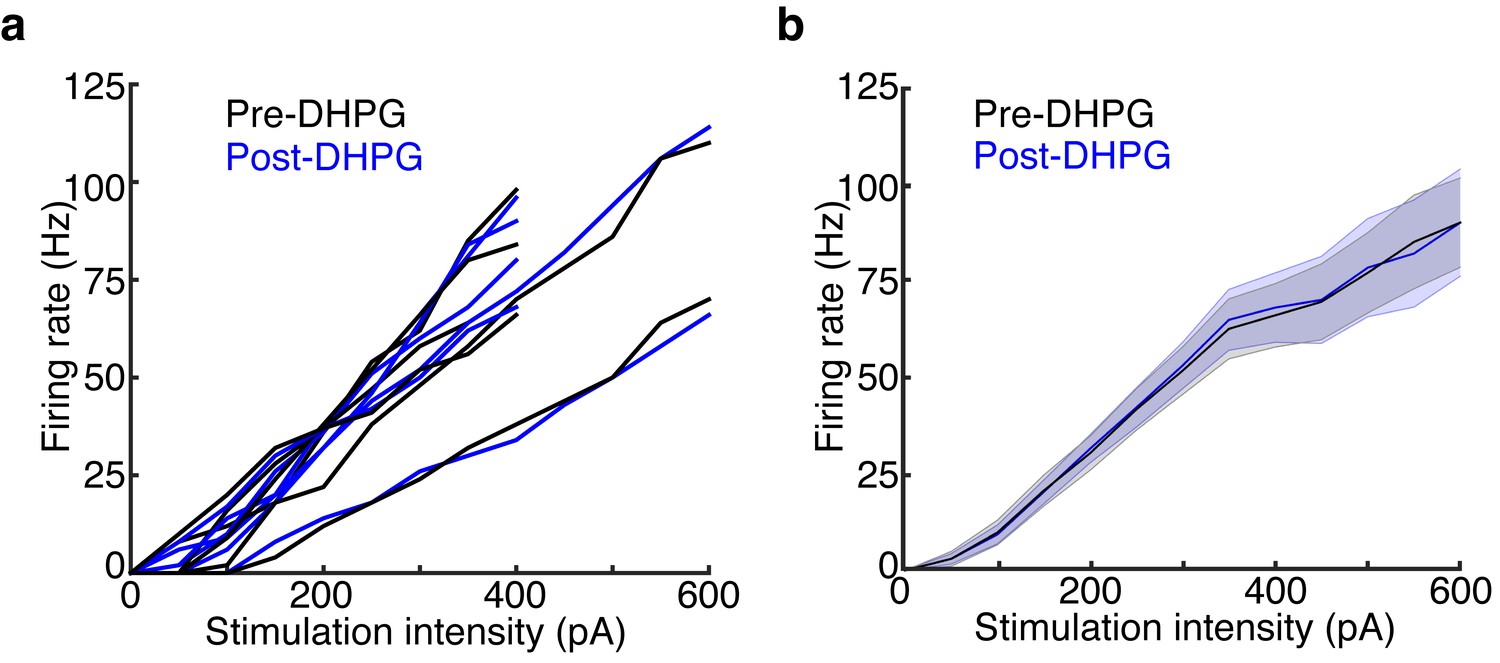
DHPG has no effect on MC excitability.
Data is taken from the LIGHT OFF trials in the MCs recorded in Figure 5 before and after adding 10 μM DHPG. (a) MC input-output curves in response to 500 ms somatic current injections of increasing amplitudes before and after bath application of DHPG (n = 6 MCs). (b) Average Pre-DHPG and Post-DHPG FI curves across 6 MCs indicate that DHPG has no effect on MC excitability (p = 0.77; 2-way ANOVA). Shaded regions show mean ± SEM.
Figure 6 with 3 supplements
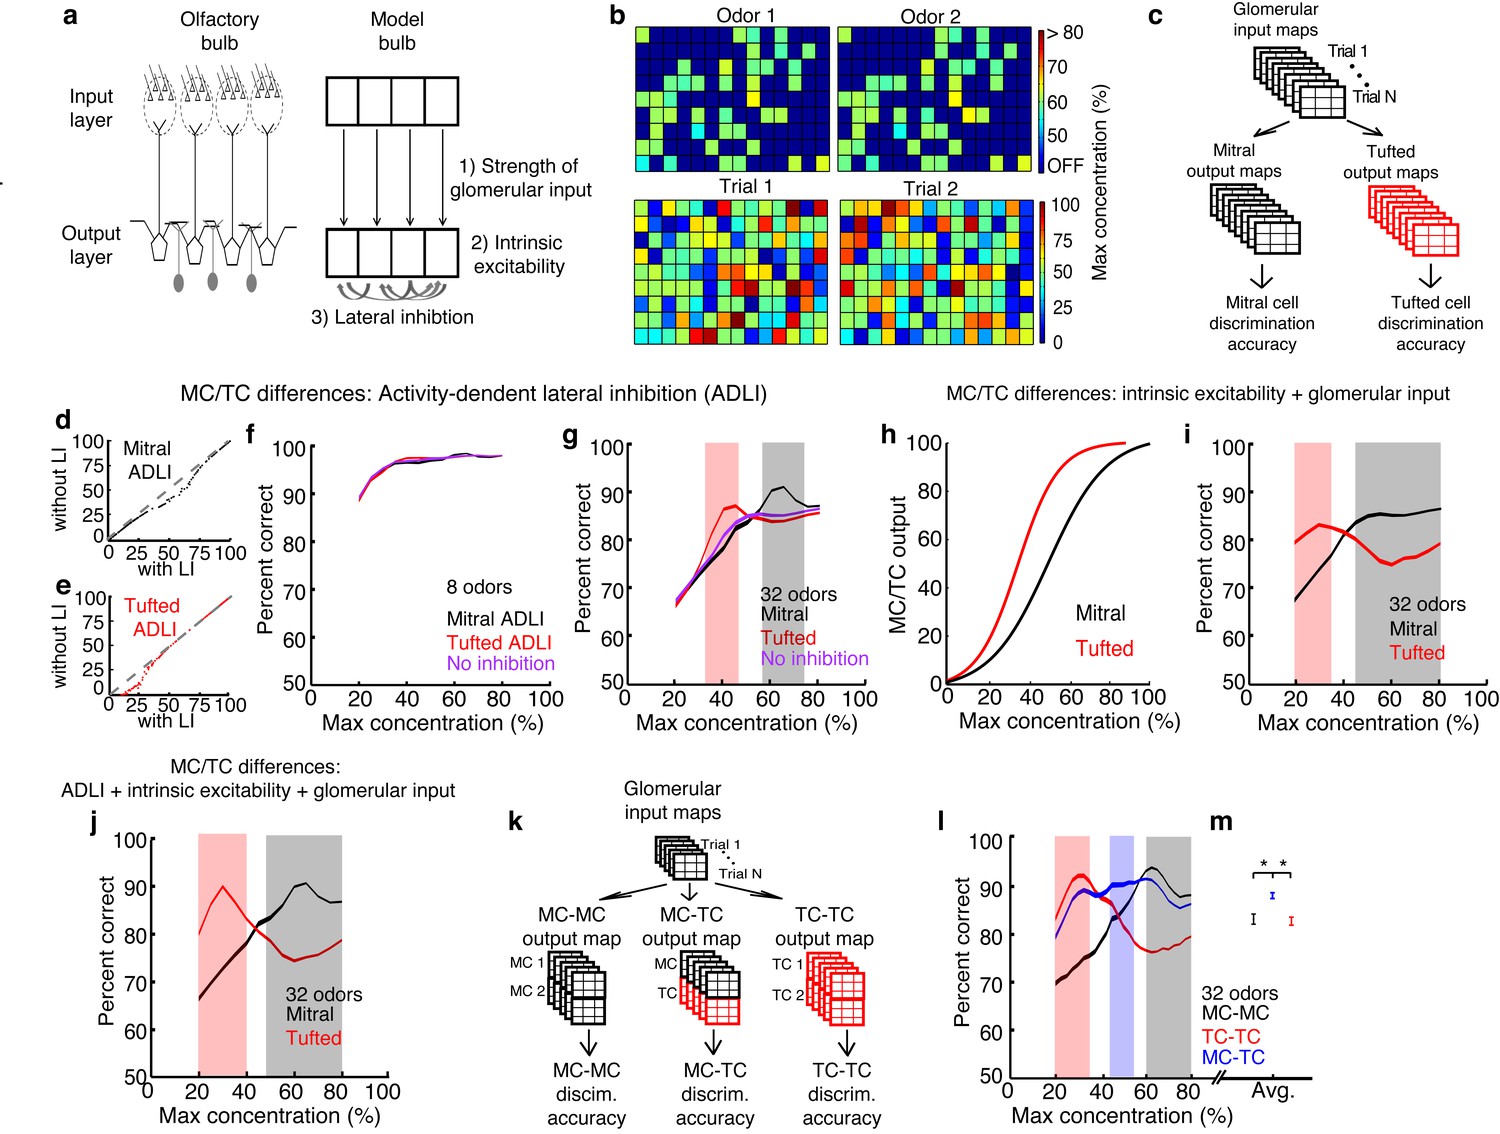
MCs and TCs discriminate between odors best in separate concentration ranges.
(a) Odors are defined as the pattern of activated glomeruli (i.e. pixels) in the model. Each glomerulus provides input to only 1 MC/TC. (b) TOP: Pattern of activated glomeruli for 2 odors. BOTTOM: Two separate presentations of Odor 1. (c) Outputs of MCs or TCs are used to train and test a linear classifier to predict which odors are presented on each trial. (d– e) Lateral inhibition differences between MCs and TCs are modeled using Gaussian distributions centered at different firing rates. Firing rates of MCs (d) and TCs (e) with and without lateral inhibition. (f–g) Discrimination accuracy of 8 (f) and 32 (g) odors in MCs (black), TCs (red) and a control population of neurons that lacked any inhibition (purple). Shaded areas represent concentration ranges where TCs (light red) or MCs (grey) discriminate significantly better (see Online methods). (h) Differences in the strength of excitatory inputs and intrinsic excitability between MCs and TCs are modeled using 2 sigmoids to translate glomerular inputs into MC/TC outputs. (i) Discrimination accuracy of 32 odors in MCs (black) and TCs (red) that differ in excitability, strength of glomerular input. (j) Discrimination accuracy of 32 odors in MCs (black) and TCs (red) that differ in excitability, strength of glomerular input and ADLI. (k) Overview of simulations comparing 3 separate output neuron configurations: 2 MCs per glomerulus, 2 TCs per glomerulus or 1 MC and 1TC per glomerulus. (l) Discrimination accuracy of 32 odors for MC-MC (black), TC-TC (red) or MC-TC (blue) networks across a range of concentrations. (m) Average discrimination accuracy across all concentrations plotted in l (*p<1e-4). Width of plots in panels f,g,i,j,I reflect the s.e.m.
Figure 6—figure supplement 1
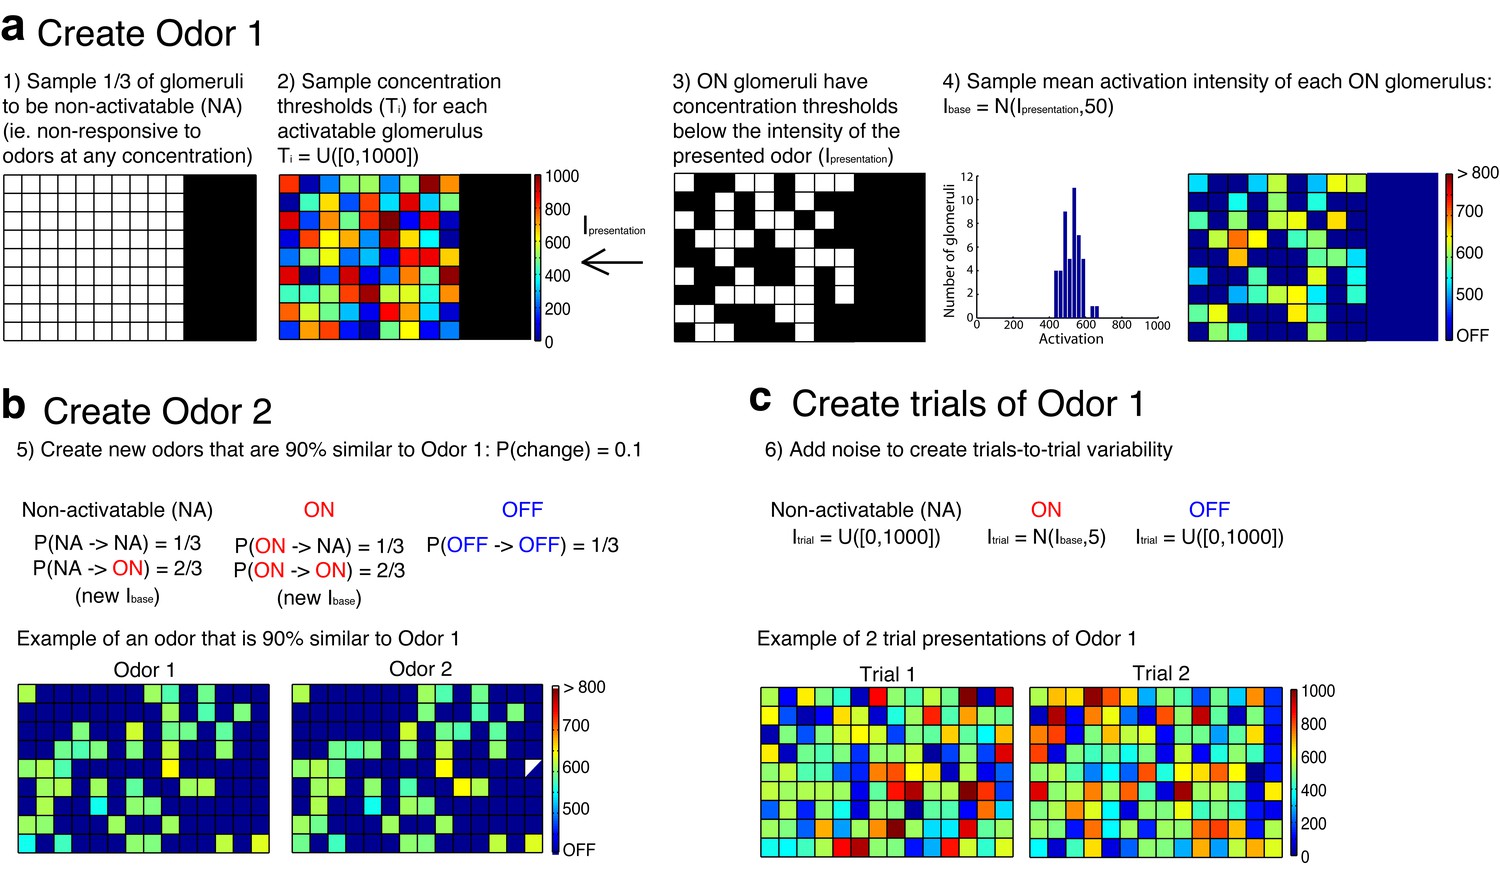
Procedure used to create the odors that served as inputs to simulated mitral and tufted cell networks.
(a) The first step in the procedure is the creation of a single odor at a set concentration using the rules outlined in a. The odor is defined by a random set of pixels (ON pixels) that will be reliably activated at a set concentration on each presentation of the odor. Pixels that are not ON for a particular odor are either non-activatable (ie not responsive to odors at any concentration) or OFF pixels. This procedure ensures that differences in odor concentration reflect changes in both the number and intensity of activated glomeruli. (b) Once a single odor is defined, the rest of the odors in the panel can be created using the rules in b. This procedure creates an arbitrary number of odors that are 90% similar to the first odor. Additionally, we ensure that no two odors are identical. (c) Lastly the OFF and non-activatable (NA) pixels are sampled randomly from the uniform distribution each time the odor is presented to the MC or TC network in order to add trial-to-trial variability and to mimic the variability in background odor each time an odor is experienced.
Figure 6—figure supplement 2
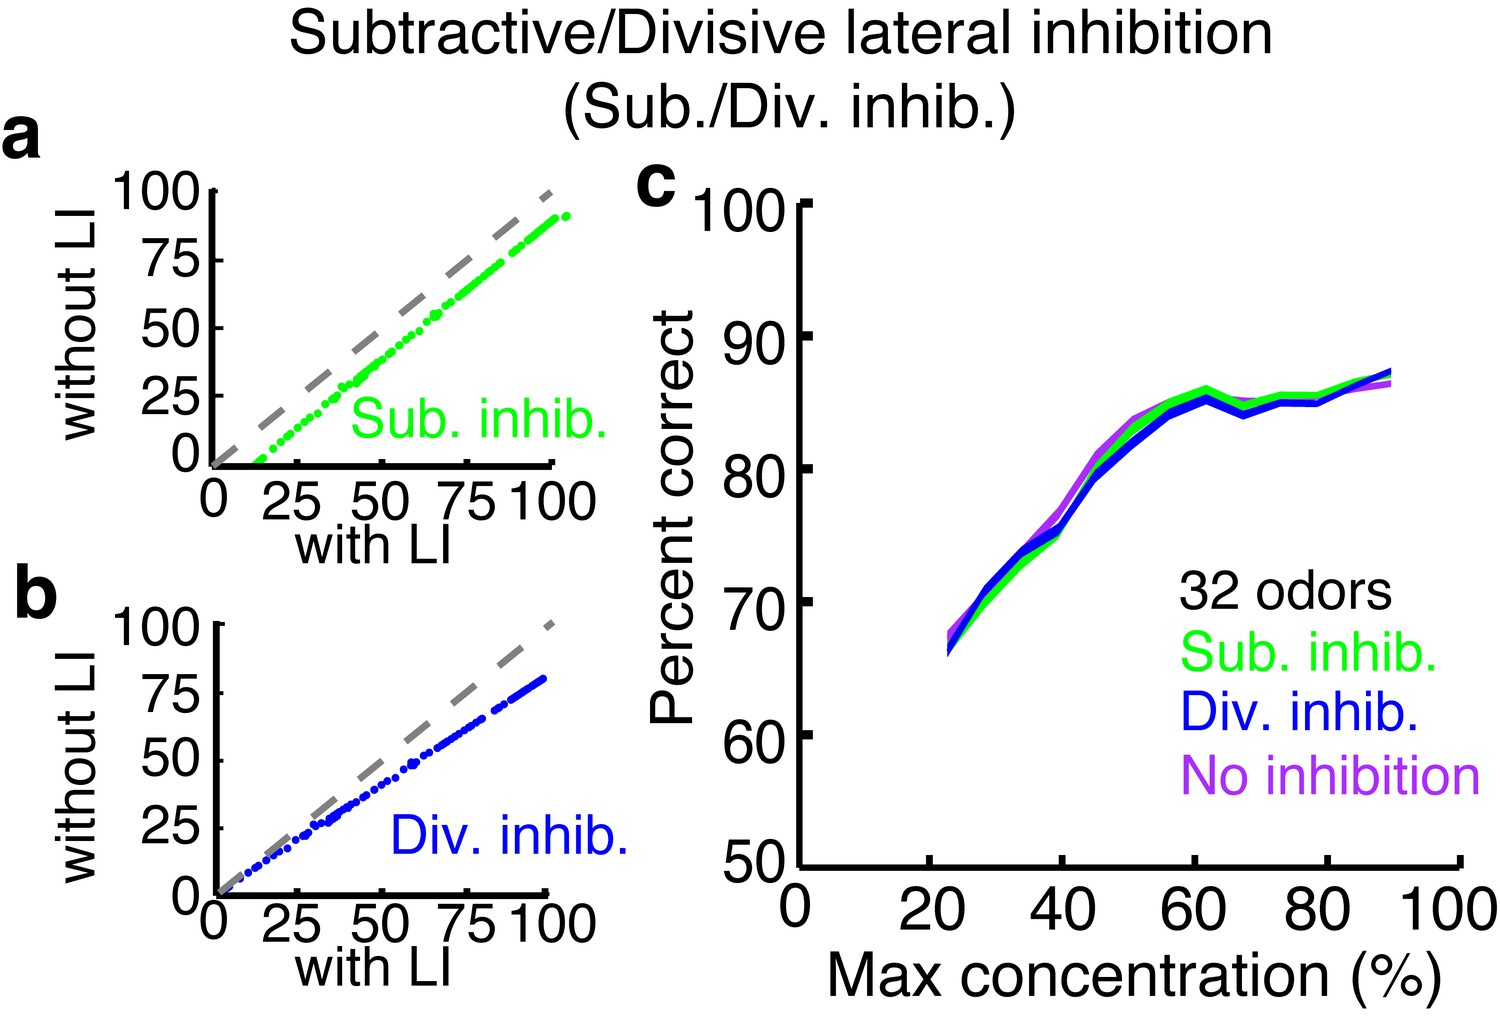
Subtractive or divisive lateral inhibition does not improve discrimination accuracy.
(a–b) Neural firing rates with and without subtractive (a) or divisive (b) lateral inhibition. (c) Discrimination accuracy of 32 odors in neurons with subtractive (green), divisive (blue) or no inhibition (purple). Width of plots in c reflect s.e.m.
Figure 6—figure supplement 3
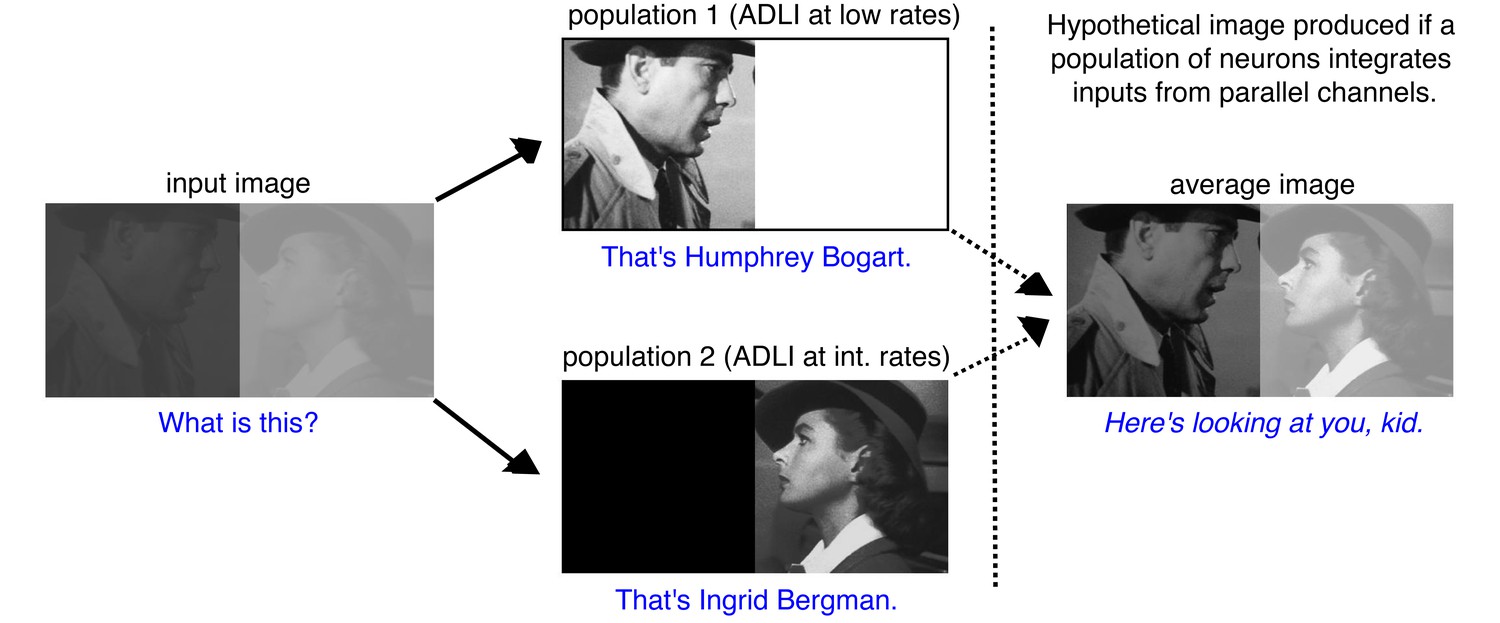
Visual processing example of how the multiple parallel neuron populations can simultaneously enhance the contrast of high and low intensity images.
Digital image before (input image, left) and after processing by two separate populations. One population employs ADLI at low rates (top) and enhances contrast at low intensities. The second employs ADLI at intermediate rates (bottom) and enhances contrast at high intensities. Each image encodes distinct aspects of the input image (who is in the image?), but the overall context of the image remains ambiguous (who is each character talking to?). If a downstream population of neurons integrates inputs from both populations and performs a simple averaging computation (right), then the full context of the image can be perceived (This is a famous scene from the movie, Casablanca). Stills from Casablanca, 1942 Warner Brothers. All rights reserved.
© 1942, Warner Brothers, All Rights Reserved. Figure 6—figure supplement 3 photo (from the film Casablanca) is reproduced with permission from Warner Brothers
Download links
A two-part list of links to download the article, or parts of the article, in various formats.
Downloads (link to download the article as PDF)
Open citations (links to open the citations from this article in various online reference manager services)
Cite this article (links to download the citations from this article in formats compatible with various reference manager tools)
Distinct lateral inhibitory circuits drive parallel processing of sensory information in the mammalian olfactory bulb
eLife 5:e16039.
https://doi.org/10.7554/eLife.16039


