Reorganisation of Hoxd regulatory landscapes during the evolution of a snake-like body plan
- University of Geneva, Switzerland
- Instituto Gulbenkian de Ciência, Portugal
- Ecole Polytechnique Fédérale de Lausanne, Switzerland
Figures
Figure 1 with 2 supplements
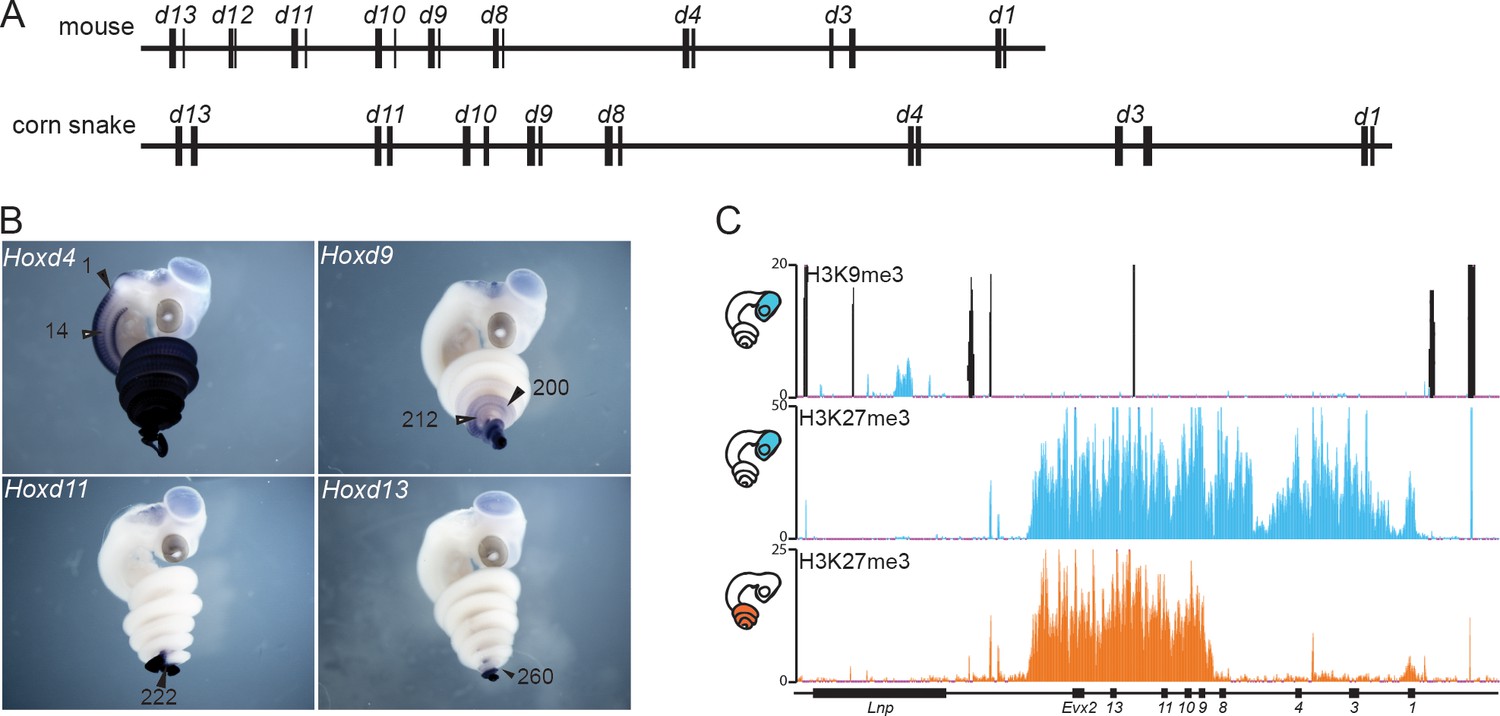
The snake HoxD cluster.
(A) Schematic representation at the same scale of the mouse (top) and corn snake (bottom) HoxD clusters. Exons are represented by black rectangles. (B) Whole-mount in situ hybridization of corn snake embryos at 8.5 dpo (days post oviposition) showing expression of Hoxd4, Hoxd9, Hoxd11 and Hoxd13. Numbers define the somite number where the most anterior levels of expression are detected. The black arrowhead points to the neural tube whereas the white arrowhead shows mesoderm. A single black arrowhead indicates that the neural and mesodermal boundaries coincided. (C) Detection of both H3K9me3 and H3K27me3 histone modifications by ChIP-seq in corn snake brain (top and middle tracks) and of H3K27me3 marks in the posterior trunk of 0.5–2.5 dpo snake embryos (bottom track). Blue is for brain and orange for posterior trunk, as schematized on the left. The black peaks in the top track represent artifactual signals also present in the input chromatin mapping.
Figure 1—figure supplement 1
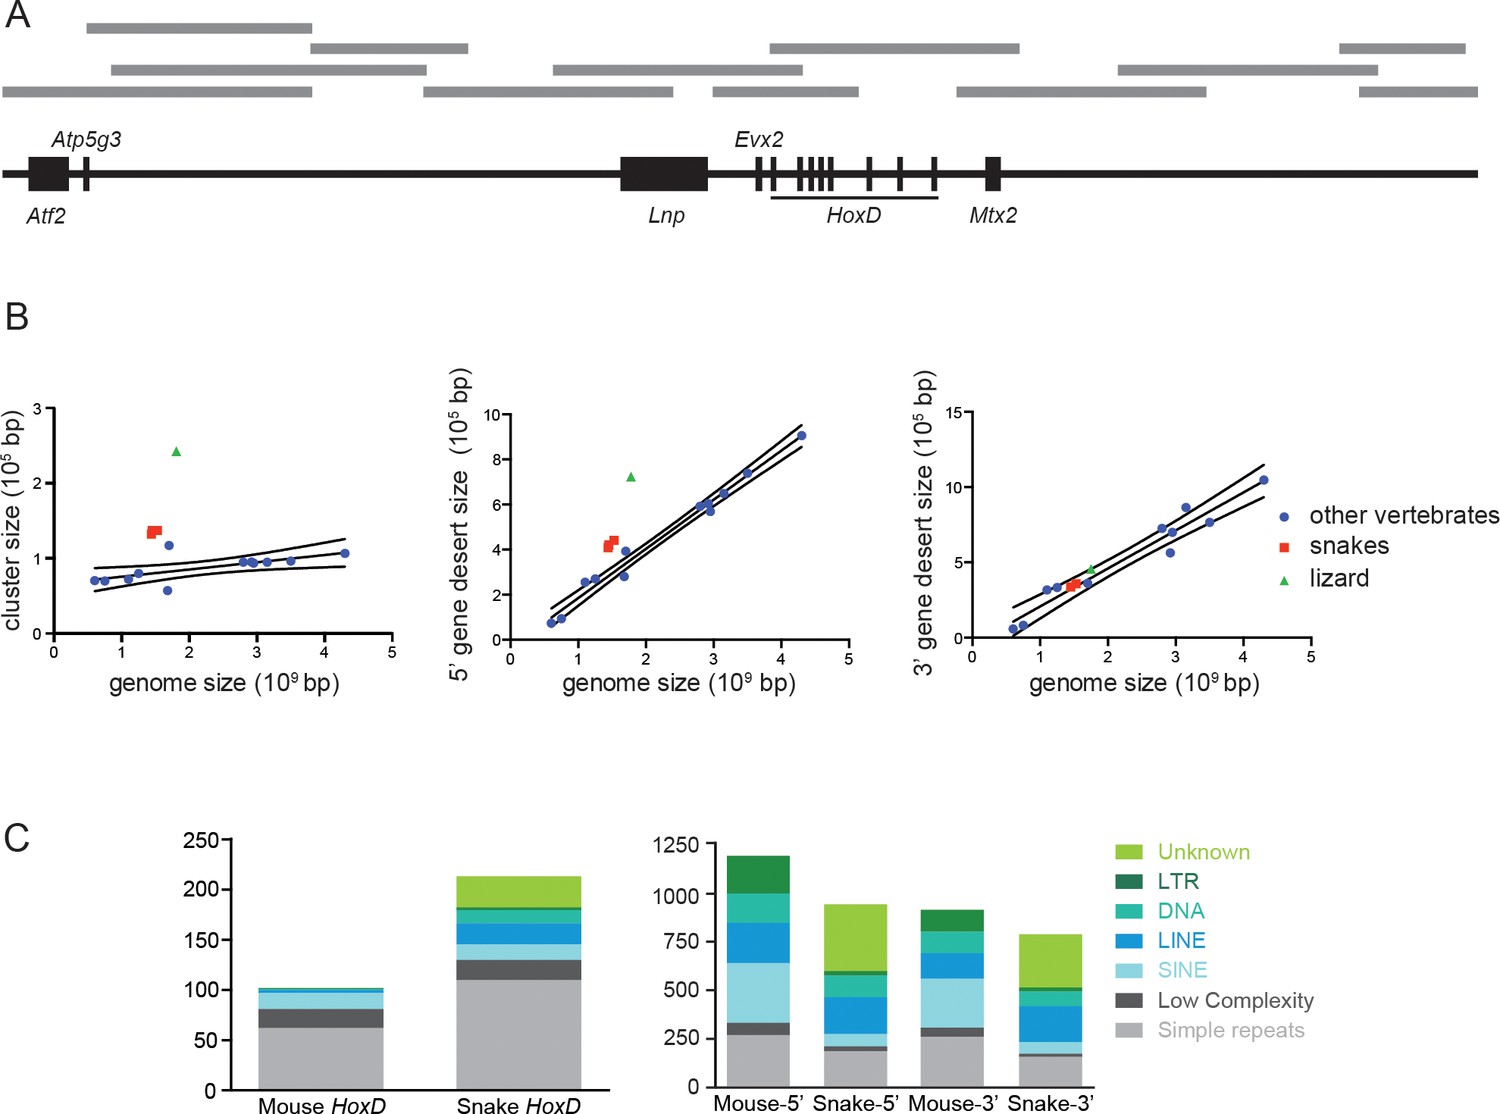
Corn snake HoxD cluster and surrounding regulatory landscapes.
(A) Description of the BACs (grey lines) used for sequencing the snake HoxD cluster and the surrounding regulatory gene deserts. The scheme reflects the relative genomic distances between genes (black boxes). (B) Comparison between the sizes of the HoxD cluster (left), the 5’-located gene desert (centromeric in the mouse) and the 3’-located gene desert (telomeric in the mouse) relative to genome size. The species used are mouse, human, cow, dog, horse, opossum, chicken, zebra finch, lizard, corn snake, cobra, python, frog, zebrafish, stickleback and medaka. Snakes are shown in red and lizard in green, whereas other vertebrates are in blue. The linear regression line and 95% confidence band were calculated excluding the snakes and lizard data. (C) Graphs representing the repeat content in the snake and mouse HoxD clusters as well as within the flanking gene deserts. The various types of repeats are shown on the right with a colour code.
Figure 1—figure supplement 2
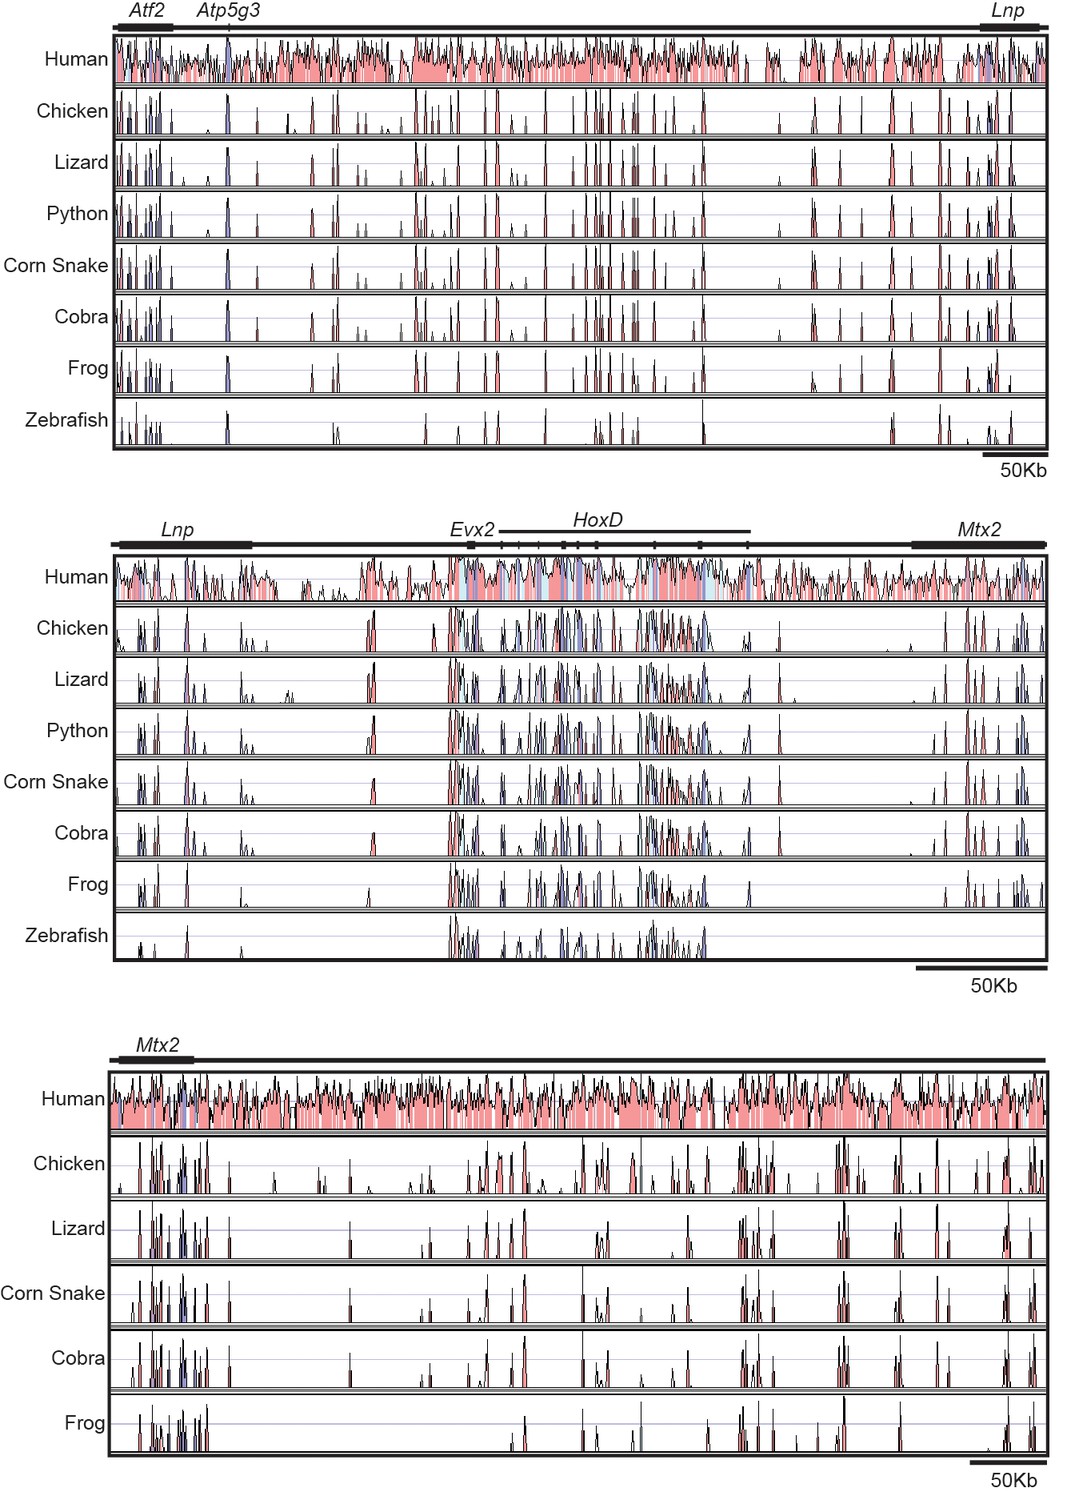
Sequence conservation at the HoxD locus.
The conservation plots are shown using mouse sequences and annotations as a reference, and human, chicken, lizard, python, corn snake, cobra, frog and zebrafish sequences for comparison. Conservation is shown only when above 50% and coloured peaks represent a level of conservation higher than 75%. The 5’ located flanking gene desert is on the top and the 3’ located gene desert is on the bottom. The HoxD cluster region is in the middle. The zebrafish and python sequences were not used in the bottom plot due to the poor conservation, or lack thereof-, of a continuous sequence, respectively. Purple is for conservation of exons, light blue for UTRs and pink for non-coding regions.
Figure 2 with 3 supplements
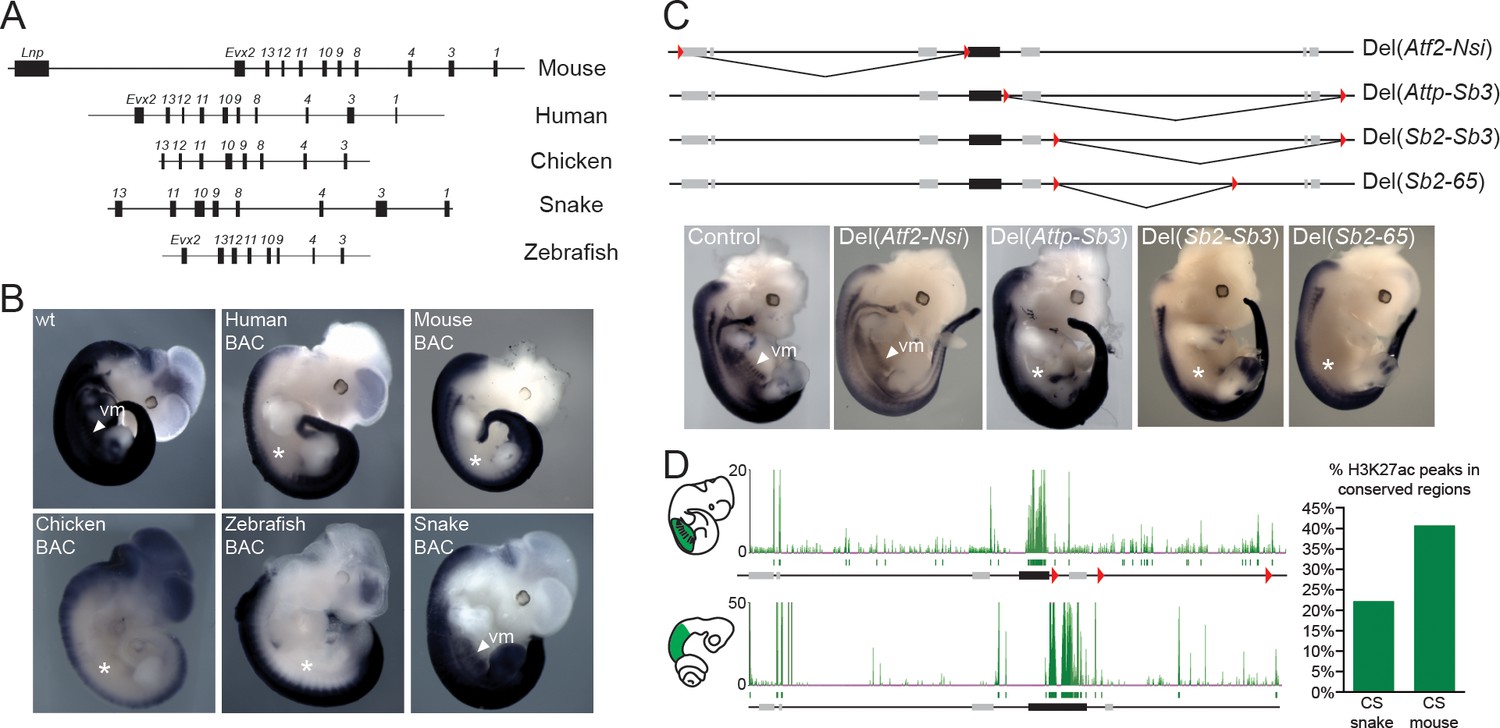
Location of Hoxd trunk mesodermal enhancers.
(A) Schematic representation, at the same scale, of the mouse, human, chicken, corn snake and zebrafish BAC clones used to generate the transgenic mouse lines. Exons are represented by black rectangles. (B) Lateral view of whole-mount in situ hybridizations of Hoxd4 using E11.5 mouse embryos transgenic either for the mouse, the human, the chicken, the zebrafish or the corn snake BAC. (C) Schemes illustrating the various deletion stocks (top) and whole-mount in situ hybridization of E12.5 mouse embryos with the Hoxd4 probe in corresponding deleted mutant embryos (bottom). LoxP sites are indicated as red triangles, the HoxD cluster is represented by a black rectangle and other genes are shown with grey rectangles. vm indicates expression in the ventral mesoderm and white asterisks represent the absence of expression in this tissue. (D) ChIP-seq analysis over the mouse and snake HoxD loci of H3K27acetylation using anterior trunk mesodermal tissue of E11.5 mouse embryos and 5.5 dpo corn snake embryos (left). Green boxes under each ChIP-seq mapping represent peaks called by the MACS algorithm (Zhang et al., 2008). On the right, a graphical representation is shown of the percentage of conserved regions between the mouse and corn snake HoxD loci, which are enriched for H3K27ac in each species.
Figure 2—figure supplement 1
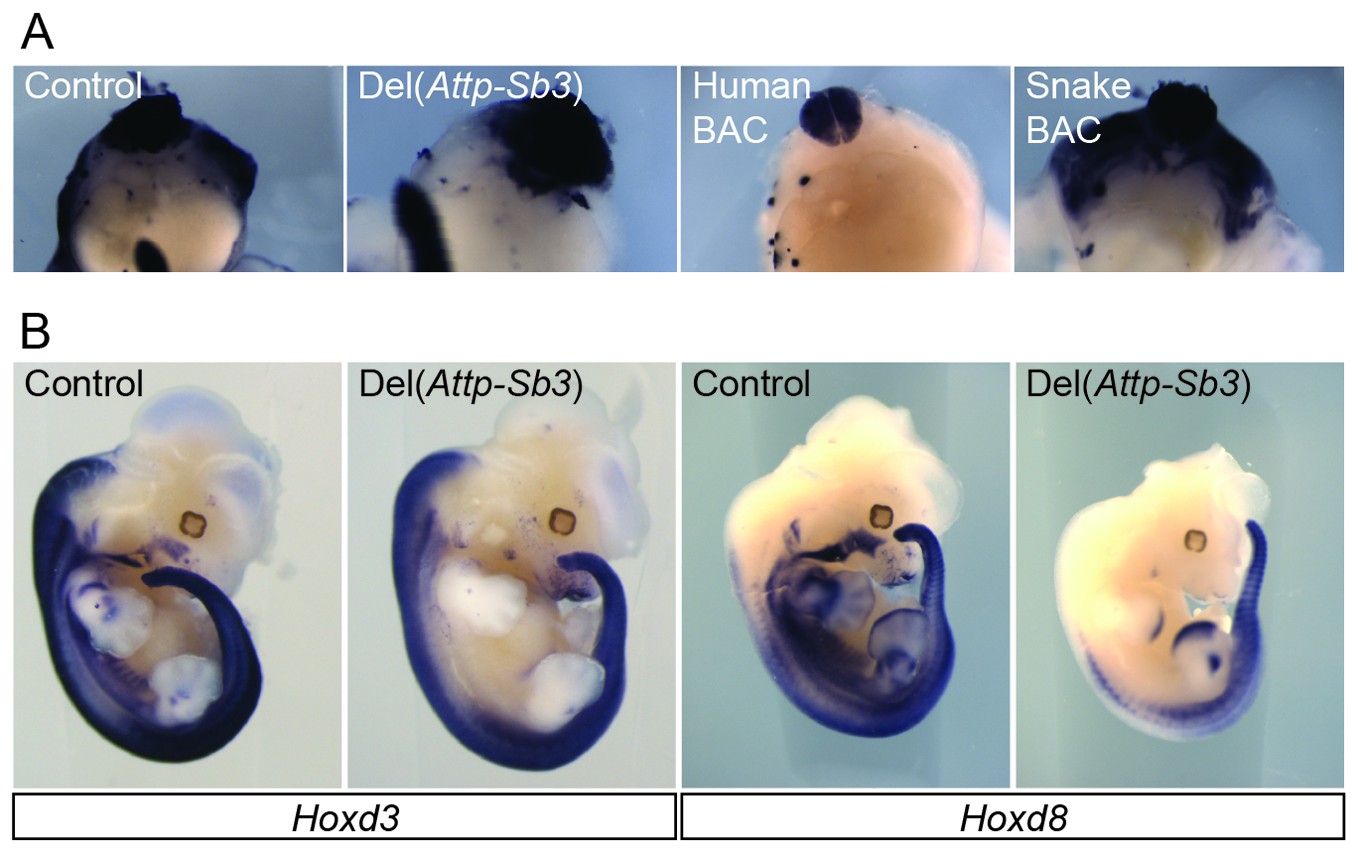
Detailed analysis of the mesodermal enhancer activity in the 3’ gene desert.
(A) Whole-mount in situ hybridization of Hoxd4 in E12.5 bisected embryos in the control, the Del(Attp-Sb3) line and the Human and Snake BAC lines. (B) Expression of Hoxd3 and Hoxd8 in E12.5 Del(Attp-Sb3) embryos and respective controls.
Figure 2—figure supplement 2
Regulatory potential of the mouse 3’-located, telomeric gene desert in trunk mesoderm.
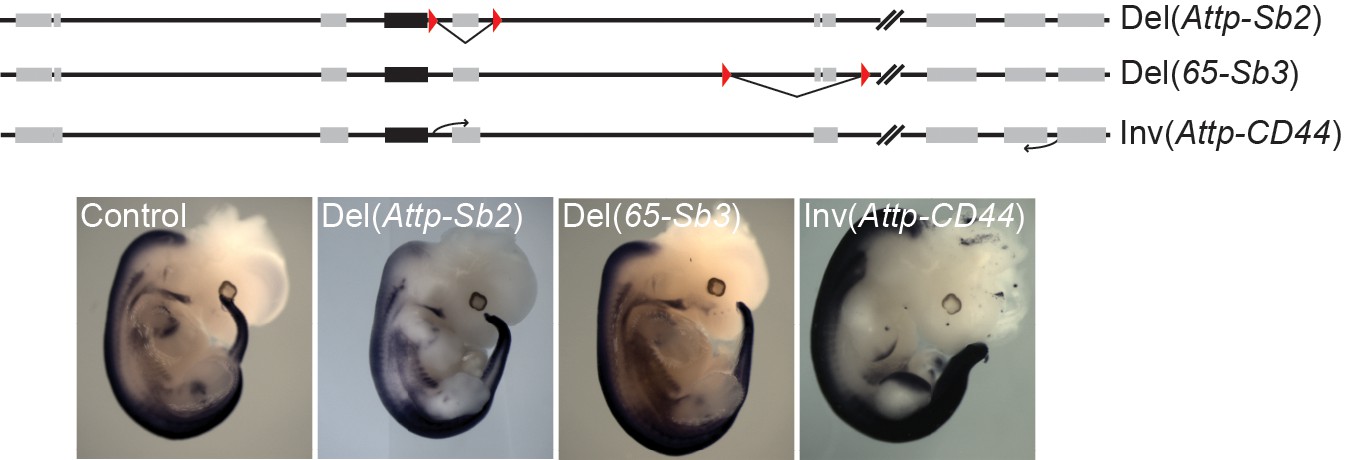
A schematic of the two small (Del(Attp-Sb2) and Del(65-Sb3) deletions and of the (Inv(Attp-CD44) inversion, which takes the telomeric desert away from the HoxD cluster. The expression of Hoxd4 in these mutant lines at E12.5 is depicted below. The LoxP sites are represented by red triangles. The black boxes indicate the position of the HoxD cluster and grey boxes represent other nearby located genes.
Figure 2—figure supplement 3
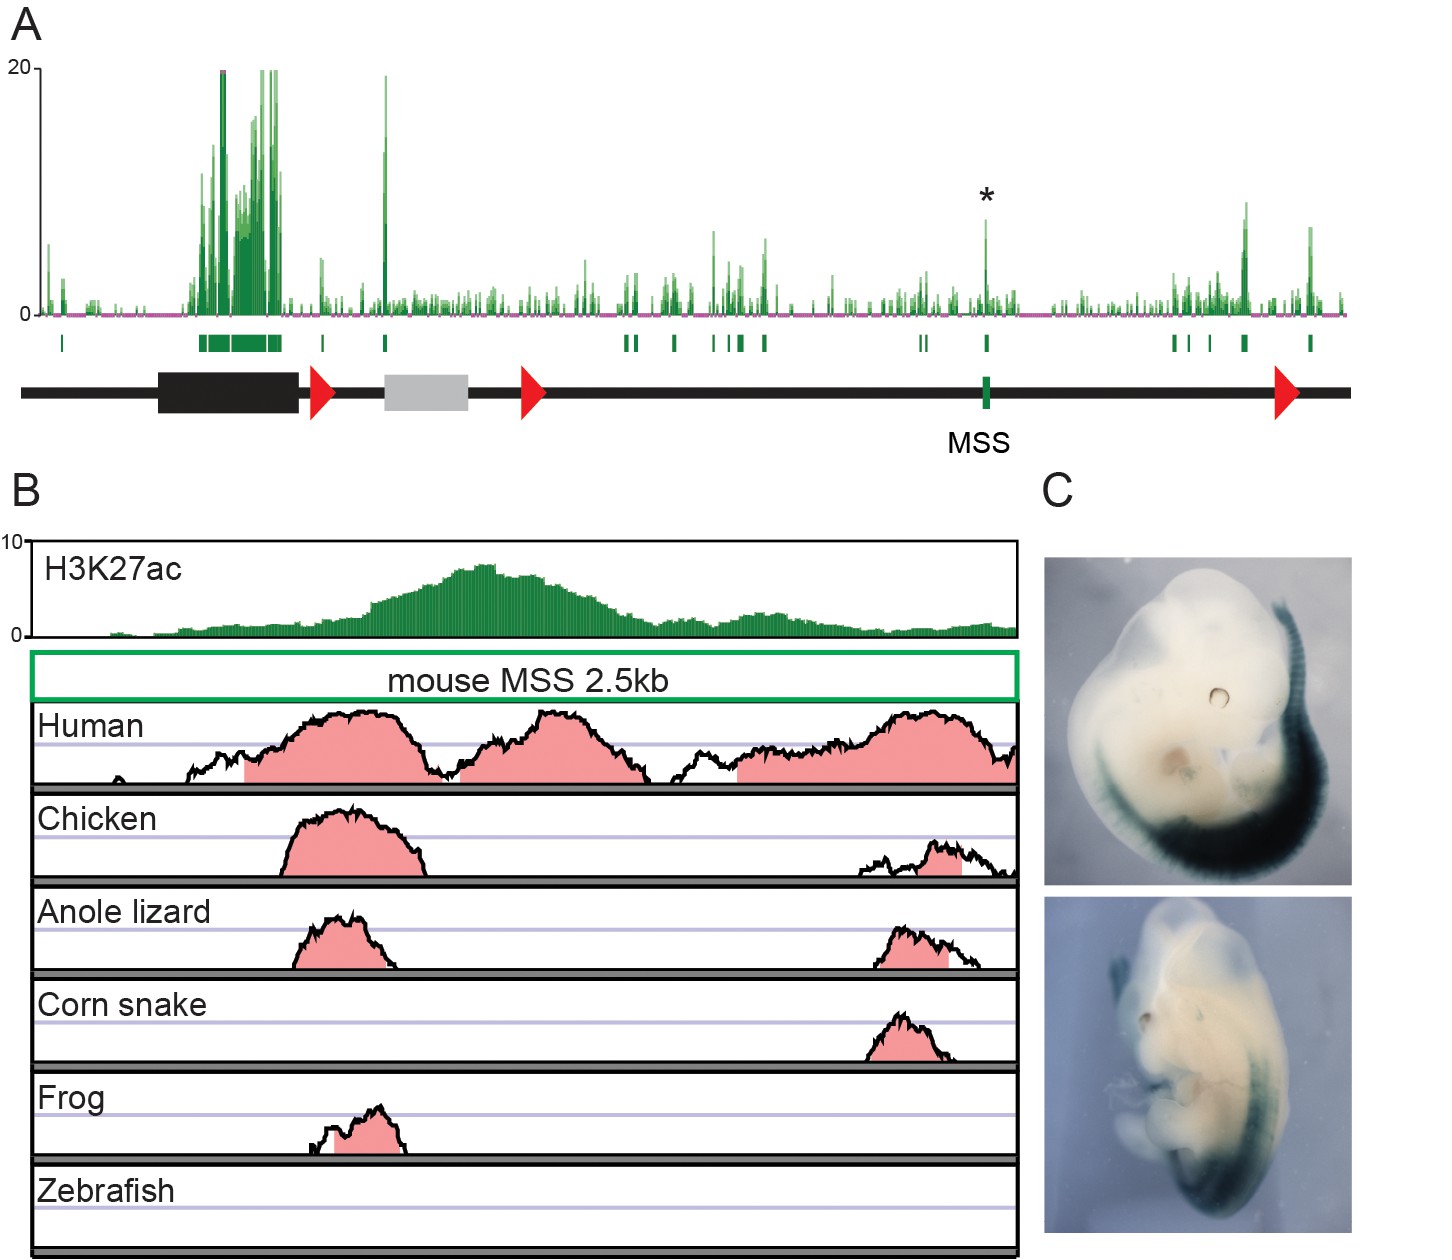
Regulatory potential of a mesodermal enhancer sequence (MSS) located in the telomeric gene desert.
(A) ChIP-seq mapping over the HoxD cluster and the flanking 3’-located, telomeric gene desert of H3K27 acetylation in dissected mouse upper trunk tissue. Green boxes under the mapping represent peaks identified by the MACS software. The MSS peak is identified by an asterisk. The HoxD cluster is represented by a black rectangle and the grey box represents the Mtx2 gene (B) H3K27ac ChIP-seq mapping and conservation plots of the MSS sequence. The plots show a conservation from 50% to 100%, with a pink colour when conservation is above 75%. (C) The MSS enhancer activity is shown as assessed by LacZ reporter assay at E12.5. The pattern of lacZ expression is representative of the one obtained in 4 different embryos.
Figure 3 with 1 supplement
4C-seq bimodal interaction profiles for Hoxd genes in mouse and snake embryos.
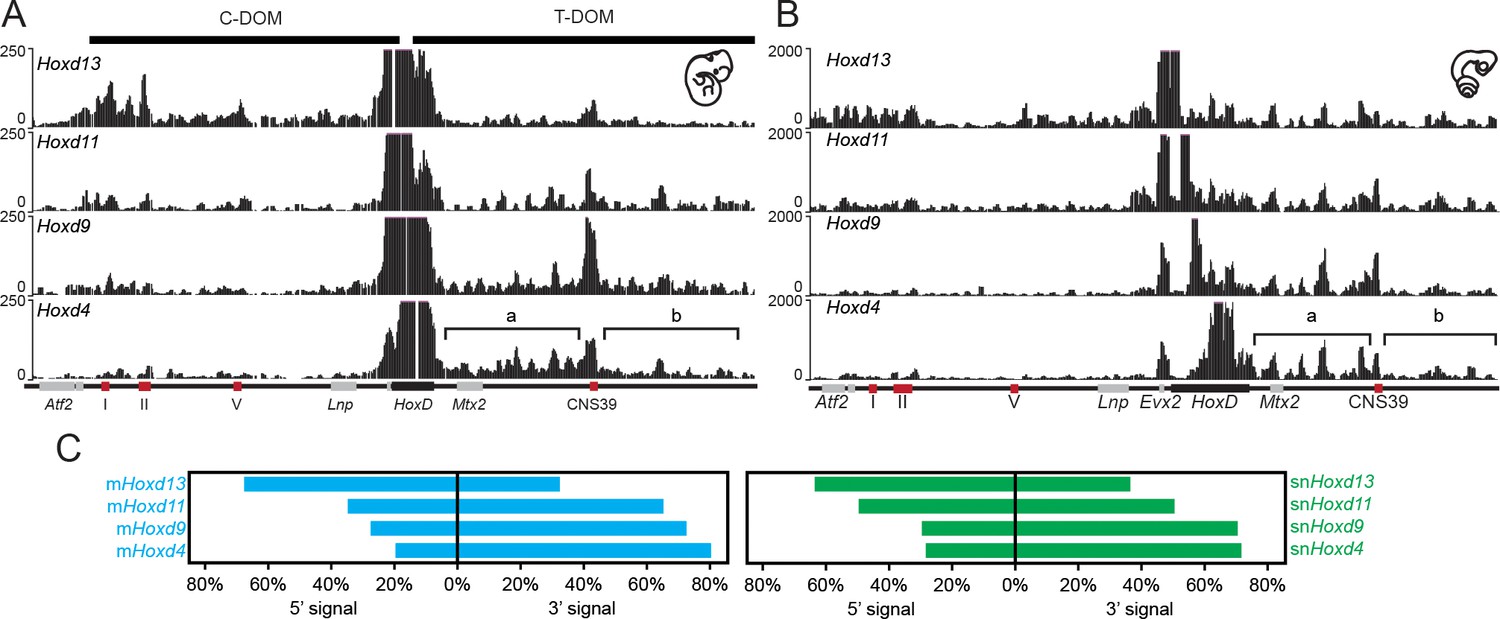
(A) The four tracks show the interaction profiles established by either the Hoxd13, Hoxd11, Hoxd9 or the Hoxd4 viewpoints in E11.5 total mouse embryo. While Hoxd13 mostly interacts with the centromeric landscape (left), Hoxd4 contacts preferentially the telomeric landscape. Both Hoxd11 and Hoxd9 show intermediate profiles. The centromeric (C-DOM) and telomeric (T-DOM) TADs are represented as black boxes on top of the profiles. (B) The four tracks show the snake orthologous series of genes used as baits on 2.5 dpo corn snake whole embryos. The same general interaction profiles are observed. Brackets indicate the location of the two telomeric sub-TADs:’ a’ and ‘b’. Under the profiles the HoxD locus is represented. The black rectangle is the HoxD cluster, grey boxes are neighbouring genes and red boxes represent known constitutive contacts in the mouse that are conserved in snakes. (C) Graphical representation of the percentage of interactions either in 5’ or in 3’ of the gene clusters, calculated for the different viewpoints for the mouse (blue) or the snake (green).
Figure 3—figure supplement 1
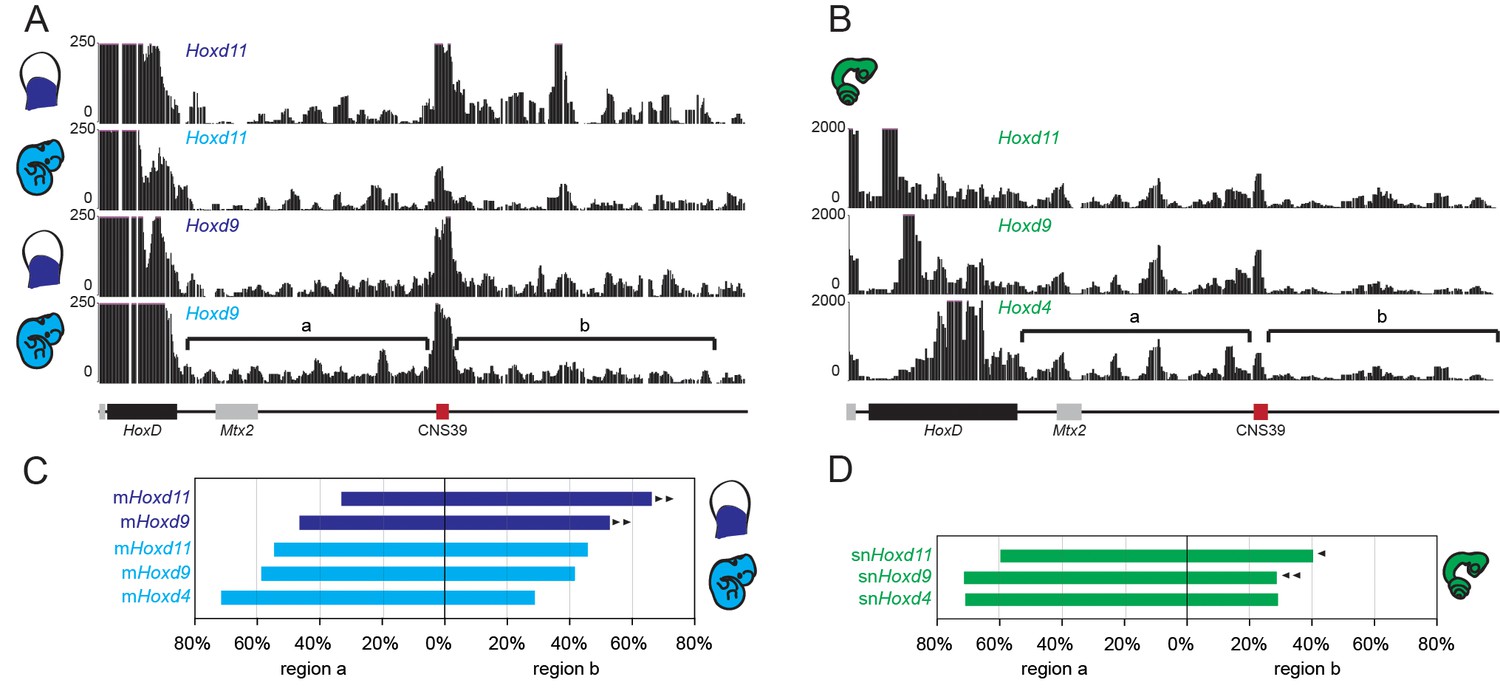
4C-seq in the telomeric gene desert of mouse and snake tissue.
(A) Profiles are from either Hoxd11 or Hoxd9 viewpoints in proximal limb and whole embryo E11.5 mouse samples. The track obtained from mouse whole embryo is a zoom in of the profile in Figure 3A, whereas the proximal limb profile is from (Andrey et al., 2013). (B) 4C-seq profiles using Hoxd11 and Hoxd9 as viewpoints in snake 2.5 dpo full embryos represent a zoom in of the track shown in Figure 3B. The brackets represent the two telomeric sub-TADs’ a’ and ‘b’. The HoxD locus is shown below with the cluster as a black rectangle, grey boxes for neighbouring genes and red boxes for CNS39, a constitutive contact observed in the mouse and conserved in snakes. (C and D) Graphical representation of the percentage of interactions either in the ‘a’ or in the ‘b’ subTADs over the total interactions that map on the telomeric desert, calculated for the different viewpoints for either the mouse (C), or the snake (D). Arrowheads indicate an increase (mouse proximal limb) or decrease (snake tissue) of interactions in region ‘b’, as compared to the interactions scored using the same viewpoint in the mouse whole embryo sample.
Figure 4 with 1 supplement
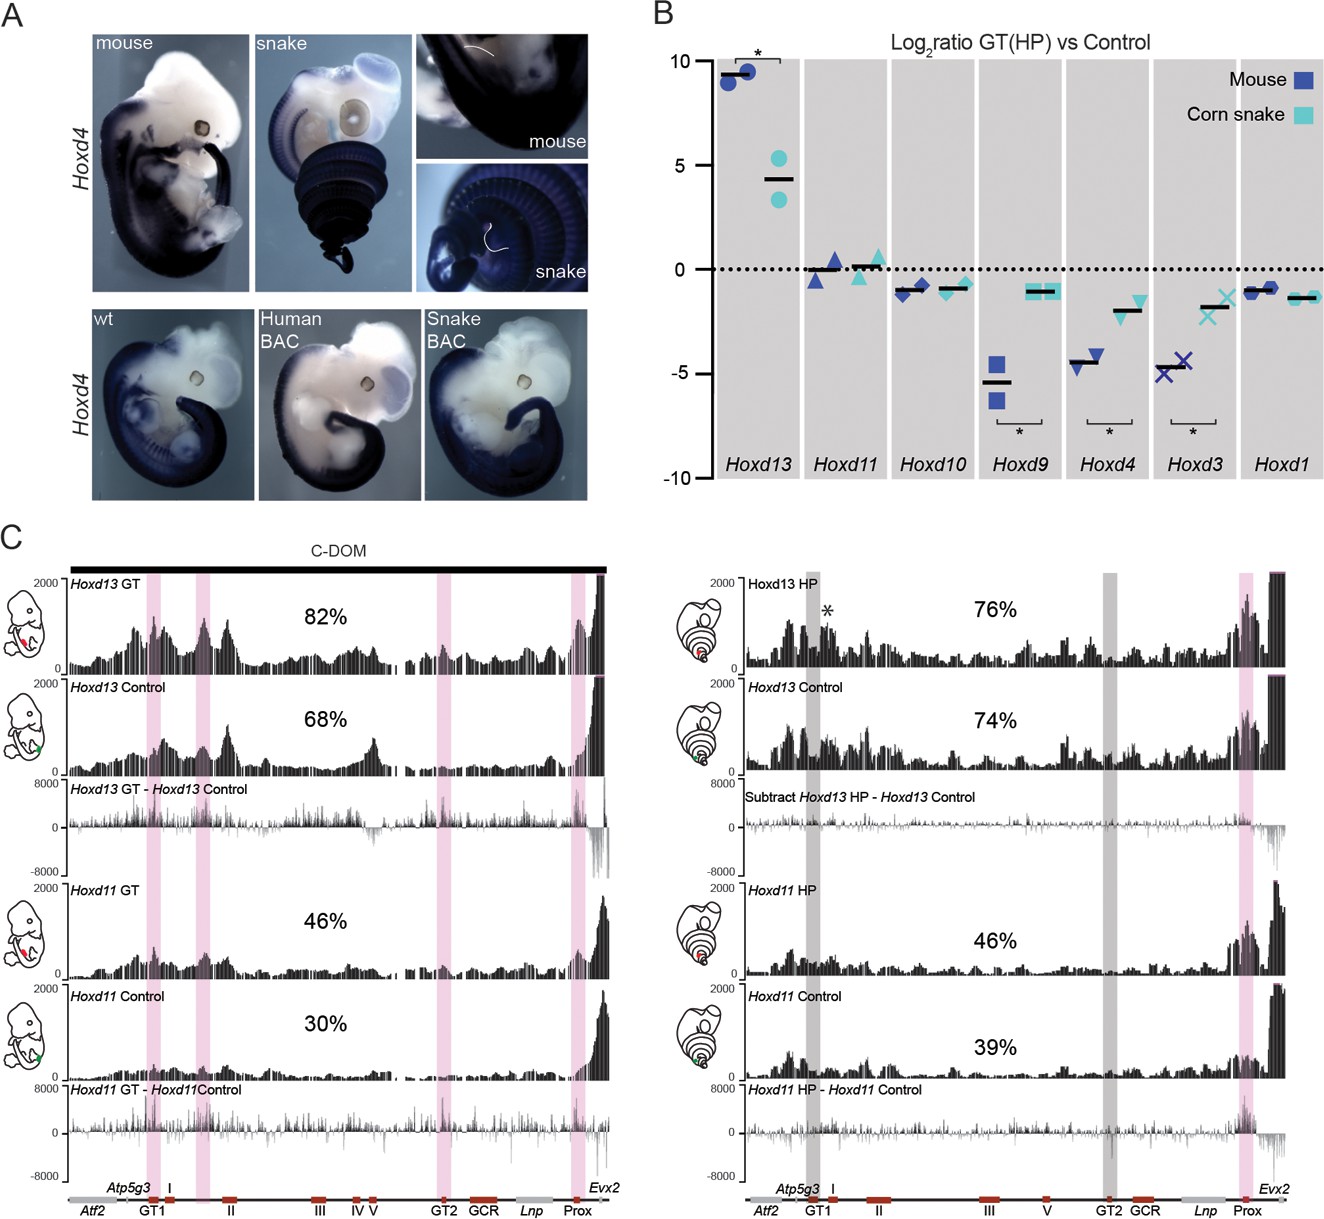
Regulation of mouse and corn snake Hoxd genes in developing genitals.
(A) Endogenous Hoxd4 expression both in a E12.5 control mouse embryo and in a 8.5 dpo corn snake embryo. Higher magnifications of the cloacal regions are shown on the right, with the positions of the GT and HP delineated in white. Below are in situ hybridization of either control or E11.5 embryos transgenic for the human and snake BAC clones using species-specific probes. (B) Quantifications of Hoxd13, Hoxd11, Hoxd10, Hoxd9, Hoxd4, Hoxd3 and Hoxd1 transcript levels either in mouse E12.5 GT (n=2) or in snake 4.5 dpo HP (n=2) by RT-qPCR. The log2 ratios were calculated between genital and control trunk tissue expression values. Hoxd13 (P = 0.0378), Hoxd9 (P = 0.0375), Hoxd4 (P = 0.0298) and Hoxd3 (P = 0.0342) log2 ratios are significantly different between mouse and corn snake while Hoxd11 (P = 0.8303) and Hoxd10 (P = 0.8539) values are not (*P < 0.05; unpaired two-tailed t-test). Bars indicate the average. (C) Smoothed 4C-seq mapping using mouse and snake Hoxd13 and Hoxd11 as viewpoints and GT (mouse) and HP (snake) as samples along with a control sample (left). The BamCompare subtract function was used for each viewpoint to compare sequence coverage in GT/HP versus control tissues. Genes are represented by grey rectangles and previously characterized mouse limb or GT enhancers are represented by red boxes below. The vertical shaded zones in pink represent sequences that displayed increased read coverage in GT versus control tissue, whereas the grey zones point to sequences showing increased contact in mouse but not in snake genitals. The percentages show the relative amount of interactions over this particular landscape, calculated as in Figure 3. The centromeric TAD C-DOM is represented by a black rectangle above the mouse 4C profile. An asterisk highlights strong contacts of Hoxd13 with Island I in the snake.
Figure 4—figure supplement 1
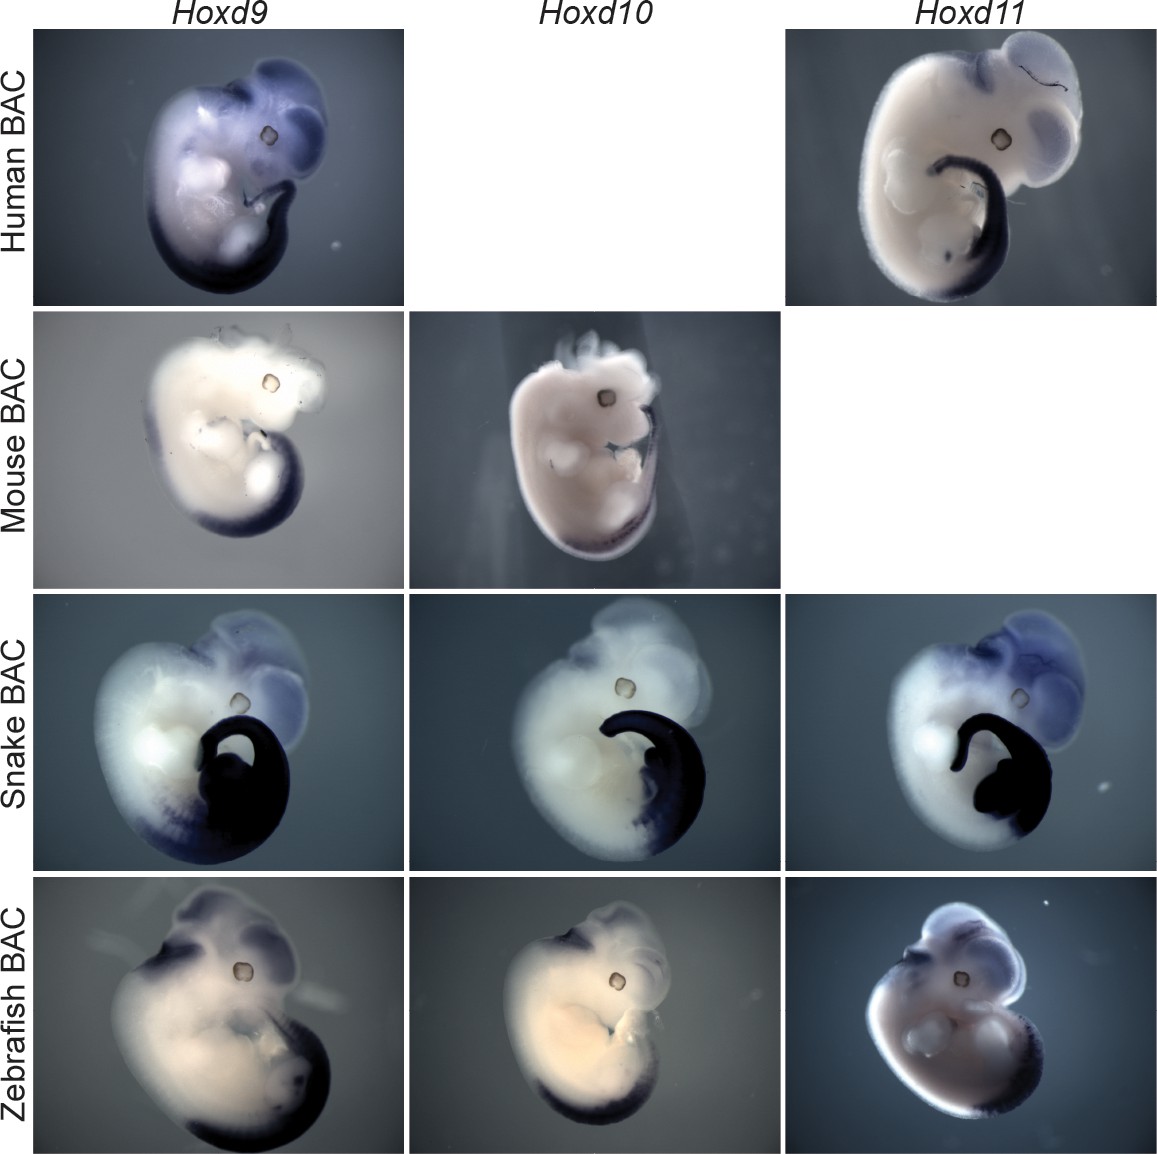
Interspecies comparison of the regulatory potential associated with the HoxD cluster.
Hoxd11, Hoxd10 and Hoxd9 species-specific probes were used for whole mount in situ hybridization of E11.5 transgenic mice containing either a human, a mouse, a snake or a zebrafish HoxD cluster integrated randomly in the genome. The snake HoxD cluster seems to trigger a much wider transcriptional response in mesoderm derivatives.
Figure 5
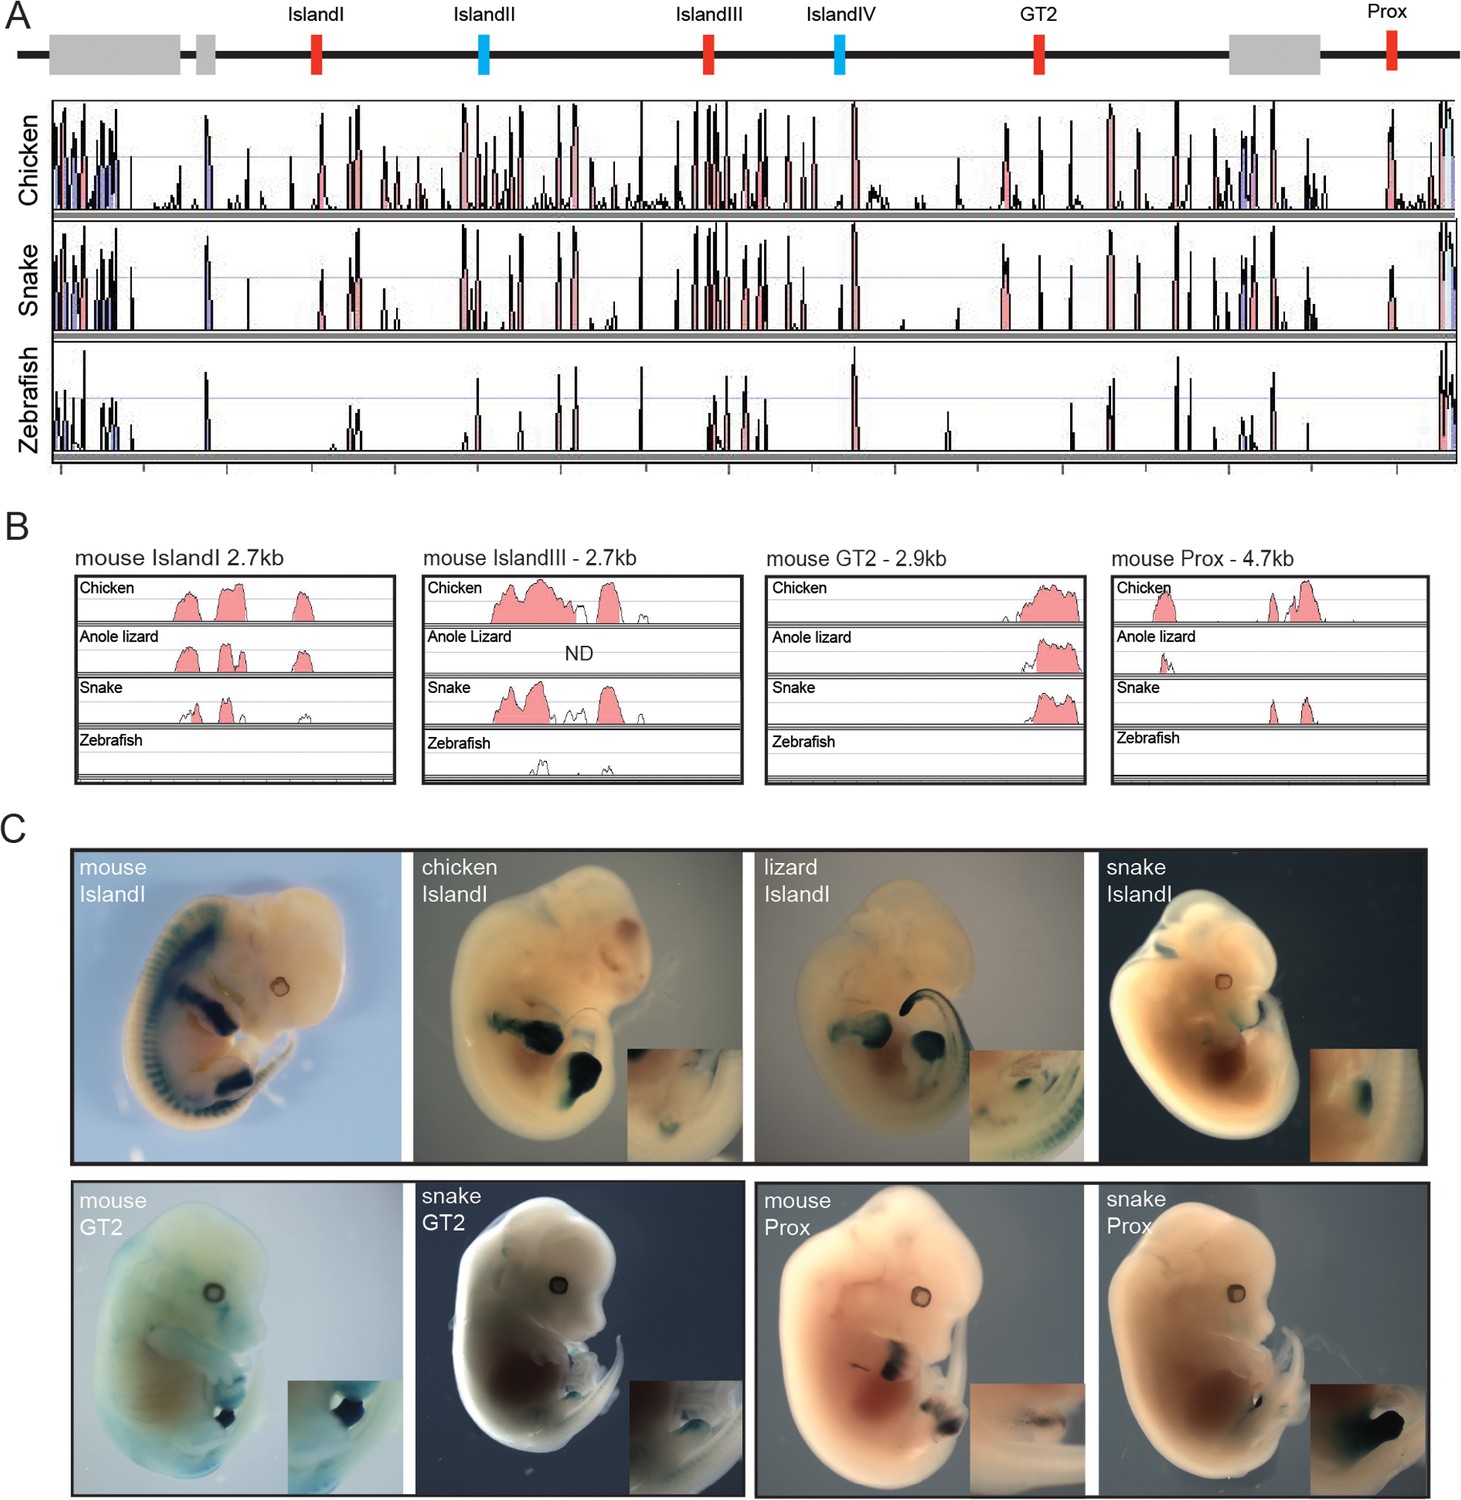
Enhancer activity of mouse limb and GT enhancers.
(A) Conservation plot over the 5’ gene desert (centromeric in the mouse) using mouse as reference sequence. Peaks represent a conservation higher than 50%. The alignment was made with the mVista program using sequences from mouse, chicken, corn snake and zebrafish. Genes are represented by grey boxes. The various mouse limb and/or GT enhancers conserved from mammals to chicken are represented by red boxes, whereas mouse limb enhancers either poorly or not conserved at all in chicken are in blue. (B) Conservation plots of selected mouse limb and GT enhancers using the mouse sequence as a reference. Coloured peaks represent a conservation of above 75%. (C) Enhancer activities of the mouse, chicken, lizard and snake Island I (E12.5) (top), and mouse and snake enhancer activities of the GT2 (E14.5) and Prox (E12.5) sequences (bottom), in transgenic mouse foetuses. Magnifications of the genital region are included.
Author response image 1
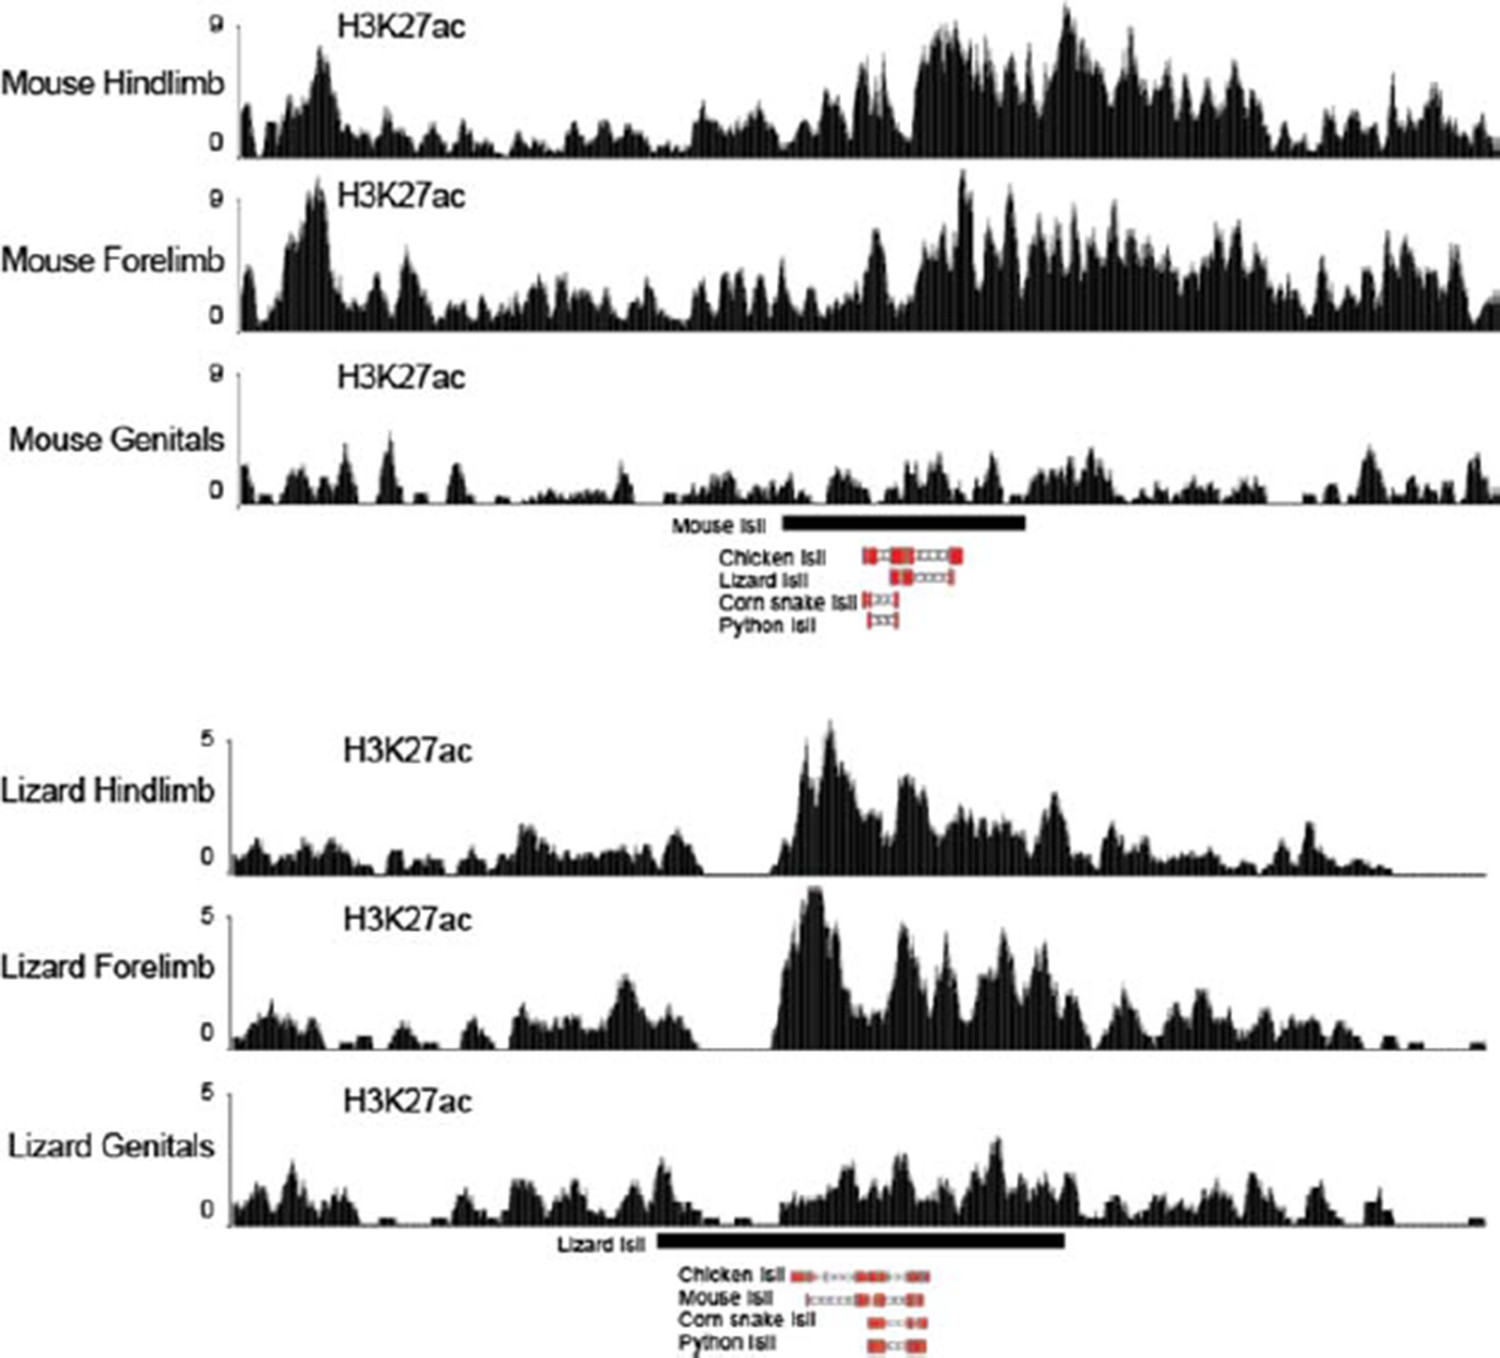
Figure 1 H3K27ac profiles in limb and genitals over Island I of mouse (up) and lizard (bottom).
The Island I is shown as a black box under the profiles and sequence conservation as assessed by UCSC Blat is shown underneath for different vertebrate species. The mouse Island I is enriched only in limbs. The lizard Island I although clearly acetylated in limbs also displays some level of acetylation in genitals.
Tables
Table 1
List of primers used to clone the probes for in situ hybridization.
| HsHoxd13 | GGTCCAGGTTGGCCACAGAC |
| GTCACTCTACTGATTGCAGC | |
| HsHoxd11 | TTGAGAGCTCCAGGAAGCGC |
| TTCAGTTGCATGGGTTCTGG | |
| HsHoxd9 | CCAATTCCAAGAATGAAGGC |
| ACATTTACAACTGGTCCTCG | |
| HsHoxd4 | CAACTCAGAGGCGAGTTCAC |
| TCAAGTAGCTTGCTATGGCA | |
| DrHoxd13 | ATGATGGTTTCCAGATATGC |
| TGGTGACAGCTGCCCAATCA | |
| DrHoxd11 | GAGCCGCTGTTCTTTTCTTC |
| GTCCTATCCGCACGCATATG | |
| DrHoxd10 | CCACCTTTGCCTTCTCTGTG |
| TCCAAAATGTCCTTTCCCAAC | |
| DrHoxd9 | TTACTTGGGTCAAGTTGTTG |
| GTGAAGGCAGCAAAAATACT | |
| PgHoxd13 | GCGCTTCTGATCATGTTTGC |
| ATAGCTAAACATATAGGCAC | |
| PgHoxd11 | CCTAGAGGTTAATATGACTCC |
| CCCATTTAGGCTCCTAGG | |
| PgHoxd10 | CCGAGAACTGACTGCTAATC |
| CAGAATTTATTGCATTATAC | |
| PgHoxd9 | AGGAGAGTAACACTTTGAGG |
| CCTCTCTGACATGAGTCTTG | |
| PgHoxd4 | CGGATTTGACCACTTTATAG |
| AACAATATCACCAACACATG |
Table 2
List of primers used for 4C-seq amplifications with snake tissues.
| PgHoxd13 DpnII | AATGATACGGCGACCACCGAACACTCTTTCCCTACACGACGCTCTTCCGATCTGGAAAAGGTTGTTAATCAGG |
| PgHoxd13 NlaIII | CAAGCAGAAGACGGCATACGACTGCCCTTCTTCAAAGAGAC |
| PgHoxd11 NlaIII | CAAGCAGAAGACGGCATACGAGCCGCAGTTGTCCAAGTTAC |
| PgHoxd11 DpnII | AATGATACGGCGACCACCGAACACTCTTTCCCTACACGACGCTCTTCCGATCTTCCTCCTTGAGAGGGAATCC |
| PgHoxd9 NlaIII | CAAGCAGAAGACGGCATACGAAAGAATCCCCATCCTAGTCC |
| PgHoxd9 DpnII | AATGATACGGCGACCACCGAACACTCTTTCCCTACACGACGCTCTTCCGATCTTGTAATCGTAATCAGCATAG |
| PgHoxd4 DpnII | AATGATACGGCGACCACCGAACACTCTTTCCCTACACGACGCTCTTCCGATCTCACTTCATCCTTCGGTTCTG |
| PgHoxd4NlaIII | CAAGCAGAAGACGGCATACGATAAACAATGAAGTGAAACGG |
Table 3
List of snake and mouse primers used for qPCR.
| PgHoxd13 | ACGAGACCTACATCTCCATG |
| TTGGTGTAAGGCACTCGCTTC | |
| PgHoxd11 | TCCGAAAAGCCAGAGTTCAG |
| ATCTGGTACTTGGTGTAAGG | |
| PgHoxd10 | CGTCTCCAGCCCAGAAAGC |
| GGTTGGAGTATCAGACTTGG | |
| PgHoxd9 | AGGAAAAAGAGGAGCAGCAG |
| TGGAGCGAGCATGAATCCAG | |
| PgHoxd4 | GAAAGTCCACGTTAACTCTG |
| GACTTGCTGCCTGGTATAAG | |
| PgHoxd3 | AGGTATCCAGCTCGCTTACC |
| GCGGACTCTTGTCTTCACAG | |
| PgHoxd1 | AAAGTCAAGAGGAACGCACC |
| ACTGGAAGACCCACAAGCTG | |
| PgHmbs | ATTGGGACCAGCTCACTTCG |
| CCTCCTTCTCGTCCAGCTTC | |
| MmHoxd13 | GAAATCATCCTTTCCAGGAGATG |
| CGCCGCTTGTCCTTGTTAATG | |
| MmHoxd11 | AAGAGCGGCGGCACAGTG |
| TTGAGCATCCGAGAGAGTTGG | |
| MmHoxd10 | AGGAGCCCACTAAAGTCTCC |
| CAGACTTGATTTCCTCTTTGC | |
| MmHoxd9 | GACCCAAACAACCCTGCAG |
| TTCAGAATCCTGGCCACCTC | |
| MmHoxd4 | TGCACGTGAATTCGGTGAAC |
| GTGAGCGATTTCAATCCGACG | |
| MmHoxd3 | AAGCAGAAGAACAGCTGTGC |
| TAGCGGTTGAAGTGGAACTCC | |
| MmHoxd1 | GGCCCTTTCAGACTGTGTCC |
| CATATTCGGACAGTTTGCTTTTC | |
| MmHmbs | CGGCTTCTGCAGACACCAG |
| CCCTCATCTTTGAGCCGTTTTC |
Download links
A two-part list of links to download the article, or parts of the article, in various formats.
Downloads (link to download the article as PDF)
Open citations (links to open the citations from this article in various online reference manager services)
Cite this article (links to download the citations from this article in formats compatible with various reference manager tools)
Reorganisation of Hoxd regulatory landscapes during the evolution of a snake-like body plan
eLife 5:e16087.
https://doi.org/10.7554/eLife.16087


