Histidine phosphorylation relieves copper inhibition in the mammalian potassium channel KCa3.1
- New York University School of Medicine, United States
- Skirball Institute of Biomolecular Medicine, New York University, United States
- Salk Institute for Biological Studies, United States
- Duke University School of Medicine, United States
Figures
Figure 1
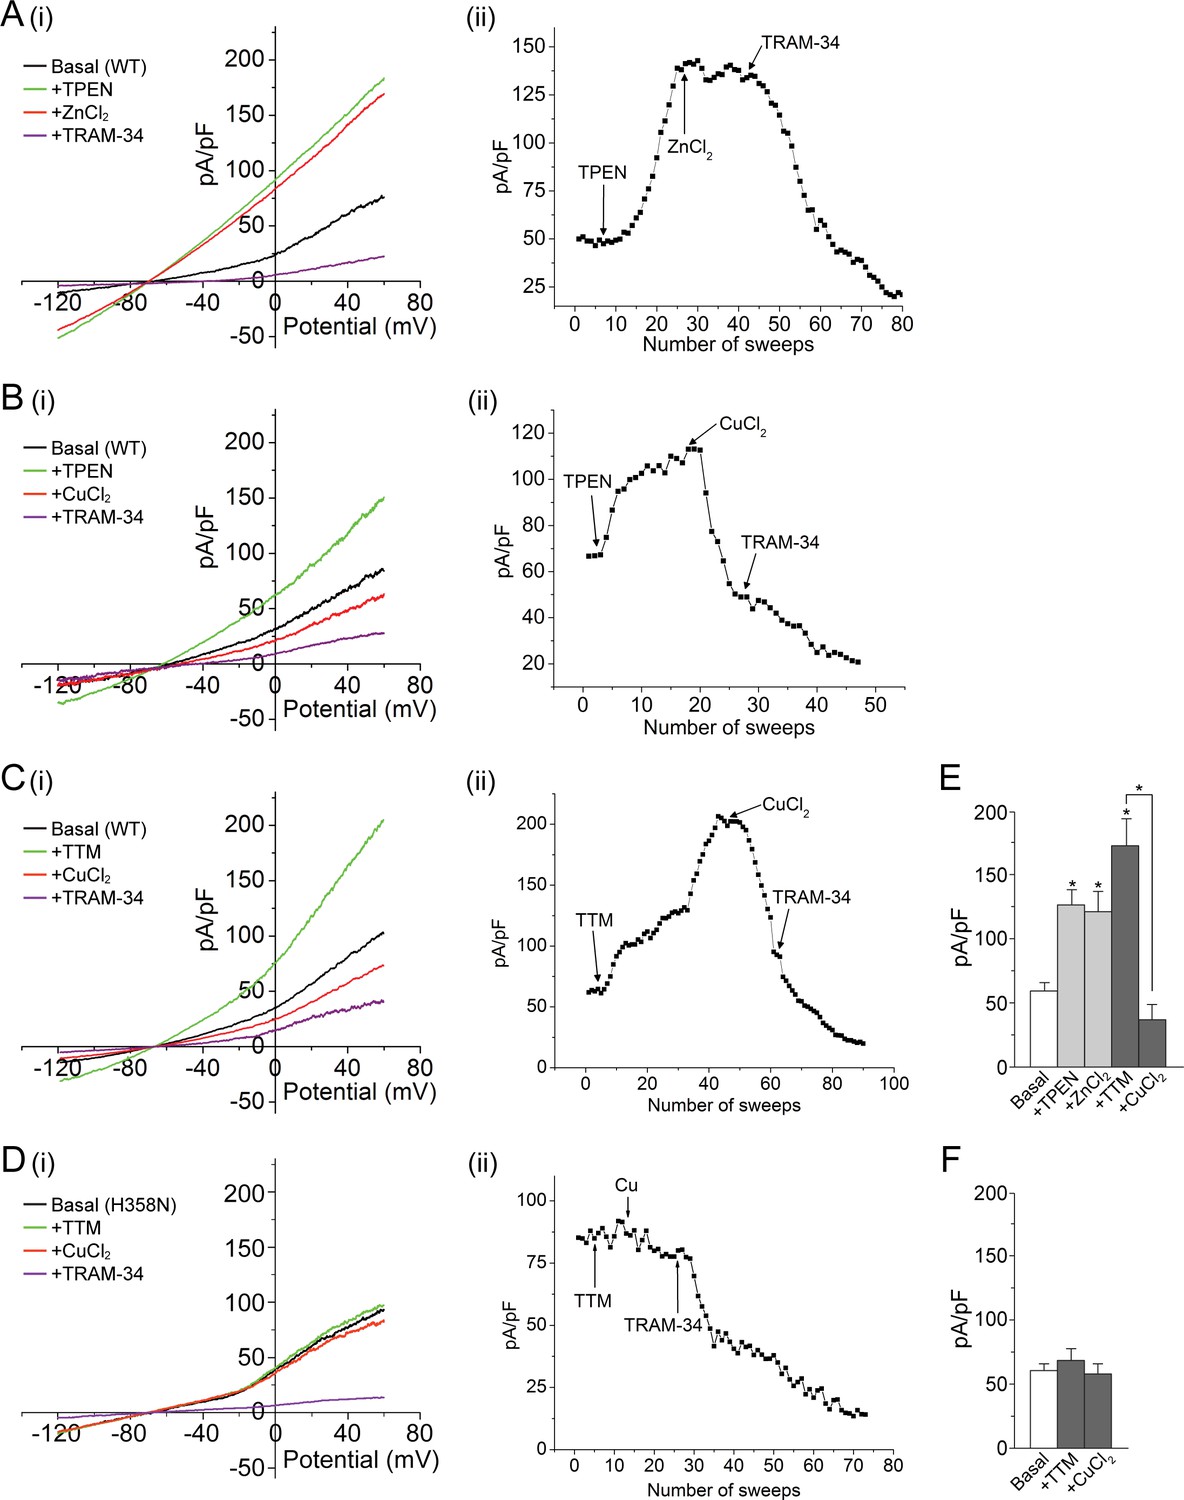
Metal chelators activate and copper inhibits KCa3.1 in whole-cell membrane patches.
(A–D) (i) Representative current vs. voltage (IV) plot recorded from a 293-KCa3.1(WT) cell (A–C) or a 293-KCa3.1(H358N) cell (D). After obtaining the basal current, TPEN (20 µM) (A, B) or TTM (20 µM) (C, D) was perfused in the bath solution, followed by the addition of either ZnCl2 (100 µM) (A) or CuCl2 (100 µM) (B–D), and then TRAM-34 (1 µM). (A–D) (ii) Representative trace of current (pA/pF) recorded at +60 mV using ramp protocol applied every 10 s (sweep frequency). The timing of additions (TPEN, CuCl2, etc.) is indicated by the arrows. (E, F) Summary bar graph of TRAM-34-sensitive current at +60 mV for data measured from 293-KCa3.1(WT) cells (E) or from 293-KCa3.1(H358N) cells (F). In (E), +ZnCl2 is to be compared with +TPEN (i.e. ZnCl2 added after treatment with TPEN), and +CuCl2 with +TTM (i.e. CuCl2 added after treatment with TTM). Data are displayed as mean ± the standard error of the mean (SEM) (n = 10 (E) or 8 (F) cells). *p≤0.01 versus Basal and for +CuCl2 versus +TTM.
Figure 2
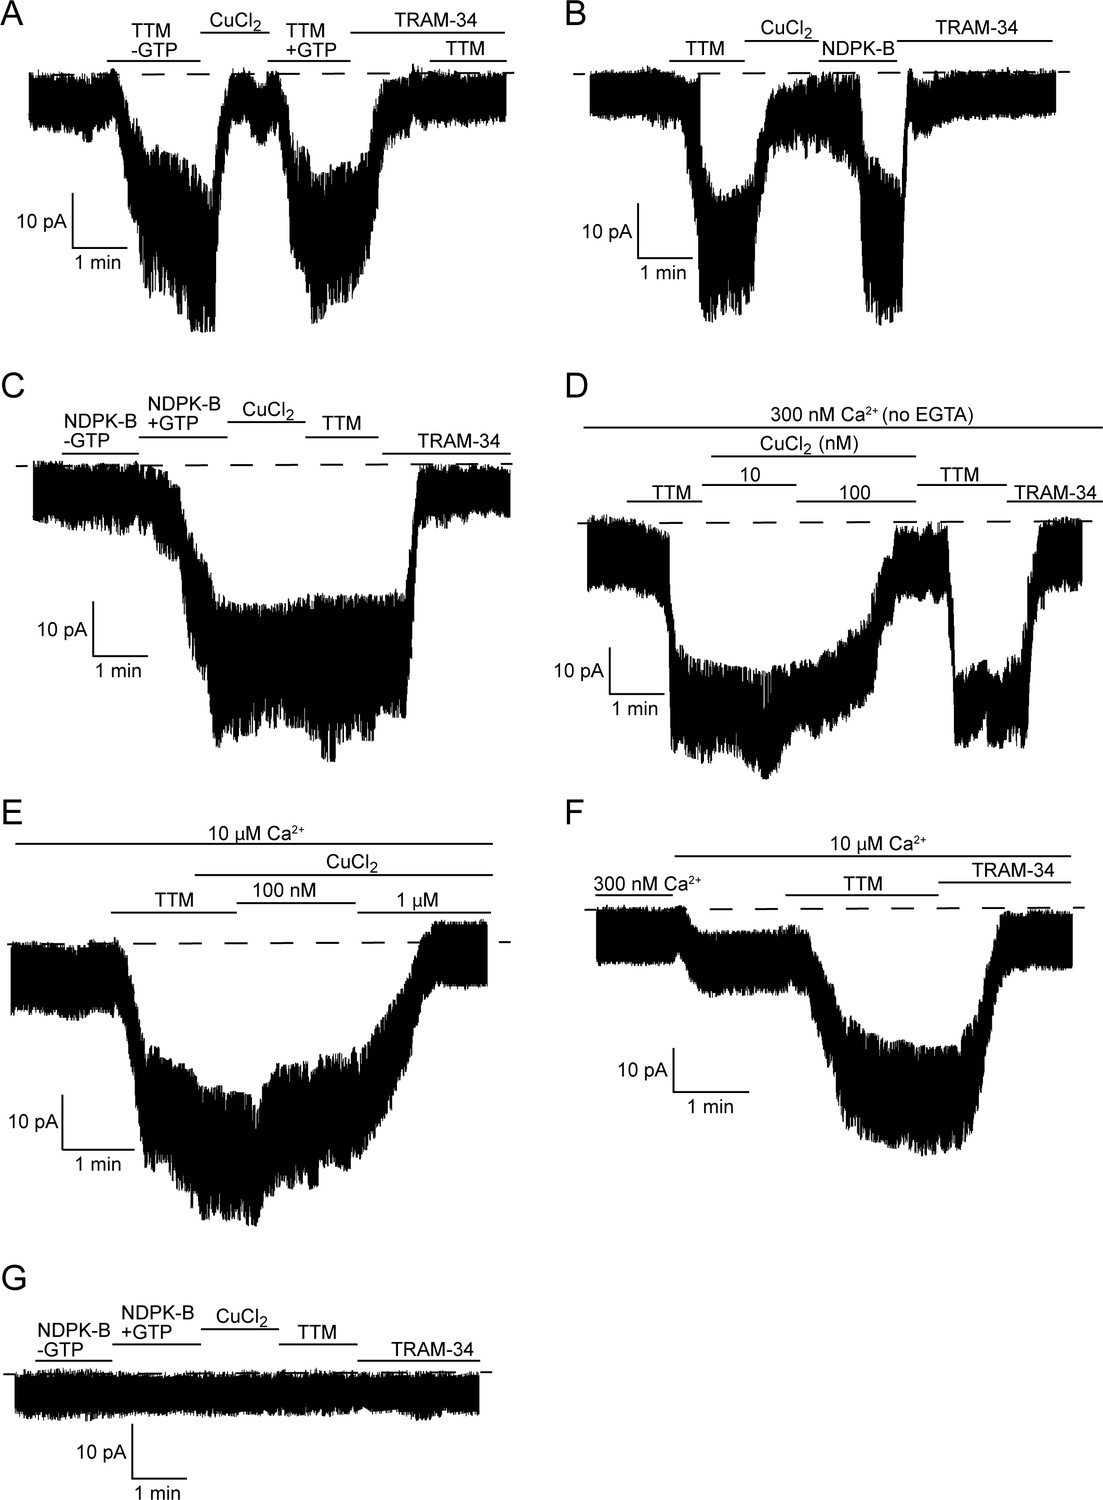
TTM activates and copper inhibits KCa3.1 in inside-out membrane patches, dependent on His358 phosphorylation.
Representative recordings of channel activity versus time from I/O patches isolated from 293-KCa3.1 (A–F) or parental 293 (G) cells. All recordings were done in 300 nM free Ca2+ and 500 µM GTP unless otherwise specified. TTM (20 µM), CuCl2 (10 µM), NDPK-B (10 µg/ml) and TRAM-34 (1 µM) were added as indicated. Shown are representative patch data from three independent experiments. (A–C) were performed in the presence of EGTA (5 mM) and (D–F) in the absence of EGTA in the bath solution. (E,F) were done in the presence of 10 µM free calcium in the bath solution.
Figure 3
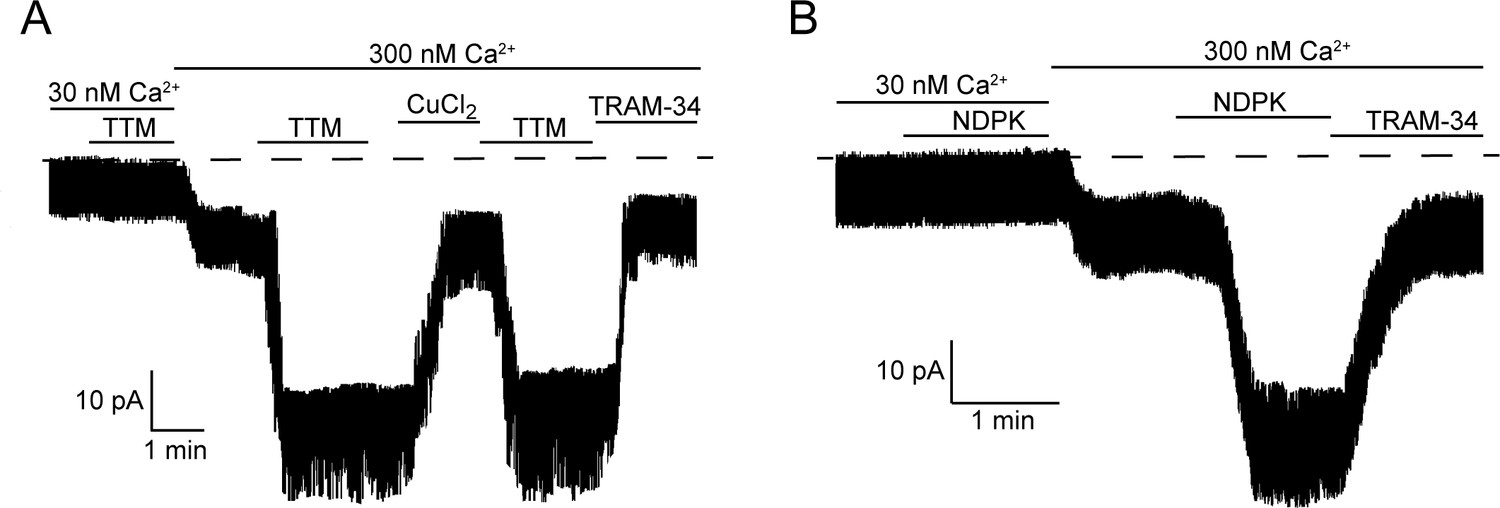
Calcium is required for activation of KCa3.1 by NDPK-B or TTM in inside-out membrane patches.
Representative recordings of channel activity versus time from I/O patches isolated from 293-KCa3.1 cells as described in Figure 2. All recordings were done in 500 µM GTP and either 30 or 300 nM free Ca2+ as indicated. TTM (20 µM), NDPK-B (10 µg/ml), CuCl2 (10 µM) and TRAM-34 (1 µM) were added as indicated. Shown are representative patch data from three independent experiments.
Figure 4
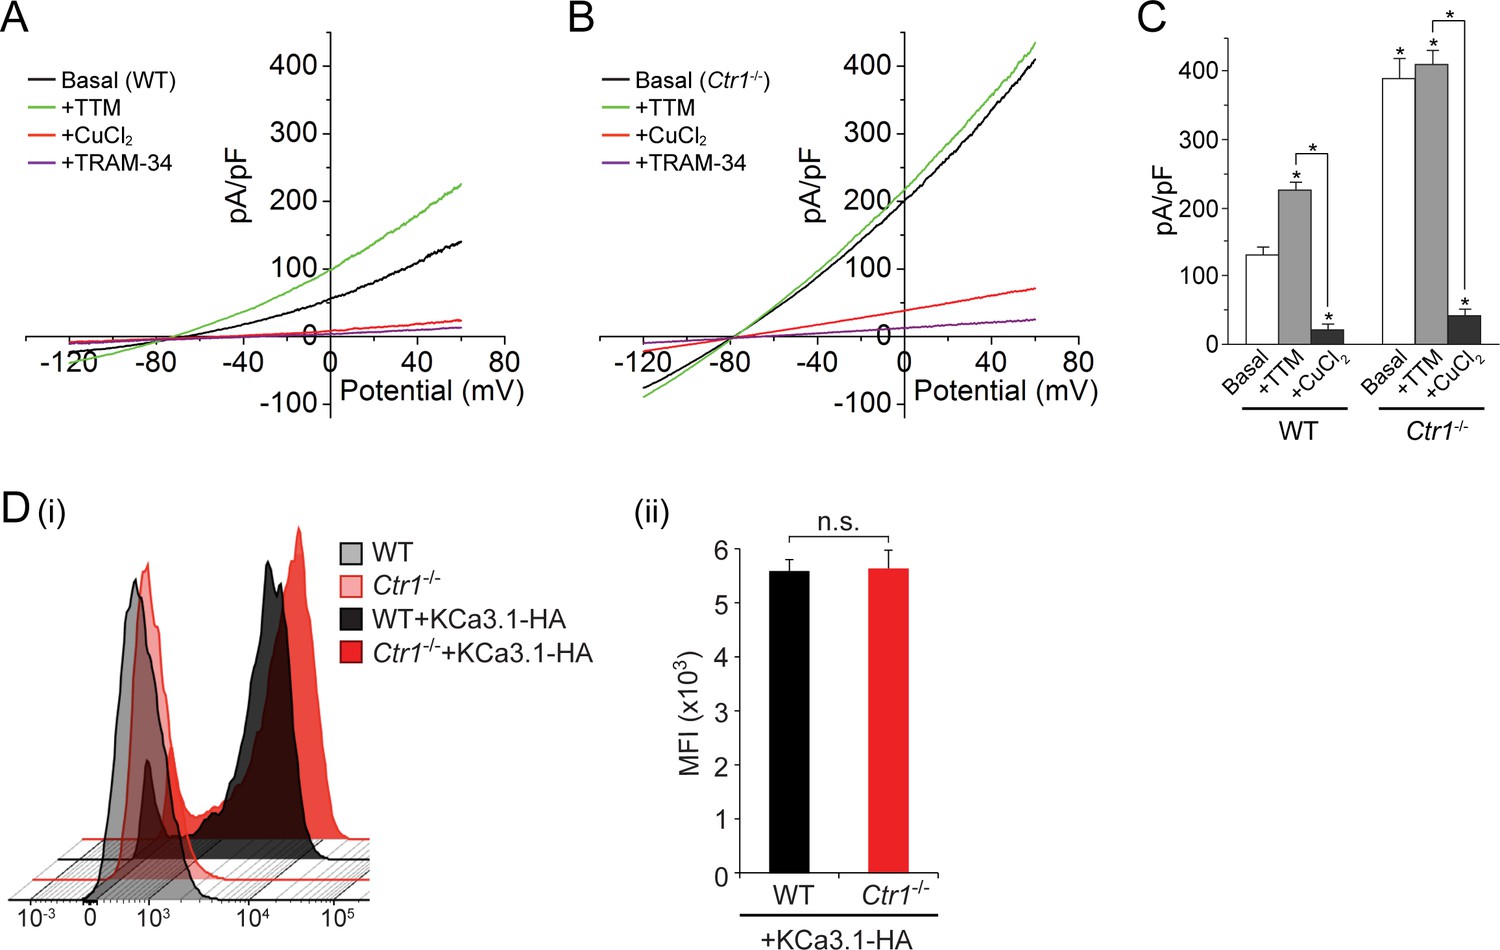
Basal KCa3.1 current is elevated in transfected MEFs from Ctr1-/- mice.
(A, B) Representative current vs. voltage (IV) plot recorded from a KCa3.1-transfected MEF from a wild-type (WT) mouse (A) or a Ctr1-/- (B) mouse. After obtaining the basal current, TTM (20 µM) was perfused in the bath solution followed by CuCl2 (10 µM) and then TRAM-34 (1 µM). (C) Summary bar graph of the TRAM-34-sensitive current at +60 mV for data measured from MEFs from WT or Ctr1-/- mice. For statistical analysis, one-way-ANOVA was used, and the Bonferroni test was applied to compare the mean values. Data are displayed as mean ± SEM (n = 10 cells). *p≤0.01 versus Basal in WT MEFs and for +CuCl2 versus +TTM. (D) Exofacial HA-tagged KCa3.1 was transfected into WT or Ctr1-/- MEFs, and cell surface expression was assessed by FACs analysis following staining with anti-HA antibodies and with anti-mouse FITC antibodies in non-permeabilized cells. (i) Flow cytometry results of WT and Ctr1-/- controls stained with only the secondary anti-mouse FITC antibody, or of WT + KCa3.1-HA and Ctr1-/- + KCa3.1-HA MEFs stained with both anti-HA and anti-mouse FITC antibodies. (ii) Mean fluorescence intensity (MFI) of WT + KCa3.1-HA and Ctr1-/- + KCa3.1-HA MEFs.
Figure 5
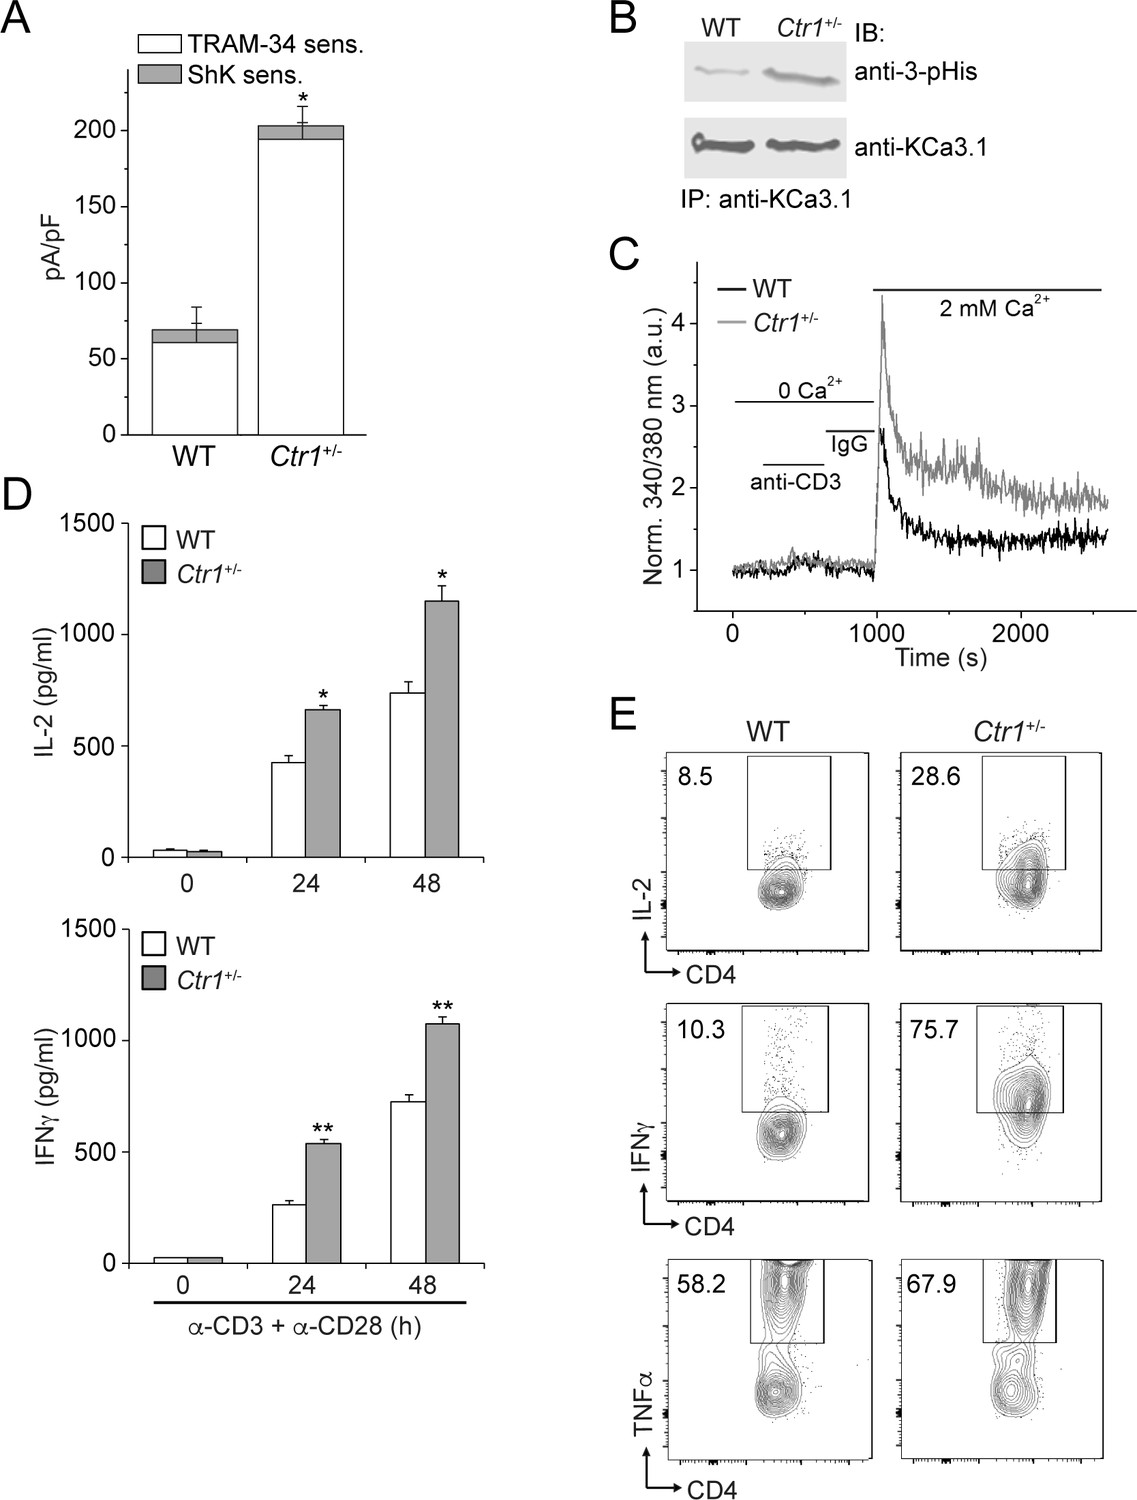
CD4+ T cells from Ctr1+/- mice are hyperactivated.
Naive CD4+ T cells were isolated from spleens of wild-type (WT) or Ctr1+/- mice and activated with anti-CD3 and -CD28 antibodies for 48 hr. (A) KCa3.1 channel activity was determined by whole-cell patch clamping as in Figure 1. Shown is a summary bar graph of TRAM-34 (1 µM; KCa3.1) and ShK (1 nM; Kv1.3)-sensitive currents at +60 mV (n = 12 (WT) or 15 (Ctr1+/-)). For statistical analysis, one-way-ANOVA was used, and the Bonferroni test was applied to compare the mean values. Data are displayed as mean ± SEM (n = 10 cells). *p≤0.01 vs TRAM-34-sensitive current in WT. (B) KCa3.1 was immunoprecipitated from lysates of CD4+ T cells from WT or Ctr1+/- mice and probed with a monoclonal antibody to 3-pHis (clone SC56-2) or KCa3.1 as indicated. (C) Activated cells were rested overnight, loaded with Fura-2, AM and attached to a poly-L-lysine-coated coverslip for 20 min. Calcium imaging was then performed in unstimulated cells and following stimulation with anti-CD3 and -CD28 antibodies (n = 80–100 cells). (D) ELISA to quantify IL-2 and IFN-γ in the supernatants. Statistical significance was calculated using Student’s t-test (*p<0.05, **p<0.01, n.s.: p>0.05; not significant as compared to WT). (E) Representative intracellular flow cytometry detecting cytokine expression following restimulation with anti-CD3 and -CD28 antibodies in the presence of brefeldin-A for 4 hr. Cells not re-stimulated with anti-CD3 and -CD28 were stained and analyzed in a similar manner and served as controls for setting the cut-off limits for cytokine production. Data are representative of two independent experiments.
Figure 6
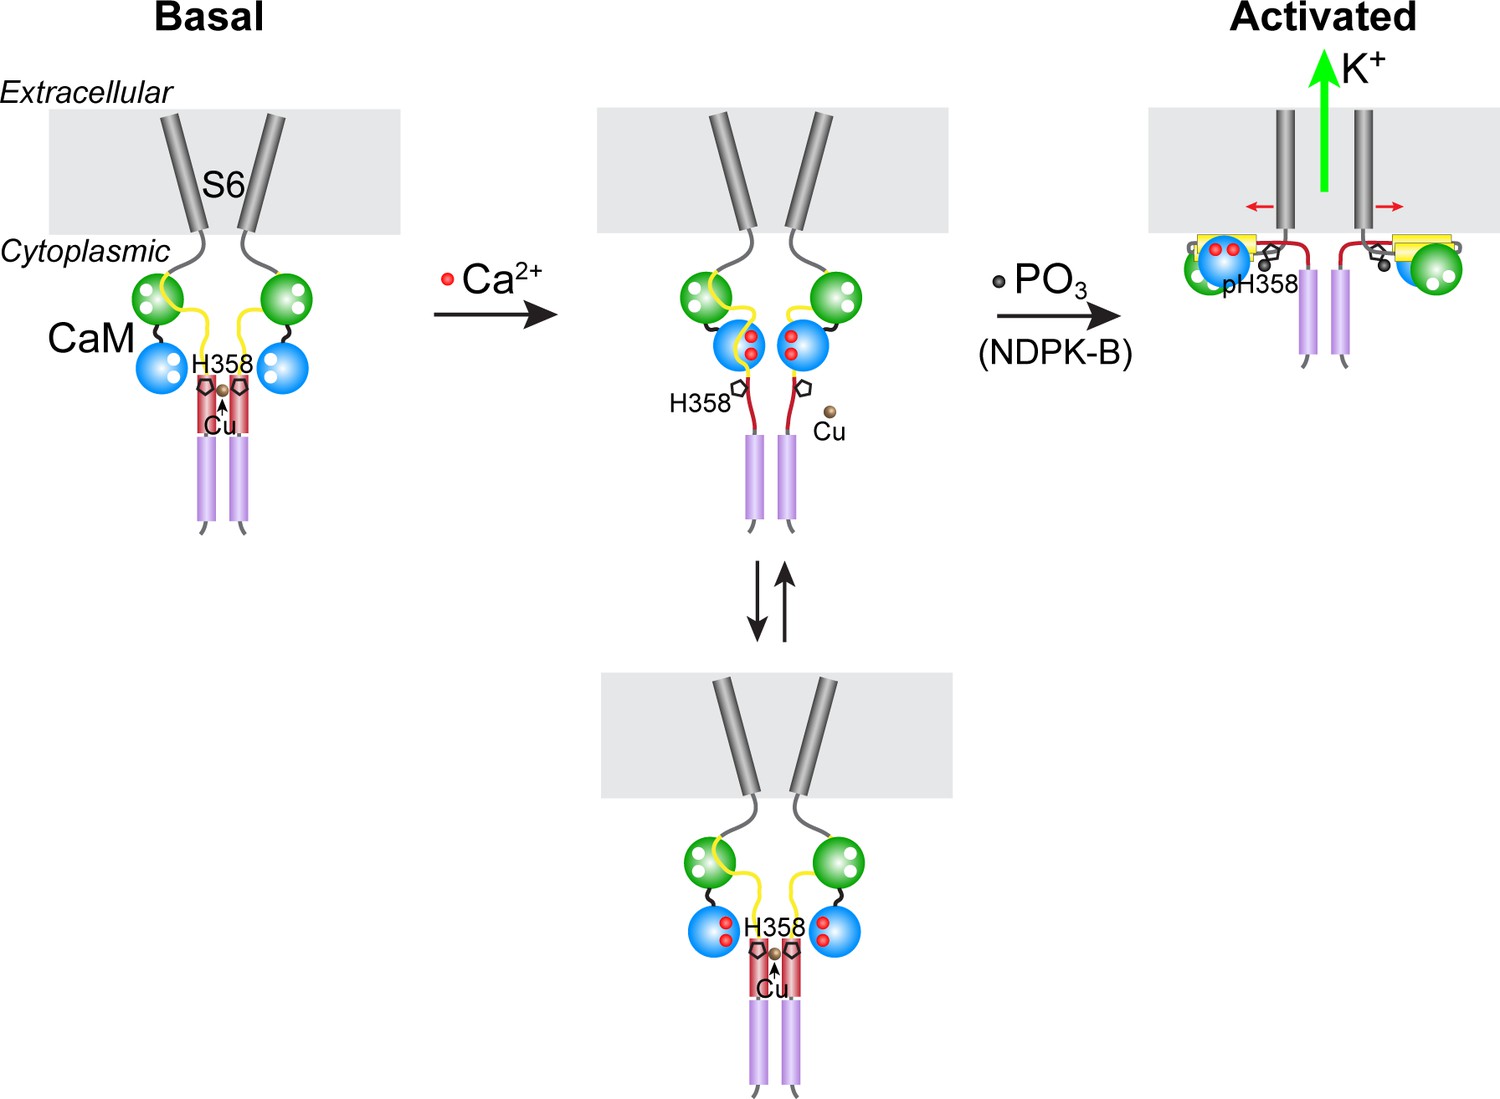
Model for KCa3.1 activation by calcium and histidine phosphorylation.
For clarity, only two of the four KCa3.1 subunits and calmodulin (CaM) are shown. In the basal state (no calcium; left panel), the CaM C lobe (green sphere) is bound to the N-terminal segment of the calmodulin-binding domain (CBD, yellow) in KCa3.1 (Schumacher et al., 2004). The transmembrane S6 helices close off the channel on the cytoplasmic side. At the C terminus of KCa3.1 is a coiled-coil region that forms a four-helix bundle (violet cylinders; S.R.H., unpublished data). Based on coiled-coil prediction software, it is probable that the region containing His358, which is just C-terminal to the CBD, also forms a four-helix bundle (maroon cylinders), with His358 (pentagon) occupying an inward-facing ‘a’ position in the heptad repeat. This would position the four copies of His358 for coordination of a Cu(II) ion on the axis of the four-helix bundle, which would stabilize the four-helix bundle and act to resist the conformational changes induced by calcium binding to the CaM N lobe (blue sphere). An increase in intracellular calcium induces conformational changes in the CBD that partially destabilize copper binding (middle panel), providing access to His358 for phosphorylation by NDPK-B (or copper chelation by TTM). Upon phosphorylation of His358, copper binding is abrogated, and the calcium-induced conformational changes in the CBD lead to channel opening (right panel; exact mechanism not known) (Adelman et al., 2012; Sachyani et al., 2014).
Download links
A two-part list of links to download the article, or parts of the article, in various formats.
Downloads (link to download the article as PDF)
Open citations (links to open the citations from this article in various online reference manager services)
Cite this article (links to download the citations from this article in formats compatible with various reference manager tools)
Histidine phosphorylation relieves copper inhibition in the mammalian potassium channel KCa3.1
eLife 5:e16093.
https://doi.org/10.7554/eLife.16093


