Stochasticity in the miR-9/Hes1 oscillatory network can account for clonal heterogeneity in the timing of differentiation
- University of Manchester, United Kingdom
- University of Exeter, United Kingdom
Figures
Figure 1 with 5 supplements
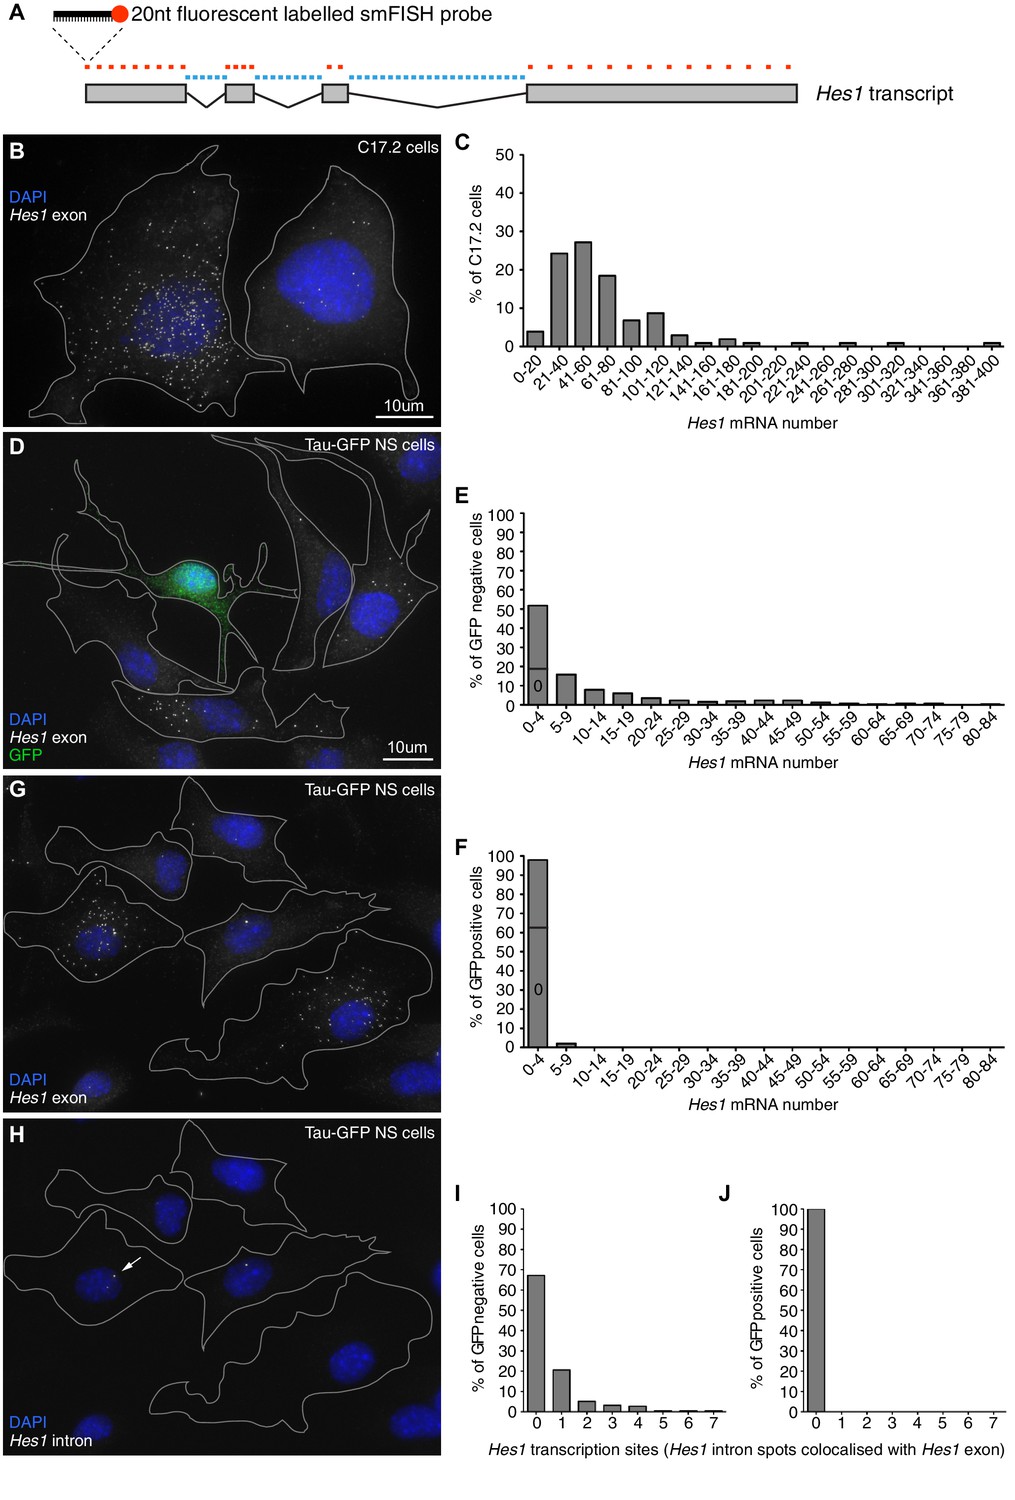
Absolute quantification of mRNA copy number and active transcription sites.
(A) Schematic showing the mouse Hes1 primary transcript, with 29 smFISH probes targeting exonic sequence (red) and 38 smFISH probes targeting intronic sequence (blue). (B) smFISH for Hes1 mRNA (white) in C17.2 cells; nuclei are stained with DAPI (blue). (C) Quantification of Hes1 mRNA number in C17.2 cells (n=103). (D) smFISH for Hes1 mRNA (white) in Tau-GFP NS cells; nuclei are stained with DAPI (blue), and GFP protein is stained with rabbit anti-GFP > anti-rabbit Alexa Fluor 488 (green). The field contains one GFP positive cell, as determined by GFP immunofluorescence intensity analysis (Figure 1—figure supplement 3). (E) Quantification of Hes1 mRNA number in GFP negative NS cells (n=253). (F) Quantification of Hes1 mRNA number in GFP positive neuronal differentiated NS cells (n=49). (G, H) Double smFISH for Hes1 mRNA (G) and Hes1 intron (H) in the same Tau-GFP NS cells; arrow indicates an active transcription site, marked by colocalised exonic and intronic Hes1 smFISH signals in the nucleus. (I, J) Quantification of Hes1 active transcription sites in GFP negative NS cells (I, n=253) and in GFP positive neuronal differentiated NS cells (J, n=49). Source data contained in Figure 1—source data 1.
-
Figure 1—source data 1
mRNA counts by smFISH in C17.2 and NS cells.
- https://doi.org/10.7554/eLife.16118.003
-
Figure 1—source data 2
Quantification of miR-9 sensor activity.
- https://doi.org/10.7554/eLife.16118.004
-
Figure 1—source data 3
Validation of smFISH accuracy.
- https://doi.org/10.7554/eLife.16118.005
-
Figure 1—source data 4
Quantification of Tau-GFP signal intensity.
- https://doi.org/10.7554/eLife.16118.006
-
Figure 1—source data 5
Quantification of miR-9 copy number in C17.2 cells by qRT-PCR.
- https://doi.org/10.7554/eLife.16118.007
Figure 1—figure supplement 1
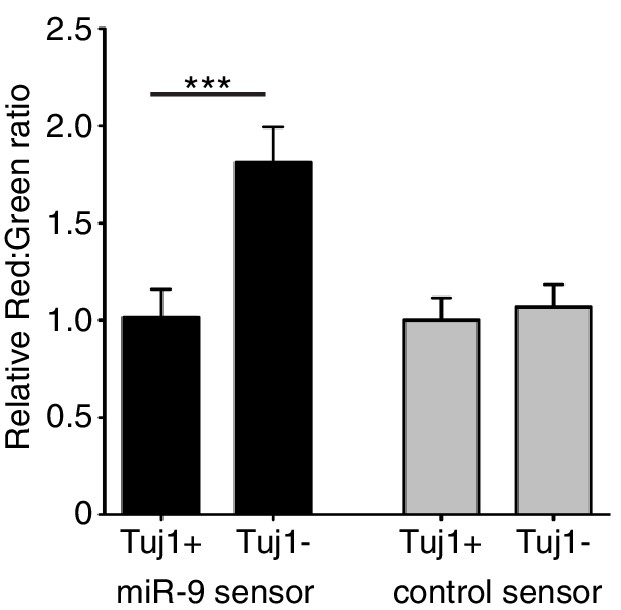
Quantification of miR-9 sensor activity in neural progenitor cells versus Tuj1 positive neurons.
Intensity of Ds-Red-miR-9 sensor (40 cells analysed) or Ds-Red-control sensor (20 cells analysed) relative to intensity of constitutive eGFP in Tuj1 positive (differentiated) or Tuj1 negative (progenitors) C17.2 cells. miR-9 sensor contains miR-9 binding sites and shows reduced expression in high miR-9 activity conditions, therefore low Red:Green ratio indicates high miR-9 activity. Significance tested with Kruskal-Wallis test with Dunn’s multiple comparison correction. 5 images analysed per condition in 2 biological replicates. Error bars show S.E.M. Source data contained in Figure 1—source data 2.
Figure 1—figure supplement 2
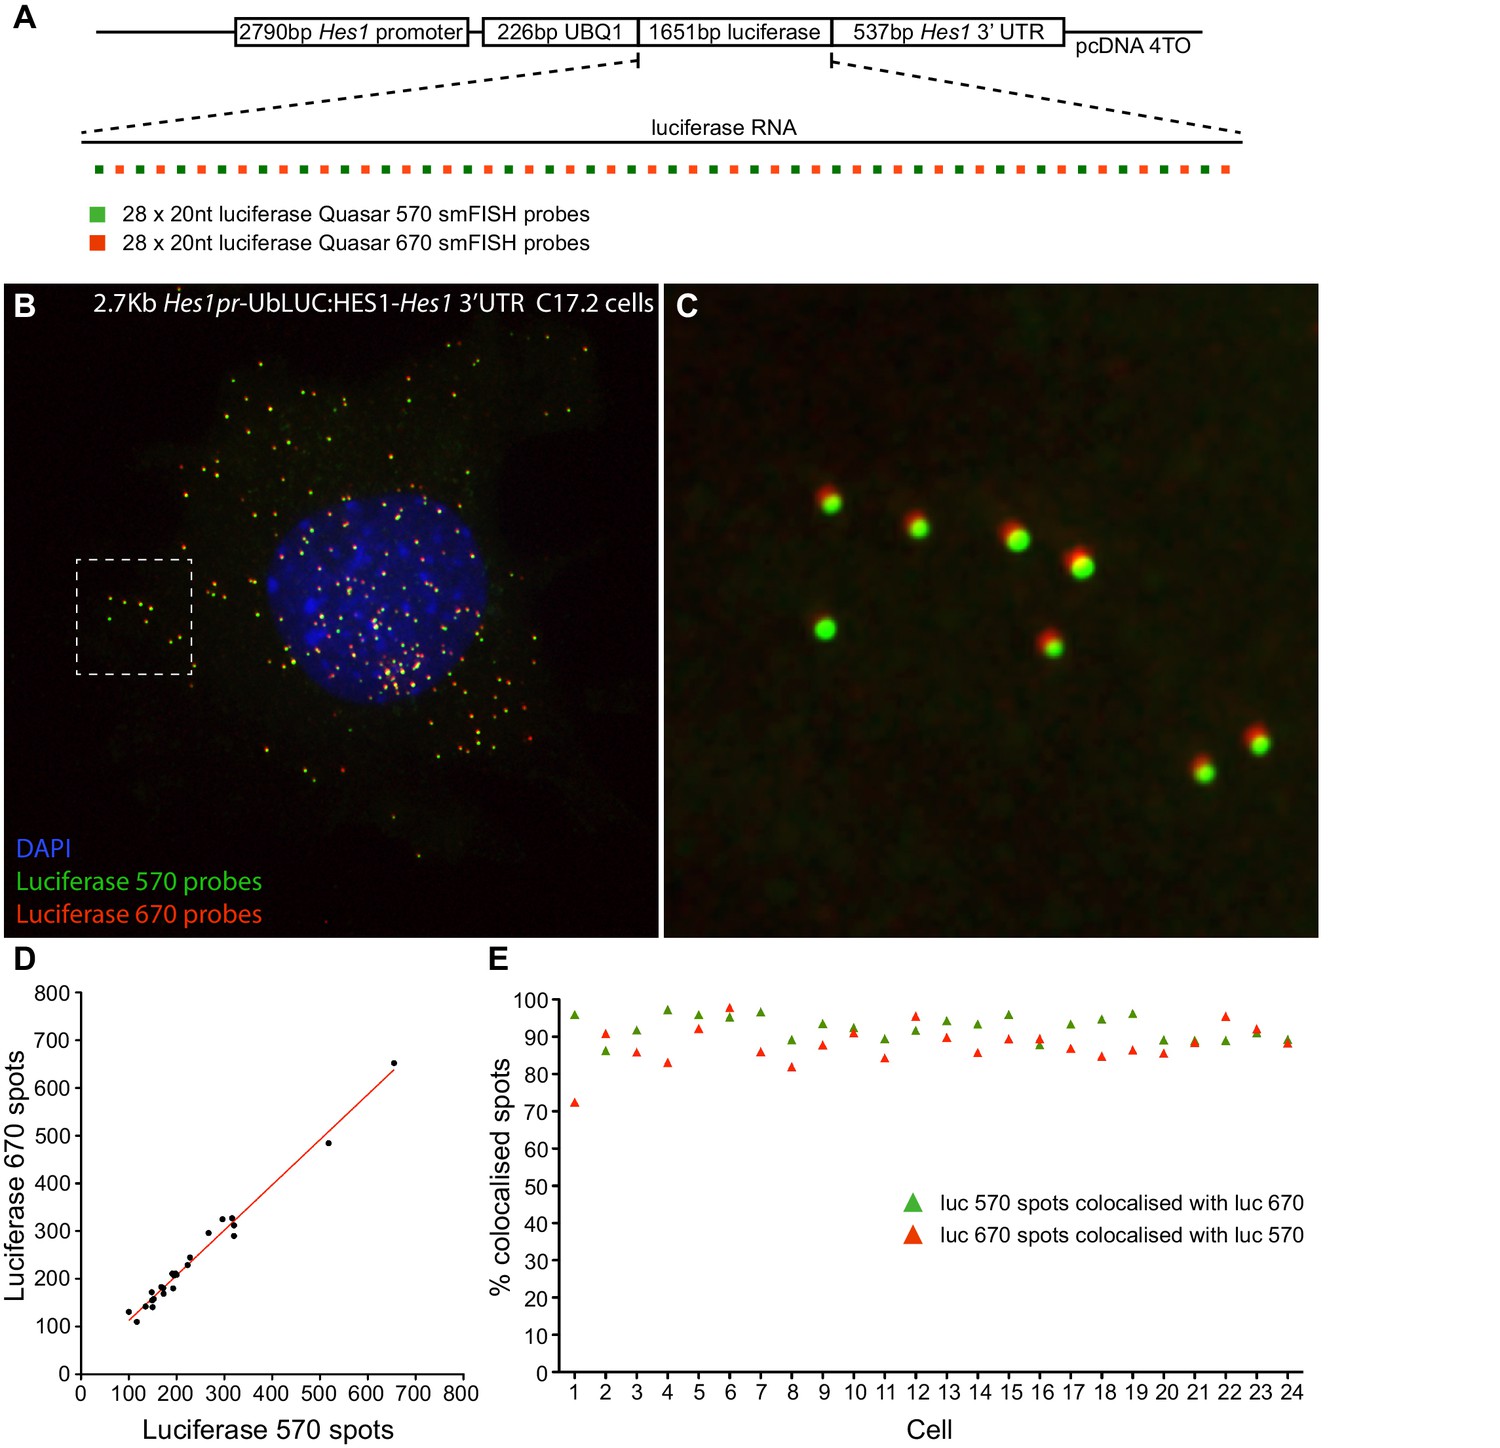
Validation of smFISH accuracy.
(A) To test the reliability of smFISH for accurate single-cell RNA quantification, we analysed spot number detected by two interleaved smFISH probe sets (each comprising 28 x 20 nt probes), targeting luciferase RNAs expressed from a 2.7 kb-Hes1pr-UbLUC:HES1–Hes1 3’UTR construct stably transfected into C17.2 cells (generated in Goodfellow et al. [Goodfellow et al., 2014]). (B) Luciferase Quasar 570 and Quasar 670 smFISH probes simultaneously hybridized to luciferase RNAs in a C17.2 cell. (C) Zoom panel of the region highlighted in B, showing colocalisation of smFISH spots detected with each probe set; there is a slight chromatic shift between channels. (D) smFISH spots detected by each probe set were quantified in 24 cells using the 'analyze spots' function in Imaris. Linear regression analysis confirmed strong agreement in the RNA number detected by each probe set (slope = 0.95 ± 0.03, R = 0.98). (E) To test that the probe sets detected the same RNAs, colocalisation of detected spots was analysed between the two channels. A correction was applied in x, y and z to account for the chromatic shift between channels, then the Imaris XTension 'Spots Colocalize' was performed using a distance of 0.5 μM. This returned 92.5% colocalisation of Quasar 570 spots with Quasar 670 spots, and 88.0% colocalisation of Quasar 670 spots with Quasar 570. smFISH count data contained in Figure 1—source data 3.
Figure 1—figure supplement 3
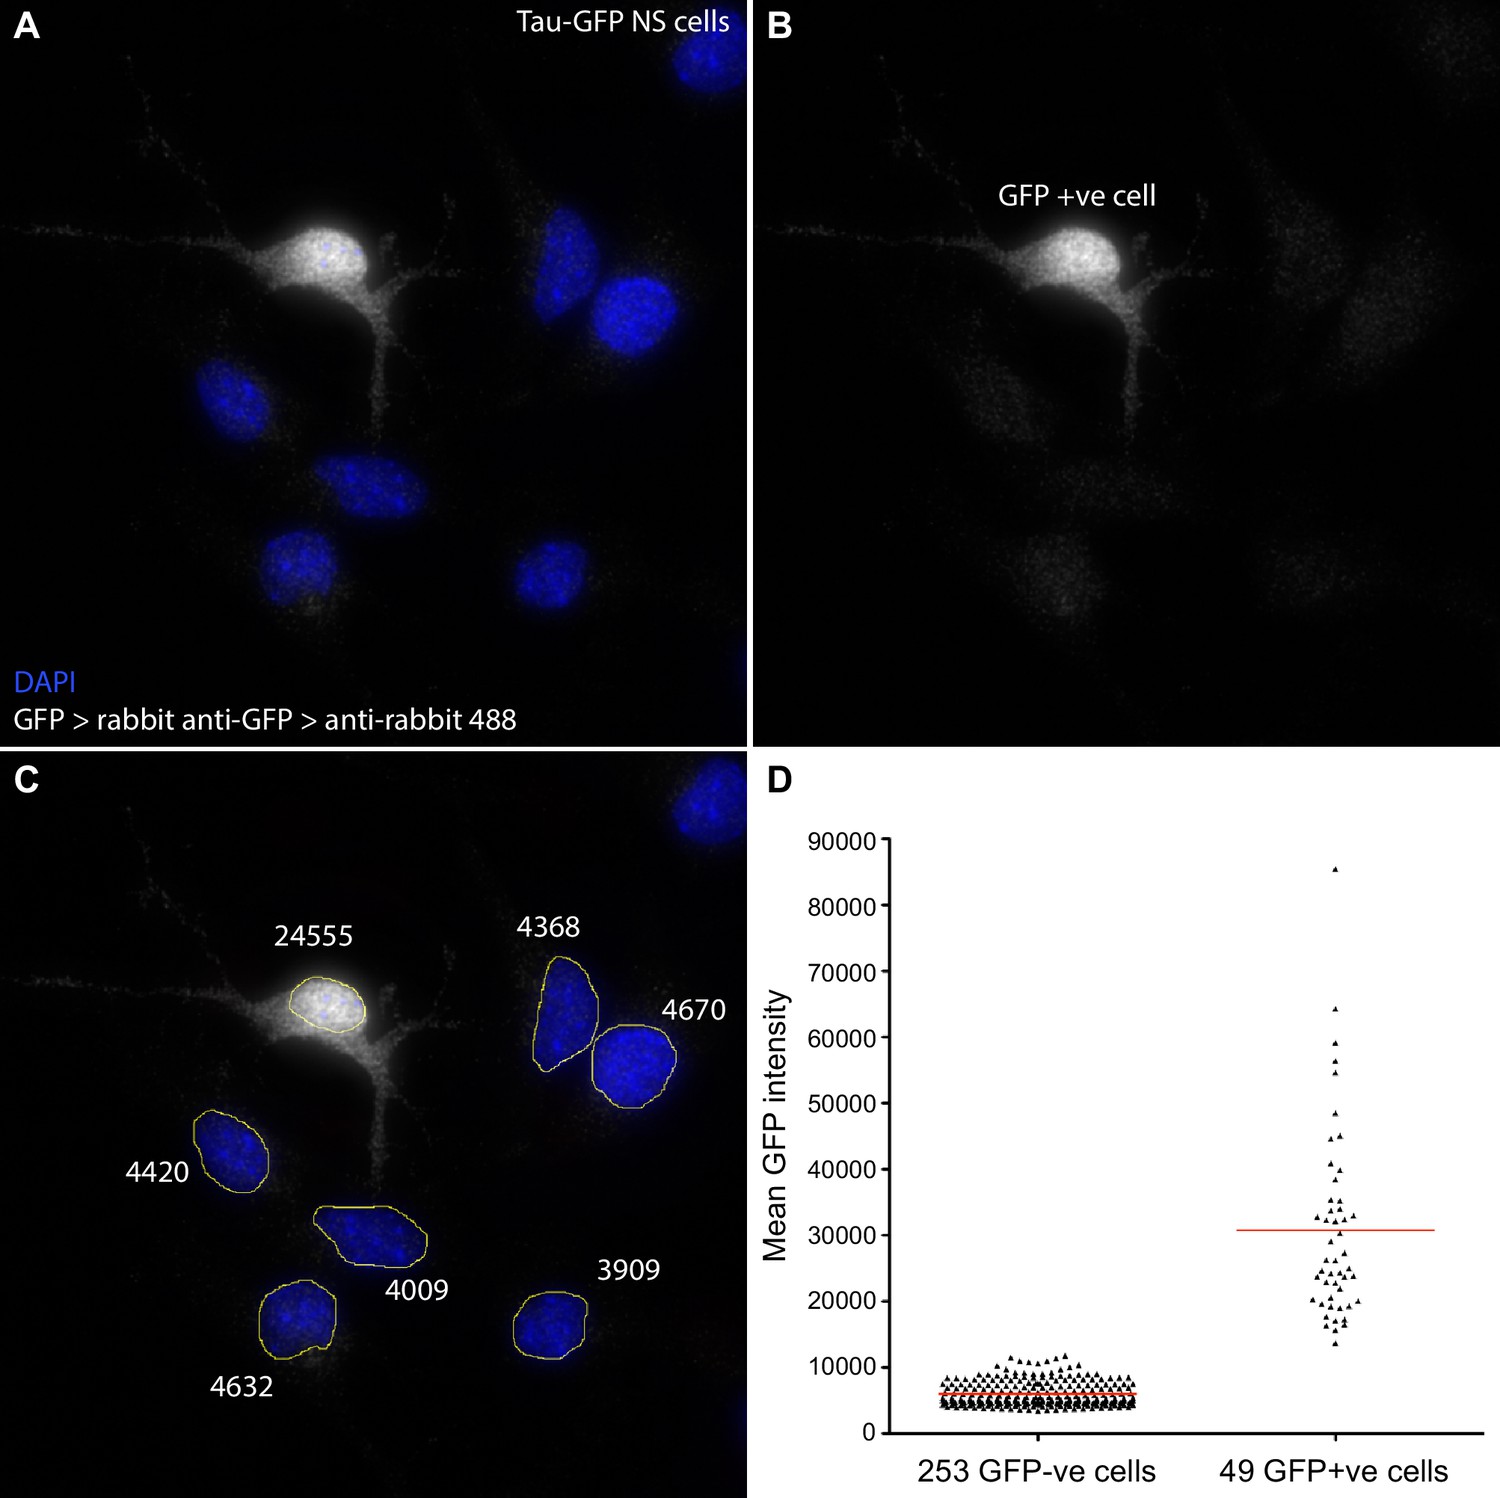
Quantification of GFP signal intensity in Tau-GFP NS cells.
Following smFISH in Tau-GFP NS cells, GFP protein was detected using anti-GFP primary (Life Technologies A11122) and goat anti-rabbit Alexa Fluor 488 secondary antibody (Life Technologies A11008). Z-stacks were sum projected in FIJI, nuclei manually segmented, and mean signal intensity (sum intensity/segmented area) measured. Cells with mean GFP intensity >12000 were classed as GFP positive. (A, B, C) Sample image of a field of Tau-GFP NS cells with DAPI stained nuclei (blue) and immunofluorescent detection of GFP (white). One cell has high mean GFP signal (24555, GFP+ve); other cells show only low signal (∼4000) that may be due to autofluorescence and/or some non-specific antibody binding. (D) Mean GFP intensity measurements for all GFP-ve and GFP+ve cells analysed for Hes1 smFISH in Figure 1E, F. Source data contained in Figure 1—source data 4.
Figure 1—figure supplement 4
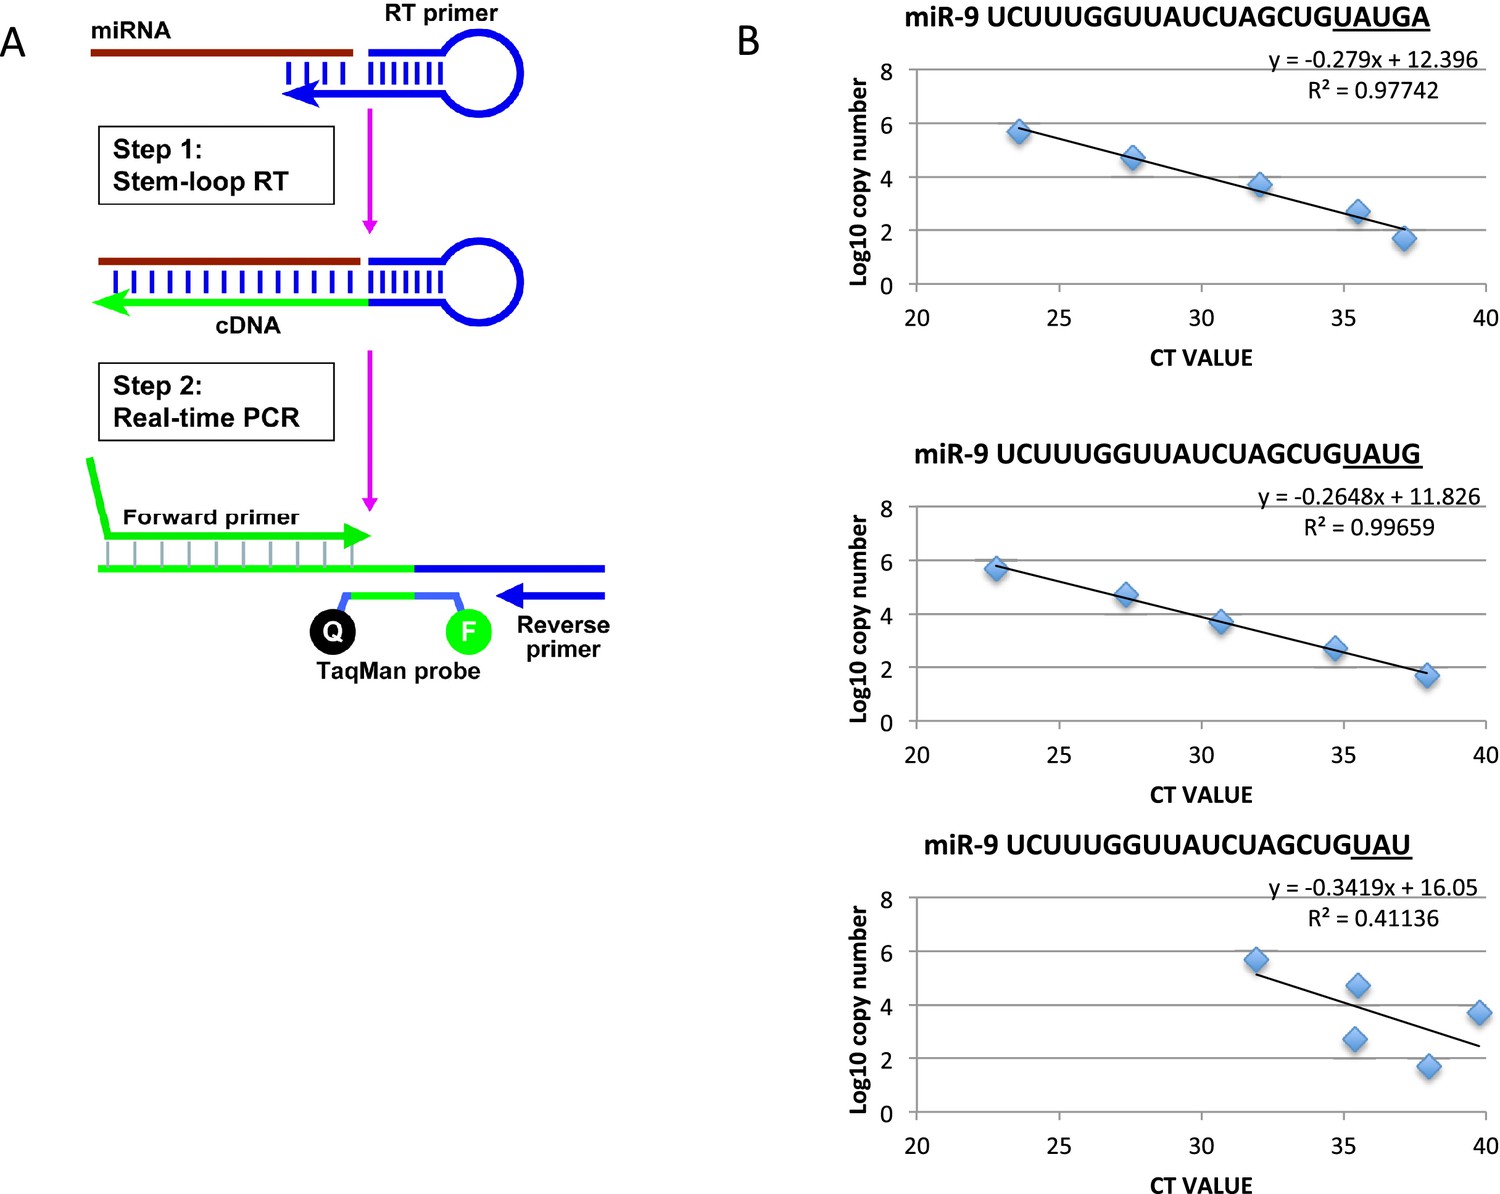
Method to quantify miR-9 copy number.
(A) Diagram showing the process of microRNA reverse transcription (Applied Biosystems TaqMan microRNA Reverse Transcription kit (4366596)) and TaqMan qRT-PCR (TaqMan Fast Advanced master mix reagent (Applied Biosystems 4444557)) using ThermoFisher Scientific’s stem loop primer for mouse miR-9-5p (product 4427975, assay ID 001089). (B) Graphs showing the efficacy of the stem loop primers to reverse transcribe the synthetic mature miR-9 variants as described on miRBase (accession MI0000157, deep sequencing mmu-miR-9-5p accession MIMAT0000142). Only the two longest forms, miR-9 UAUGA and miR-9 UAUG, are reliably reverse transcribed for amplification. This is highlighted by the high R values and by all points of the curve residing on the trend line. The third graph is representative of the other 3 truncated forms tested (miR-9 UAU, UA and U)
Figure 1—figure supplement 5
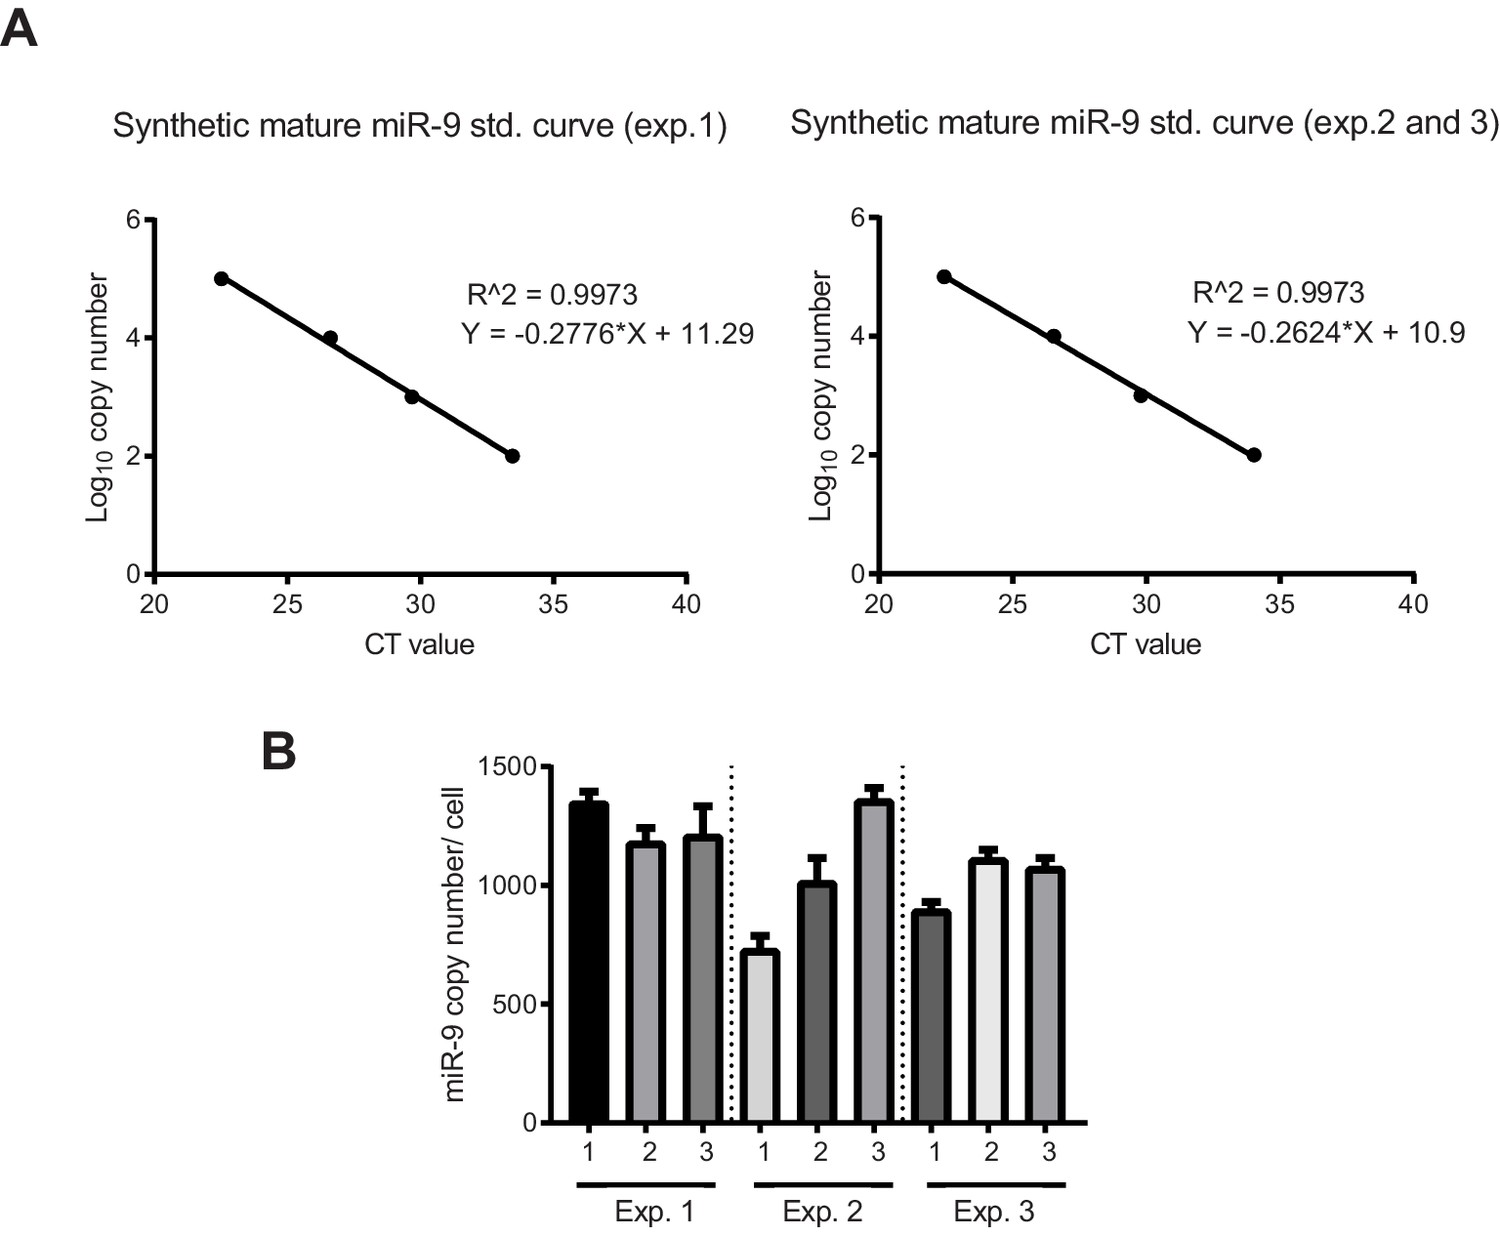
Quantification of miR-9 copy number.
(A) Graphs showing qPCR standard curves generated from known concentrations of synthetic mature miR-9 (3 biological experiments) and linear regression. (B) Graph showing the number of miR-9 molecules per cell in C17.2 progenitors extrapolated from the synthetic miR-9 standard curve in the equivalent biological experiment. 3 technical replicates per biological experiment were analysed. Error bars show S.D of 10 identical samples per technical replicate. The mean and S.E.M (including all samples) is 1100 20 (S.E.M) molecules per cell. Source data contained in Figure 1—source data 5.
Figure 2 with 1 supplement
Quantifying HES1 protein number with FCS.
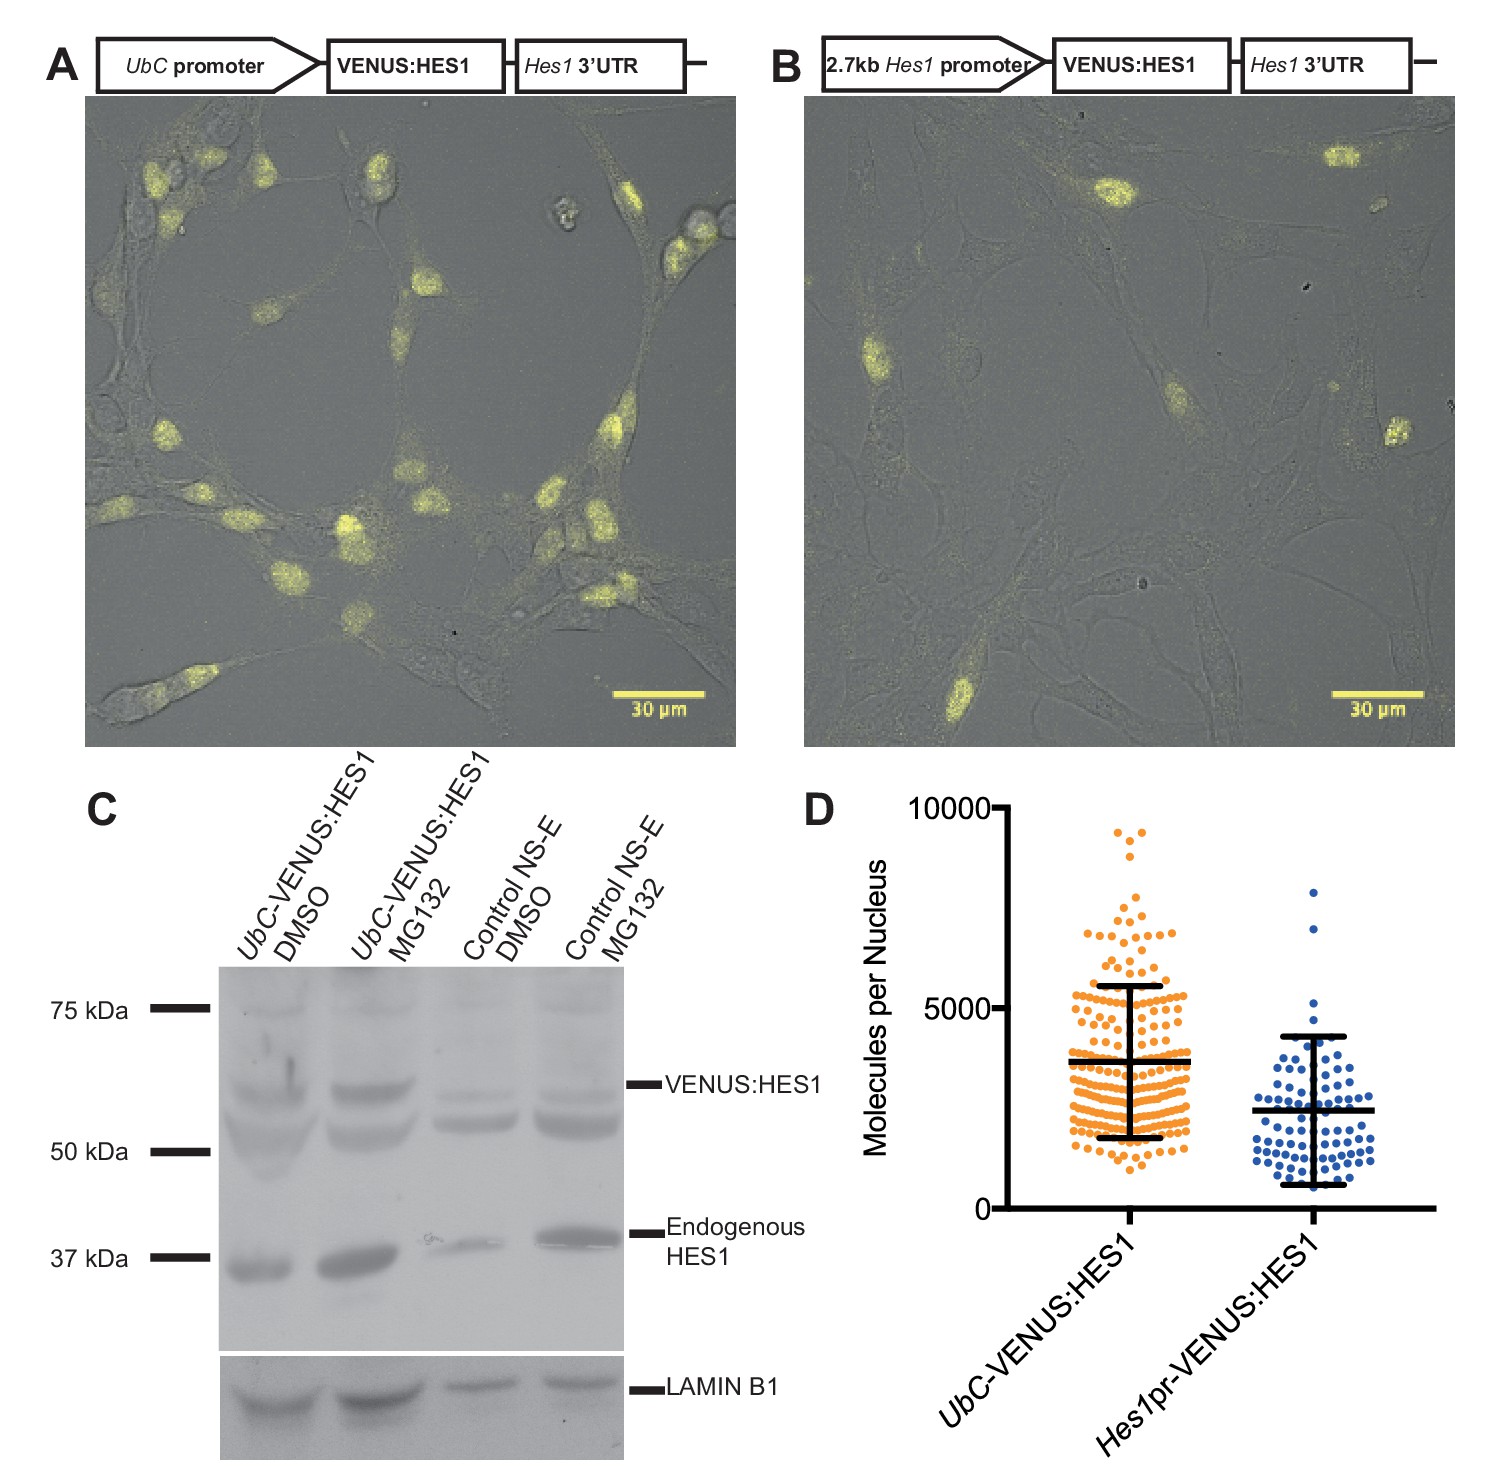
Schematic and image of stably infected NS-E cells containing (A) UbC-VENUS:HES1 reporter construct and (B) 2.7 kb-Hes1pr-VENUS:HES1 reporter construct. VENUS:HES1 signal in yellow. Scale bars show 30 μm. (C) HES1 western blot with LAMIN B1 loading control. Nuclear lysates of NS-E cells stably infected with UbC-VENUS:HES1 or control NS-E cells. Both cell-lines treated with DMSO or 10 μM MG132 proteasome inhibitor for 3 hr. MG132 treated cells show increased HES1 and VENUS:HES1. (D) FCS quantification of VENUS:HES1 molecules per nucleus in stable UbC-VENUS:HES1 and 2.7 kb-Hes1pr-VENUS:HES1 reporter NS-E cell-lines. 236 cells (mean 3660 ± 120 (S.E.M) molecules) and 98 cells (mean 2450 ± 190 (S.E.M) molecules) were analysed in 4 and 2 experiments respectively. Error bars show S.D. FCS data and Western blots at different exposures are contained in Figure 2—source data 1.
-
Figure 2—source data 1
FCS data and Western blots.
- https://doi.org/10.7554/eLife.16118.014
Figure 2—figure supplement 1

Fluorescence Correlation Spectroscopy technique.
(A) Time-series of Venus intensity fluctuations recorded in the confocal volume in NS-E UbC-VENUS:HES1 cells. (B) Auto-correlation function of time-series (A) and data fitting with a two-component model with triplet state.
Figure 3 with 2 supplements
Stochastic simulations of HES1 oscillations match the experimental data better.
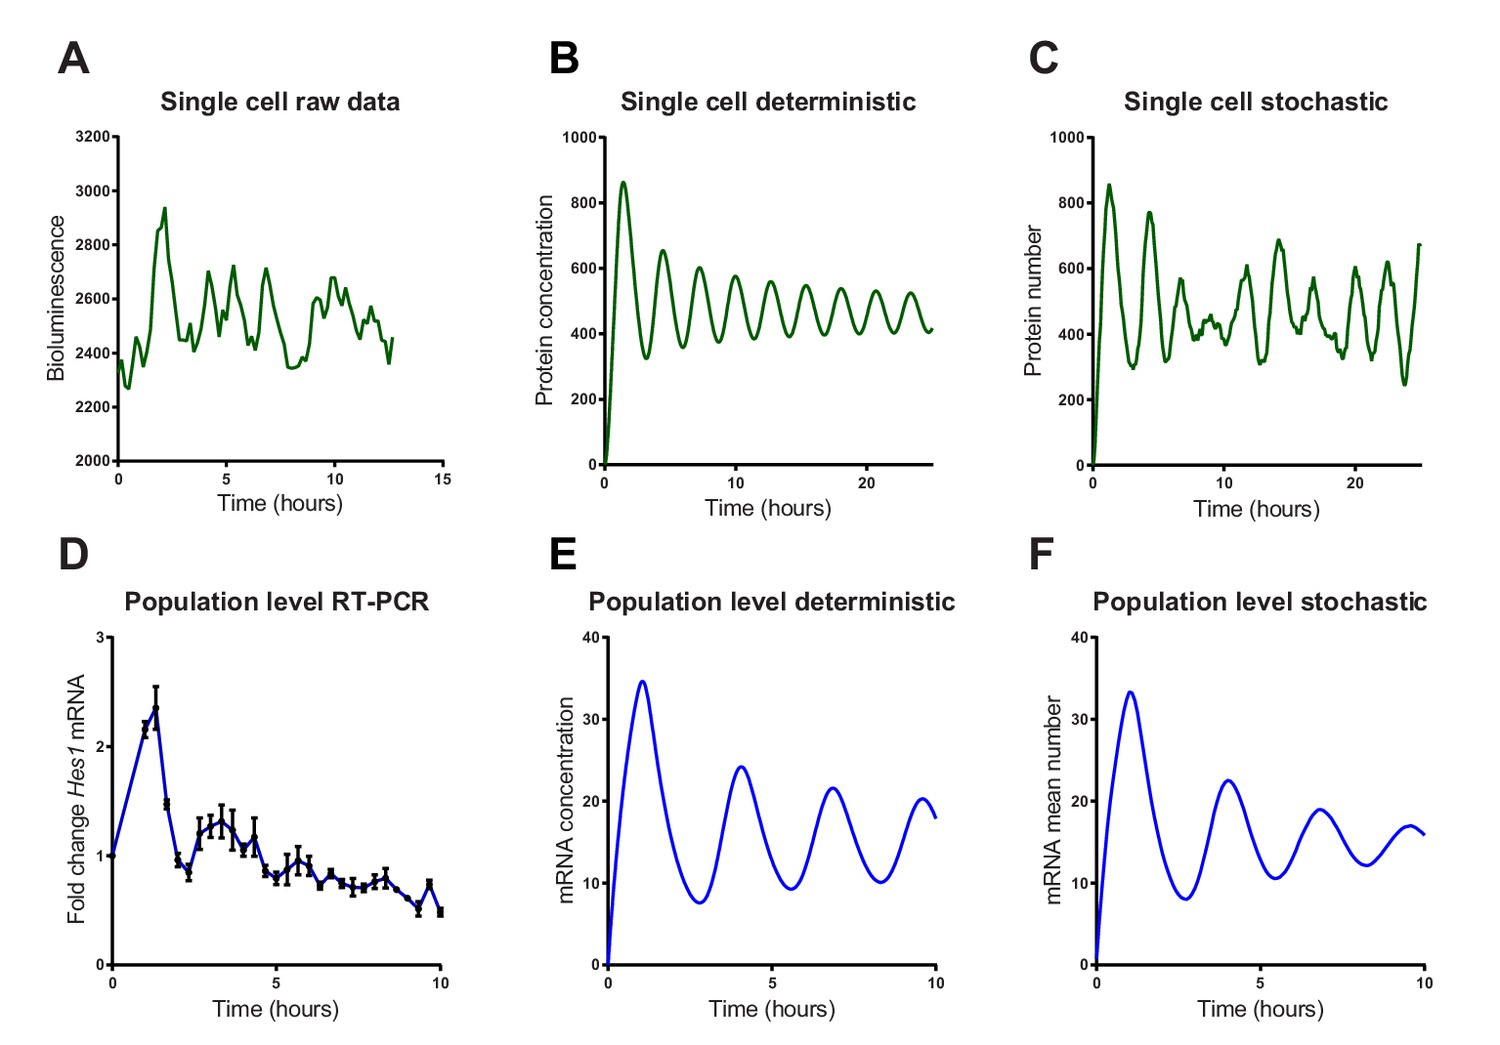
(A) Time series of LUC2:HES1 reporter protein expression in a single primary NS cell determined by bioluminescence imaging. (B) Deterministic simulation of Hes1/miR-9 network at a single-cell level, plot shows HES1 protein concentration as a function of time. (C) Stochastic simulation of Hes1/miR-9 network with the dSSA at a single cell level. (D) q-PCR quantification of endogenous Hes1 mRNA in C17.2 cells at the population level following serum synchronization. Error bars show S.E.M of 2 technical replicates of 2 biological experiments. (E) Population level deterministic simulation of Hes1/miR-9 network through averaging 2000 single-cells, with Hes1 mRNA shown as a function of time. (F) Population level stochastic simulation of Hes1/miR-9 network with the dSSA and averaging over 2000 cells, with Hes1 mRNA shown as a function of time. All simulations performed with parameter set 1 (Appendix 1—table 1) with system size = 1 and initial conditions m(0) = p(0) = r(0) = 0. Note that the computational simulations are less damped than the experimental data, presumably because other sources of variability in experimental data lead to greater damping. MATLAB code and experimental data contained in Figure 3—source data1.
-
Figure 3—source data 1
MATLAB code to simulate the Hes1/miR-9 network with a deterministic or stochastic model (with dSSA).
Includes time series for experimental data.
- https://doi.org/10.7554/eLife.16118.017
-
Figure 3—source data 2
Multiple time series examples of single-cell experimental data.
- https://doi.org/10.7554/eLife.16118.018
Figure 3—figure supplement 1

Bioluminescence images from a single primary LUC2:HES1 NS cell cultured in proliferative conditions.
Corresponds to single-cell LUC2:HES1 time-series data shown in Figure 3A. 16 colours look-up table was used from ImageJ where hot (red) colours show high intensity and cold (blue) colours show low intensity.
Figure 3—figure supplement 2
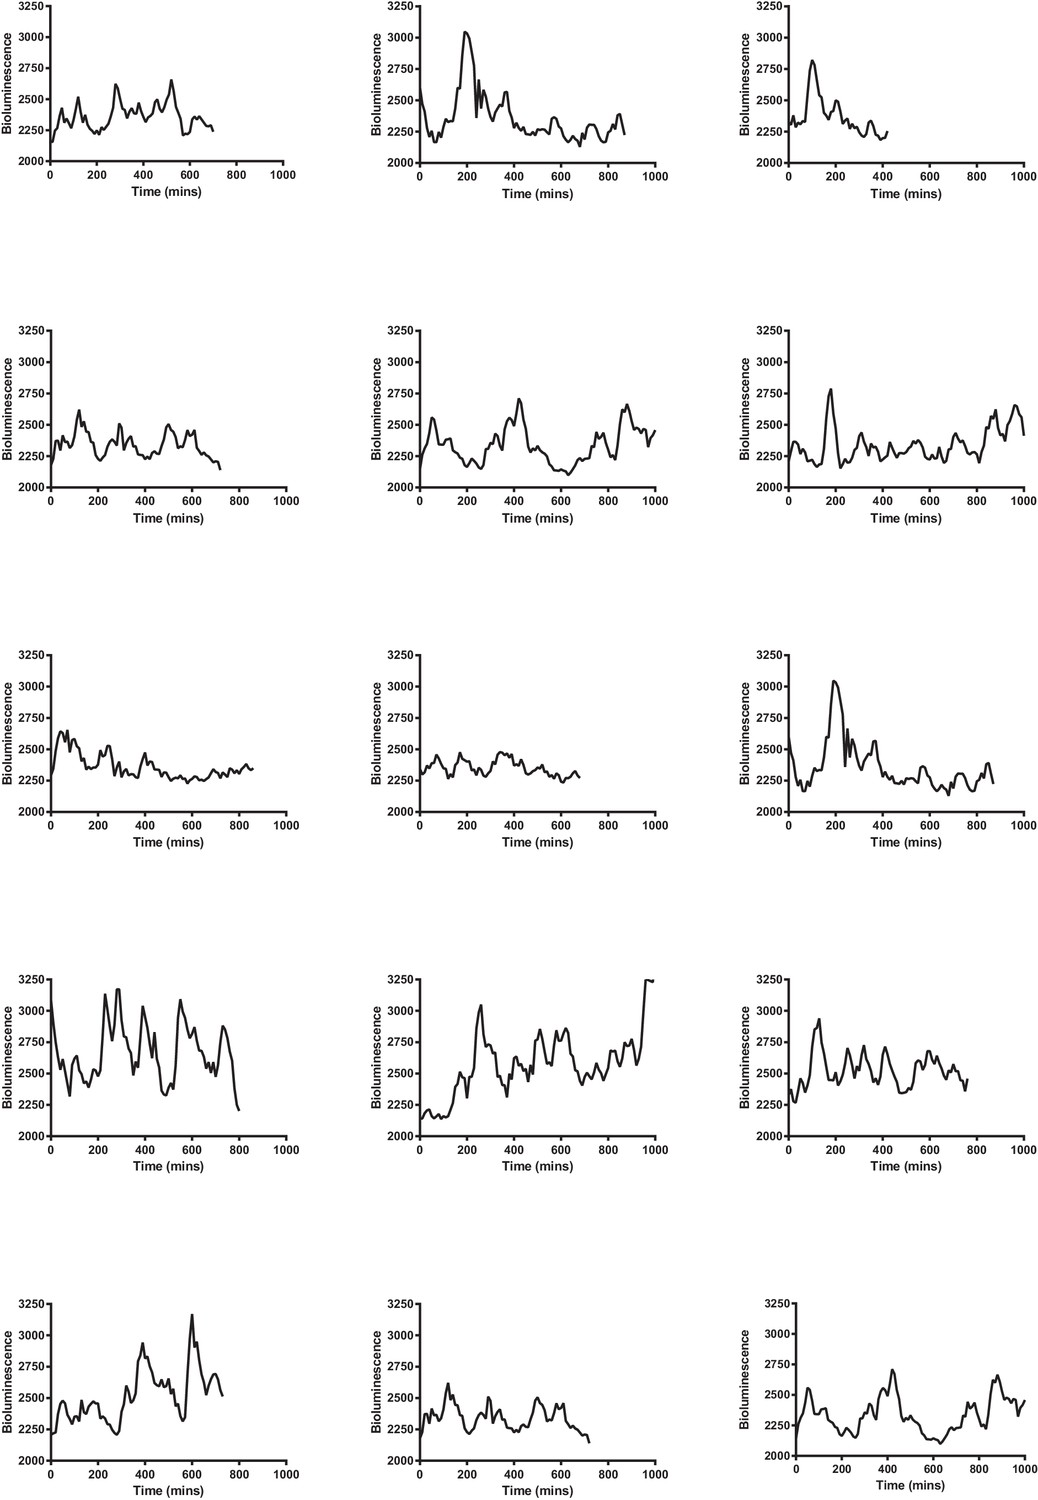
Multiple single-cell time series of LUC2:HES1 reporter protein expression in primary NS cells determined by bioluminescence imaging.
Traces contained in Figure 3—source data 2.
Figure 4 with 1 supplement

The distribution of time-to-differentiation widens at low system sizes.
(A, D, G) Examples of stochastic simulations using the dSSA at =50, 5 and 1, respectively. Blue, mRNA; green, protein; red, miR-9. (B, E, H) The distribution of times to reach the low HES1 protein state of 2000 simulations using the dSSA. (C, F, I) The distribution of times to reach the low HES1 protein state of 2000 simulations using the CLE. Note that even at low system size, the CLE is in excellent agreement with the Gillespie dSSA, which is consistent with previous studies showing that the CLE can be highly accurate when reactions only involve the creation or degradation of one species and act to either increase or decrease the molecule number by one (Grima et al., 2011) and confirms the results. All simulations performed with parameter set 2 (Appendix 1—table 1) and initial conditions m(0) = 20x, p(0) = 400x and r(0) = 0. MATLAB code contained in Figure 4—source data 1.
-
Figure 4—source data 1
MATLAB code for measuring time to differentiation and systematic shift in mean.
- https://doi.org/10.7554/eLife.16118.022
Figure 4—figure supplement 1
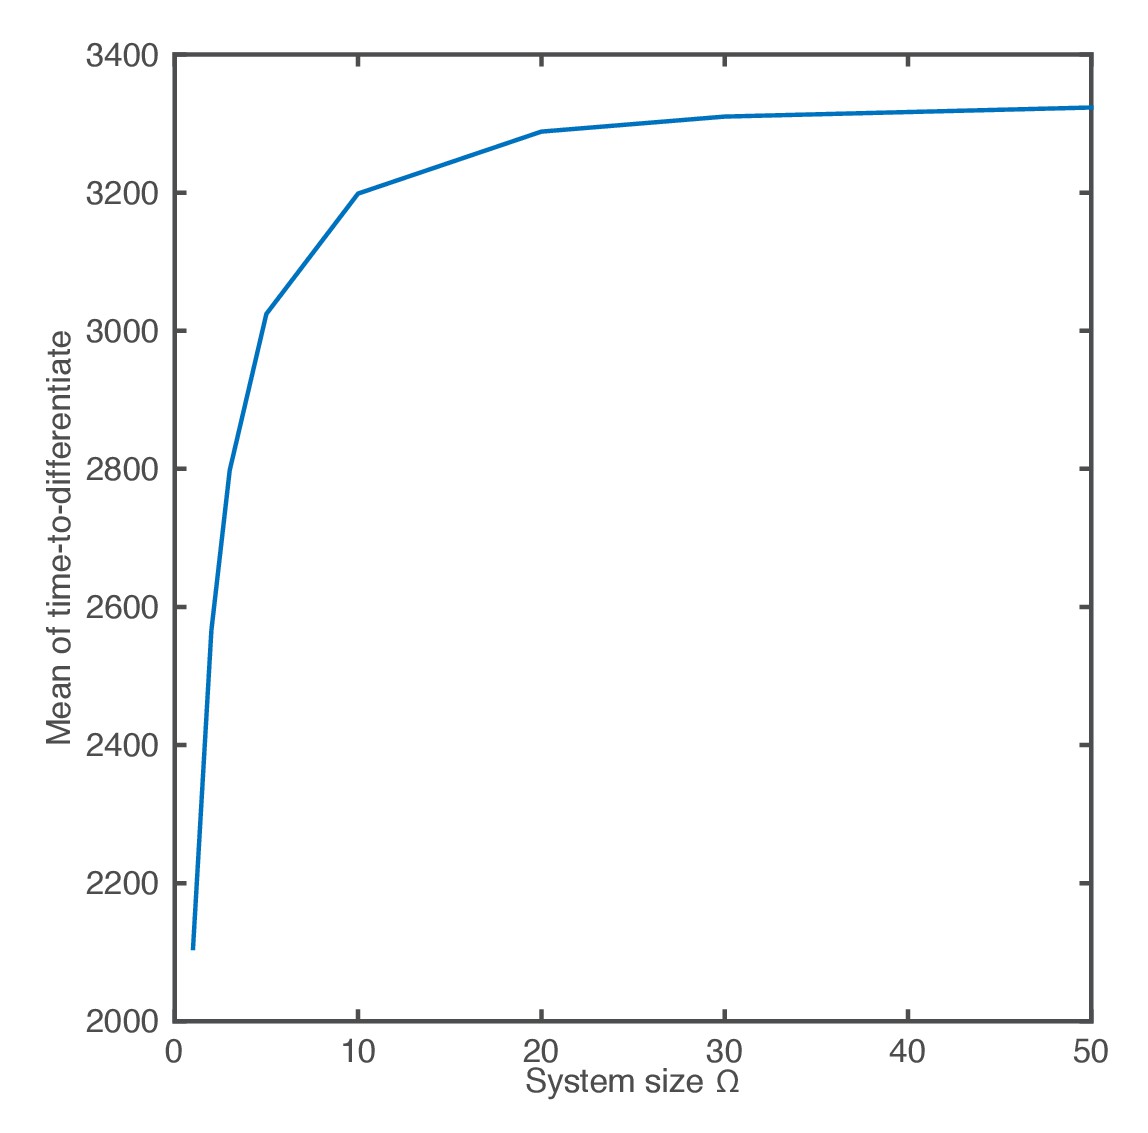
The mean of the time-to-differentiate as a function of the system size.
https://doi.org/10.7554/eLife.16118.023
Figure 5
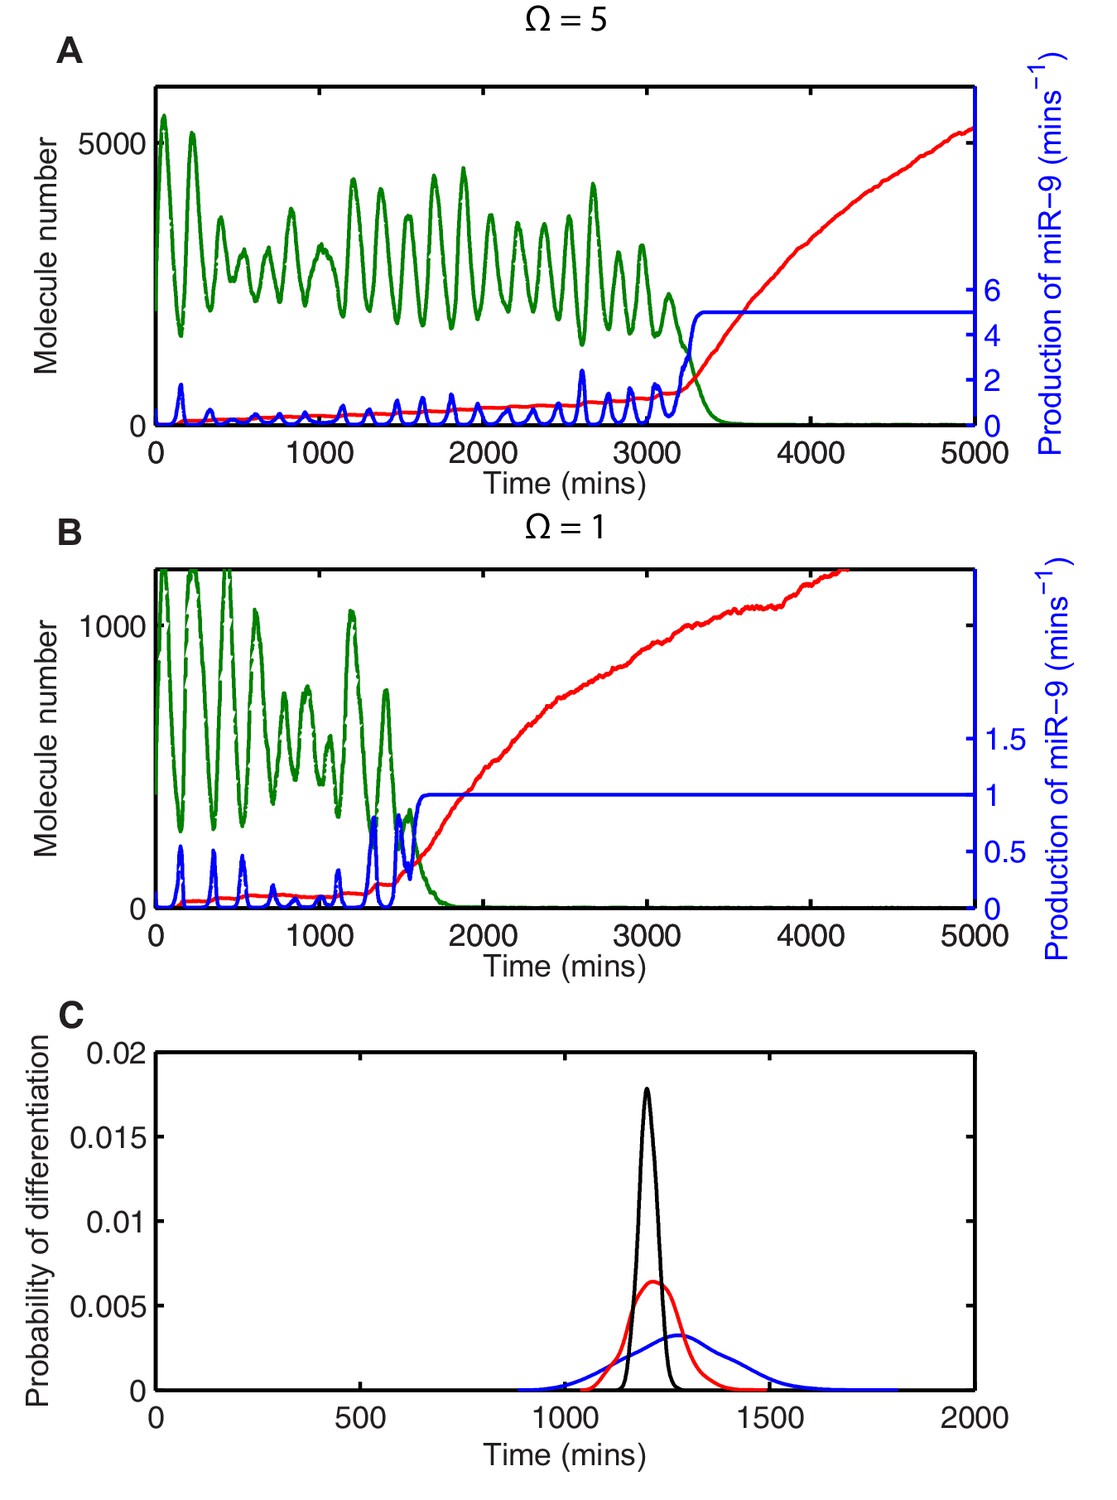
Stochasticity causes systematic changes to the mean time-to-differentiation.
The time course of HES1 protein and miR-9 expression, compared with the production of miR-9 at a system size of (A) =5 or (B) =1 and simulated with the CLE. Green, protein; red, miR-9; blue, production of miR-9. All simulations performed with parameter set 2 (Appendix 1—table 1) and initial conditions m(0) = 20x, p(0) = 400x and r(0) = 0. (C) The distribution of time to reach the low HES1 protein state when = 700, = 0.25. Black, =50; red, =5, blue, = 1. Note that here differentiation is defined to reach a miR-9 high state (r>170), as the transition to the low protein state is much less well defined. MATLAB code contained in Figure 5—source data 1.
-
Figure 5—source data 1
MATLAB code to simulate Hes1/miR-9 network using the CLE with tracked miR-9 production and noise-induced delayed differentiation.
- https://doi.org/10.7554/eLife.16118.025
Figure 6 with 2 supplements
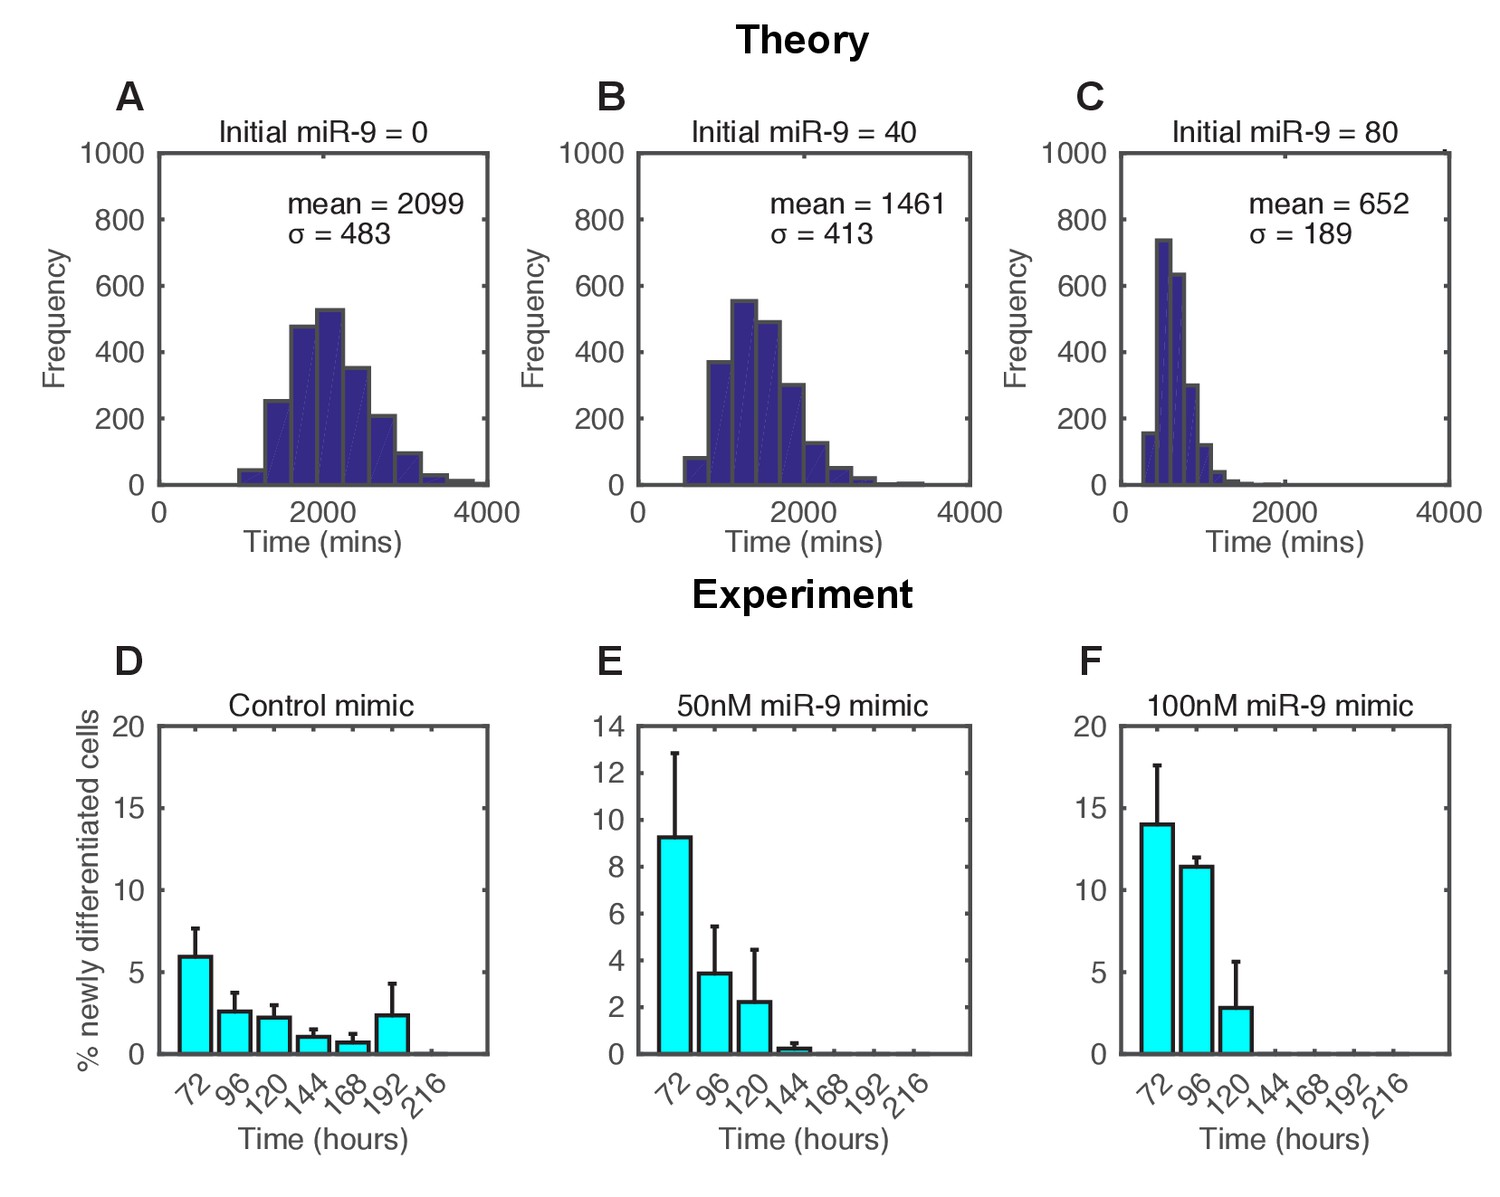
The spread of time-to-differentiation decreases in both the computational model and experiments with increased initial miR-9.
(A, B, C) The distribution of times to reach the low HES1 state of 3000 simulations using initial conditions of miR-9 r(0) = 0, 40 and 80, respectively. The initial conditions of mRNA and protein were m(0) = 20x, p(0) = 400x. All simulations performed with parameter set 2 (Appendix 1—table 1) with system size = 1 and using the CLE. (D, E, F) Newly differentiated Tuj1 positive C17.2 cells compared to previous time point as a percentage of the population. Cells were transfected with 100 nM control mimic or 50 nM and 100 nM miR-9 mimic, respectively. Cells were cultured in serum-free differentiation conditions for the time shown. 5 images analysed per condition in at least 2 experiments. MATLAB code and experimental data contained in Figure 6—source data 1.
-
Figure 6—source data 1
MATLAB code to simulate timing to differentiation with different initial conditions of miR-9.
Includes experimental data for the spread of differentiation of C17.2 cells.
- https://doi.org/10.7554/eLife.16118.027
-
Figure 6—source data 2
Data for the speed up of differentiation in C17.2 cells with added miR-9.
- https://doi.org/10.7554/eLife.16118.028
-
Figure 6—source data 3
Data for the speed up of differentiation in NS cells measured with FACS.
- https://doi.org/10.7554/eLife.16118.029
Figure 6—figure supplement 1
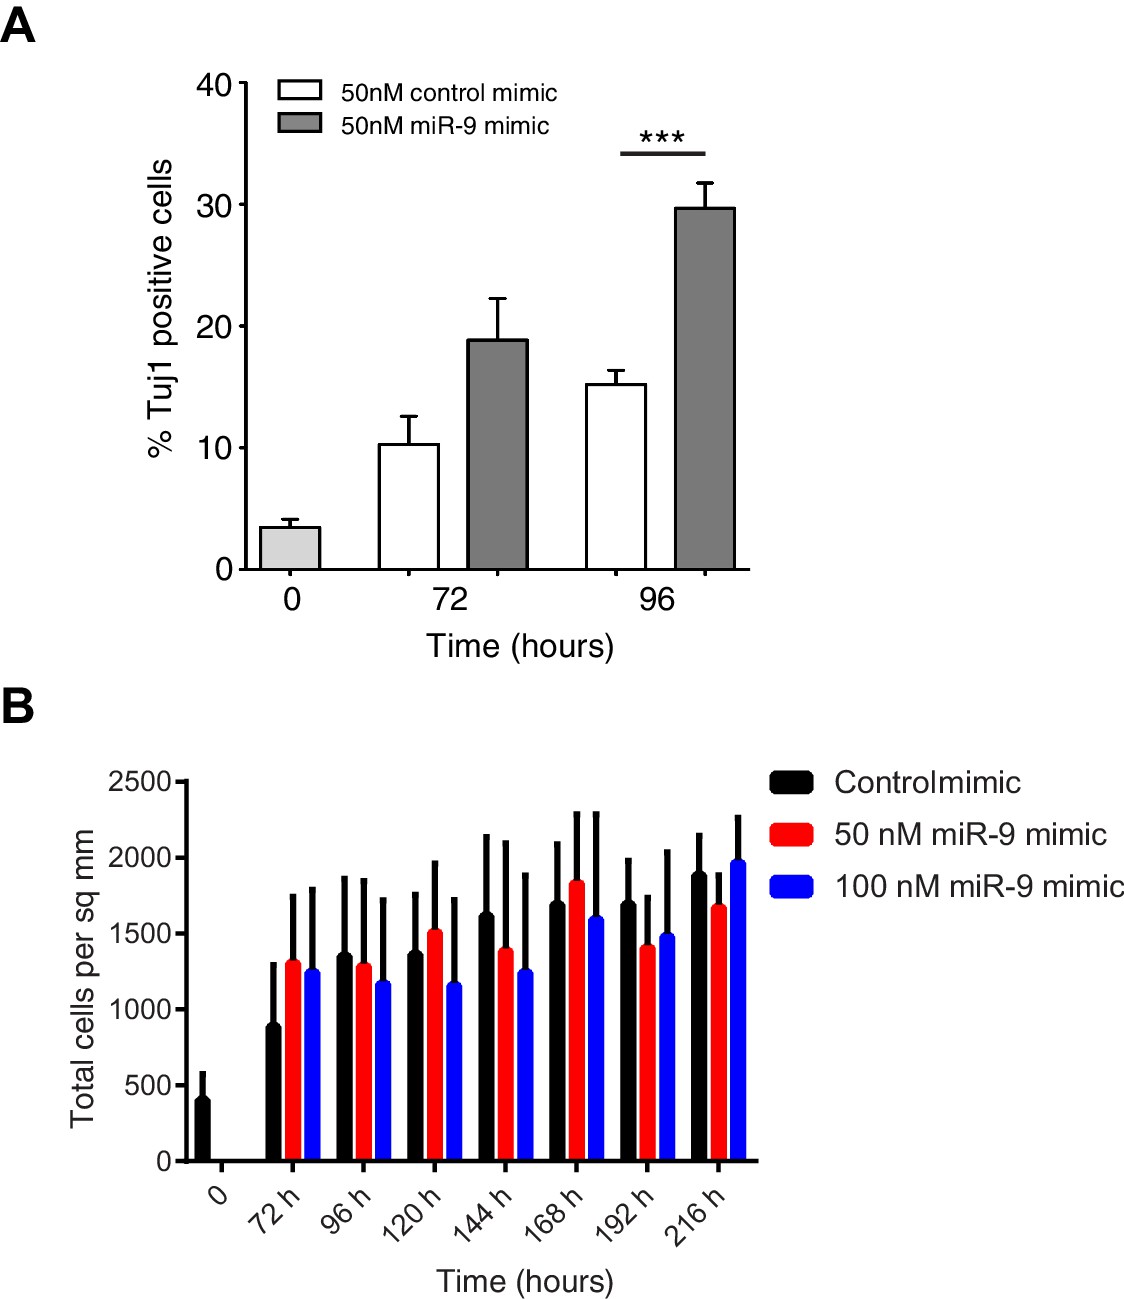
Increased miR-9 shifts timing of differentiation earlier in C17.2 neural progenitor cells.
(A) Percentage of Tuj1 positive neurons in differentiated C17.2 cells after transfection of 50 nM miR-9 mimic or control mimic and culture in serum-free differentiation conditions. Significance tested in one-way ANOVA with Holm-Sidak multiple comparison correction. Significance: *p<0.05; **p<0.01; ***p<0.001. 5 images analysed per condition in 2 biological replicates. Error bars show S.E.M. (B) The density of cells after transfection of negative control mimic or 50 nM and 100 nM miR-9 mimic and culture in serum-free differentiation conditions. No differences within a given time point are statistically significant, where significance is tested in a two-way ANOVA with Tukey multiple comparison correction. Source data contained in Figure 6—source data 2.
Figure 6—figure supplement 2
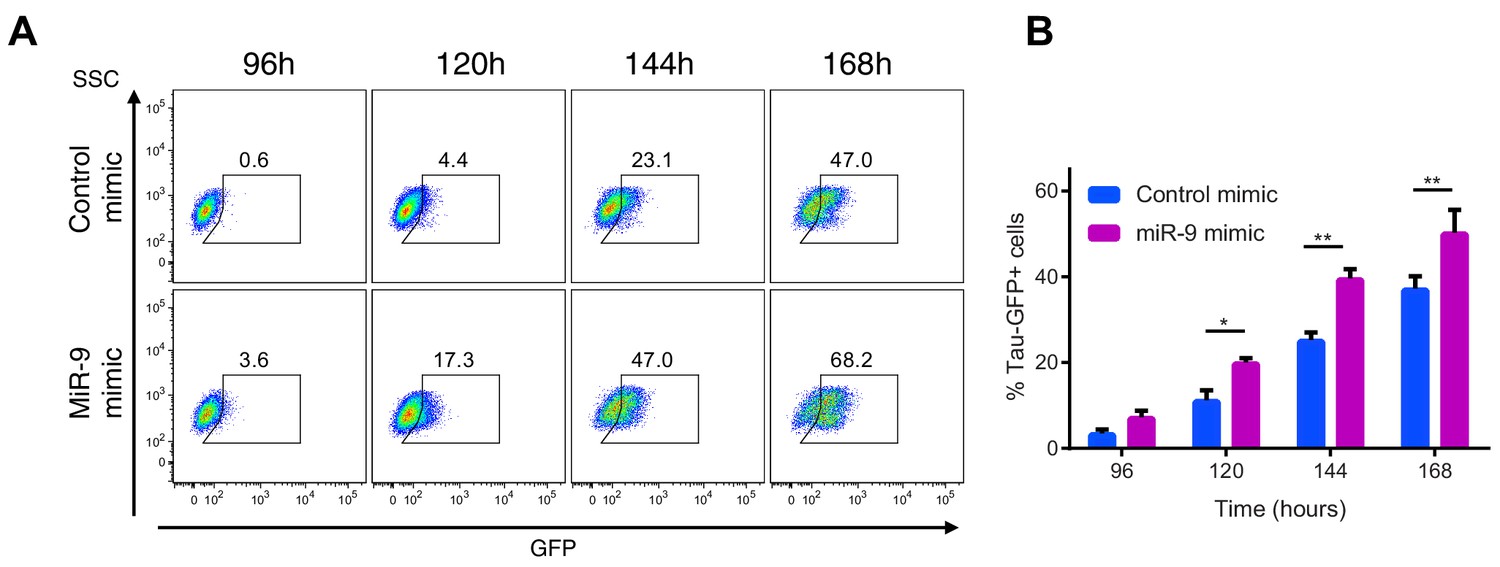
Increased miR-9 shifts timing of differentiation earlier in NS cells.
(A) Representative flow cytometry plots showing the percentage of GFP positive neurons during neuronal differentiation of Tau-GFP NS cells after transfection of 40 nM miR-9 mimic or control mimic. Time-points represent hours after the onset of neuronal differentiation. SSC: side scatter (B) Frequency of GFP positive neurons following treatment of Tau-GFP NS cells with 40 nM miR-9 mimic or control mimic (n=5 biological replicates). Significance tested in one-way ANOVA with Holm-Sidak multiple comparison correction. Significance: *p<0.05; **p<0.01; ***p<0.001.Error bars show S.E.M. Source data contained in Figure 6—source data 3.
Figure 7 with 2 supplements
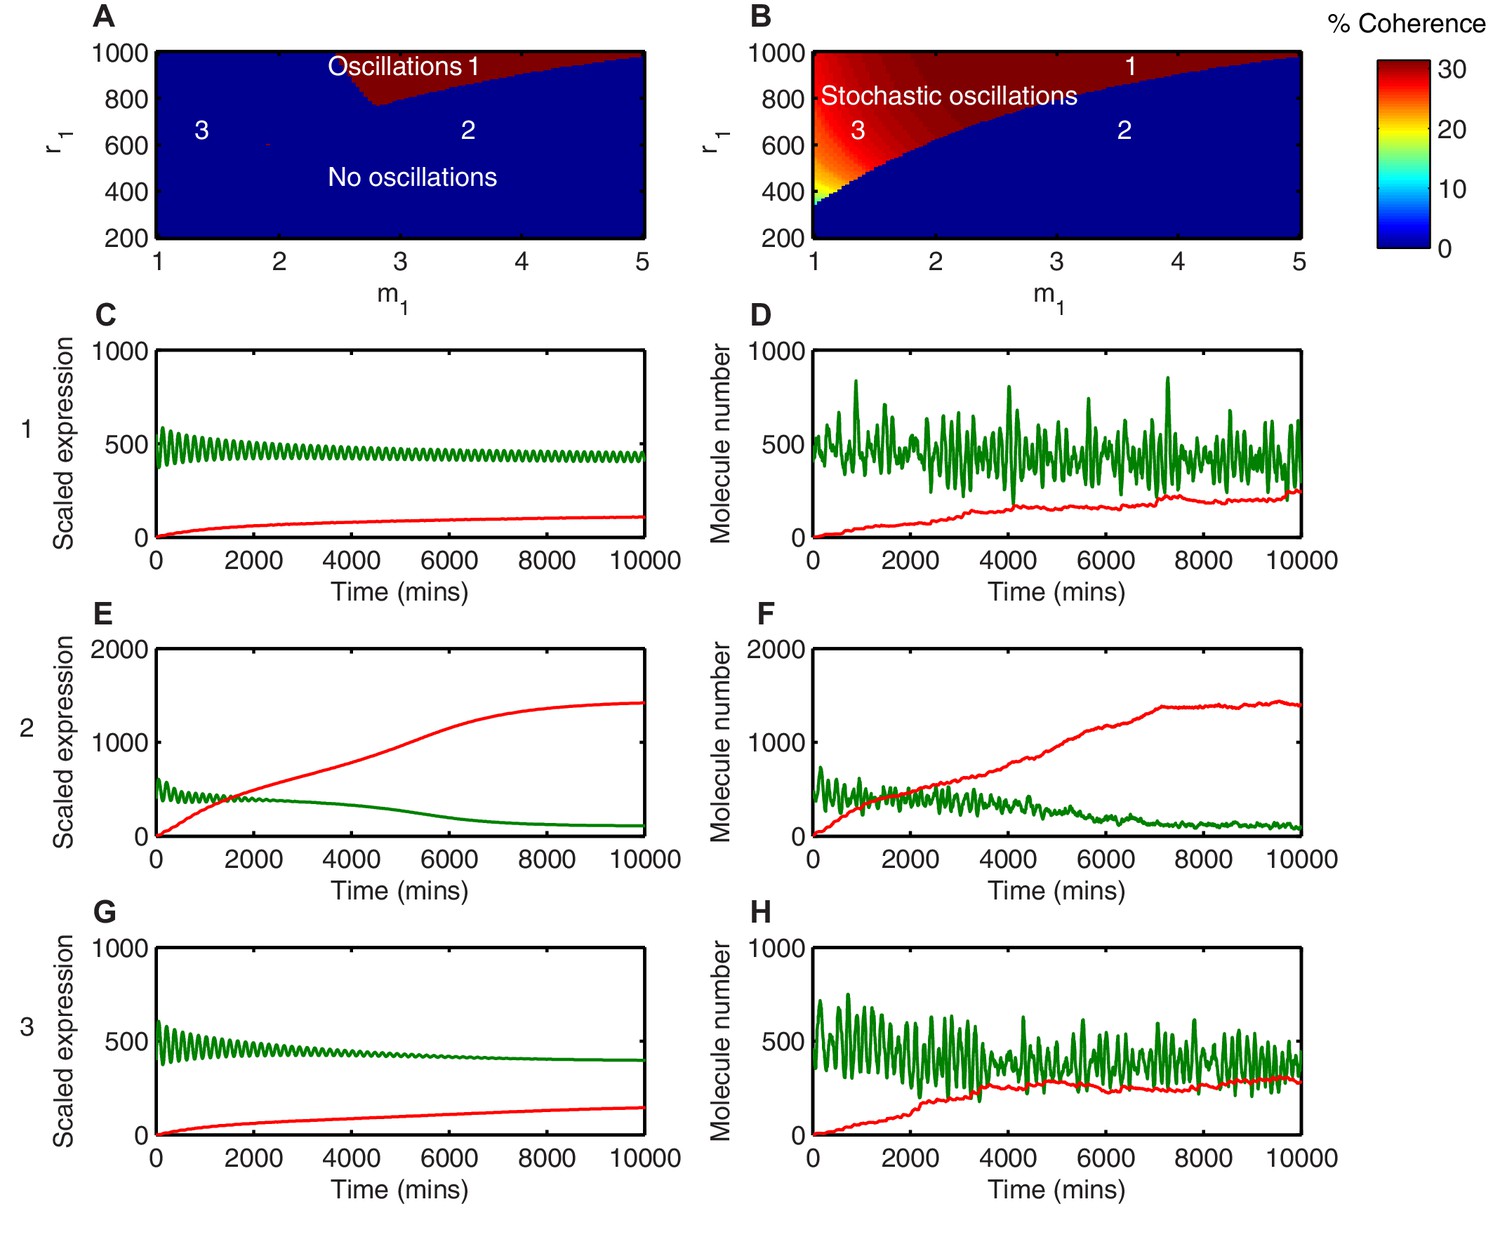
Stochasticity increases the parameter space where HES1 oscillates.
(A) The areas of HES1 protein oscillations in the deterministic system, as a function of translation repression Hill co-efficient () and translation repression threshold (). (B) The areas of HES1 protein oscillations in the stochastic system at the steady state as calculated by the LNA. The colour scale represents the coherence of the stochastic oscillations. (C, E, G) Deterministic simulations of the system for point 1 ( = 3.5, = 900), point 2 ( = 3.5, = 600) and point 3 ( = 1.5, = 600), respectively. Green, Protein; red, miR-9. (D, F, H) Stochastic simulations (dSSA) of the system for point 1 ( = 3.5, = 900), point 2 ( = 3.5, = 600) and point 3 ( = 1.5, = 600), respectively. All simulations performed with parameter set 1 (Appendix 1—table 1) and initial conditions m(0) = 20x, p(0) = 400x and r(0) = 0. MATLAB code contained in Figure 4—source data 1.
-
Figure 7—source data 1
MATLAB code to scan parameters for deterministic and stochastic oscillations.
- https://doi.org/10.7554/eLife.16118.033
-
Figure 7—source data 2
MATLAB code to generate power spectra of examples.
- https://doi.org/10.7554/eLife.16118.034
Figure 7—figure supplement 1
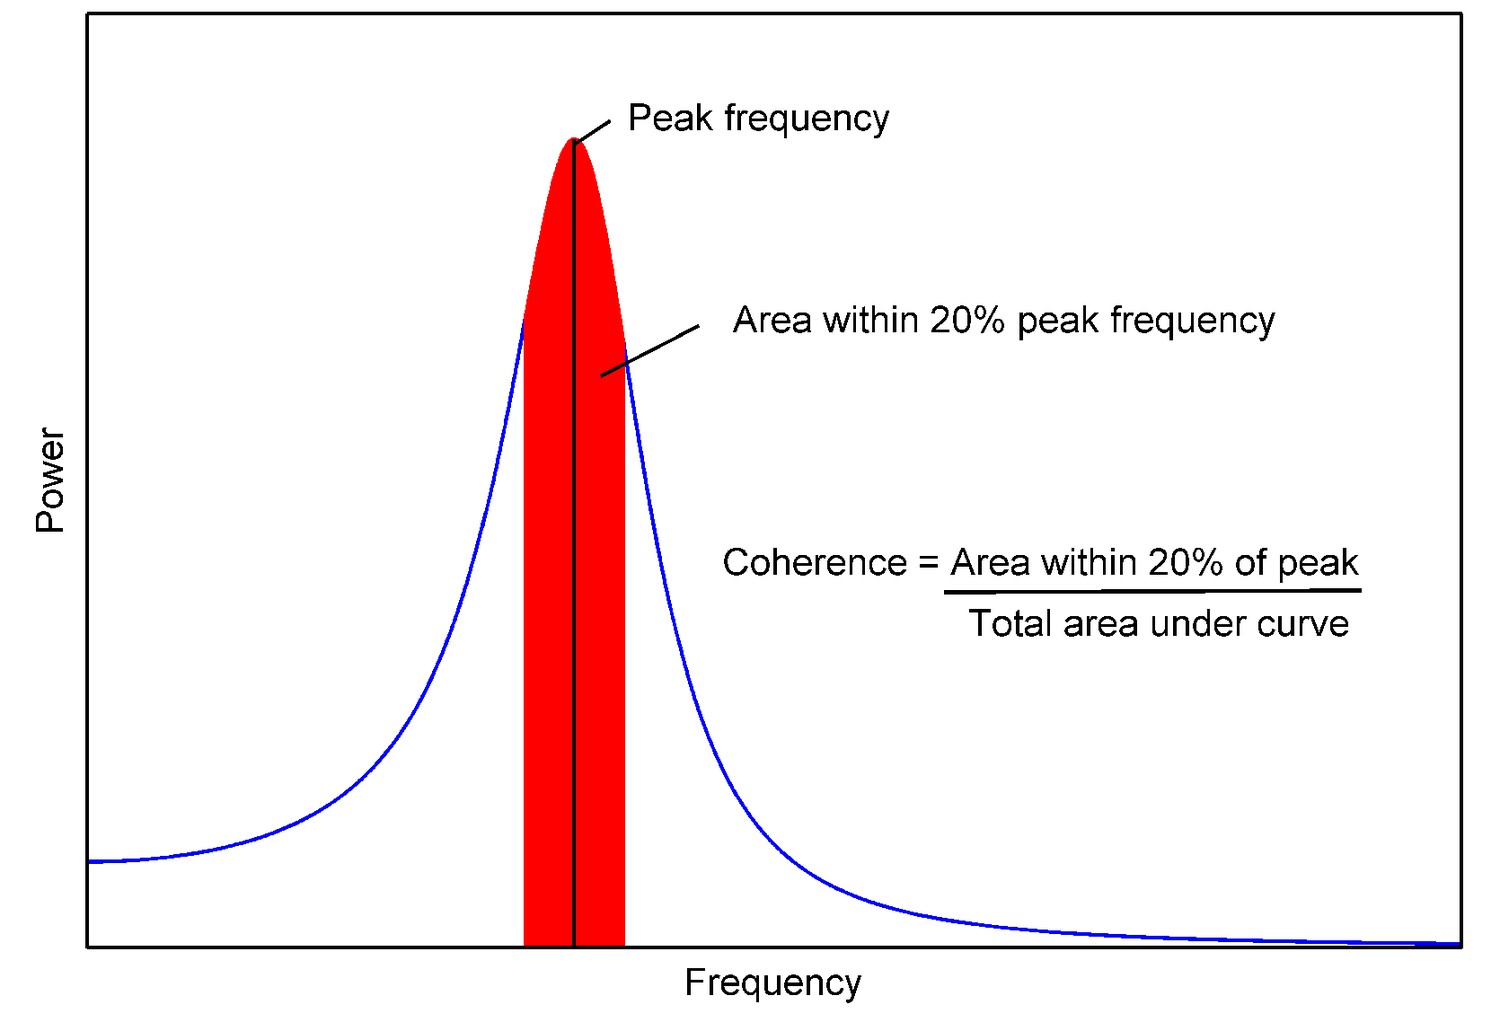
Coherence of a power spectrum.
https://doi.org/10.7554/eLife.16118.035
Figure 7—figure supplement 2
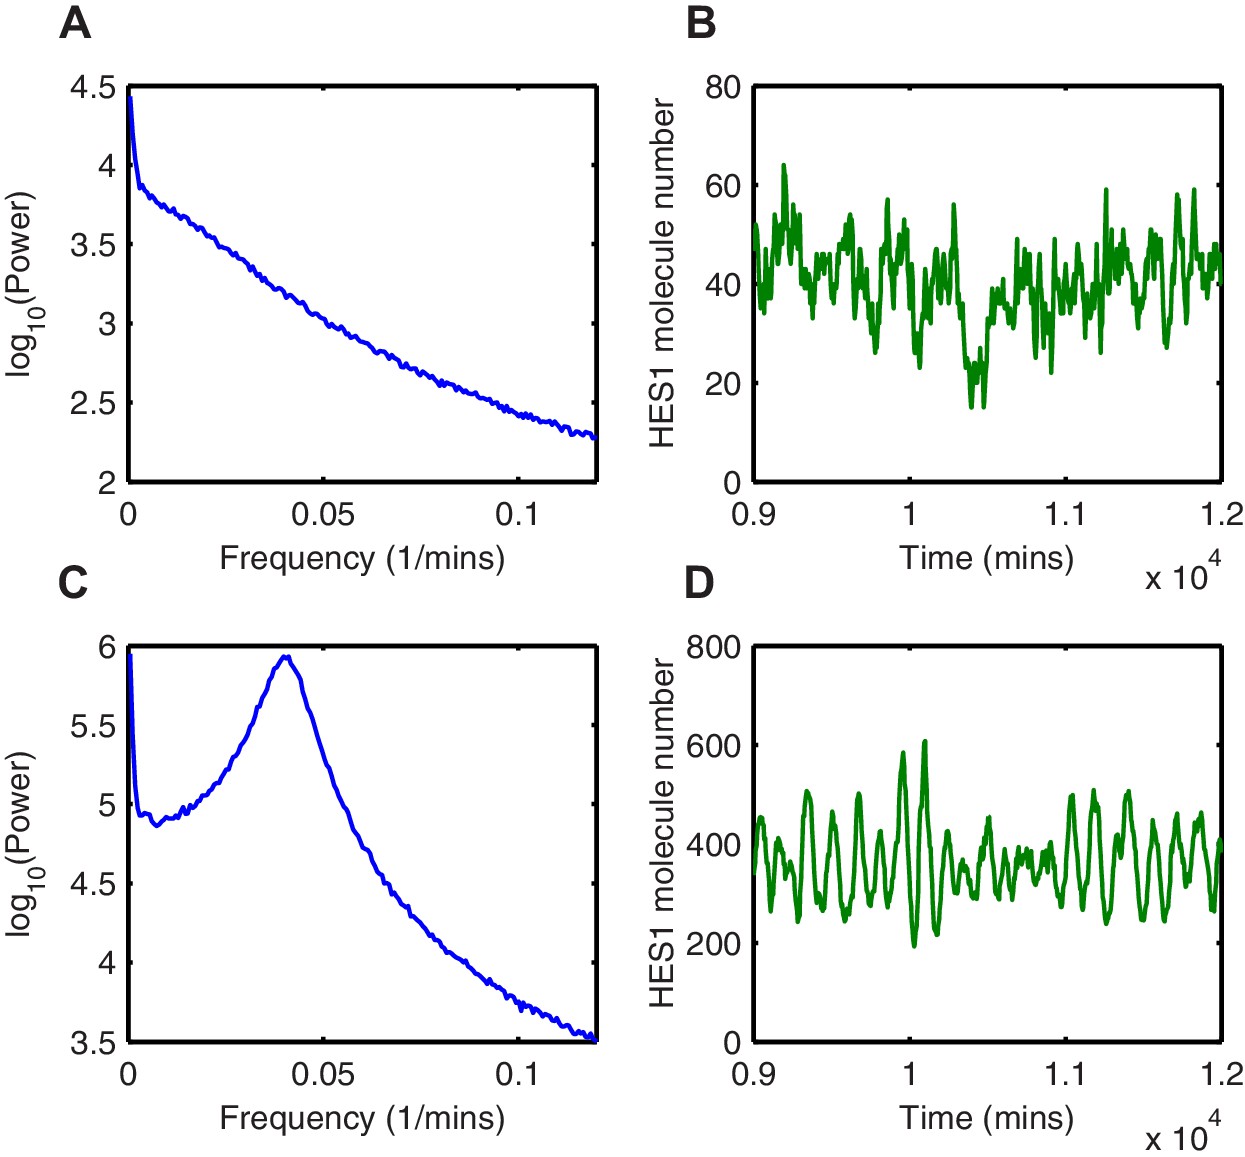
Random fluctuations are distinct from stochastic oscillations.
(A, C) The power spectrum of HES1 protein oscillations calculated using the average of 1000 simulations with the dSSA (blue), for = 3.5, = 600 and = 1.5, = 600, respectively. (B, D) HES1 protein dynamics after the accumulation of miR-9 simulated with the dSSA to (A) and (C), respectively.
Figure 8
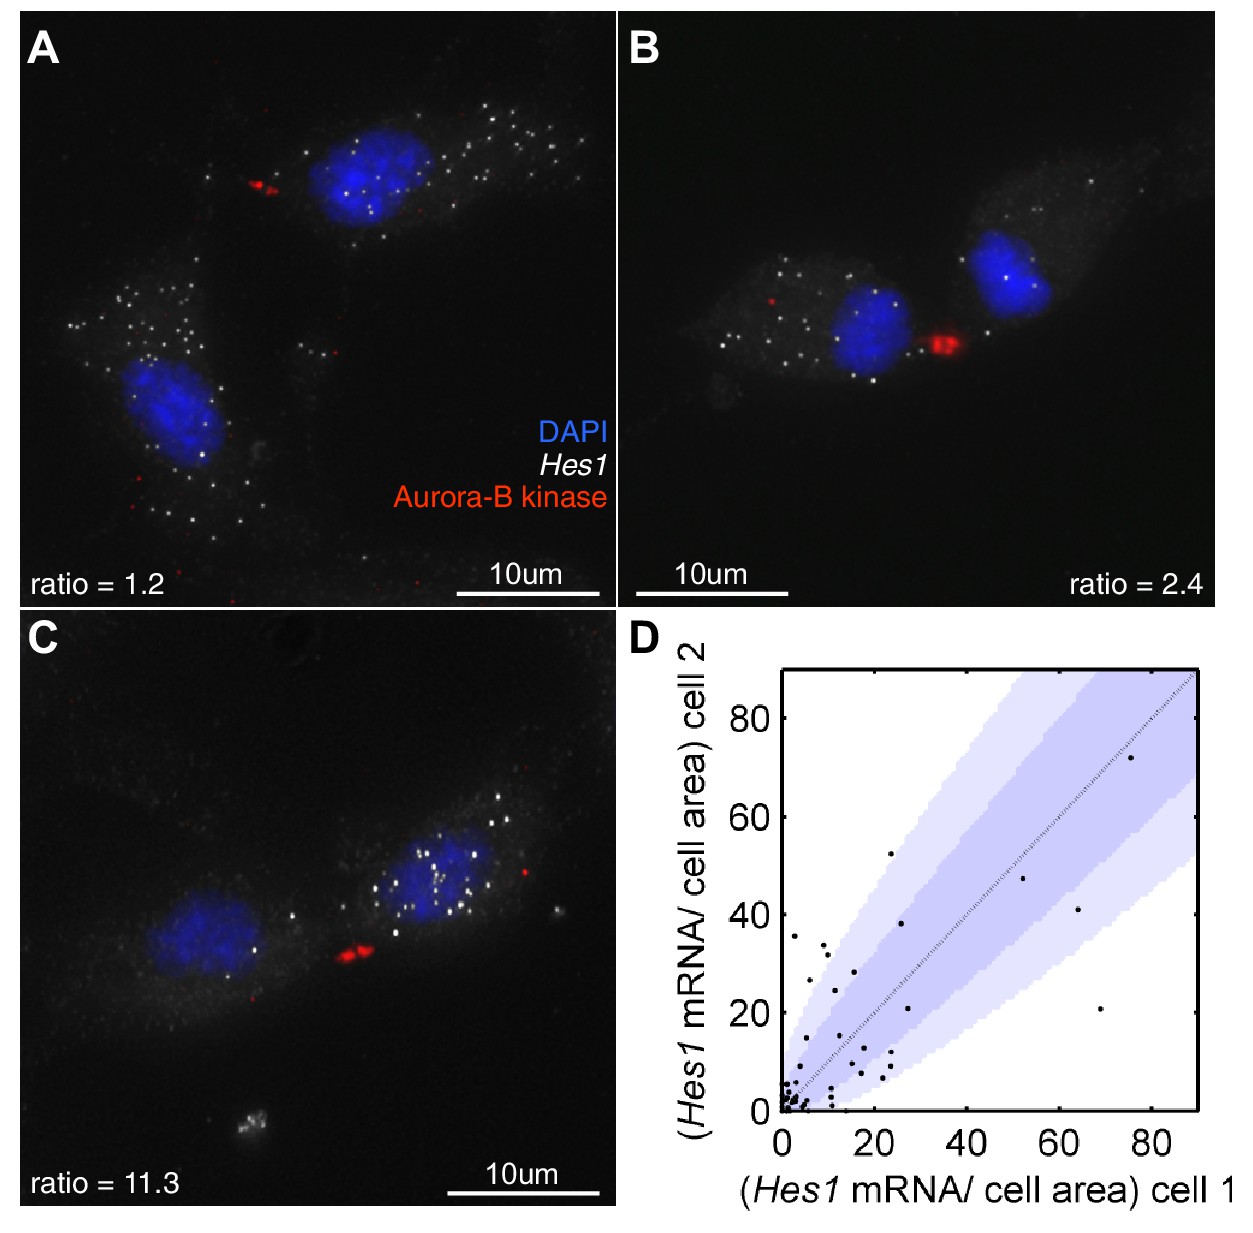
Hes1 mRNA is inherited unequally at cell division.
(A, B, C) smFISH with an exonic Hes1 probe showing asymmetry in Hes1 mRNA number (white) between sister NS cells, just prior to their complete separation at cytokinesis. Aurora-B kinase antibody staining (red) marks the midbody at cytokinesis; nuclei are DAPI stained (blue). (D) Quantification of Hes1 mRNA to cell area ratios between sister cells from 51 NS cell divisions at cytokinesis, from one experiment. Dark blue area represents the 90% confidence bounds that the ratios are drawn from a binomial distribution, where the average amount of mRNA received by each cell is normalised to the relative cell areas. Light blue represents multiple testing Bonferroni corrected 90% confidence bounds that the ratios are drawn from a binomial distribution. mRNA count data contained in Figure 8—source data 1.
-
Figure 8—source data 1
smFISH mRNA counts of cells at cell division.
- https://doi.org/10.7554/eLife.16118.038
Figure 9
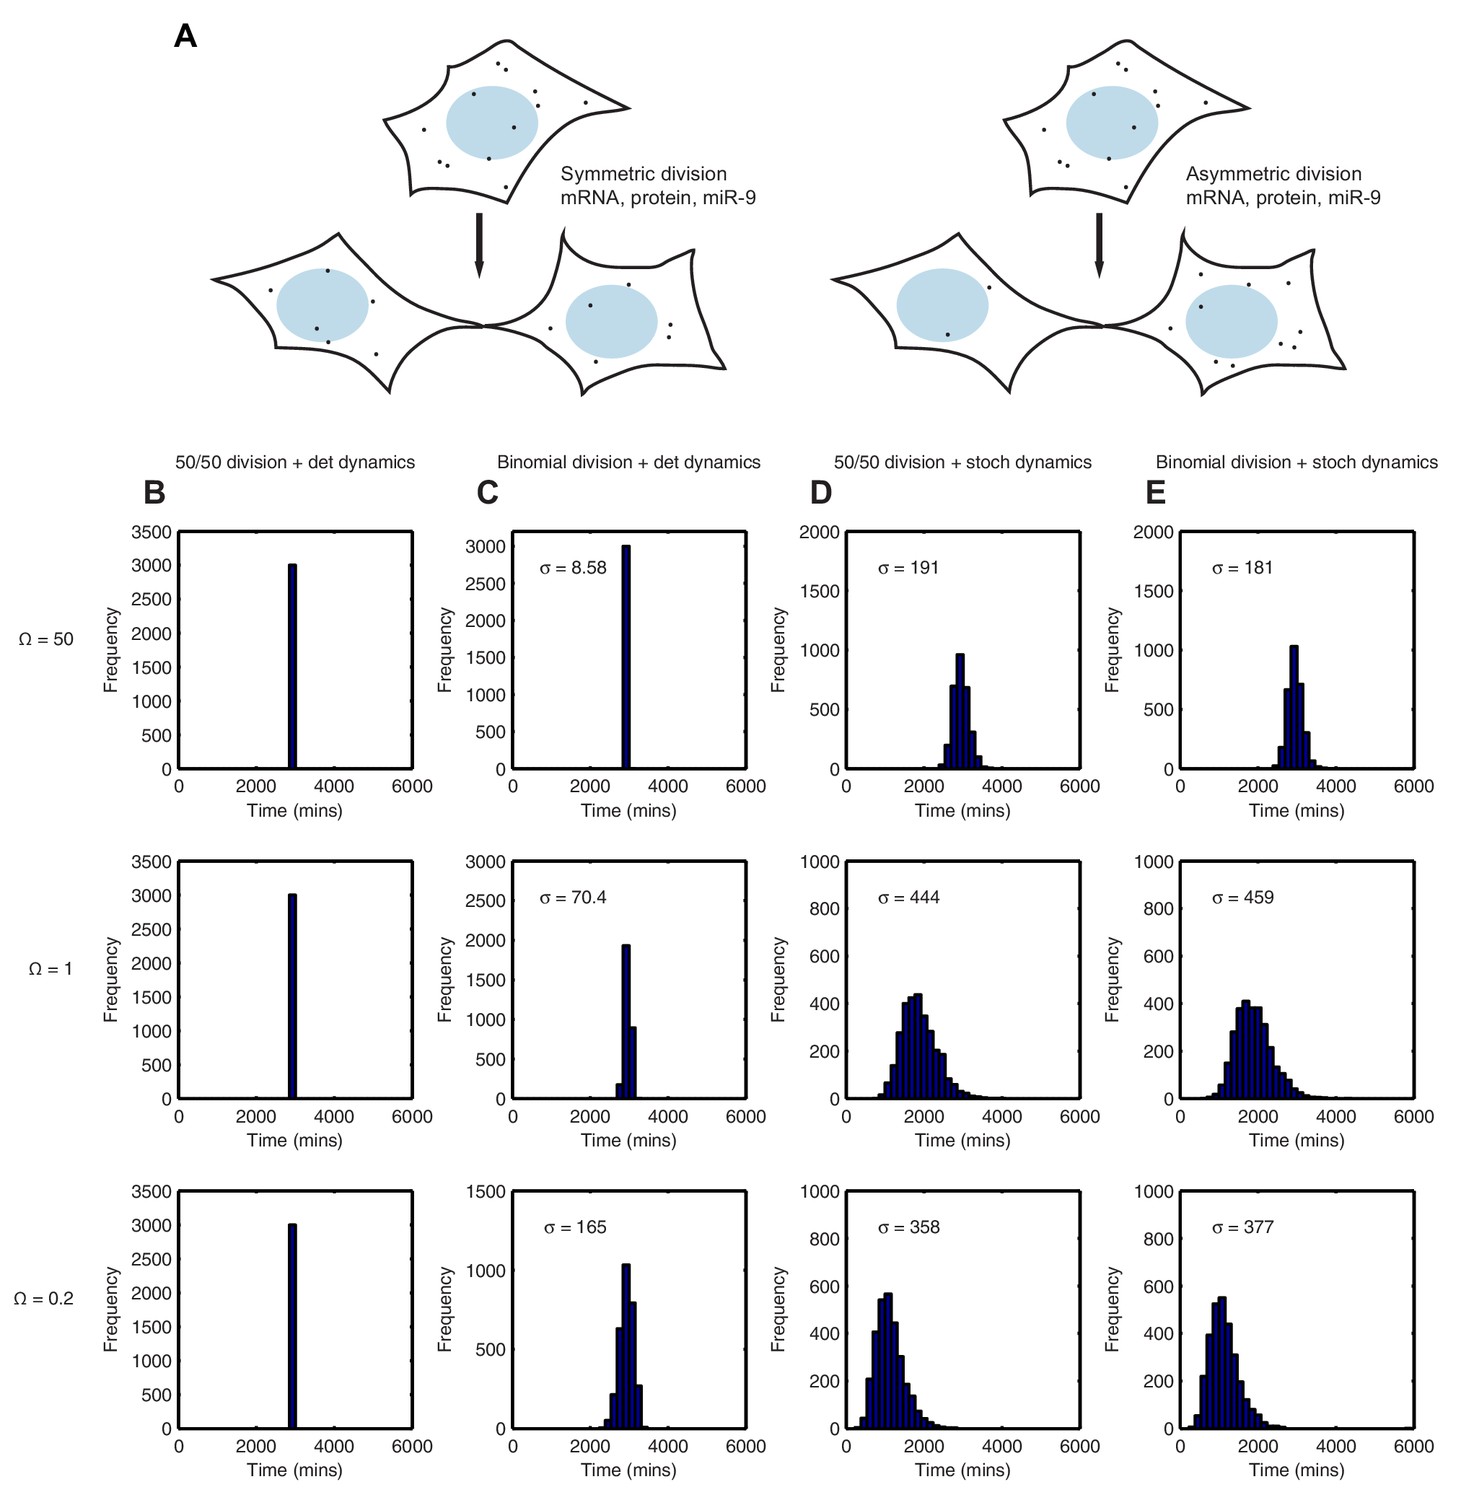
Stochastic system is robust to the binomial distribution of constituents at cell division.
(A) Schematic to show the difference between symmetric and asymmetric division. (B) The distribution of time to reach the low HES1 state with 50/50 initial conditions using deterministic dynamics as system size of = 50, 1 and 0.2, respectively. (C) The distribution of times to reach the low HES1 state of 3000 simulations with binomial initial conditions using deterministic dynamics at system size of = 50, 1 and 0.2, respectively. (D) The distribution of times to reach the low HES1 state of 3000 simulations with 50/50 initial conditions using the CLE at system size of = 50, 1 and 0.2, respectively. (E) The distribution of times to reach the low HES1 state of 3000 simulations with binomial initial conditions using the CLE at system size of = 50, 1 and 0.2, respectively. All simulations performed with parameter set 2 (Appendix 1—table 1) and initial conditions m(0) = 20x, p(0) = 400x and r(0) = 0. The standard deviation of the distribution is denoted with . In the simulations shown, parent cells were simulated deterministically for 12 hr prior to 'division' however, the distributions remained statistically the same (p-value>0.05) when either 11 or 13 hr deterministic simulations prior to division were used (data not shown). MATLAB code contained in Figure 9—source data 1.
-
Figure 9—source data 1
MATLAB code for deterministic and stochastic dynamics with wither 50/50 or binomial division.
- https://doi.org/10.7554/eLife.16118.040
Tables
Appendix 1—table 1
Parameters of the model and their values.
| Parameter | Set 1 | Set 2 | Interpretation | Reference |
|---|---|---|---|---|
| 29 min | 29 min | Time delay in HES1 protein production | (Lewis, 2003) | |
| 1 min−1 | 1 min−1 | Hes1 transcription rate in absence of Hes1 protein | ||
| 1 min−1 | 2 min−1 | Translation rate | ||
| 1 min−1 | 1 min−1 | miR-9 transcription rate in absence of Hes1 protein | ||
| 390 | 390 | Amount of protein required to reduce Hes1 transcription by half | Fitted in (Goodfellow et al., 2014) | |
| 5 | 5 | Quantifies the step-like nature of | (Monk, 2003) | |
| 100 | 80 | Amount of miR-9 required to reduce Hes1 degradation by half | ||
| 5 | 5 | Quantifies the step-like nature of | ||
| min−1 | min−1 | Lower bound for Hes1 mRNA half-life | (Bonev et al., 2012) | |
| min−1 | min−1 | Upper bound for Hes1 mRNA half-life | (Bonev et al., 2012) | |
| 300 | 100 | Amount of miR-9 required to reduce HES1 protein translation by half | ||
| 5 | 5 | Quantifies the step-like nature of | ||
| 5 | 5 | Quantifies the step-like nature of | ||
| 22 min | 22 min | Half-life of HES1 protein | (Hirata et al., 2002) | |
| 260 | 280 | Amount of protein required to reduce miR-9 production rate by half | ||
| 1000 min | 1000 min | Half-life of miR-9 |
Download links
A two-part list of links to download the article, or parts of the article, in various formats.
Downloads (link to download the article as PDF)
Open citations (links to open the citations from this article in various online reference manager services)
Cite this article (links to download the citations from this article in formats compatible with various reference manager tools)
Stochasticity in the miR-9/Hes1 oscillatory network can account for clonal heterogeneity in the timing of differentiation
eLife 5:e16118.
https://doi.org/10.7554/eLife.16118


