Massive normalization of olfactory bulb output in mice with a 'monoclonal nose'
- Collège de France, INSERM U1050, CNRS UMR 7241, France
- The Francis Crick Institute, United Kingdom
- University College London, United Kingdom
- Max-Planck-Institute for Medical Research, Germany
- Massachusetts Institute of Technology, United States
- Duke University, United States
- Faculty of Medicine, University of Heidelberg, Germany
Figures
Figure 1 with 2 supplements
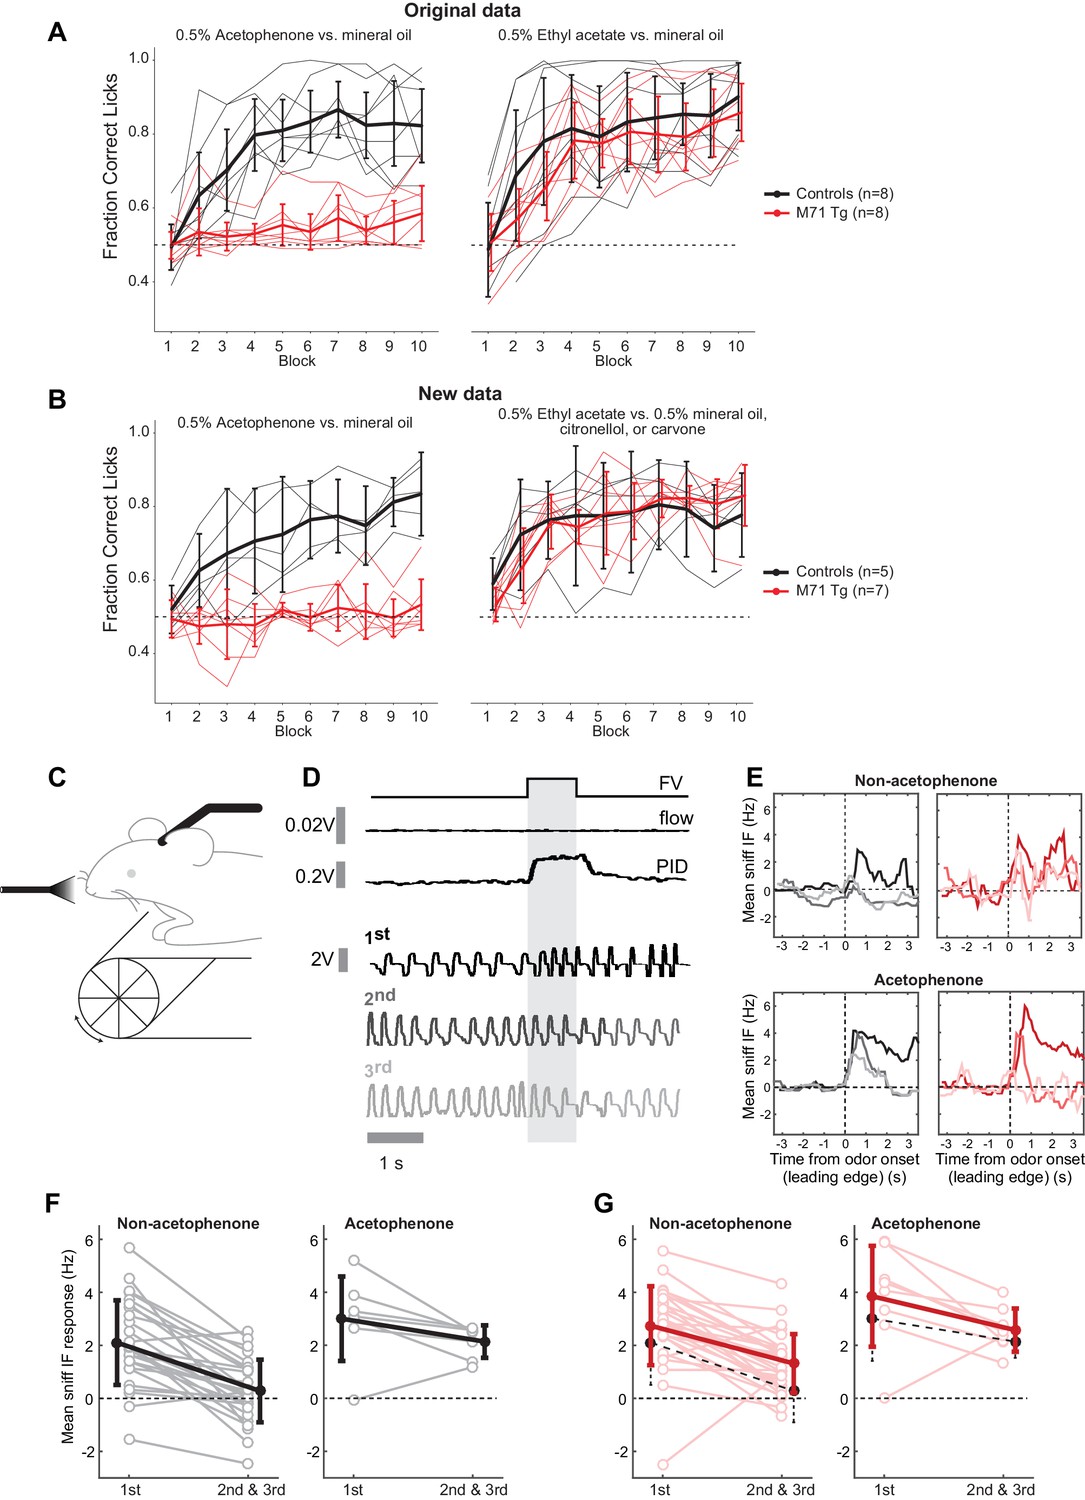
The ability of M71 transgenic mice to detect acetophenone is task-dependent.
(A, B) In a go/no go operant conditioning task, M71 transgenic mice fail to discriminate acetophenone from mineral oil (left panels). In contrast, M71 transgenic mice readily discriminate other pairs of odorants (ethyl acetate vs. mineral oil, citronellol, or carvone, right panels). (A) Original results reported in Fleischmann et al. (2008). (B) Repeat experiment with an additional cohort of mice. Thin lines: learning curves for individual mice. Thick lines: averaged learning curves. Error bars: 95% CI of the mean. (C) Sniff adaptation: schematic of the experimental configuration. (D) Example sniff traces during first 3 (1st, 2nd, and 3rd) presentations of hexanone (shaded area) from a control mouse. Lighter colored traces signify later presentations. ‘FV’ trace shows opening of final valve directing odorized air to the mouse, ‘flow’ trace shows the output from the olfactometer, and ‘PID’ trace shows signal evoked by odorized air from a photo-ionization detector. (E) Example moving averages of instantaneous sniff frequency during first 3 presentations of hexanone (window = 500 ms, plotted against leading edge). Black traces: controls, red traces: M71 transgenic mice. (F, G) Mean instantaneous sniff frequency responses to first vs. the average of the 2nd and 3rd presentation of an odor for control (black, F) and M71 transgenic (red, G) mice. Pooled non-acetophenone odorants: hexanone, ethyl acetate, heptanal, and an odor mixture. Lighter colors: individual trials, thick lines: averages. Error bars: SD. Black dotted lines on the M71 plots show the means for the corresponding data from controls.
Figure 1—figure supplement 1
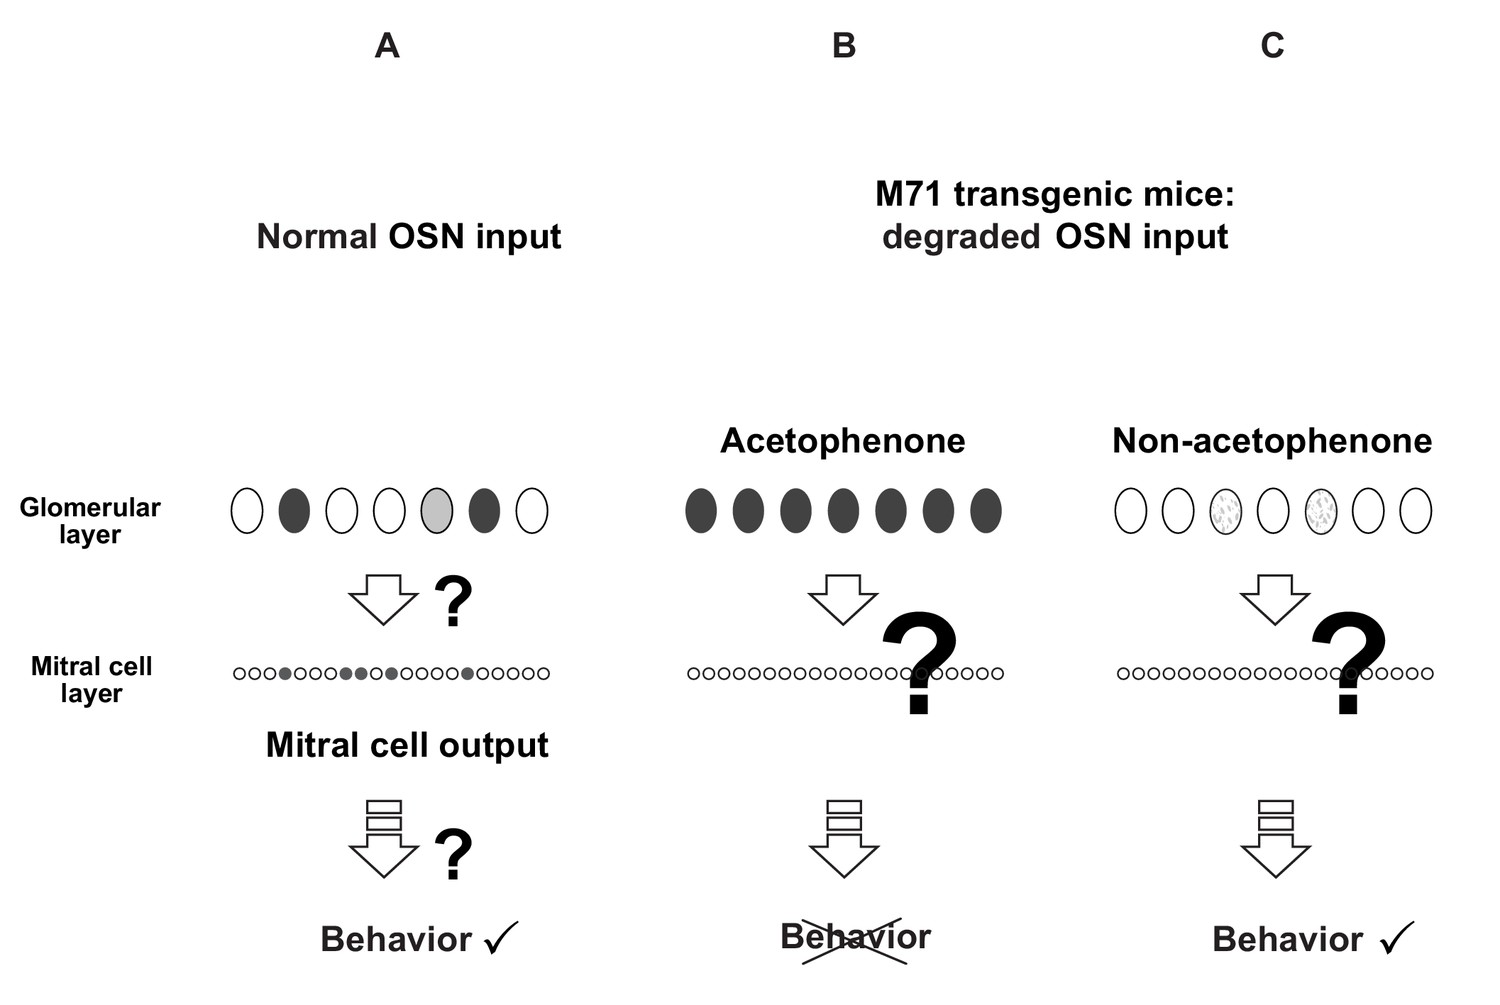
Schematic representation of the perturbation of the glomerular map of M71 transgenic mice with a 'monoclonal nose'.
(A) In wild-type mice, odors bind to subsets of odorant receptors (ORs), which results in the activation of subsets of olfactory sensory neurons (OSNs) and glomeruli in the olfactory bulb (OB). This activity is transformed into sparse patterns of mitral cell activity, which transmits odor information to higher olfactory centers to drive behavior. (B and C) In M71 transgenic mice, odor-evoked patterns of glomerular activity are massively perturbed. The pervasive expression of the M71 OR, instead of a large repertoire of endogenous OR, results in the pervasive activation of OSNs and glomeruli in response to acetophenone, an M71 receptor ligand. In contrast, most other odorants do not elicit detectable glomerular activity. Surprisingly, behavioral experiments using a go/no go operant conditioning task showed that M71 transgenic mice could detect and discriminate most odorants, but not acetophenone.
Figure 1—figure supplement 2
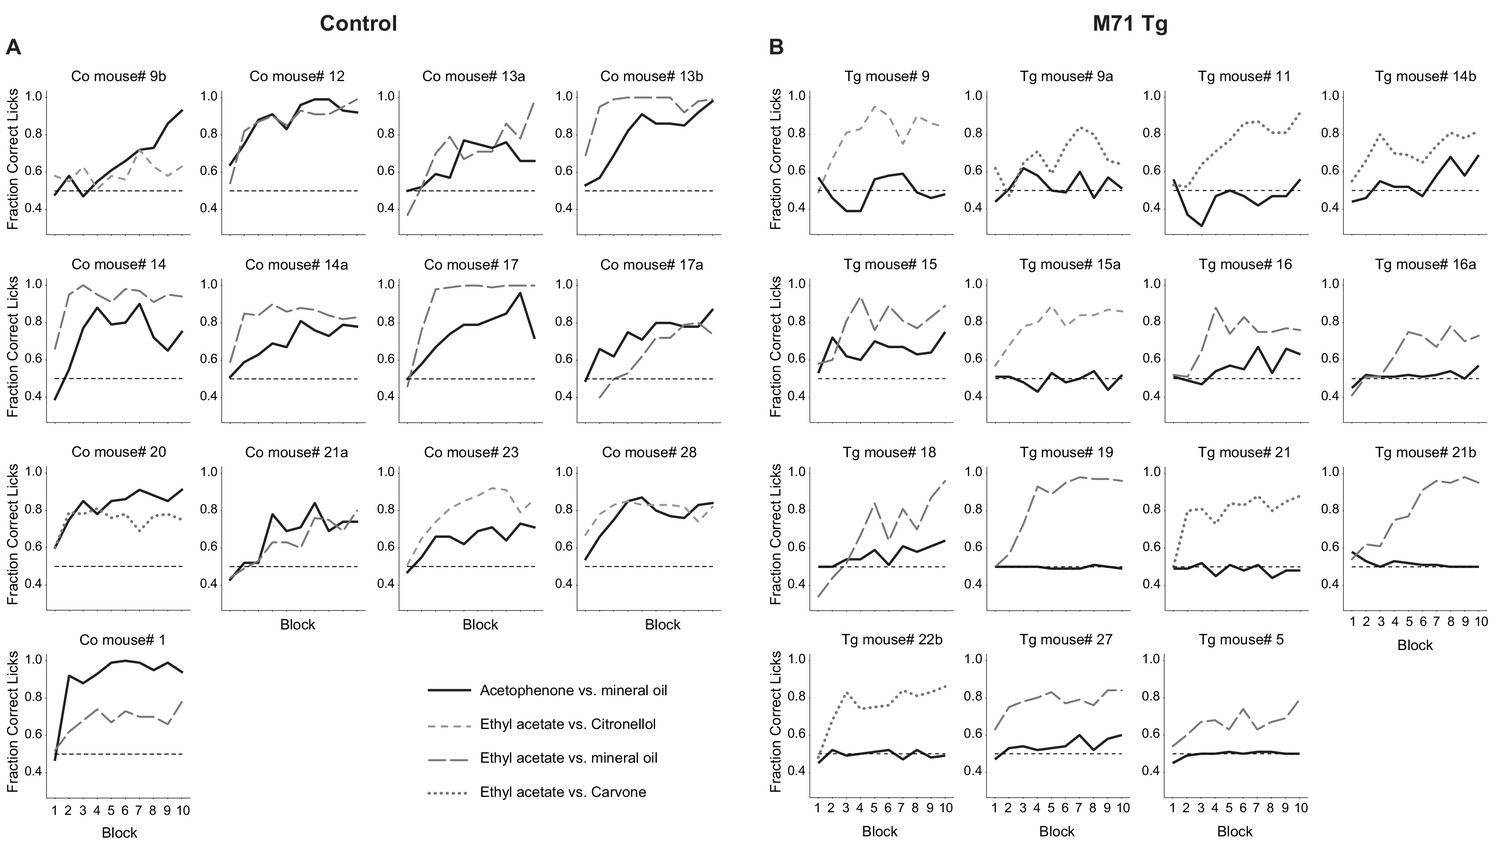
M71 transgenic mice fail to detect acetophenone in a go/no go operant conditioning task.
(A) Wild-type mice consistently discriminate acetophenone from its diluent mineral oil (black lines). Wild-type mice also discriminate between other pairs of odorants (ethyl acetate versus mineral oil, citronellol, or carvone, dotted lines). (B) M71 transgenic mice consistently fail to discriminate acetophenone from mineral oil, but readily discriminate between the other pairs of odorants.
Figure 2
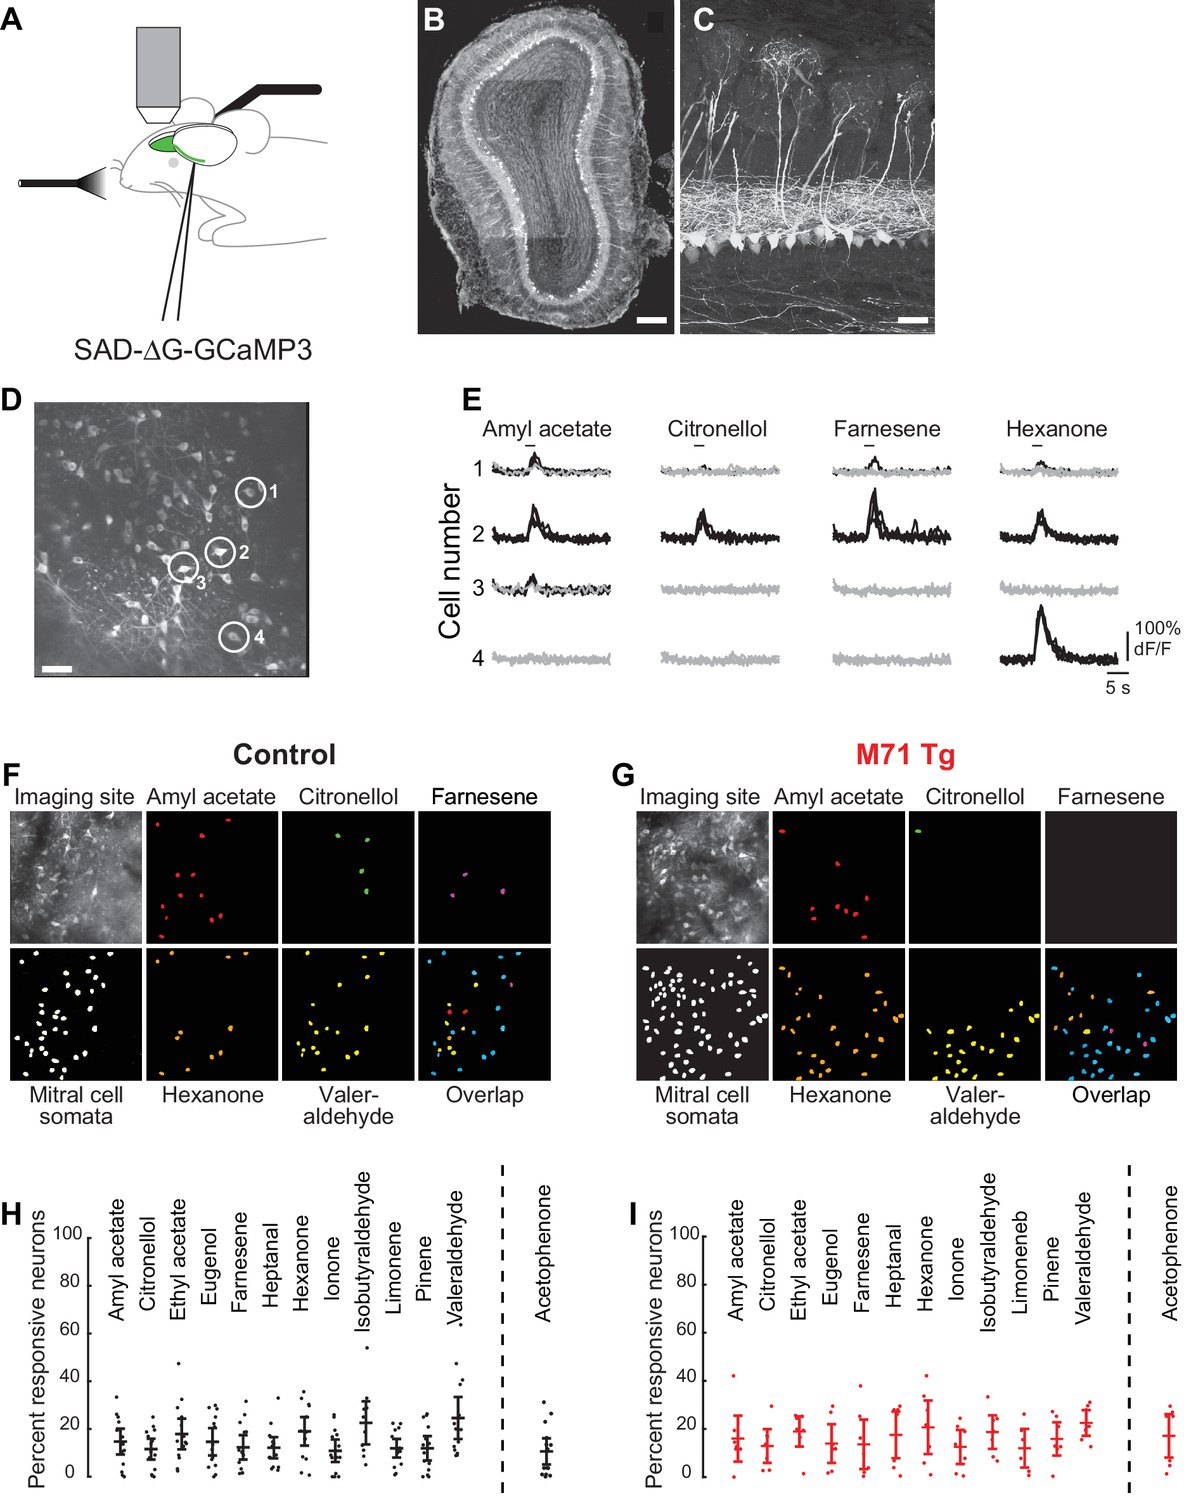
Normalization of odor-evoked mitral cell activity in M71 transgenic mice.
(A–I) Two-photon in vivo imaging of mitral cell odor responses in anesthetized mice. (A) Schematic of rabies-GCaMP3 injection into the lateral olfactory tract (LOT) and two-photon imaging of olfactory bulb mitral cells. (B) Mitral cells expressing GCaMP3 in a coronal slice of the olfactory bulb after injection of rabies-GCaMP3. Note the restriction of labeled cell bodies to the mitral cell layer. Scale bar = 100 µM. (C) Higher magnification of mitral cells expressing GCaMP3 throughout the neuron, including the apical and lateral dendrites. Scale bar = 20 µM. (D) Two-photon micrograph showing GCaMP3 expression in mitral cell of a single imaging site. Scale bar = 30 µM. (E) Example traces of the responses of 4 mitral cells (circled in (D)) to 4 different odorants. Traces represent responses to 4 individual odorant exposures, non-responsive trials are shown in grey, responsive trials in black. Horizontal bar indicates odorant application. (F, G) Representative maps of odor-evoked mitral cell activity elicited by a panel of 5 different odorants at a single imaging site in a control (F) and M71 transgenic (G) mouse. Cells responding to at least 2 out of 4 trails are color-coded. Overlap: cells responsive to more than one odorant are shown in blue. (H, I) Mean fraction of cells (horizontal line) responding to a given odorant at 0.01% vol./vol. dilution, in control (H) and M71 transgenic (I) mice. Dots represent the fraction of responding cells for a given imaging site. Controls: 14 imaging sites in 7 mice, n (median number of cells per site) = 35; M71 transgenic: 7 imaging sites in 4 mice, n = 28. Error bars = 95% CI of the mean.
Figure 3 with 1 supplement
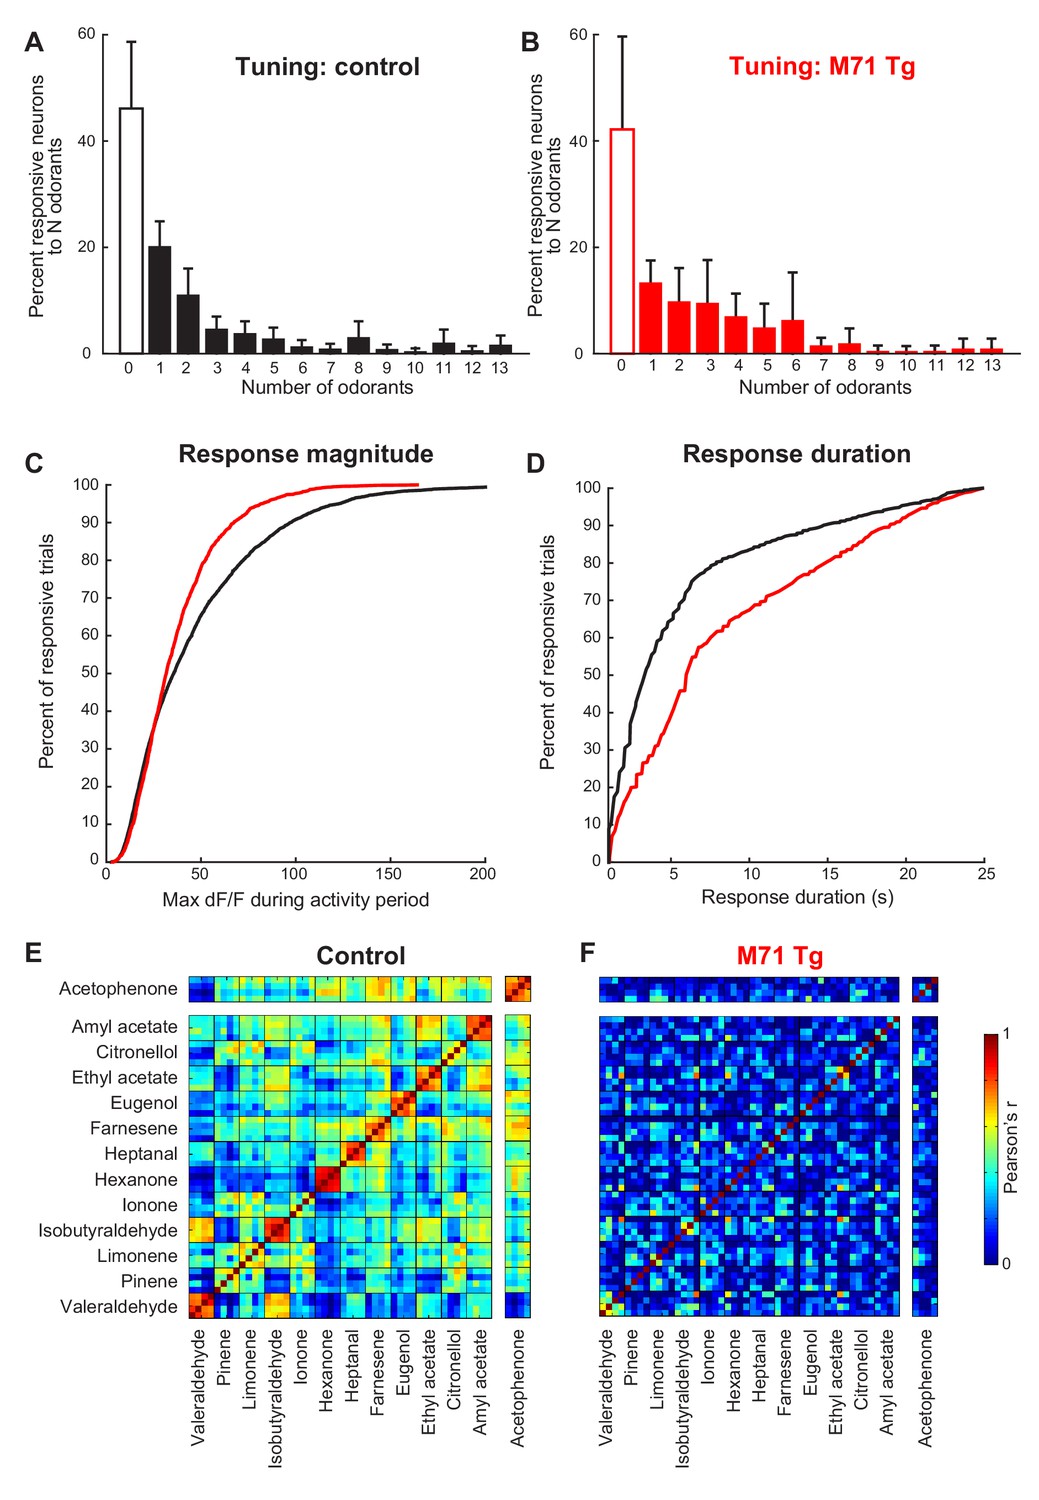
Normalization of odor-evoked neural activity in M71 transgenic mice results in changes in response magnitudes and duration, and trial-to-trial variability.
(A–F) Two-photon in vivo imaging of mitral cell odor responses in anesthetized mice. (A, B) Odor tuning: the fraction of mitral cells responding to N odorants out of the 13 odorant test panel in control (A, black) and M71 transgenic (B, red) mice. Error bars = 95% CI. (C) Peak DF/F values for odor-evoked responses in control (black) and M71 transgenic (red) mice. The fraction of responses with high peak DF/F values is reduced in M71 transgenic mice. (D) Response durations are increased in M71 transgenic mice (red) compared to controls (black). (E, F) Trial-to-trial variability. Pearson’s correlation coefficients for individual odor presentations (13 odorants, 4 trials per odorant). The similarities of response patters to 4 presentations of the same odorant is reduced in M71 transgenic mice.
Figure 3—figure supplement 1

Response magnitudes and durations, and trial-to-trial variability of mitral cell odor responses in M71 transgenic mice.
(A–I) Two-photon in vivo imaging of mitral cell odor responses in anesthetized mice. (A) Cumulative frequency plots of the peak F/F values for ethyl acetate- and acetophenone-evoked mitral cell responses in control (black) and M71 transgenic (red) mice. (B) Cumulative frequency plots of response durations for ethyl acetate- and acetophenone-evoked mitral cell responses in control (black) and M71 transgenic (red) mice. (C) Percent of neurons responding to 1, 2, 3, or 4 out of 4 odorant exposures in control (black) and M71 transgenic (red) mice. Note that the fraction of neurons responding on 4 out of 4 trials in strongly reduced in M71 transgenic mice. Error bars = SEM. (D–G) Trial-to-trial variability of mitral cell odor responses decreases with increasing odorant concentrations. (C, D) Percent of neurons responding to 1, 2, 3, or 4 out of 4 odorant exposures to ethyl acetate (D) and acetophenone (E) at increasing concentrations in control mice. (F, G) Percent of neurons responding to 1, 2, 3, or 4 out of 4 odorant exposures to ethyl acetate (F) and acetophenone (G) at increasing concentrations in M71 transgenic mice. Error bars = SEM. (H, I) Pearson’s correlation coefficients for individual acetophenone and ethyl acetate presentations at increasing concentrations. Note that response patterns to acetophenone at increasing concentrations are highly dissimilar from responses to acetophenone at low concentrations, and to responses to ethyl acetate.
Figure 4 with 1 supplement
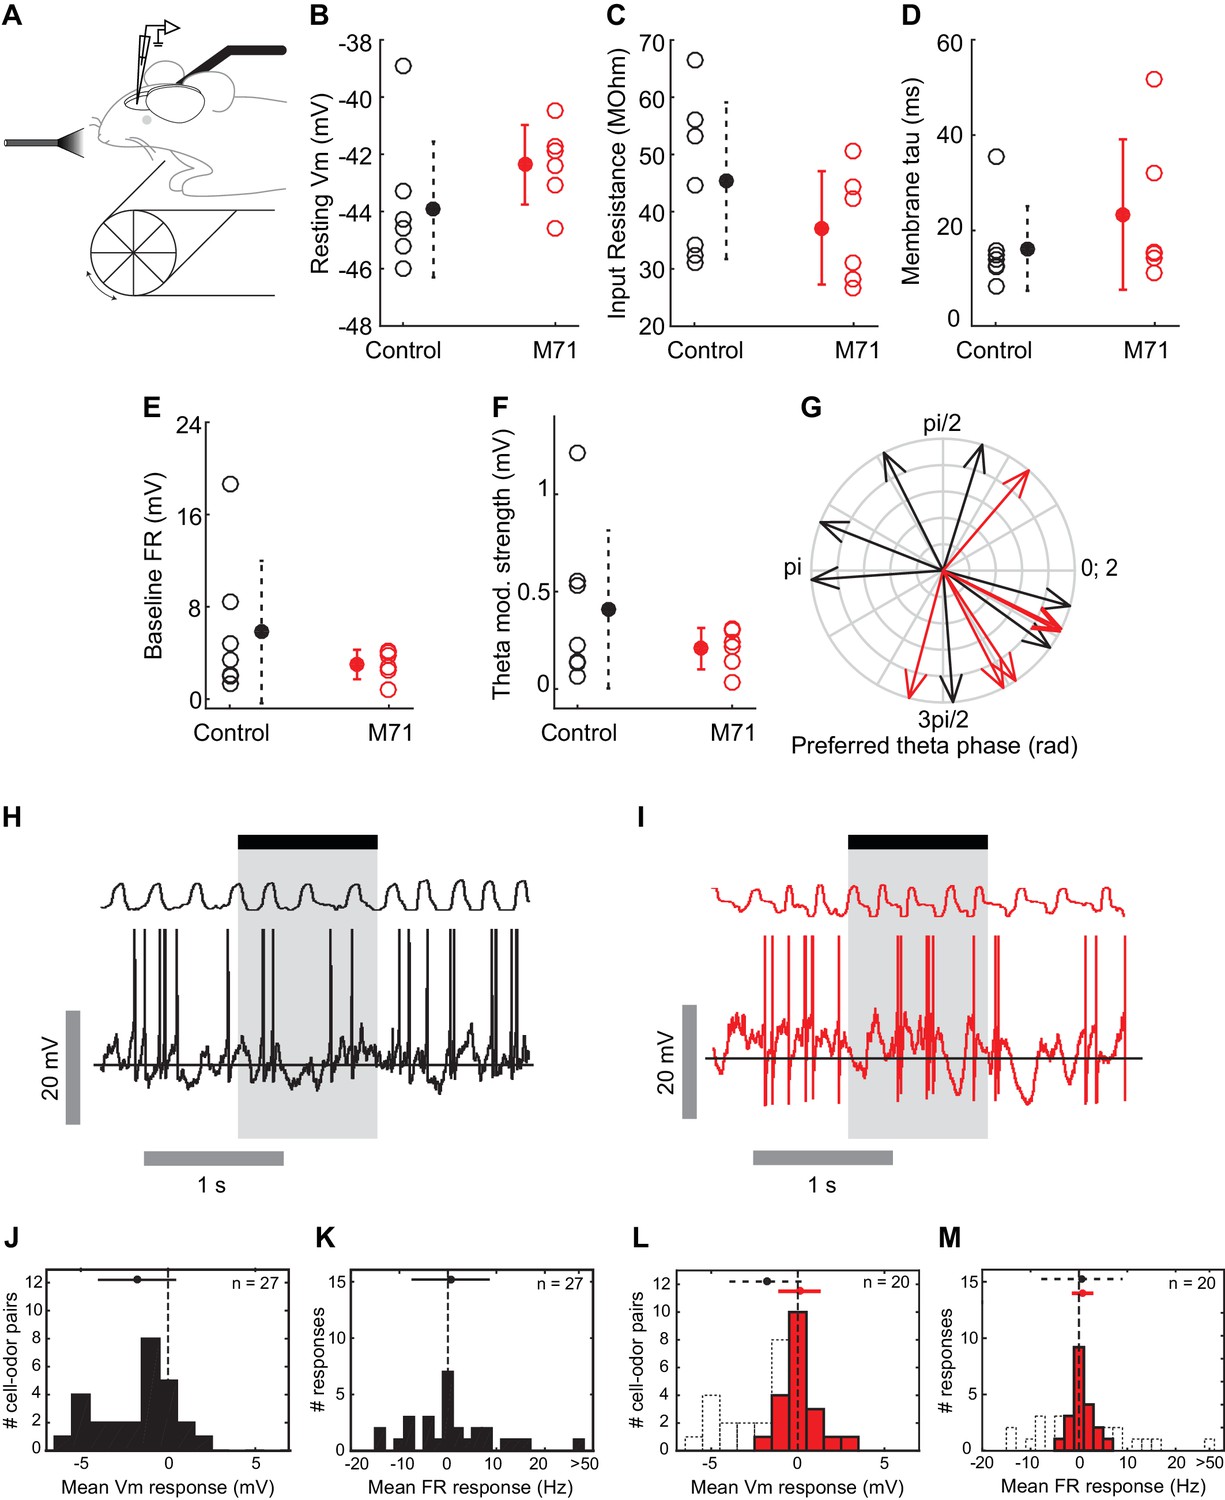
Intrinsic and odor-evoked mitral cell activity in M71 transgenic mice.
(A–M) In vivo whole cell recordings in awake mice: comparison of physiological properties of mitral cells in control (black, n = 7) and M71 transgenic mice (red, n = 6). (A) Schematic of the experimental configuration. (B) Resting membrane potential (mV), (C) input resistance (MΩ), (D) membrane time constant tau (ms), (E) baseline firing rate (Hz), (F) strength of modulation of baseline Vm by the sniff cycle (theta coupling) (mV), and (G) phase-preference of baseline Vm within the sniff cycle (rad). (H, I) Example trace showing single 1 s odor presentation (shaded area) during mitral cell recordings from control (H) and M71 transgenic (I) mice. (J, K) Histograms of mean odor-evoked membrane potential (J) and firing rate (K) responses in control cells to non-acetophenone odors, n = 27 cell-odor pairs from 7 cells. (L, M) Histograms of mean odor-evoked membrane potential (L) and firing rate (M) responses in M71 transgenic cells, n = 20 cell-odor pairs from 6 cells. Black dotted lines in (L) and (M) show corresponding data from controls.
Figure 4—figure supplement 1
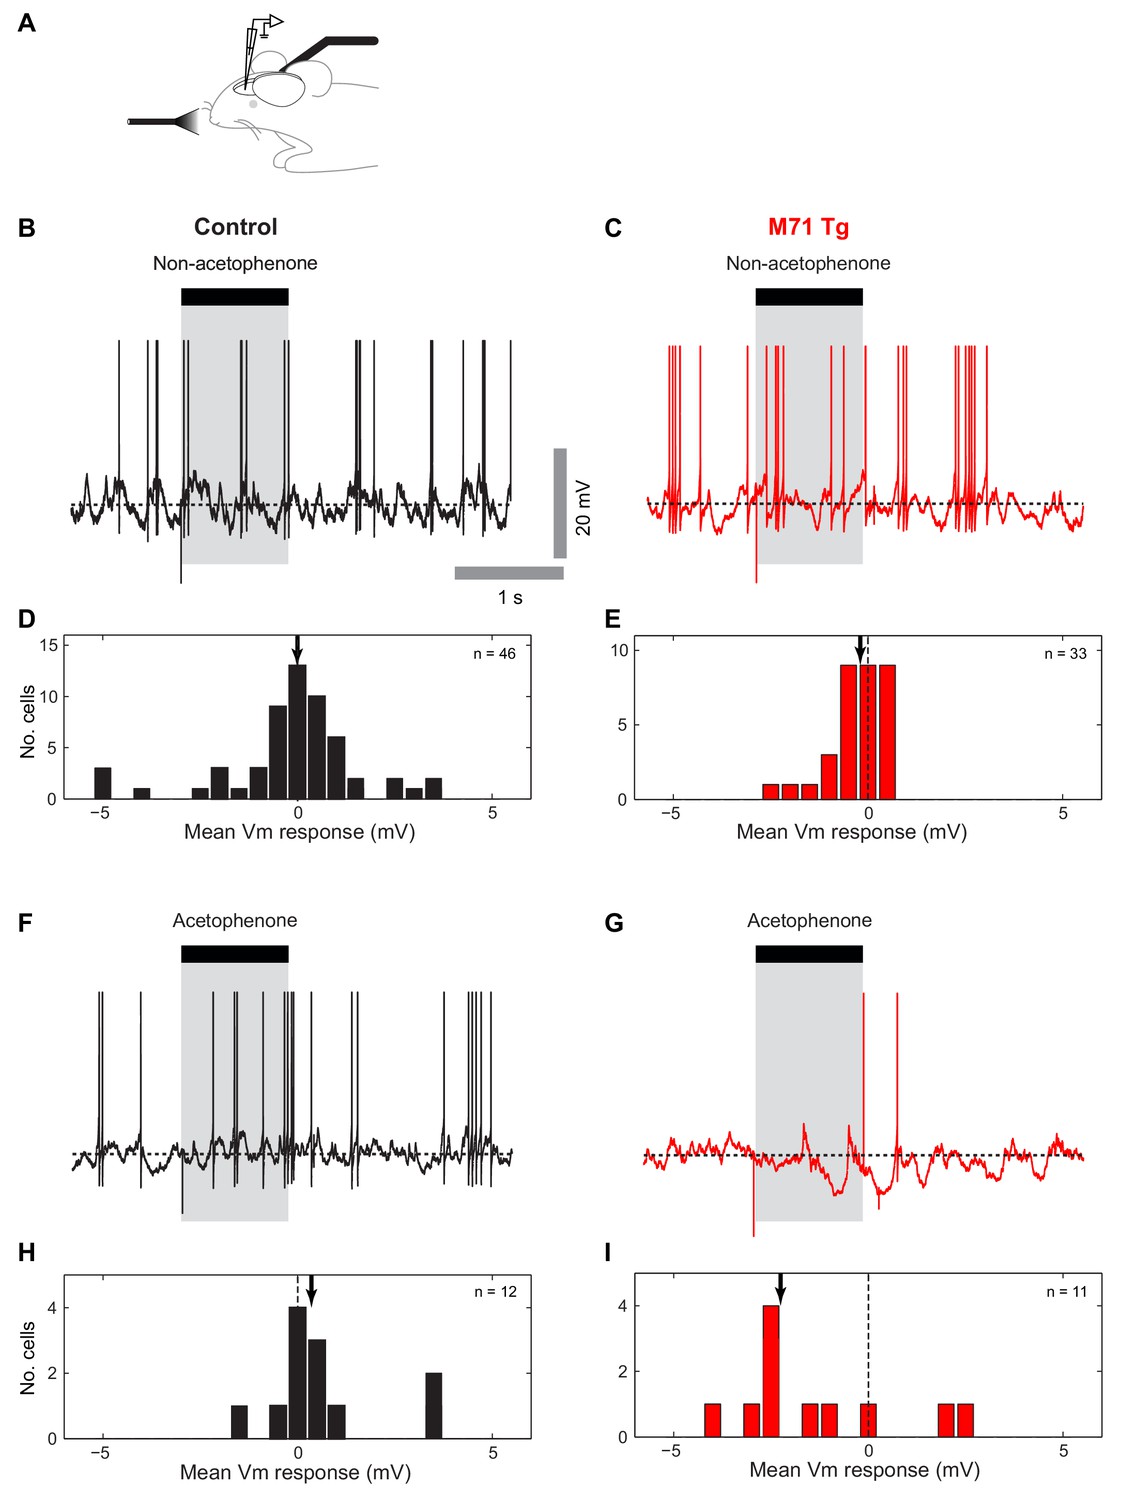
Patch clamp mitral cell recordings in anesthetized mice reveal increased acetophenone-evoked inhibition in M71 transgenic mice.
(A) Schematic: whole cell recordings in anesthetized mice. (B, C) Example traces showing single 1 s ethyl acetate presentations (shaded area) during mitral cell recordings from control (black) and M71 transgenic (red) mice. (D, E) Histograms of mean odor-evoked membrane potential responses in control and M71 transgenic cells. (F, G) Example traces showing single 1 s acetophenone presentations during mitral cell recordings from control and M71 transgenic mice. (H, I) Histograms of mean acetophenone-evoked membrane potential responses in control and M71 transgenic cells. Arrows indicate the median evoked Vm.
Figure 5 with 1 supplement
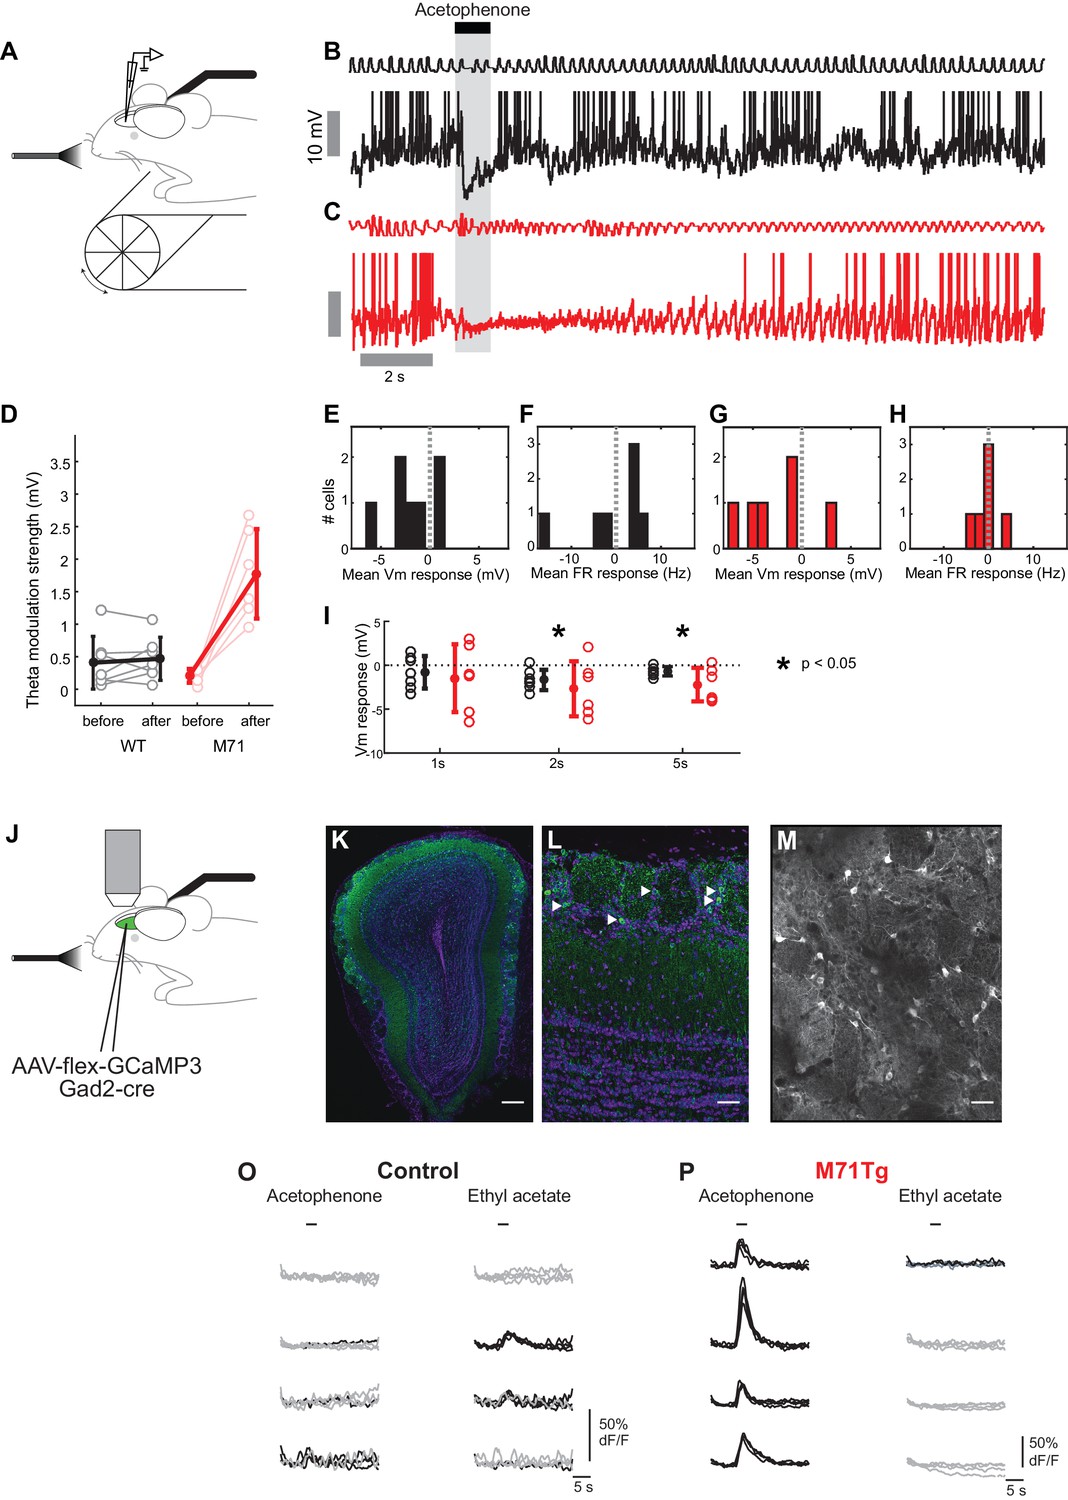
Increased acetophenone-evoked inhibition and theta coupling in M71 transgenic mice.
(A–H) In vivo whole cell recordings in awake mice. (A) Schematic of the experimental configuration. (B, C) Example trace of a 1% acetophenone presentation to a mitral cell in a control (B, black) and M71 transgenic (C, red) mouse. Note the differences in the duration of inhibition, and the great amplification in theta coupling of the M71 transgenic cell after response offset. (D) Quantification of strength of theta coupling before and after acetophenone presentation for control (black) and M71 transgenic (red) cells. (E–H) Histograms of mean 1 s odor-evoked membrane potential and firing rate responses to acetophenone presentation in control (E, F) and M71 transgenic (G, H) mice. (I) Comparison of control and M71 transgenic mean Vm responses calculated over different time windows: 1 s, 2 s and 5 s from the first inhalation post odor-onset. (J–P) Two-photon in vivo imaging of periglomerular cell activity in anesthetized mice. (J) Schematic of the experimental configuration. (K) Expression of GCaMP3 (in green) in inhibitory neurons after injection of conditional AAV-flex-GCaMP3 into the olfactory bulb of a Gad2-Cre transgenic mouse. Purple: nuclear counterstain. Scale bar = 100 µM. (L) Higher magnification of periglomerular (PG) cells (examples indicated by white arrowheads) expressing GCaMP3. Scale bar = 20 µM. (M) Two-photon micrograph showing GCaMP3 expression in PG cells of a single imaging site. Scale bar = 20 µM. (O, P) Example traces of the responses of 4 PG cells to acetophenone and ethyl acetate in control (O) and M71 transgenic (P) mice. Traces represent responses to 4 individual odorant exposures, non-responsive trials are shown in grey, responsive trials in black. Note the difference in the scale of the y-axis between genotypes.
Figure 5—figure supplement 1

Individual acetophenone response traces.
In vivo whole cell recordings in awake mice. Mean spike-clipped traces in response to acetophenone at a concentration of 1% of absolute vapor pressure, averaged across all trials aligned to first inhalation post odor onset for each MTC. In black are traces from each cell recorded in control littermates, in red are traces from M71 transgenic cells. The shaded area shows the 1 s odor stimulus. The dotted line at 2 s is for comparison of the long-duration component of the response. Note the long inhibitory transients seen in 4 of the 6 transgenic MTCs, compared to the much more transient responses in controls.
Figure 6 with 1 supplement
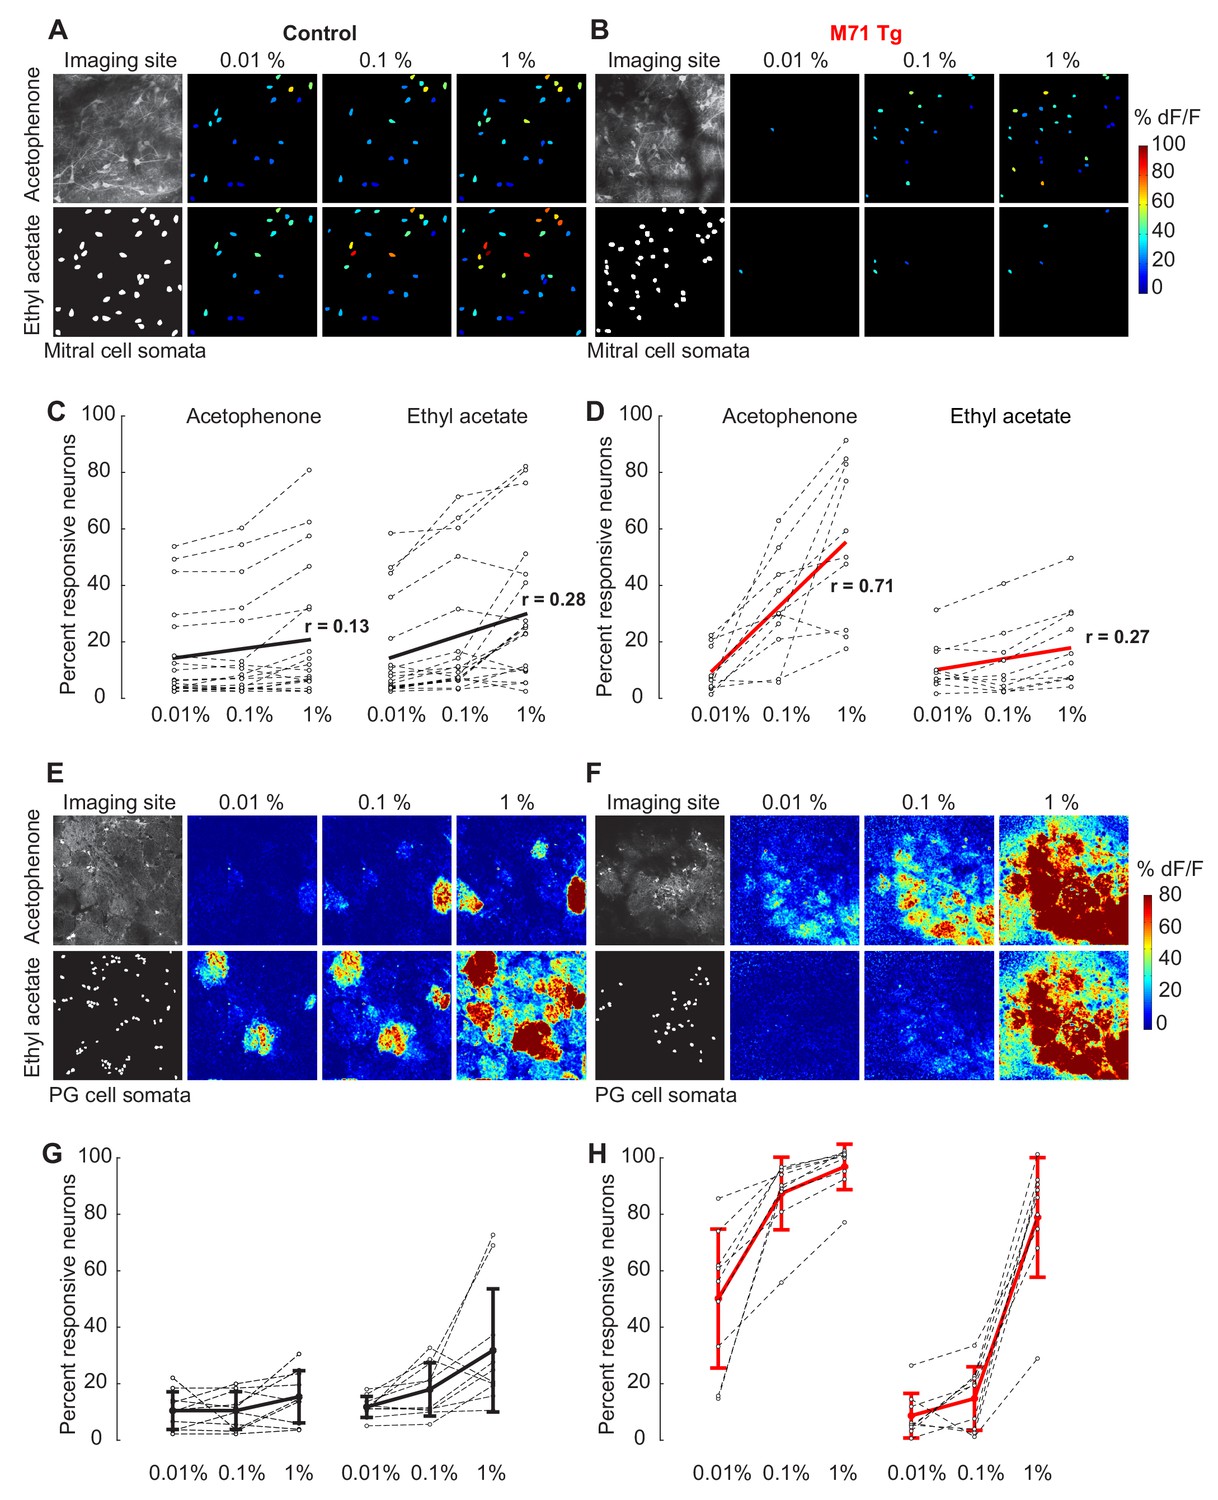
The olfactory bulb excitation/inhibition balance in M71 transgenic mice breaks down at high acetophenone concentrations.
(A–D) Two-photon in vivo imaging of mitral cell odor responses in anesthetized mice. (A, B) Representative maps of odor-evoked mitral cell activity elicited by acetophenone and ethyl acetate at increasing odorant concentrations in a control (A) and M71 transgenic (B) mouse. Weak to strong responses are color-coded in blue to red. (C, D) Mean fraction of mitral cells that respond to acetophenone and ethyl acetate at increasing odorant concentrations in control (C, black) and M71 transgenic (D, red) mice. Grey circles represent the fraction of responsive cells of a single imaging site. Controls: 19 imaging sites in 8 mice, n (median number of cells per site) = 57; M71 transgenics: 10 imaging sites in 4 mice, n = 28. red line: linear fit onto concentration. r: coefficient of correlation. (E–H) Two-photon in vivo imaging of periglomerular cell activity in anesthetized mice. (E, F) Representative maps of odor-evoked periglomerular (PG) cell activity elicited by acetophenone and ethyl acetate at increasing odorant concentrations in a control (E) and M71 transgenic (F) mouse. Note that the heatmaps predominantly reflect dendritic responses of PG cells in glomeruli. (G, H) Mean fraction of PG cells that respond to acetophenone and ethyl acetate at increasing odorant concentration in control (G, black) and M71 transgenic (H, red) mice. Grey circles represent the fraction of responsive cells of a single imaging site. Controls: 10 imaging sites in 5 mice, n (median number of cells per site) = 46; M71 transgenics: 9 imaging sites in 5 mice, n = 51. Error bars = SD.
Figure 6—figure supplement 1
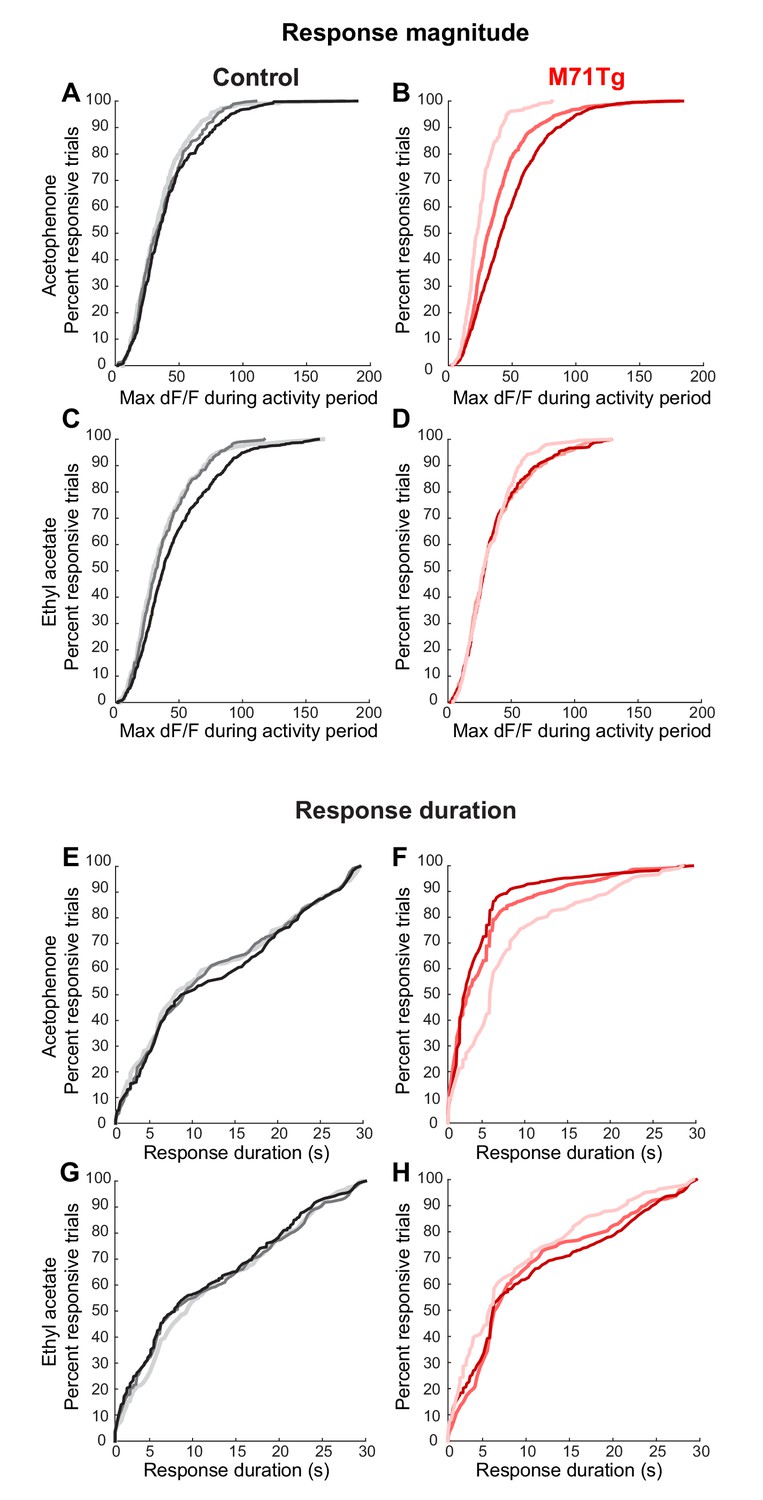
Response magnitudes and durations strongly increase with increasing acetophenone concentrations in M71 transgenic mice.
(A–H) Two-photon in vivo imaging of mitral cell odor responses in anesthetized mice. (A, B) Cumulative frequency plot of the peak DF/F values for mitral responses in control (A) and M71 transgenic (B) mice to increasing acetophenone concentrations. Light, intermediate and dark colored curves represent responses to low (1:10.000 vol./vol.), intermediate (1:1.000 vol./vol.) and high (1:100 vol./vol.) odorant concentration. (C, D) Cumulative frequency plot of the peak DF/F values for mitral responses in control (C) and M71 transgenic (D) mice to increasing ethyl acetate concentrations. (E, F) Cumulative frequency plot of response durations of mitral cells in control (E) and M71 transgenic (F) mice to increasing acetophenone concentrations. (G, H) Cumulative frequency plot of response durations of mitral cells in control (G) and M71 transgenic (H) mice to increasing ethyl acetate concentrations.
Author response image 1
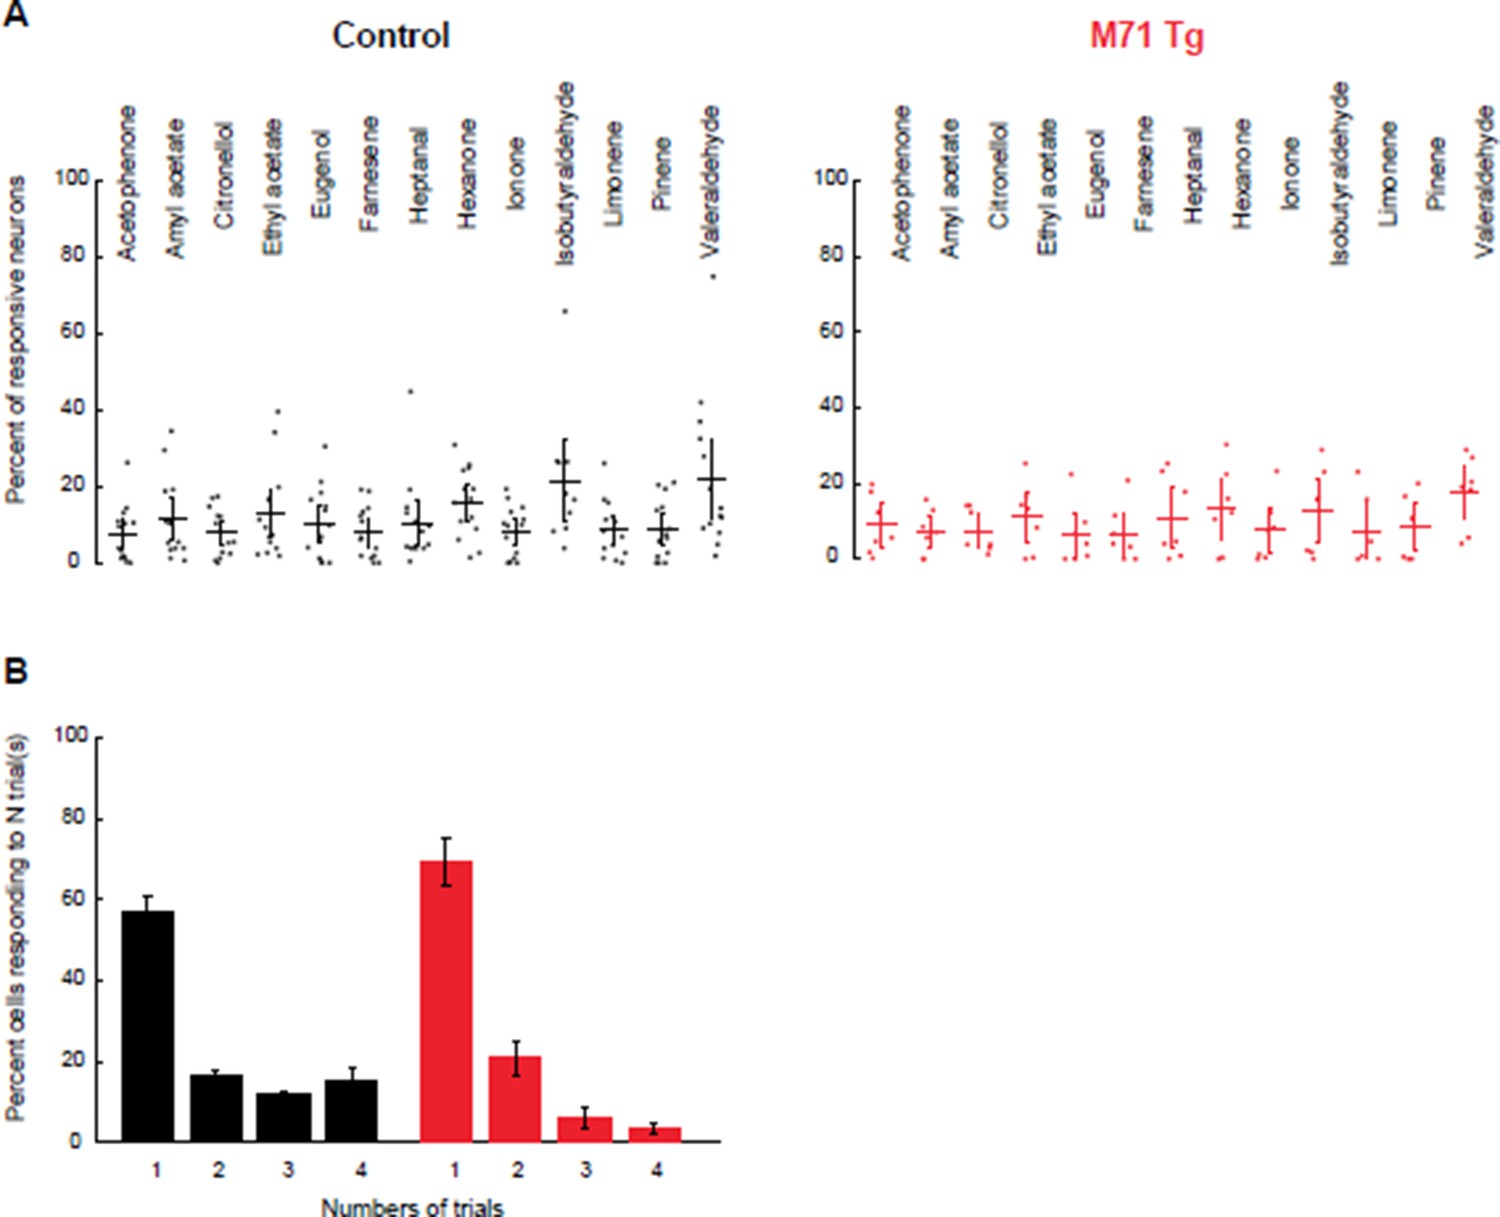
Increasing threshold stringency does not change the comparison of the fraction of responsive mitral cells or their response variability between M71 transgenic mice and controls.
(A) Mean fraction of neurons (horizontal line) responding to a given odorant at 0.01% vol./vol. dilution, with the response threshold set at 3.8 x SD, in control (black) and M71 transgenic (red) mice. Dots represent the fraction of responding cells for a given imaging site. Error bars = 95% CI of the mean. (B) Percent of neurons responding to 1, 2, 3, or 4 out of 4 odorant exposures in control (black) and M71 transgenic (red) mice. Note that the fraction of neurons responding on 4 out of 4 trials in strongly reduced in M71 transgenic mice. Error bars = SEM.
Author response image 2
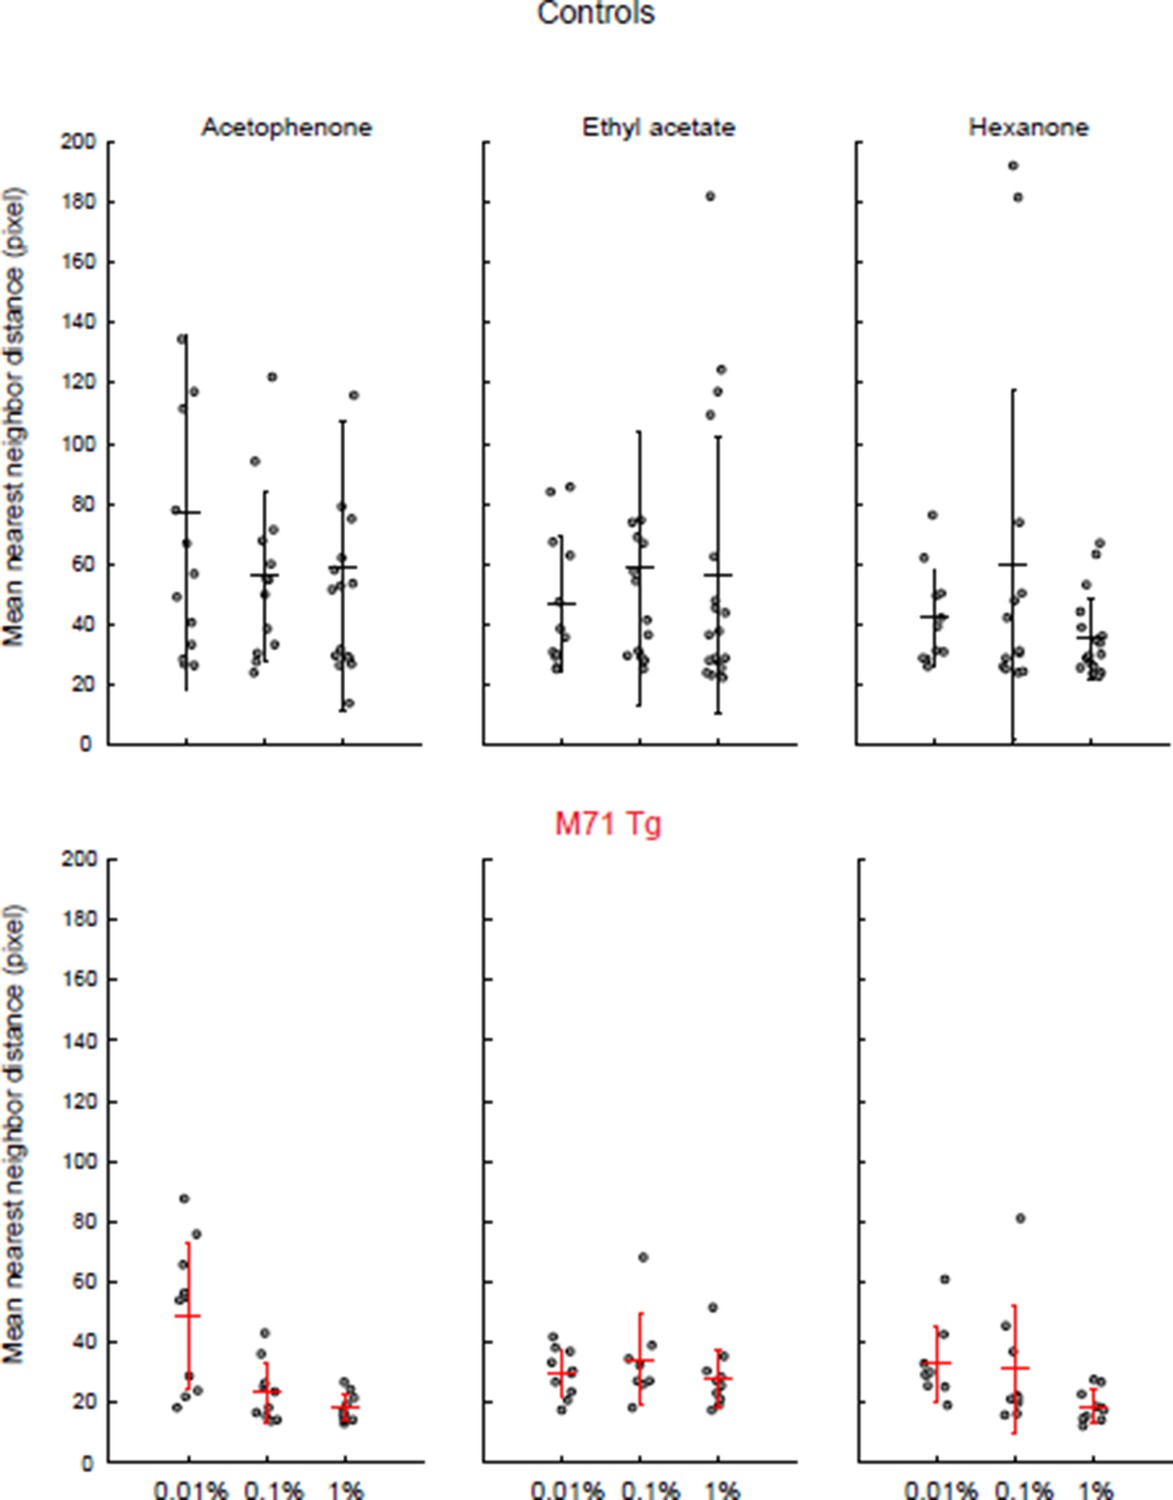
Clustering of mitral cell responses in controls and M71 transgenic mice.
https://doi.org/10.7554/eLife.16335.016Download links
A two-part list of links to download the article, or parts of the article, in various formats.
Downloads (link to download the article as PDF)
Open citations (links to open the citations from this article in various online reference manager services)
Cite this article (links to download the citations from this article in formats compatible with various reference manager tools)
Massive normalization of olfactory bulb output in mice with a 'monoclonal nose'
eLife 5:e16335.
https://doi.org/10.7554/eLife.16335


