Transient rapamycin treatment can increase lifespan and healthspan in middle-aged mice
- University of Washington, United States
- Fred Hutchinson Cancer Research Center, United States
- University of Missouri, United States
Figures
Figure 1 with 4 supplements
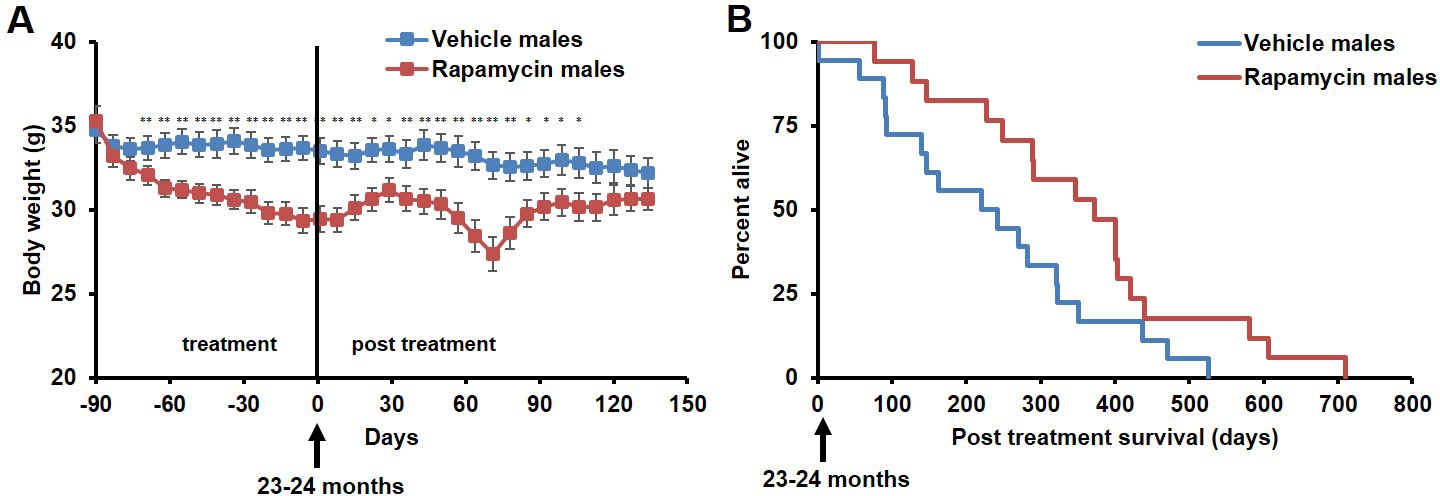
Rapamycin injection at 8 mg/kg/day for 3 months extends life expectancy of male mice.
(A) Body weight of male mice measured weekly after starting rapamycin and vehicle treatment. Data are indicated as mean ± s.e.m. *p<0.05. **p<0.01. (B) Survival of control and rapamycin-treated male mice following the end of treatment. p=0.02. N=18 vehicle injected, N=17 rapamycin.
Figure 1—figure supplement 1

Rapamycin serum level does not differ between female and male mice.
Blood levels of rapamycin in mice 24 hr after finishing daily i.p. injections for 3 months. p=0.359. Females, N = 16. Males, N = 16. Data are indicated as mean ± s.e.m.
Figure 1—figure supplement 2
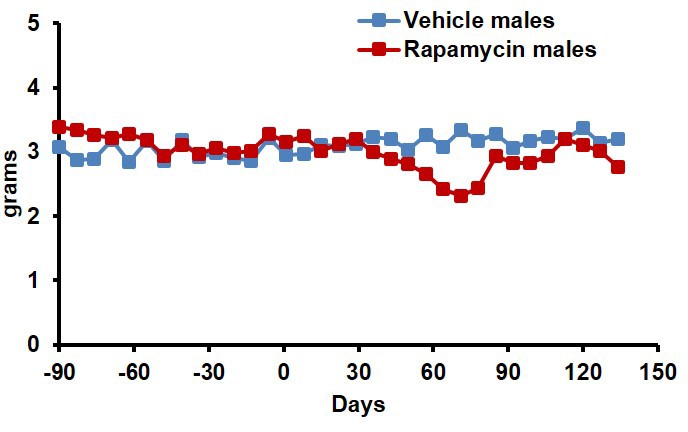
Food intake of male mice receiving 8 mg/kg/day i.p. rapamycin or vehicle injections.
Food intake measured weekly by weighing the food given to each cage and the food remaining on the wire rack in each cage.
Figure 1—figure supplement 3
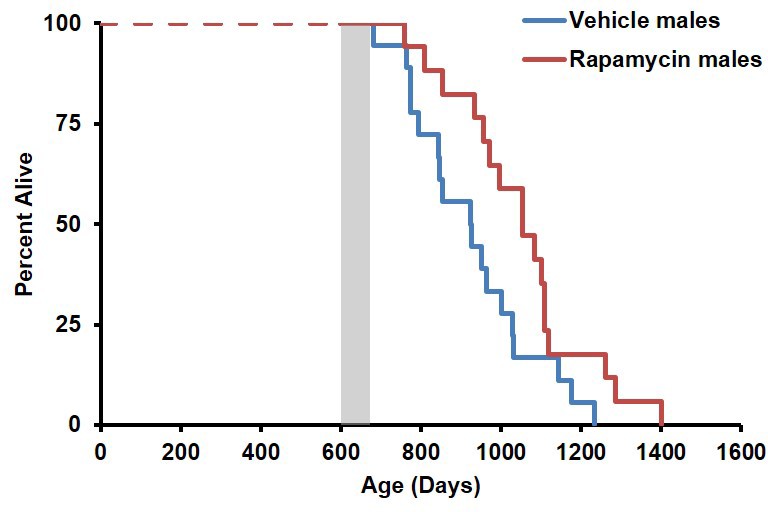
Survival plots of male mice treated with 8 mg/kg/day i.p. rapamycin for 90 days starting around 600 days of age.
Gray box approximately indicates treatment period. Note: although the curves start at age=0 to represent all of life, we have no data on animals that may have died in this cohort prior to receipt from NIA (dashed lines). N=18 vehicle injected, N=17 rapamycin.
Figure 1—figure supplement 4
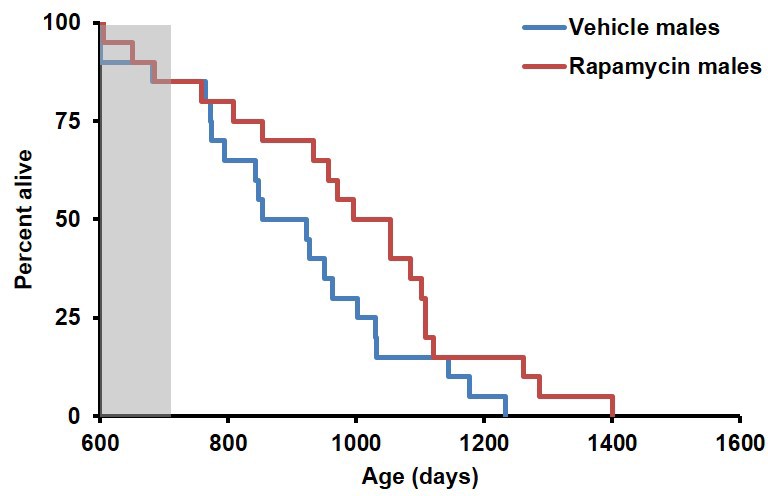
Inclusion of non-age-related deaths does not alter survival outcomes.
Lifespan curve of male mice injected with either vehicle or 8 mg/kg/day rapamycin including deaths during the treatment period from non-age-related causes. N=20 vehicle injected, N=20 rapamycin.
Figure 2 with 2 supplements
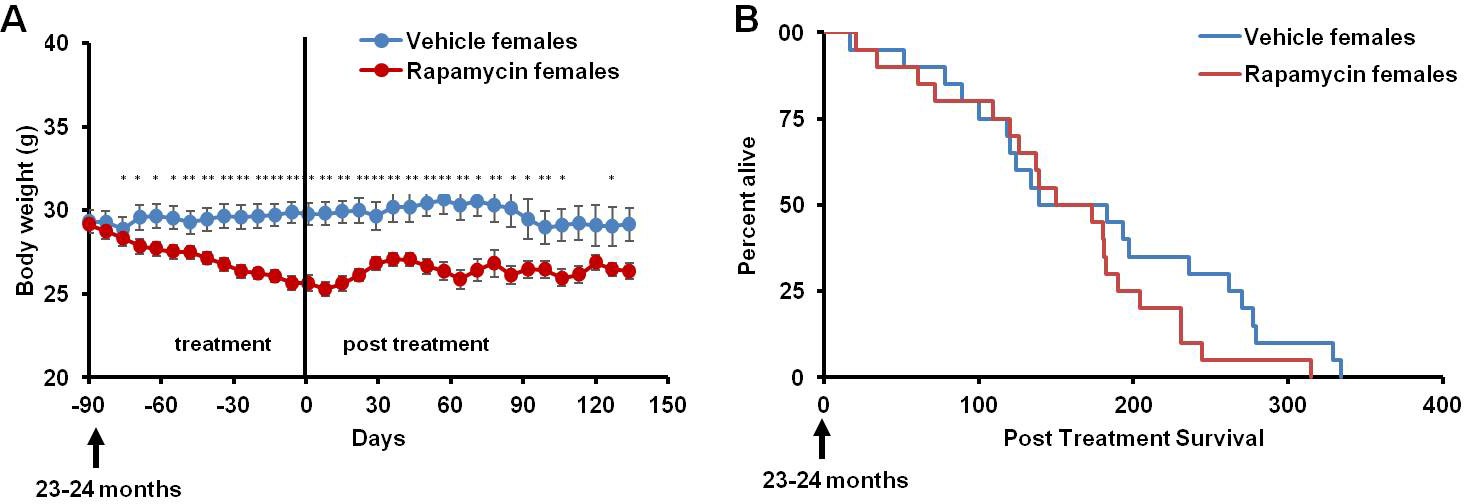
Rapamycin injection at 8 mg/kg/day for 3 months does not increase life expectancy of female mice.
(A) Body weight of female mice measured weekly after starting rapamycin and vehicle treatment. Data are indicated as mean ± s.e.m. *p<0.05, **p<0.01 (B) Survival of control and rapamycin-treated female mice following the end of treatment. p=0.261. N=20 vehicle injected, N=20 rapamycin.
Figure 2—figure supplement 1
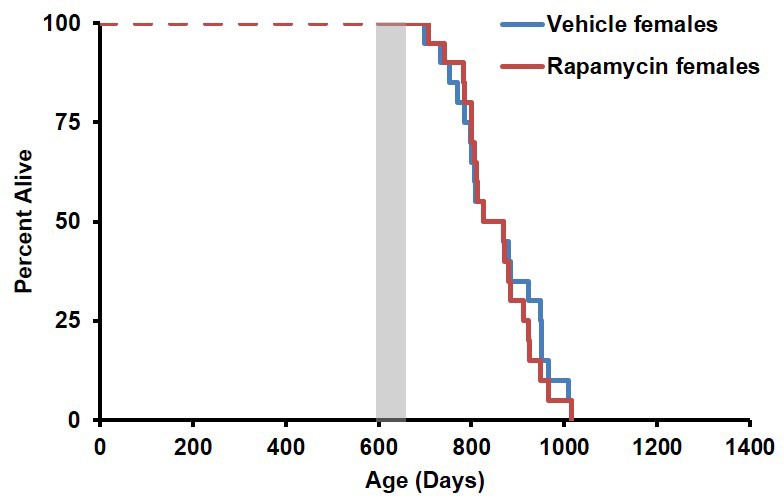
Survival plots of female mice treated with 8 mg/kg/day i.p. rapamycin for 90 days starting around 600 days of age.
Note: although the curves start at age=0 to represent all of life, we have no data on animals that may have died in this cohort prior to receipt from NIA (dashed lines). Gray box approximately indicates treatment period. N=20 vehicle injected, N=20 rapamycin.
Figure 2—figure supplement 2
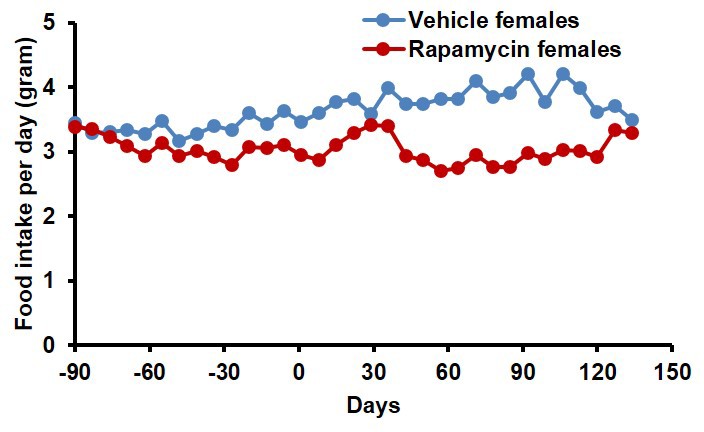
Food intake of female mice receiving 8 mg/kg/day i.p. rapamycin or vehicle injections.
Food intake measured weekly by weighing the food given to each cage and the food remaining on the wire rack in each cage.
Figure 3 with 2 supplements
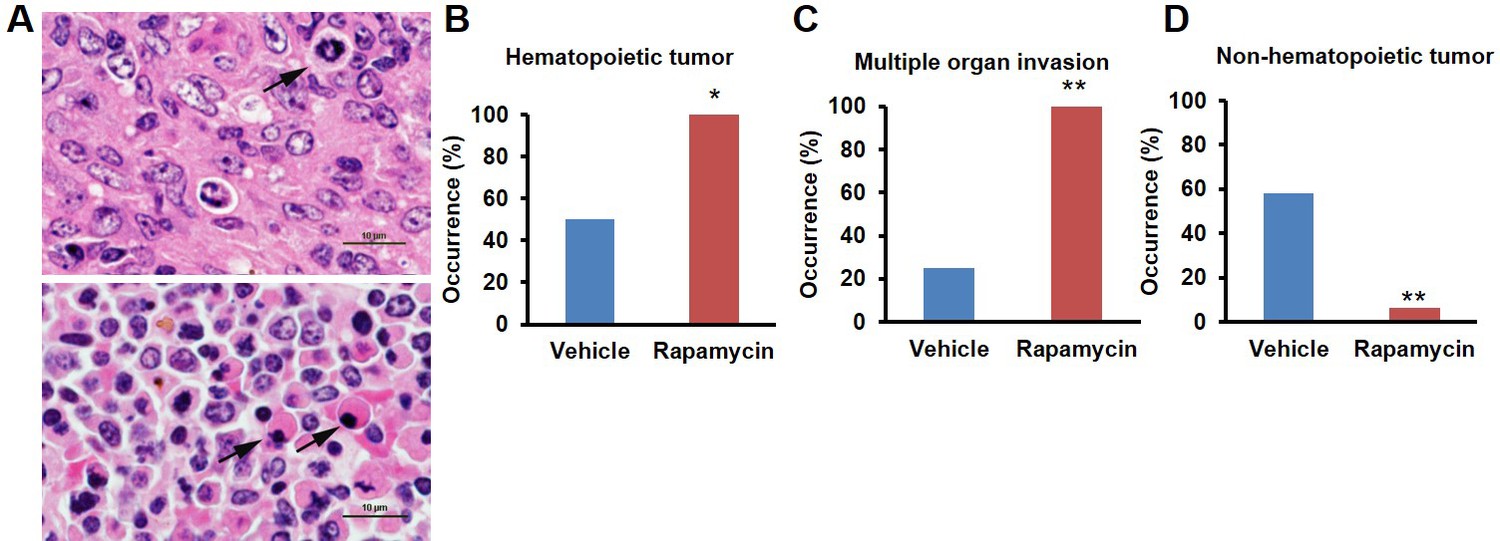
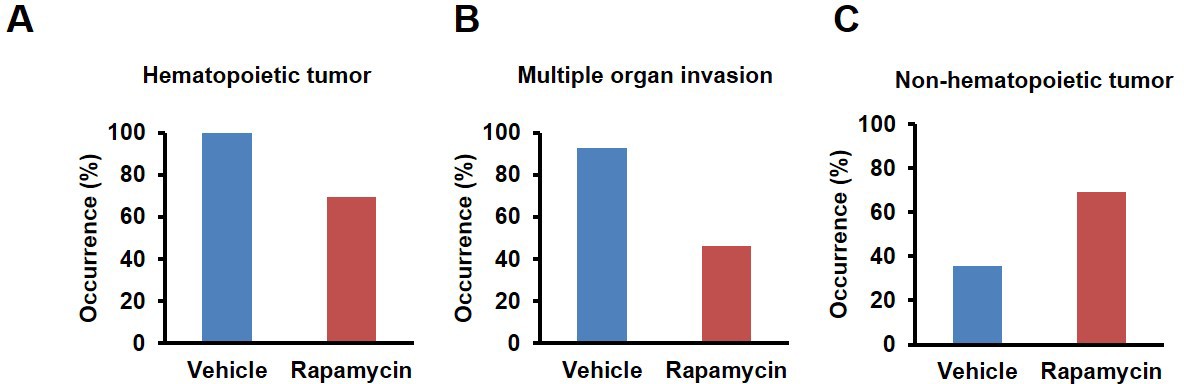
Rapamycin injection at 8 mg/kg/day for 3 months alters cancer incidence of female mice.
(A) Hematoxylin and eosin (H&E) sections of multisystemic aggressive lymphoma (top) and atypical plasmacytoid lymphoma (bottom) from rapamycin-treated female mice. Arrows indicate a bizarre mitotic figure (top) and round cells with strongly eosinophilic cytoplasm (plasmacytoid morphology, bottom). Original magnification 60x. Bar = 10 µm. (B) Hematopoietic cancer incidence of rapamycin-treated (16 female) and vehicle-treated (12 female) mice. (C) Incidence of multiple organ invasion of hematopoietic tumors in rapamycin-treated (16 female) and vehicle-treated (6 female) hematopoietic tumor-bearing mice. (D), Non-hematopoietic cancer incidence of rapamycin-treated (16 female) and vehicle-treated (12 female) mice. *p<0.05. **p<0.01.
Figure 3—figure supplement 1
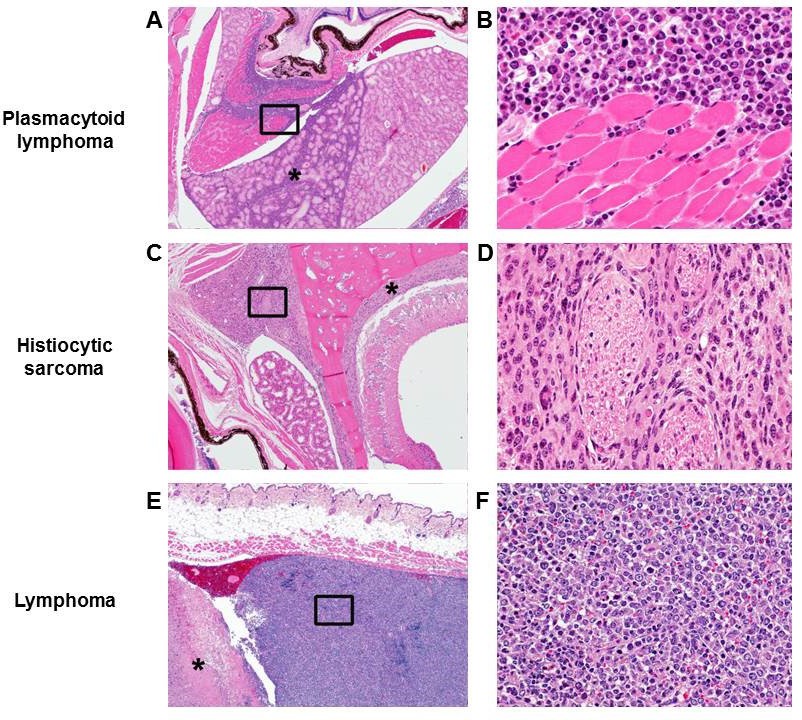
Morphologies of aggressive hematopoietic tumors observed in rapamycin injected females.
H&E sections of 3 representative hematopoietic tumor types observed in rapamycin treated female mice. Lower magnification (A, C, E. Original magnification 4x) represents an uncommon site of invasion for hematopoietic tumors in C57BL/6 mice. Higher magnification (B, D, F. Original magnification 40x. The region is approximately indicated by the box in A, C, E, respectively) shows the morphology of each cancer cell type. (A) Sheets of neoplastic round cells infiltrate the soft tissues of the head including the Harderian gland (*) and retrobulbar musculature (indicated by box). (B) Neoplastic round cells have a plasmacytoid morphology characterized by an eccentric nucleus, perinuclear halo, and occasionally strongly eosinophilic cytoplasm. (C) A round cell neoplasm morphologically consistent with histiocytic sarcoma in a high dose rapamycin treated female expands and infiltrates the meninges (*) and soft tissues of the head (indicated by box). (D) A round cell neoplasm morphologically consistent with histiocytic sarcoma. Neoplastic histiocytes with abundant eosinophilic cytoplasm and occasional multinucleated giant cells separate and surround nerves. (E) Subcutaneous round cell neoplasm in a high dose rapamycin treated female associated with severe necrosis (*). Box indicates neoplasm composed of sheets of neoplastic lymphocytes. (F) Neoplastic lymphocytes have scant to moderate cytoplasm, marked anisocytosis and anisokaryosis, and frequent mitotic cells.
Figure 3—figure supplement 2
Cancer incidence of male mice with rapamycin injection at 8 mg/kg/day for 3 months.
(A) Hematopoietic cancer incidence of rapamycin-treated (15 male) and vehicle-treated (14 male) mice. (B) Incidence of multiple organ invasion of hematopoietic tumors in rapamycin-treated (9 male) and vehicle-treated (14 male) hematopoietic tumor-bearing mice. (C) Non-systemic hematopoietic cancer incidence of rapamycin-treated (15 male) and vehicle-treated (14 male) mice. **p<0.01.
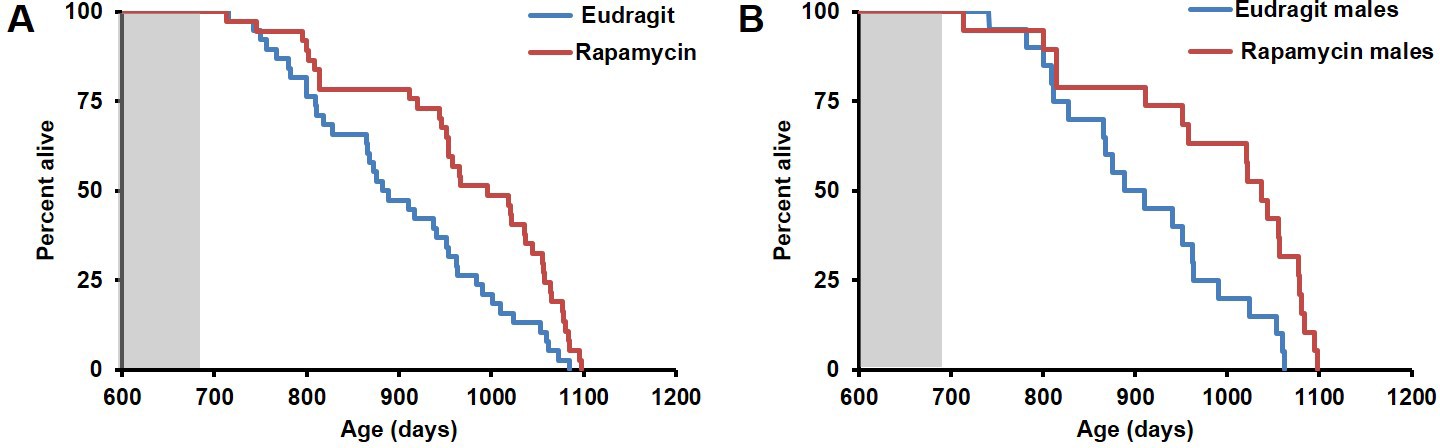
Figure 4 with 3 supplements
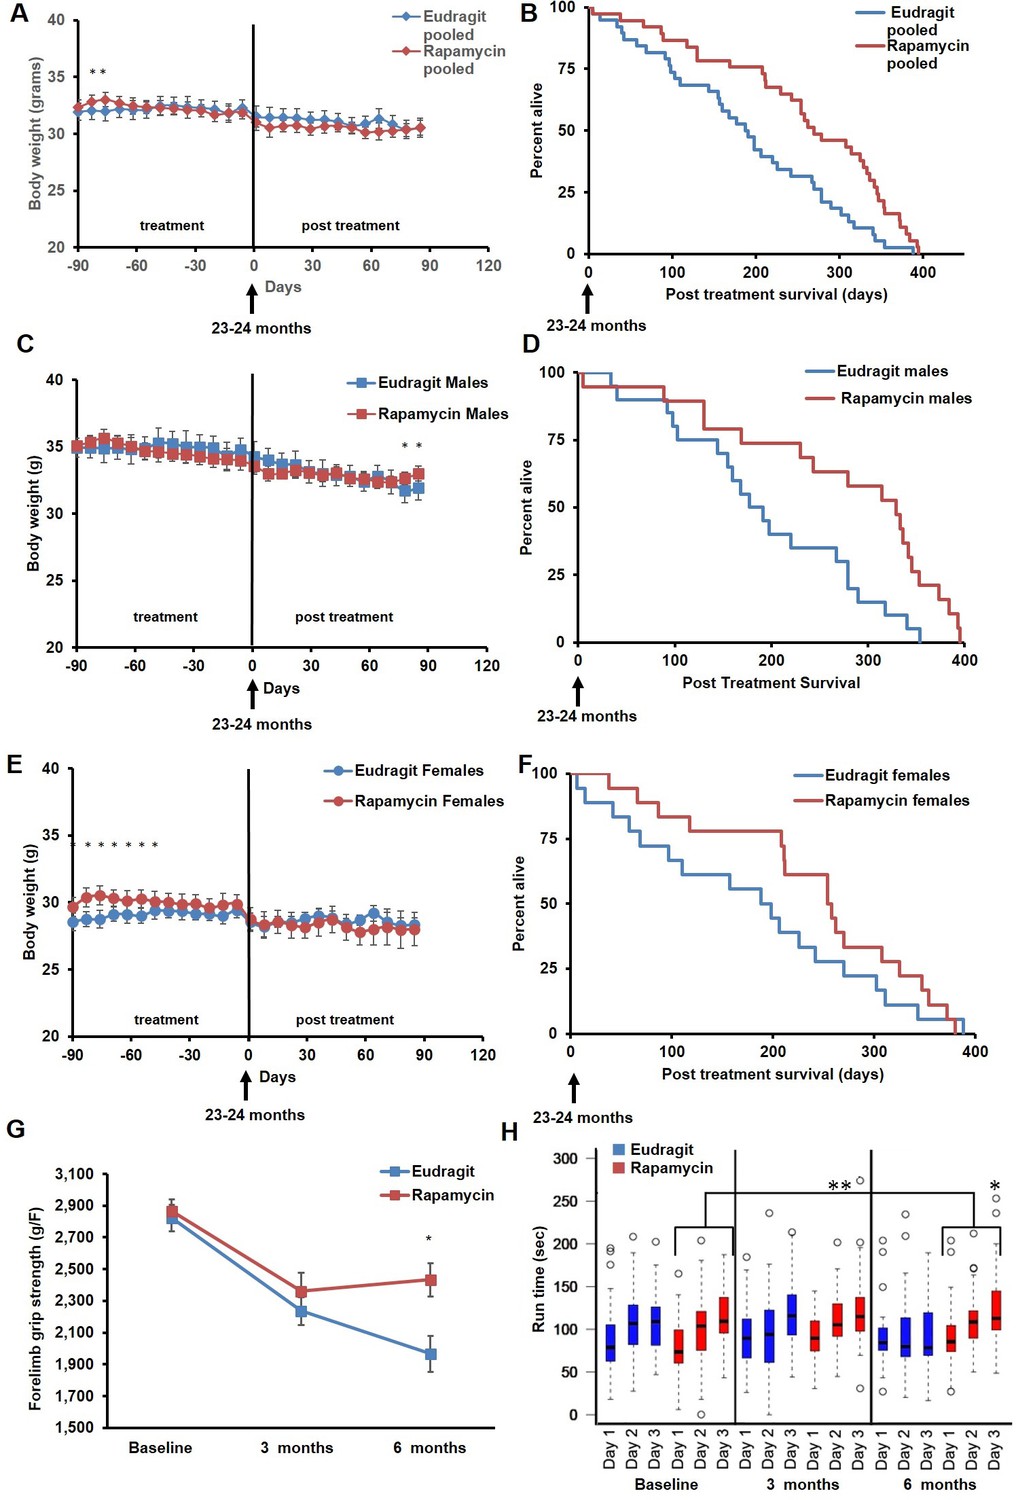
Rapamycin feeding at 126 ppm for 3 months extends life expectancy.
(A, C, E) Body weight of (A) sex-pooled, (C) male, and (E) female mice measured weekly after starting rapamycin and eudragit treatment. *p<0.05. Survival of (B) sex-pooled control and rapamycin-treated mice following the end of treatment. p=0.002. N=38 vehicle injected, N=37 rapamycin. (C). Survival of (D) male, and (F) female control and rapamycin-treated mice following the end of treatment. (D) N=20 eudragit males, N=19 126 ppm eRapa males. (F) N=18 eudragit females, N=18 eRapa females. (G) Forelimb grip strength tests measured prior to treatment initiation (baseline), upon cessation of treatment (3 months), and 3 months after the drug withdrawal (6 months). (H) Rotarod performance tested prior to treatment initiation (baseline), upon cessation of treatment (3 months), and 3 months after the drug withdrawal (6 months). Data are plotted with box-whisker plots, showing median, 25th and 75th percentile, as well as individual outliers. Statistical significance was calculated with a linear mixed-effect model, using treatment group, measurement date, and measurement day as fixed effects and individual mice identifiers as random variables. *p<0.05 rapamycin vs. control at 6 months. **p<0.01 rapamycin at 6 months vs. rapamycin at baseline.
Figure 4—figure supplement 1
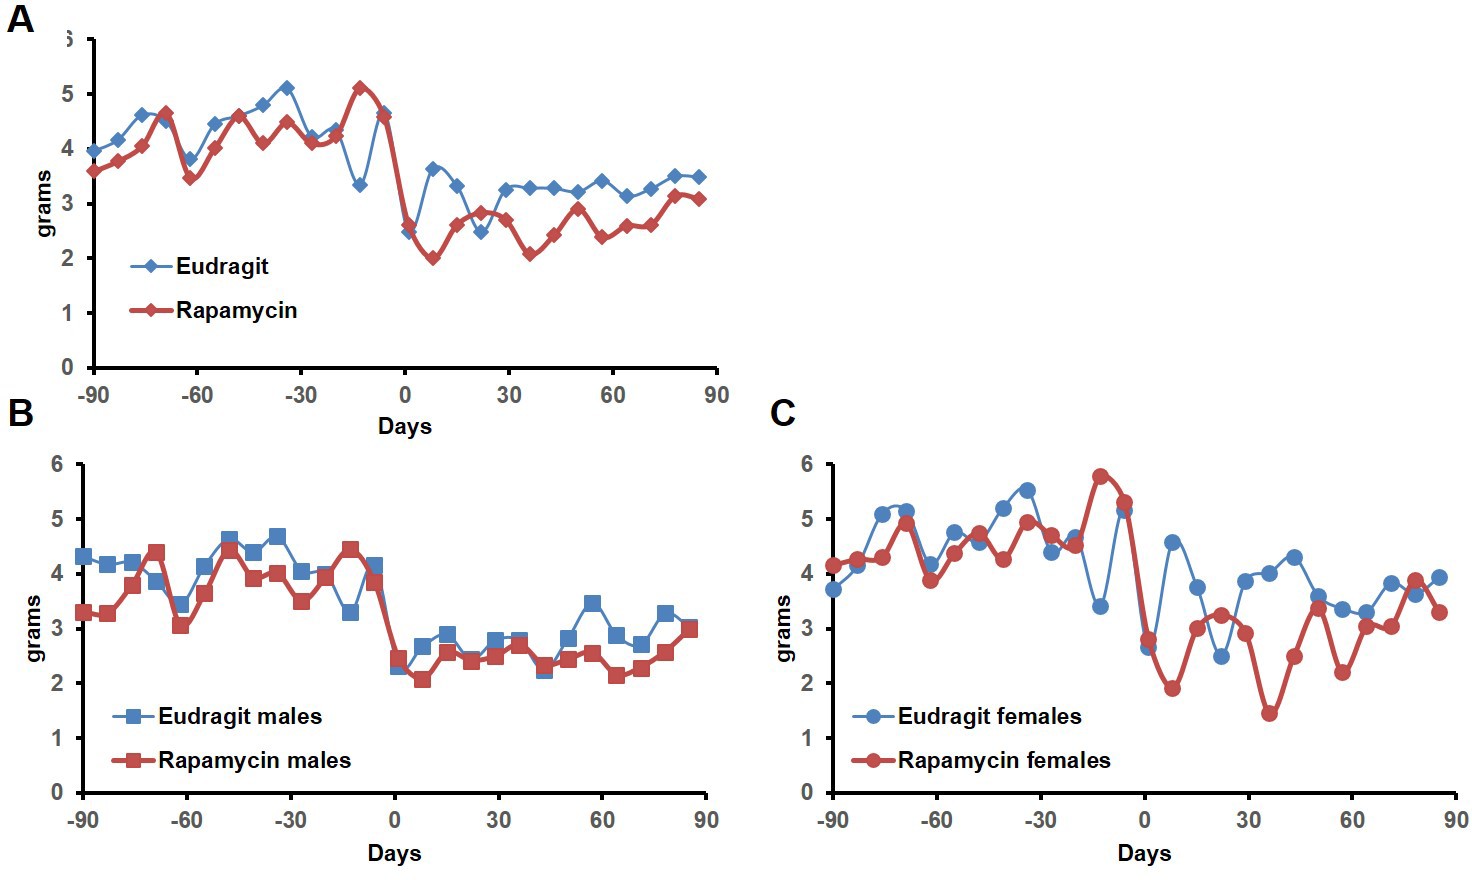
Food intake of mice receiving 126 ppm eRapa or eudragit control.
Food intake measured weekly by weighing the food given to each cage and the food remaining on the wire rack in each cage after 5–7 days.
Figure 4—figure supplement 2
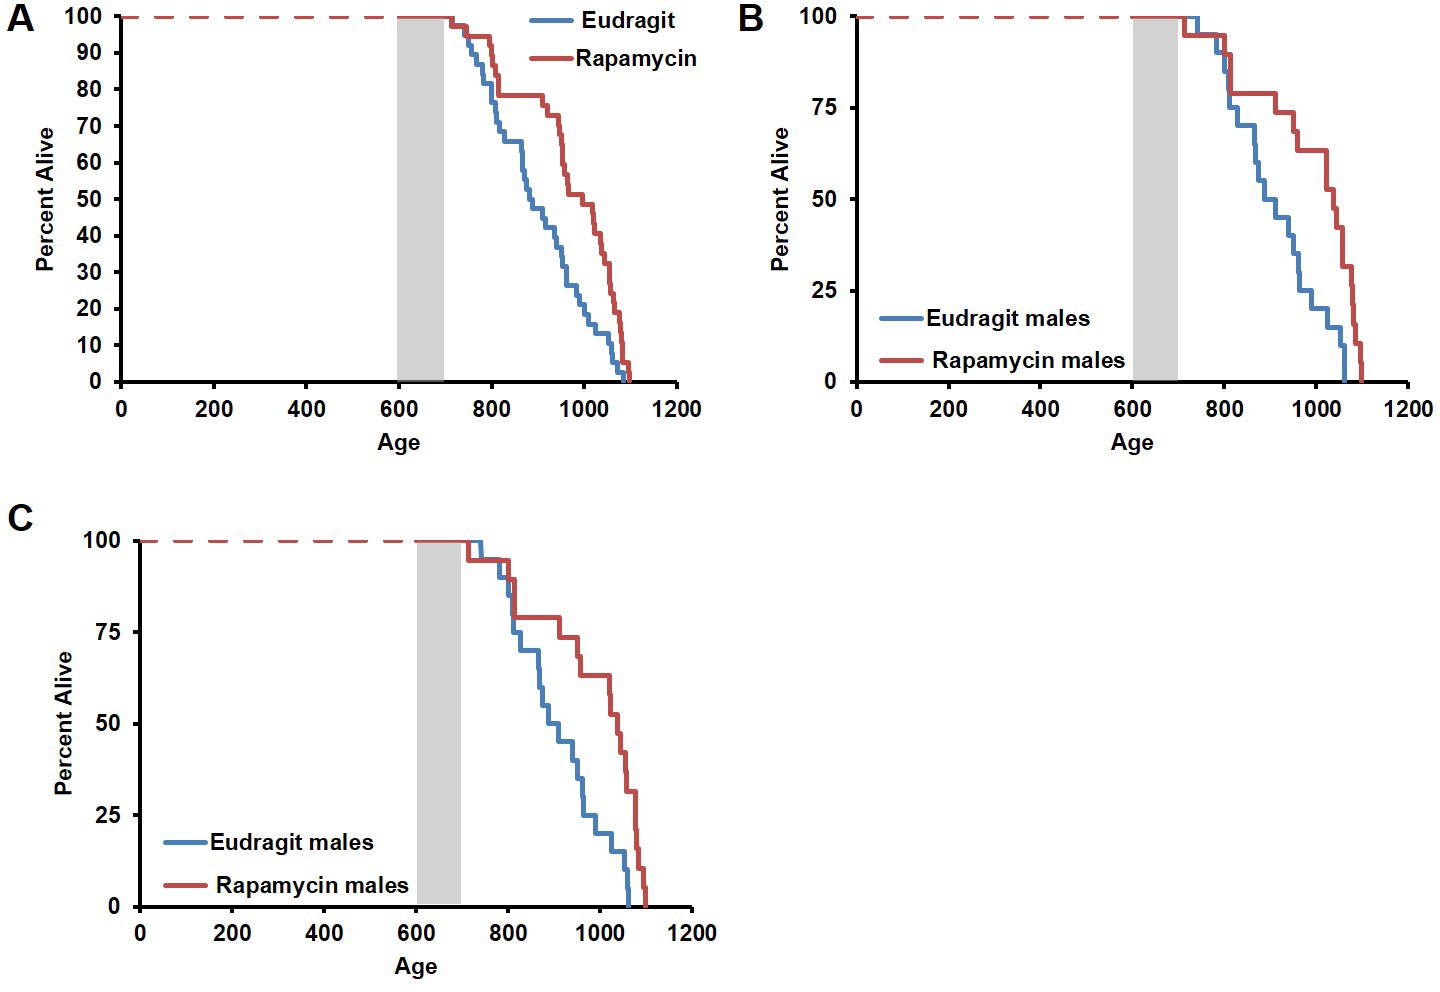
Effects of 126 ppm eRapa treatment on lifespan in male and female mice.
(A) Survival plots of sex-pooled mice treated with 126 ppm eudragit or eRapa for 90 days starting around 600 days of age. Note: although the curves start at age=0 to represent all of life, we have no data on animals that may have died in this cohort prior to receipt from NIA. Gray box approximately indicates treatment period. N=38 vehicle injected, N=370 eRapa. (B, C) Sex-segregated survival plots of male (B) and female (C) mice fed 126 ppm eudragit or eRapa for 90 days starting around 600 days of age. Note: although the curves start at age=0 to represent all of life, we have no data on animals that may have died in this cohort prior to receipt from NIA. Gray box approximately indicates treatment period. (B) N=20 eudragit males, N=19 126 ppm eRapa males. (C) N=18 eudragit females, N=18 eRapa females.
Figure 4—figure supplement 3
Inclusion of non-age-related deaths does not alter survival outcomes.
(A, B). Survival plots of (A) male and (B) sex-pooled mice fed 126 ppm eudragit or eRapa for 90 days including deaths during the treatment period from non-age-related causes.(A) N=38 vehicle injected, N=38 eRapa. (B) N=20 eudragit males, N=20 126 ppm eRapa males.
Figure 5 with 1 supplement
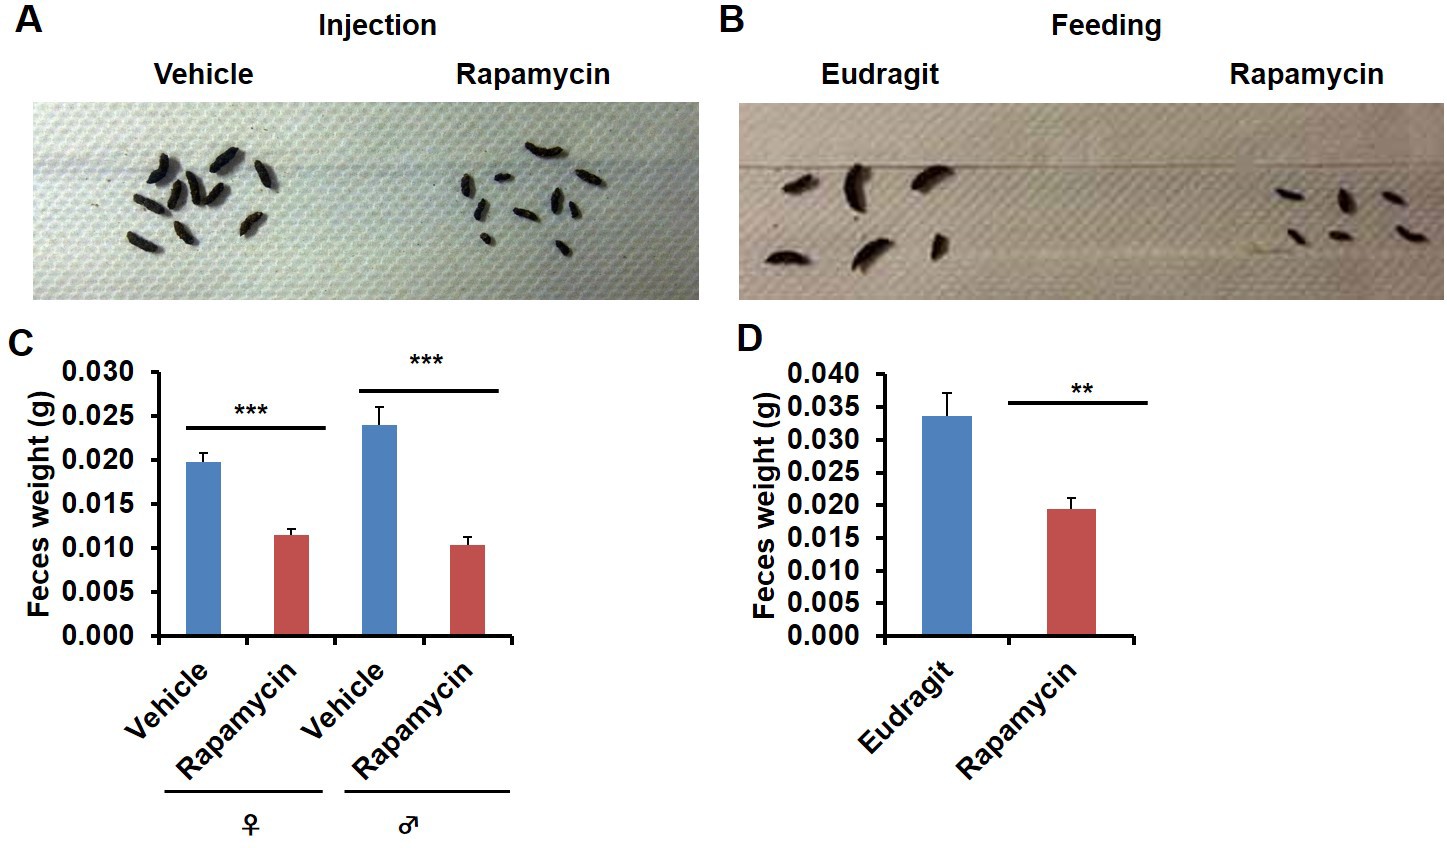
Rapamycin decreases fecal pellet size.
(A) Photograph of feces collected from rapamycin-injected and vehicle-injected animals at 3 months of the treatment. (B) Photograph of feces collected from rapamycin-fed and eudragit-fed animals at 3 months of the treatment. (C) The weight of fecal pellets collected from rapamycin-injected and vehicle-injected animals at 3 months of the treatment. N = 22–24. (D) The weight of fecal pellets collected from rapamycin-fed and eudragit-fed female animals at 3 months of the treatment. N = 11. Data are indicated as mean ± s.e.m. *p<0.05. **p<0.01. ***p<0.001.
Figure 5—figure supplement 1
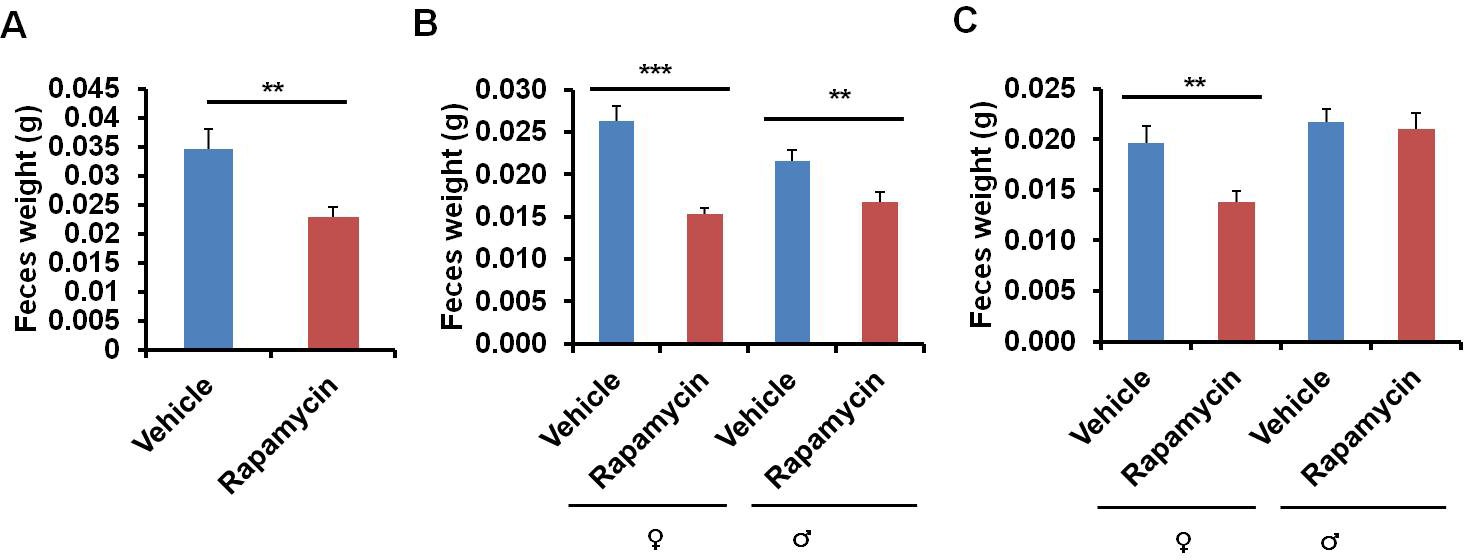
Rapamycin decreases fecal pellet size persistently after cessation of treatment.
(A) Weight of freshly excreted fecal pellets collected from rapamycin-injected and vehicle-injected male animals at 3 months of the treatment. N = 13 Vehicle, N = 19 Rapamycin. (B) Weight of fecal pellets collected from rapamycin-injected and vehicle-injected animals 1 month after cessation of the treatment. N = 71 vehicle female, N = 90 rapamycin female, N = 47 vehicle male, N = 36 rapamycin male. (C) Weight of fecal pellets collected from rapamycin-injected and vehicle-injected animals 4 months after cessation of the treatment. N = 22 vehicle female, N = 21 rapamycin female, N = 23 vehicle male, N = 22 rapamycin male. Data are indicated as mean ± s.e.m. *p<0.05. **p<0.01. ***p<0.001.
Figure 6 with 3 supplements
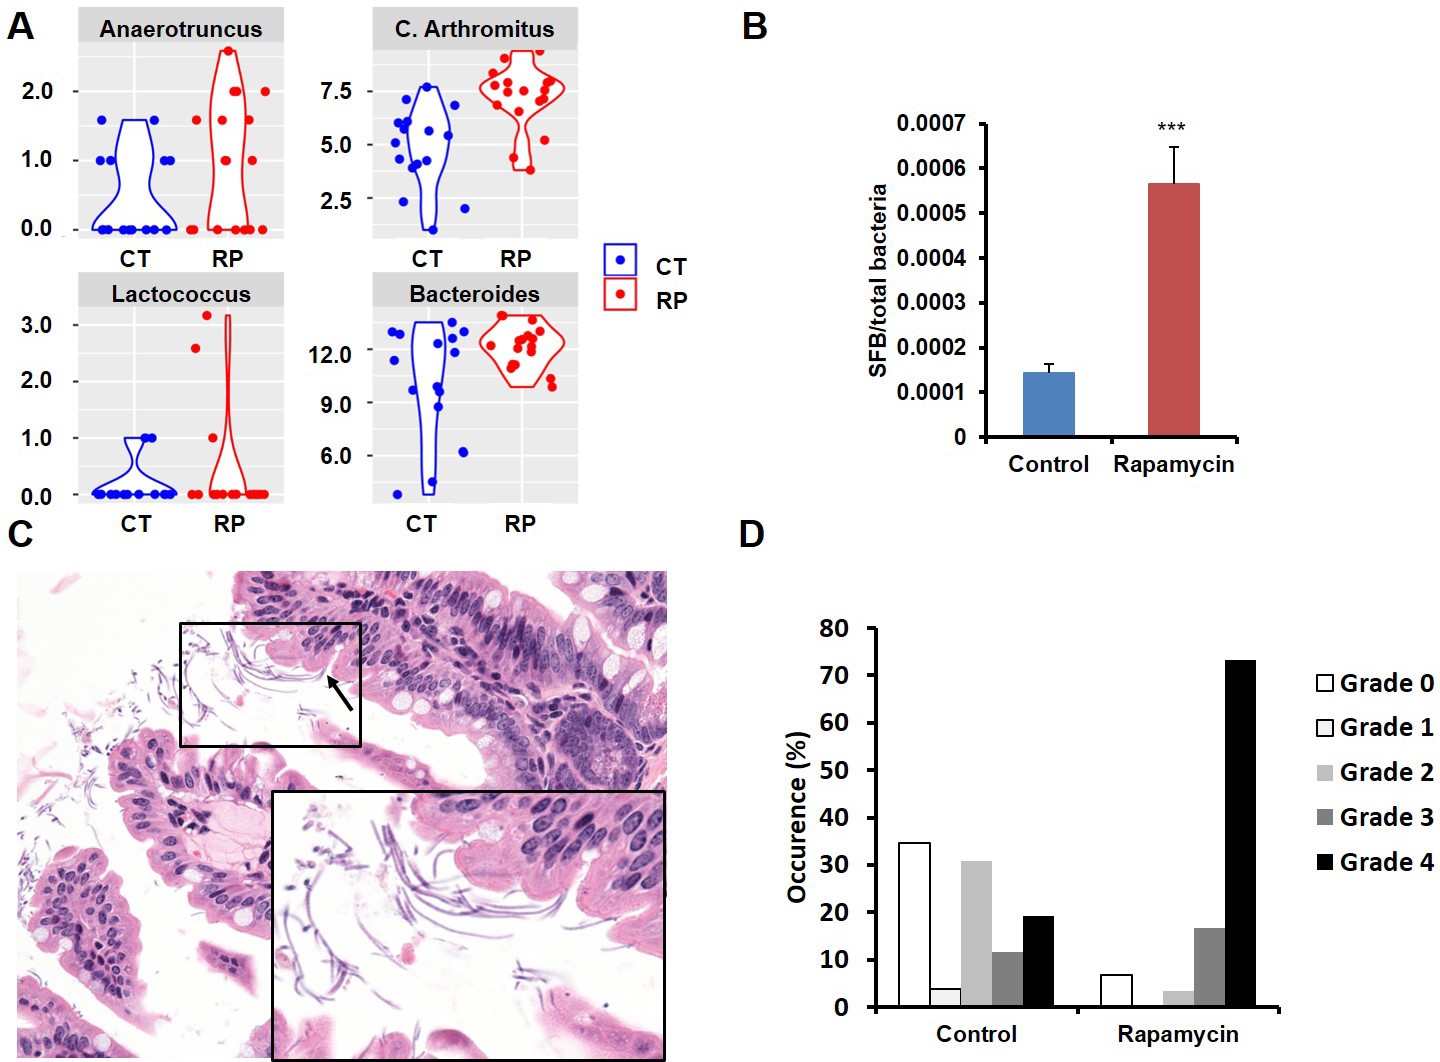
Rapamycin changes the composition of gut microbiota and increases segmented filamentous bacteria.
(A) Violin plots representing the Log2 16S rRNA gene abundance for operation taxonomy units (OTUs) in fecal samples that are significantly differentially prevalent at a false discovery rate of 0.05 using the R package metagenomeSeq, controlling for the delivery method, gender and mouse batch effects. (C) Arthromitus (Candidatus Arthromitus sp.) refers to segmented filamentous bacteria (SFB). CT and RP indicate control and rapamycin, respectively. (B) The ratio of SFB DNA to total bacterial DNA in fecal samples measured by real-time PCR. N = 32. Data are indicated as mean ± s.e.m. ***p<0.001. (C) Representative H&E section of the intestine of rapamycin-treated mouse. Arrow indicates SFB attached to the intestinal epithelial cells. Lower right quadrant: magnification of area enclosed in black rectangle. (D) Semi-quantitative grading of SFB amount in the intestinal tissue section. 0 indicates the absence of SFB. 1–4 indicates the grades of the SFB amount with 1 lowest and 4 highest. Fisher’s exact test p=3.6 x 10⁻⁵.
Figure 6—figure supplement 1
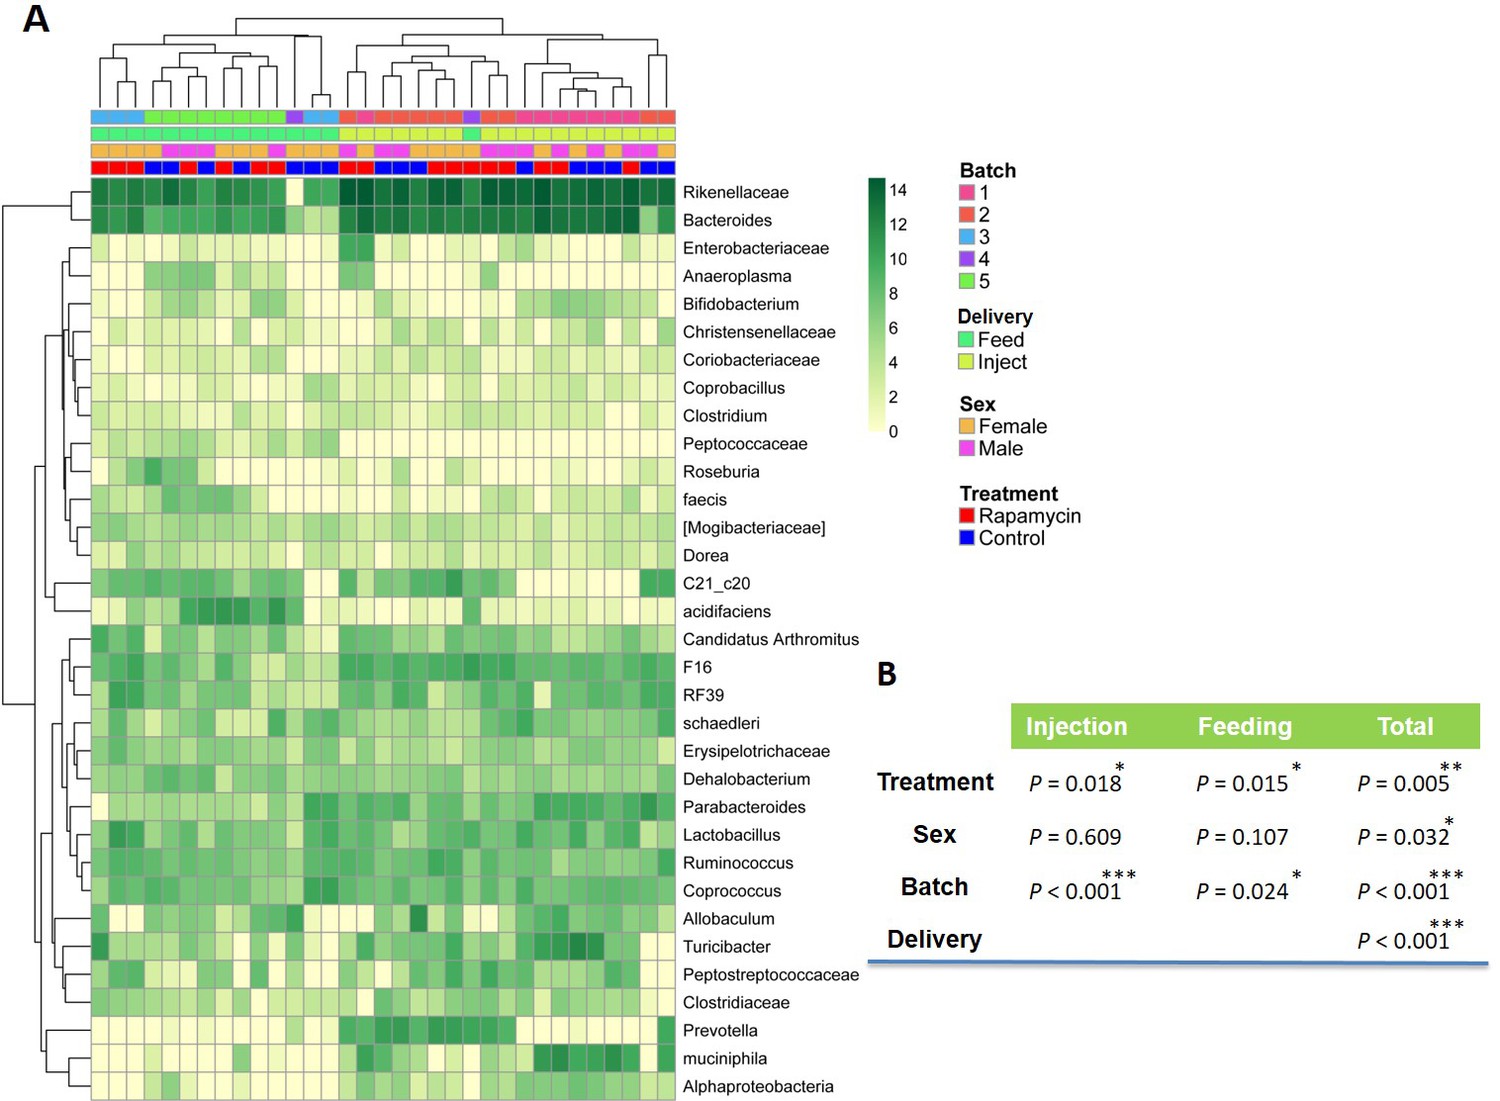
Effect of rapamycin on the fecal microbiome.
(A) Heatmap of the Log2 16S rRNA gene abundance by mouse (column) and operation taxonomy units (OTU)s (row). The clustering is done on a subset of the OTUs with total abundance of more than 10 and relatively large variability (standard deviation of more than 1). Batch numbers indicates mice shipped and received into our facility at the same time. Feed and Inject indicate drug delivery via encapsulated feed and via injection, respectively. The hierarchical clustering shows the large effects of drug delivery method and batch effect on the microbial composition. (B) Table of P values from multivariate analysis for rapamycin vs. control (treatment), female vs. male (sex), mouse cages received into our facility at different times (batch) and injection vs. feeding regimen (delivery). *p<0.05. **p<0.01. ***p<0.001.
Figure 6—figure supplement 2
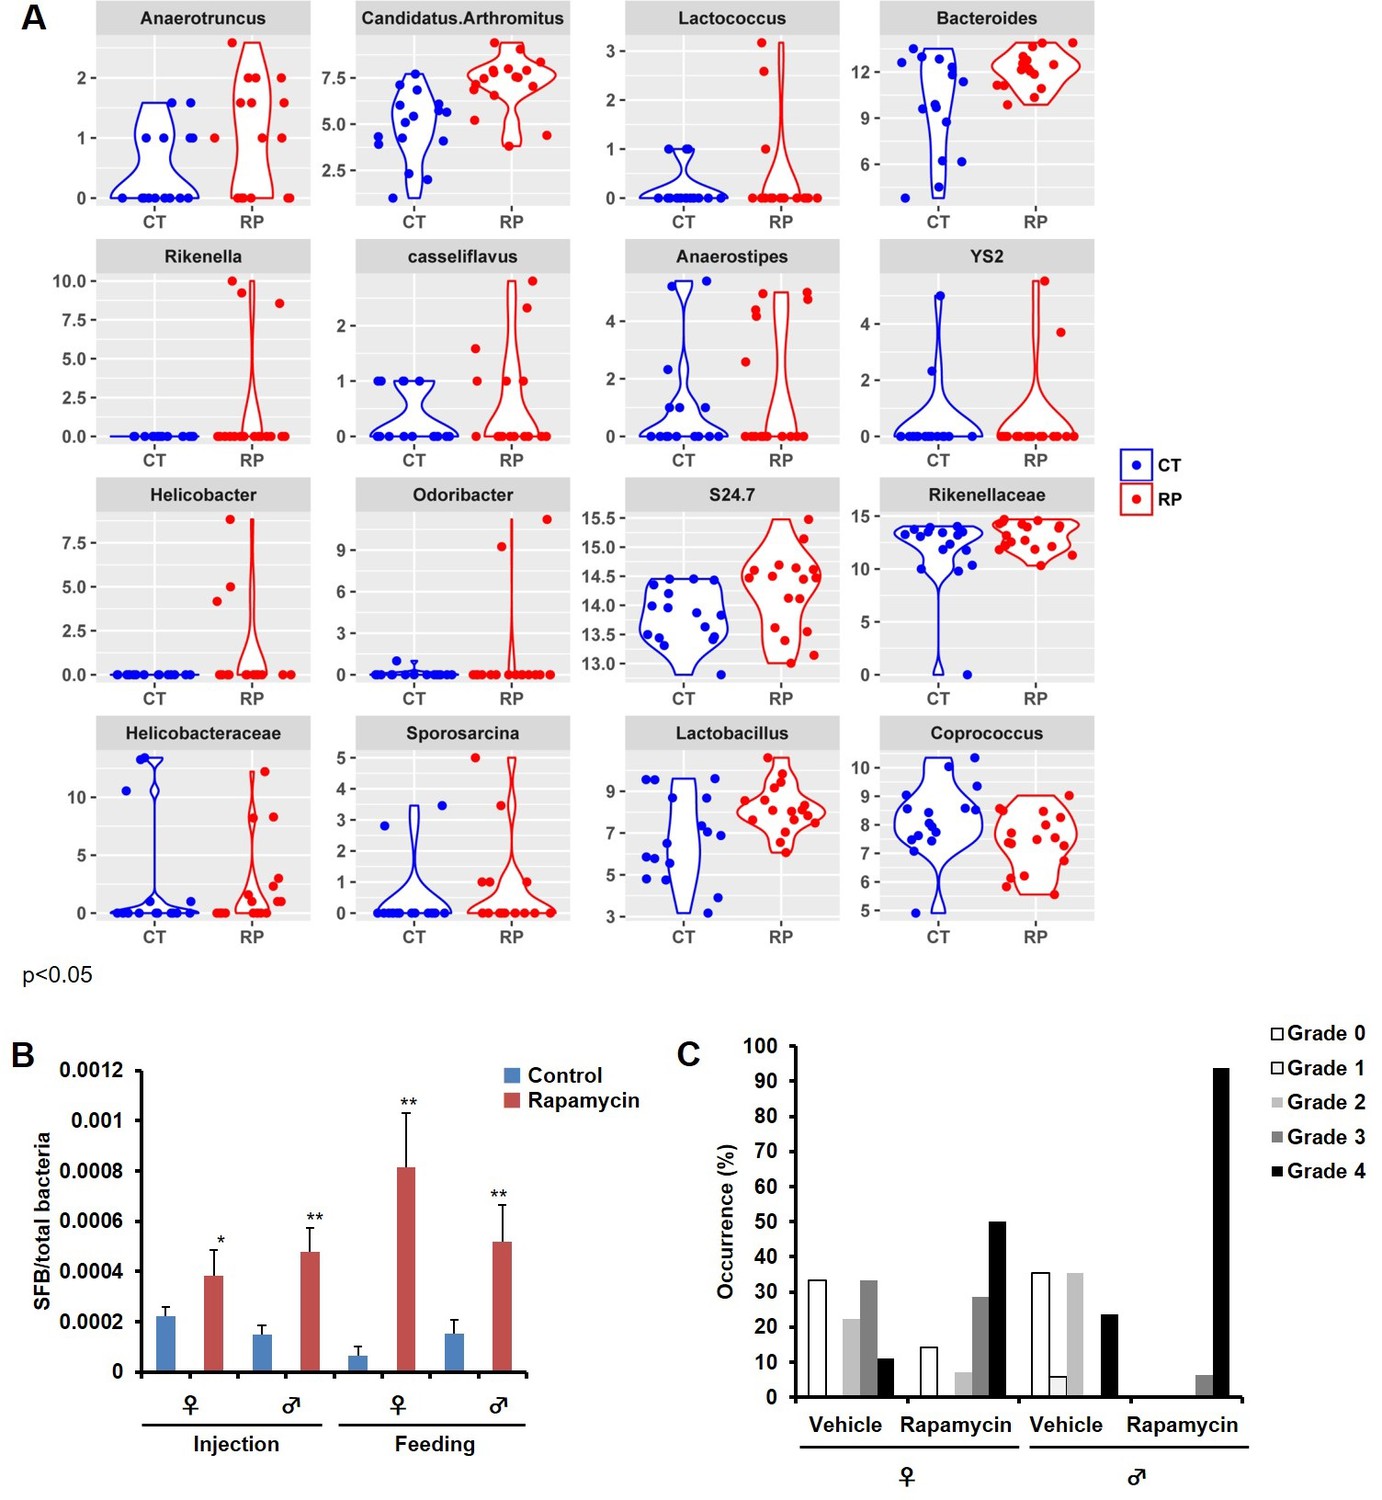
Bacterial DNA in fecal samples significantly different between control and rapamycin.
(A). Prevalence distribution of operation taxonomy units (OTUs) (Log2 of 16 rRNA gene abundance) in fecal samples that have p-values less than 0.05 using the R package metagenomeSeq, contrasting control and rapamycin group after controlling for the delivery method, gender and mouse batch effects. CT and RP indicate control and rapamycin, respectively. (B) The ratio of SFB DNA to total bacterial DNA in fecal samples measured by Real-time PCR divided by sex and treatment method. N = 4–10. Data are indicated as mean ± s.e.m. *p<0.05. **p<0.01. (C) Semi-quantitative grading of SFB amount in the intestinal tissue section. 0 indicates the absence. 1–4 indicates the grades of the SFB amount with 1 lowest and 4 highest.
Figure 6—figure supplement 3
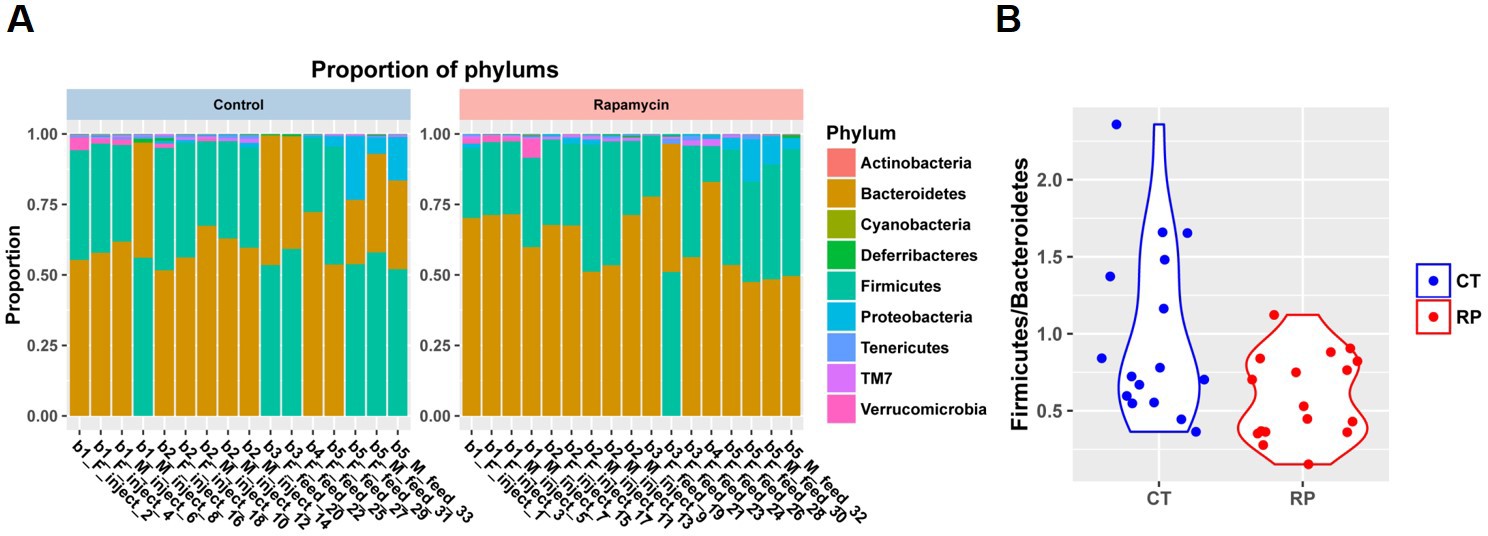
Bacterial composition in fecal samples at phylum level.
(A) Stacked bar plot showing the proportion of phylum within each fecal sample. b1-5 indicate mouse batches that were shipped at a different time. F and M indicate female and male, respectively. Feed and inject indicate drug delivery via encapsulated feed and via injection, respectively. (B) Violin plot of Firmicutes to Bacteroidetes ratio in fecal samples. CT and RP indicate control and rapamycin, respectively.
Tables
Table 1
Sex-segregated comparison of median and mean post-treatment life expectancy for mice receiving rapamycin by injection (8 mg/kg/day) or feeding (128 ppm). M: males, F: females.
| Median life expectancy (days) | Percent life expectancy increase | Mean life expectancy (days) | Percent life expectancy increase | |
|---|---|---|---|---|
| Vehicle M | 231 | 235 | ||
| Rapamycin (8mg/kg/day) M | 372 | 61 | 358 | 53 |
| Vehicle F | 161 | 177 | ||
| Rapamycin (8mg/kg/day) F | 161 | 0 | 171 | -3 |
| Eudragit M | 193 | 199 | ||
| Rapamycin (126 ppm) M | 279 | 44.6 | 242 | 21 |
| Eudragit F | 184 | 175 | ||
| Rapamycin (126 ppm) F | 256 | 39 | 240 | 37 |
Table 2
Sex-segregated comparison of median and mean lifespan for mice receiving rapamycin by injection (8 mg/kg/day) or feeding (128 ppm). M: males, F: females.
| Median lifespan (days) | Percent median lifespan increase | Mean lifespan (days) | Percent mean lifespan increase | |
|---|---|---|---|---|
| Vehicle M | 925 | 929 | ||
| Rapamycin (8mg/kg/day) M | 1054 | 14 | 1050 | 13 |
| Vehicle F | 847 | 858 | ||
| Rapamycin (8mg/kg/day) F | 847 | 0 | 853 | -1 |
| Eudragit M | 914 | 912 | ||
| Rapamycin (126 ppm) M | 1037 | 14 | 984 | 8 |
| Eudragit F | 879 | 883 | ||
| Rapamycin (126 ppm) F | 960 | 9 | 951 | 8 |
Table 3
Sex-pooled comparison of median and mean post-treatment life expectancy for mice receiving rapamycin by injection (8 mg/kg/day) or feeding (128 ppm).
| Median life expectancy (days) | Percent life expectancy increase | Mean Life expectancy (days) | Percent life expectancy increase | |
|---|---|---|---|---|
| Vehicle | 188 | 204 | ||
| Rapamycin (8mg/kg/day) | 231 | 22 | 257 | 26 |
| Eudragit | 190 | 188 | ||
| Rapamycin (126 ppm) | 270 | 42 | 257 | 37 |
Table 4
Sex-pooled comparison of median and mean lifespan for mice receiving rapamycin by injection (8 mg/kg/day) or feeding (128 ppm).
| Median lifespan (days) | Percent median lifespan increase | Mean lifespan (days) | Percent mean lifespan increase | |
|---|---|---|---|---|
| Vehicle | 874 | 892 | ||
| Rapamycin (8mg/kg/day) | 922 | 5 | 944 | 5 |
| Eudragit | 885 | 899 | ||
| Rapamycin (126 ppm) | 996 | 13 | 968 | 8 |
Download links
A two-part list of links to download the article, or parts of the article, in various formats.
Downloads (link to download the article as PDF)
Open citations (links to open the citations from this article in various online reference manager services)
Cite this article (links to download the citations from this article in formats compatible with various reference manager tools)
Transient rapamycin treatment can increase lifespan and healthspan in middle-aged mice
eLife 5:e16351.
https://doi.org/10.7554/eLife.16351


