Updates to the zoonotic niche map of Ebola virus disease in Africa
- University of Washington, United States
- Li Ka Shing Centre for Health Information and Discovery, United Kingdom
- Cary Institute of Ecosystem Studies, United States
- University of Oxford, United Kingdom
- University of Melbourne, Australia
Figures
Figure 1

Updated Ebola virus disease occurrence database.
Human index cases are represented by red circles, animal occurrences in blue. New occurrence information is indicated by the black circle. The coordinates of polygon centroids are displayed for occurrences defined by an area greater than 5 km x 5 km.
Figure 2 with 3 supplements
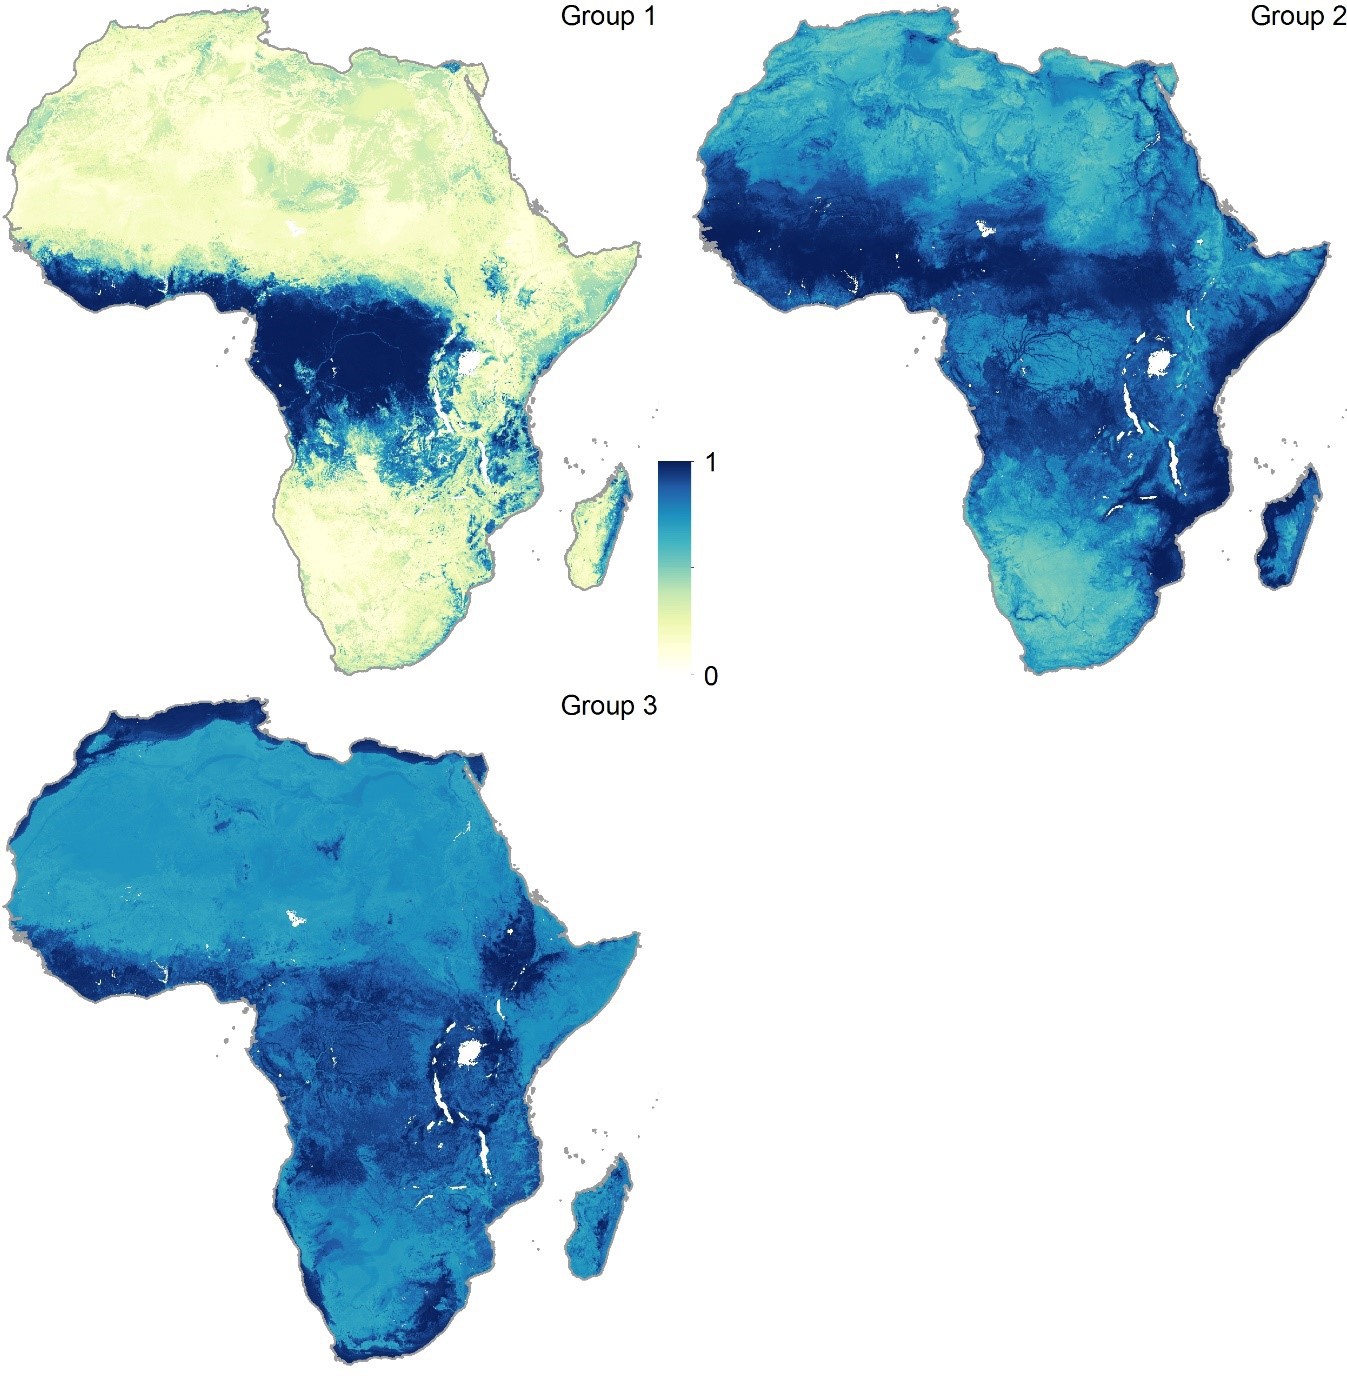
Combined suitability surfaces for each of the potential reservoir bat groupings.
For each layer the species specific suitability maps were combined to produce a surface approximating the probability that any bat species in that group may be present. Regions in blue (1) are most environmentally similar to locations reporting bat records. Areas in yellow (0) are the least environmentally similar. The top left panel depicts Group 1, top right Group 2 and bottom left Group 3 bats.
Figure 2—figure supplement 1
Group 1 bat distributions.
The environmental suitability for each of the three bat species in Group 1 are displayed. Regions in dark blue (1) are most environmentally similar to locations reporting bat records. Areas in white (0) are the least environmentally similar. The black outline depicts the expert opinion range maps as determined by the International Union for the Conservation of Nature (Schipper et al., 2008) and the black dots represent occurrence records reported by the Global Biodiversity Information Facility (www.gbif.org/) and from published peer-reviewed articles. From top left, clockwise: Epomops franqueti, Hypsignathus monstrosus, summary Group 1 layer combining all three maps, and Myonycteris torquata.
Figure 2—figure supplement 2

Group 2 bat distributions.
The environmental suitability for each of the five bat species in Group 2 are displayed. Regions in dark blue (1) are most environmentally similar to locations reporting bat records. Areas in white (0) are the least environmentally similar. The black outline depicts the expert opinion range maps as determined by the International Union for the Conservation of Nature (Schipper et al., 2008) and the black dots represent occurrence records reported by the Global Biodiversity Information Facility (www.gbif.org/). From top left, clockwise: Tadarida condylura, Rousettus aegyptiacus, Miniopterus pusillus, summary Group 2 layer combining all five maps, Eidolon helvum, and Epomophorus gambianus.
Figure 2—figure supplement 3
Group 3 bat distributions.
The environmental suitability for each of the seven bat species in Group 3 are displayed. Regions in dark blue (1) are most environmentally similar to locations reporting bat records. Areas in white (0) are the least environmentally similar. The black outline depicts the expert opinion range maps as determined by the International Union for the Conservation of Nature (Schipper et al., 2008) and the black dots represent occurrence records reported by the Global Biodiversity Information Facility (www.gbif.org/). From top left, clockwise: Epomops buettikoferi, Miniopterus schreibersii, Epomophorus labiatus, Miniopterus inflatus, summary Group 3 layer combining all seven maps, Otomops martiensseni, Hipposideros gigas, and Rhinolophus eloquens.
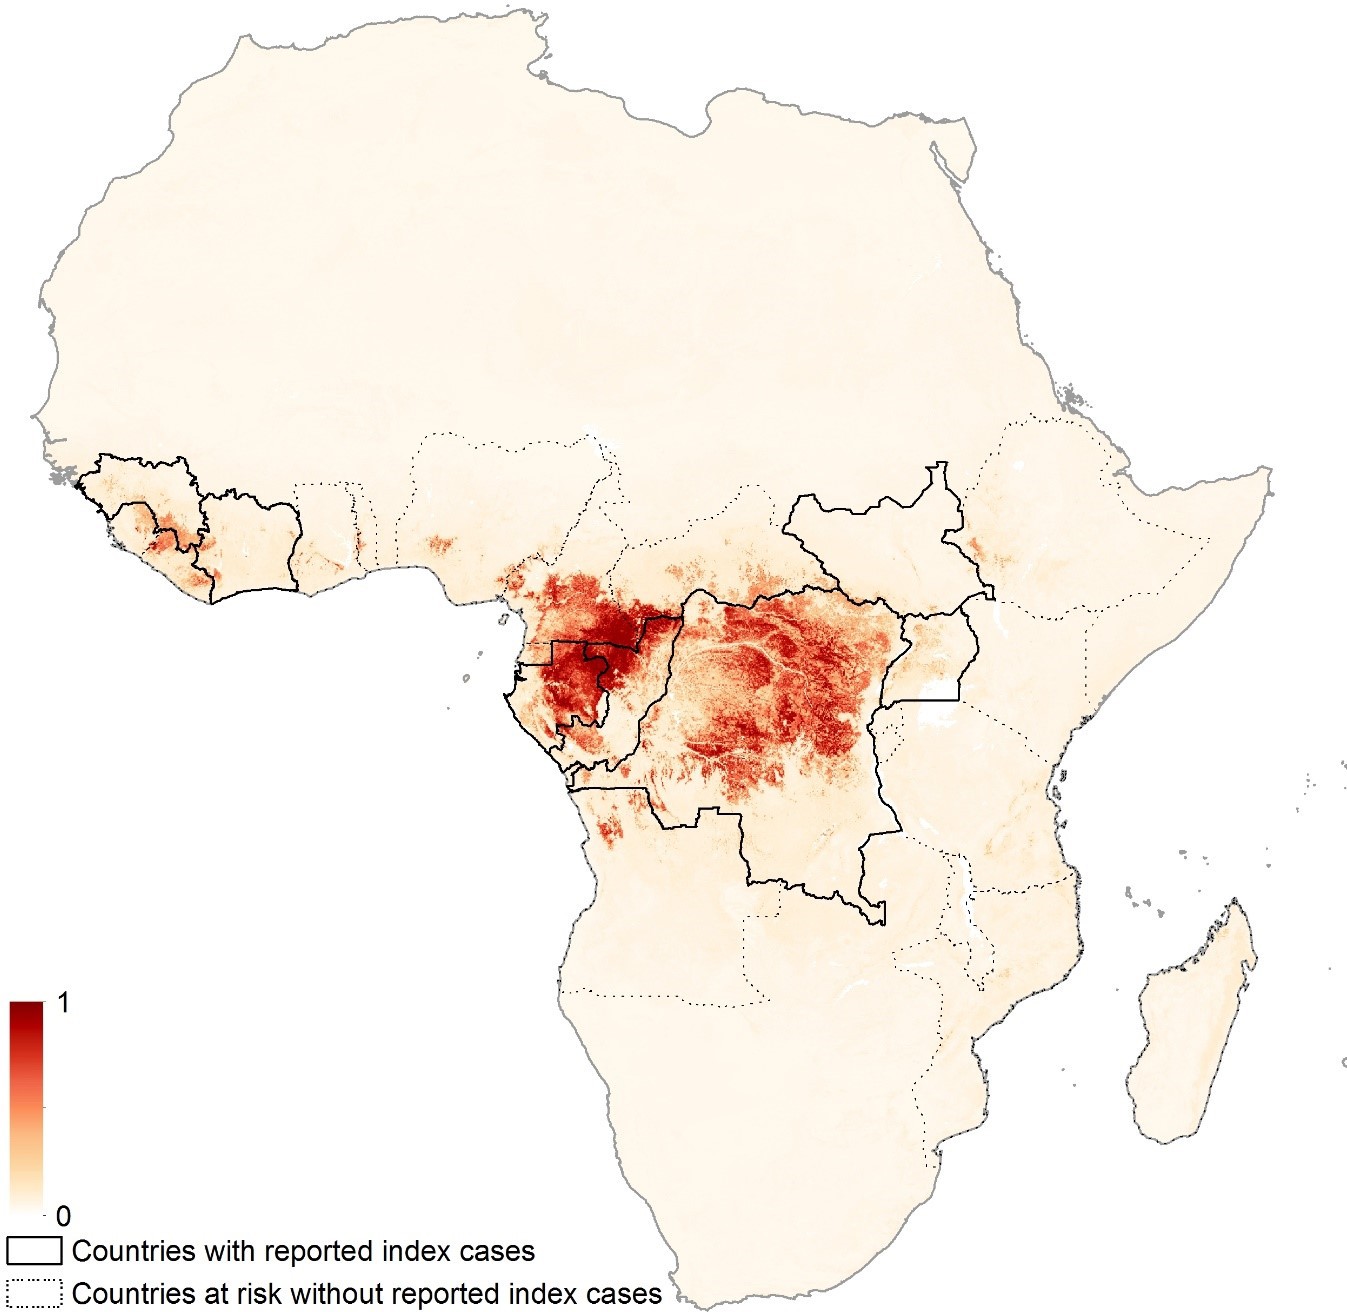
Figure 3 with 2 supplements

Updated map showing areas most environmentally suitable for the zoonotic transmission of Ebola virus.
Areas closer to dark red (1) are most environmentally similar to locations reporting Ebola virus occurrences; areas in light yellow (0) are least similar. Countries with borders outlined are those which are predicted to contain at-risk areas for zoonotic transmission based on a thresholding approach. Output displayed generated from model using the three consolidated bat covariates.
Figure 3—figure supplement 1
Absolute differences between previous and revised maps.
Generated by subtracting the original eLife publication pixel probabilities from the newly generated values and restricted to those areas determined to be at-risk. Areas in yellow are essentially consistent. Areas in purple have probability values greater than the previous output; areas in green have probability values lower than previous outputs.
Figure 3—figure supplement 2
Zoonotic niche map based upon inclusion of individual bat covariate layers.
Areas closer to dark red (1) are most environmentally similar to locations reporting Ebola virus occurrences; areas in light yellow (0) are least similar. Countries with borders outlined are those which are predicted to contain at-risk areas for zoonotic transmission based on a thresholding approach. Output displayed generated from model using individual bat covariate layers.
Tables
Table 1
National populations at risk.
| Country | Population-at-risk (in 100,000s) | |
|---|---|---|
| Countries previously reporting index cases | Democratic Republic of the Congo | 170.18 |
| Uganda | 21.58 | |
| Guinea | 17.61 | |
| Côte d’Ivoire | 4.08 | |
| Gabon | 3.65 | |
| South Sudan | 1.80 | |
| Republic of Congo | 1.07 | |
| Countries with no reported index cases | Nigeria | 29.13 |
| Cameroon | 22.90 | |
| Central African Republic | 7.62 | |
| Liberia | 5.88 | |
| Ghana | 4.04 | |
| Sierra Leone | 3.94 | |
| Angola | 3.25 | |
| Togo | 1.78 | |
| Ethiopia | 1.75 | |
| Equatorial Guinea | 1.22 | |
| Tanzania | 1.18 | |
| Burundi | 1.07 | |
| Mozambique | 0.55 | |
| Madagascar | <0.1 | |
| Kenya | <0.1 | |
| Malawi | <0.1 |
Table 2
Comparison of previous and revised niche models.
| Revised niche map (with summary bat layers) | Revised niche map (with individual bat layers) | Previous eLife niche map (Pigott et al., 2014) | |
|---|---|---|---|
| AUC | 0.8236 ± 0.08 | 0.8195 ± 0.08 | 0.85 ± 0.04 |
| Occurrences | n = 57 (animals), n = 31 (humans) | n = 57 (animals), n = 31 (humans) | n = 51 (animals), n = 30 (humans) |
| Ranked relative contributions | EVI mean (0.55) | EVI mean (0.46) | EVI mean (0.65) |
| Group 1 bat distribution (0.18) | Hypsignathus monstrosus (0.15) | Elevation (0.12) | |
| LST mean (night) (0.08) | Epomops franqueti (0.08) | LST mean (night) (0.08) | |
| Elevation (0.06) | Otomops martiensseni (0.06) | PET mean (0.06) | |
| LST mean (day) (0.04) | Epomophorus labiatus (0.04) | Bat distribution (0.04) |
Table 3
Final bats included in analysis classified by evidence grouping.
| Grouping | Bat | Occurrences |
|---|---|---|
| Group 1 | Franquet’s epauletted fruit bat (Epomops franqueti) | 442 |
| Hammerheaded fruit bat (Hypsignathus monstrosus) | 254 | |
| Little collared fruit bat (Myonycteris torquata) | 107 | |
| Group 2 | Angolan free-tailed bat (Tadarida condylura, formerly Mops condylurus) | 179 |
| Egyptian fruit bat (Rousettus aegyptiacus) | 177 | |
| Gambian epauletted fruit bat (Epomophorus gambianus) | 166 | |
| Peter’s dwarf epauletted fruit bat (Micropteropus pusillus) | 208 | |
| Straw-coloured fruit bat (Eidolon helvum) | 282 | |
| Group 3 | Buettikofer’s epauletted fruit bat (Epomops buettikoferi) | 50 |
| Common bent-wing bat (Miniopterus schreibersii) | 31 | |
| Eloquent horseshoe bat (Rhinolophus eloquens) | 61 | |
| Ethiopian epauletted fruit bat (Epomophorus labiatus) | 187 | |
| Giant leaf-nosed bat (Hipposideros gigas) | 21 | |
| Greater long-fingered bat (Miniopterus inflatus) | 56 | |
| Large-eared free-tailed bat (Otomops martiensseni) | 33 |
Download links
A two-part list of links to download the article, or parts of the article, in various formats.
Downloads (link to download the article as PDF)
Open citations (links to open the citations from this article in various online reference manager services)
Cite this article (links to download the citations from this article in formats compatible with various reference manager tools)
Updates to the zoonotic niche map of Ebola virus disease in Africa
eLife 5:e16412.
https://doi.org/10.7554/eLife.16412


