Interferon alpha-inducible protein 6 regulates NRASQ61K-induced melanomagenesis and growth
- Yale University School of Medicine, United States
- Agency for Science Technology and Research (A*STAR), Brenner Center for Molecular Medicine, Singapore
Figures
Figure 1 with 6 supplements
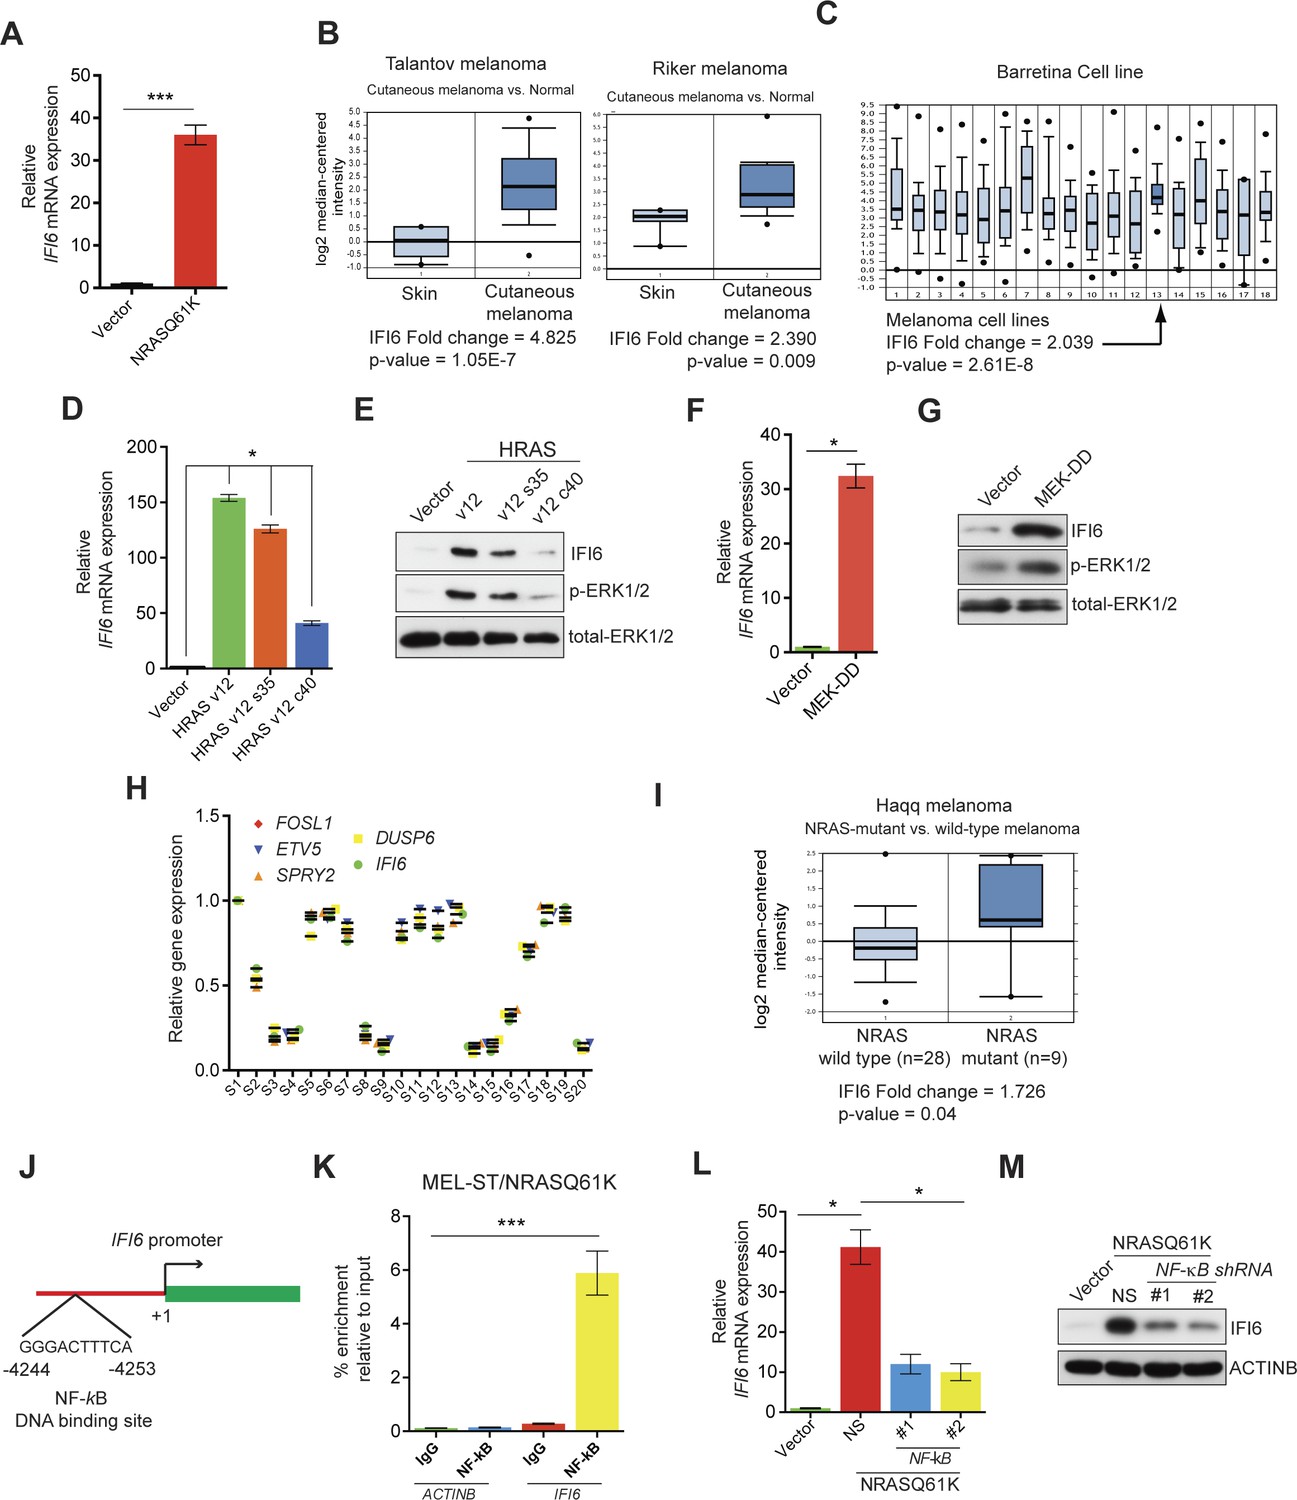
IFI6 is transcriptionally upregulated by NRASQ61K via MAPK pathway.
(A) Relative IFI6 mRNA expression in MEL-ST/NRASQ61K cells compared to empty vector-expressing MEL-ST cells. (B) Box plots for IFI6 mRNA expression in indicated melanoma gene expression datasets show significantly higher IFI6 mRNA expression in patient-derived cutaneous melanoma samples (2) compared to normal skin controls (1). (C) Box plot for IFI6 mRNA expression in Barretina cell line dataset. Lane 13 shows average of IFI6 mRNA expression in melanoma cell lines. (D) MEL-ST cells expressing empty vector or indicated HRAS mutants were analyzed by RT-qPCR. The relative expression of IFI6 mRNA in HRAS mutant-expressing MEL-ST cells compared to empty vector-expressing MEL-ST cells. (E) Relative expression of indicated proteins was evaluated by immunoblotting in MEL-ST cells expressing an empty vector or indicated HRAS mutants. (F) MEL-ST cells expressing empty vector or MEK-DD were analyzed for IFI6 mRNA expression by RT-qPCR. IFI6 mRNA expression in MEK-DD expressing MEL-ST cells relative to empty vector is shown. (G) MEL-ST cells expressing empty vector or MEK-DD were analyzed for indicated proteins by immunoblotting. (H) Analysis of patient-derived melanoma samples (n = 20) reveals co-expression of IFI6 with MAPK target genes. (I) Box plot for indicated melanoma gene expression dataset shows significantly higher IF6 mRNA expression in patient-derived NRAS-mutant melanoma samples (2) compared to NRAS wild-type melanoma samples (1). (J) Schematic presentation of NF-κB DNA binding site on the IFI6 promoter. (K) MEL-ST/NRASQ61K cells were analyzed for NF-κB enrichment using the ChIP assay.% NF-κB enrichment in comparison to IgG on the ACTIN or IFI6 gene promoter is shown. (L) MEL-ST cells expressing empty vector or NRASQ61K with NS or NF-κB shRNAs were analyzed for IFI6 mRNA expression by RT-qPCR. Relative IFI6 mRNA in comparison to empty vector expressing MEL-ST cells is shown. (M) MEL-ST cells expressing empty vector or NRASQ61K with NS or NF-κB shRNAs were analyzed for IFI6 protein levels by immunoblotting. ACTINB served as the loading control. In all panels, data are presented as mean ± SEM, and *p<0.05 and ***p<0.0005.
Figure 1—figure supplement 1

NRASQ61K transcriptionally upregulates interferon-stimulated genes.
Heatmap shows altered gene expression in MEL-ST cells expressing either an empty vector or NRASQ61K. Upregulated genes are shown in red, and downregulated genes are shown in green. The top five upregulated genes shown on the right include IFI6, IFI27, and MX1.
Figure 1—figure supplement 2
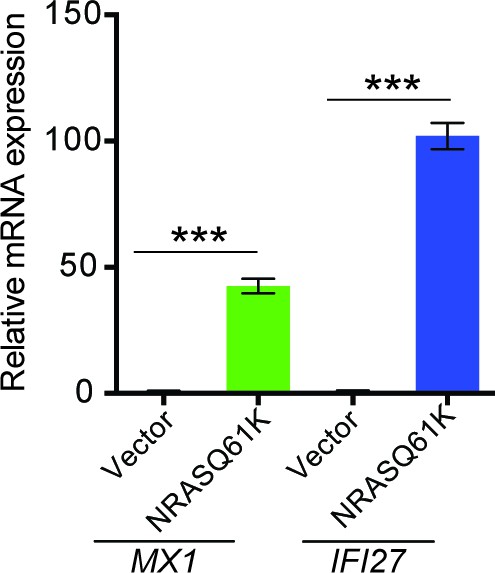
Regulation of MX1 and IFI6 by NRASQ61K.
Relative mRNA expression of MX1 and IFI27 in MEL-ST cells expressing NRASQ61K or empty vector was analyzed by RT-qPCR. Data are presented as mean ± SEM; ***p<0.0005.
Figure 1—figure supplement 3
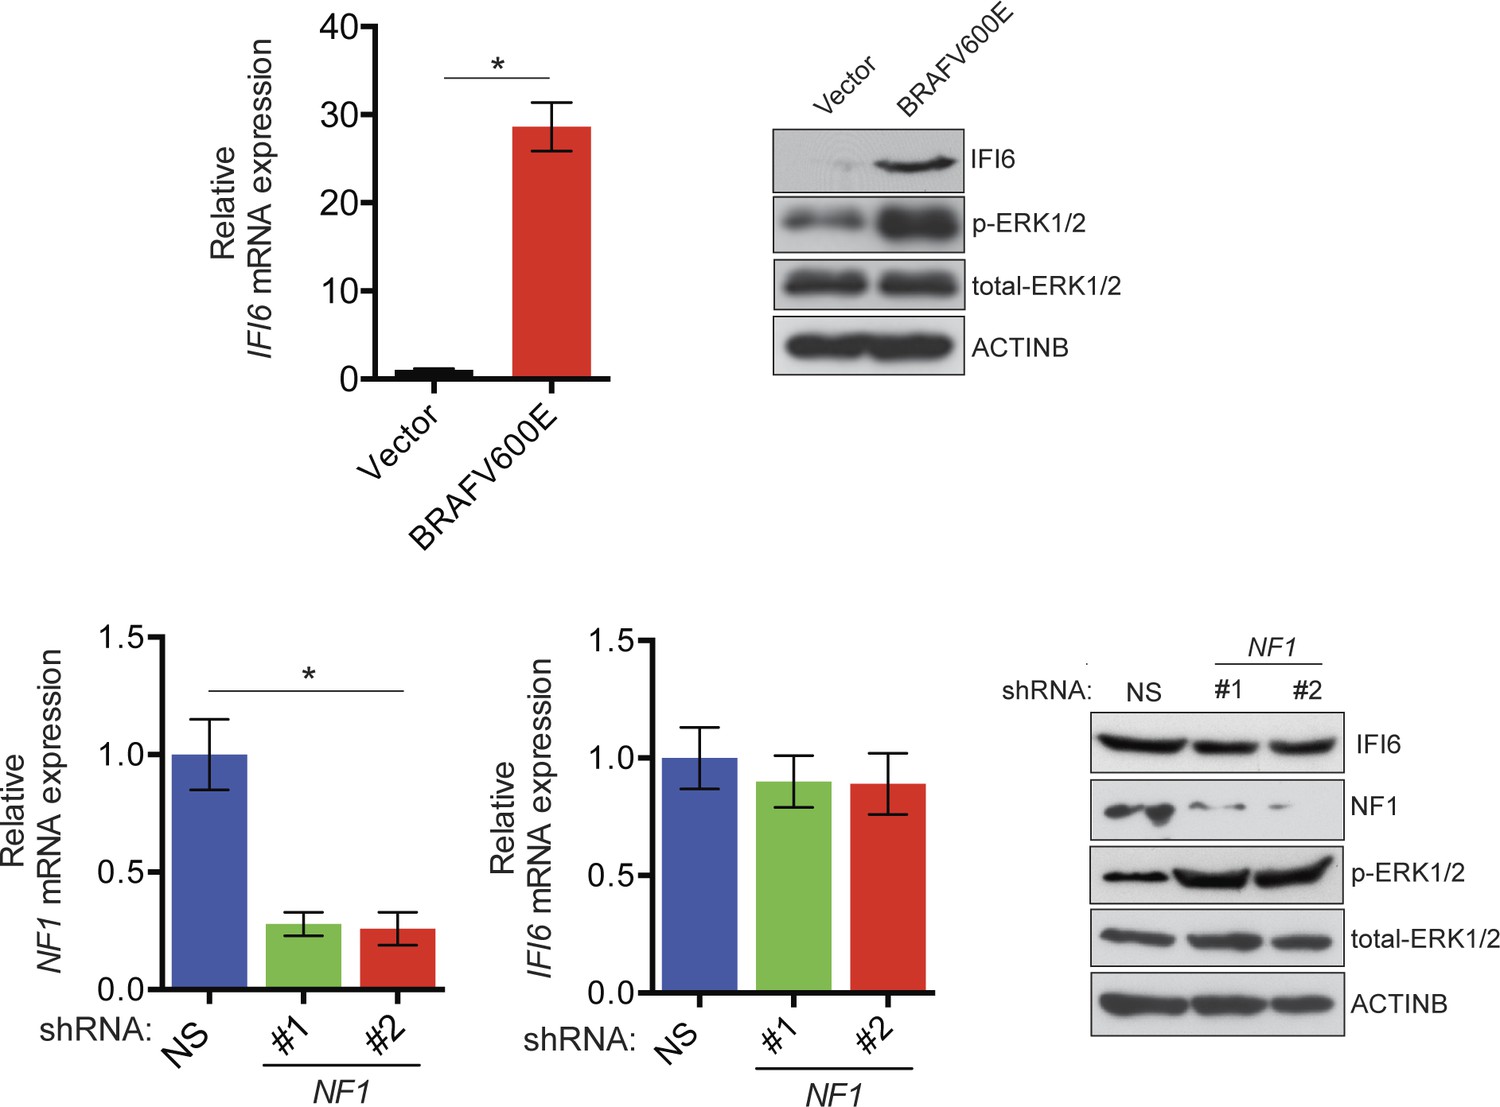
Monitoring regulation of IFI6 by BRAFV600E and NF1 loss.
(Top left) Relative expression of IFI6 mRNA in MEL-ST cells expressing BRAFV600E or empty vector was analyzed by RT-qPCR. (Top right) Relative expression of the indicated proteins in BRAFV600E- and empty vector-expressing MEL-ST cells was analyzed by immunoblotting. (Bottom left) Relative expression of NF1 mRNA in MEL-ST cells expressing NF1 or non-specific (NS) shRNA was analyzed by RT-qPCR. (Bottom middle) Relative expression of IFI6 mRNA in MEL-ST cells expressing NF1 or NS shRNA was analyzed by RT-qPCR. (Bottom right) Expression of the indicated proteins in MEL-ST cells expressing NF1 or NS shRNA was analyzed by immunoblotting. Data are presented as mean ± SEM; *p<0.05.
Figure 1—figure supplement 4
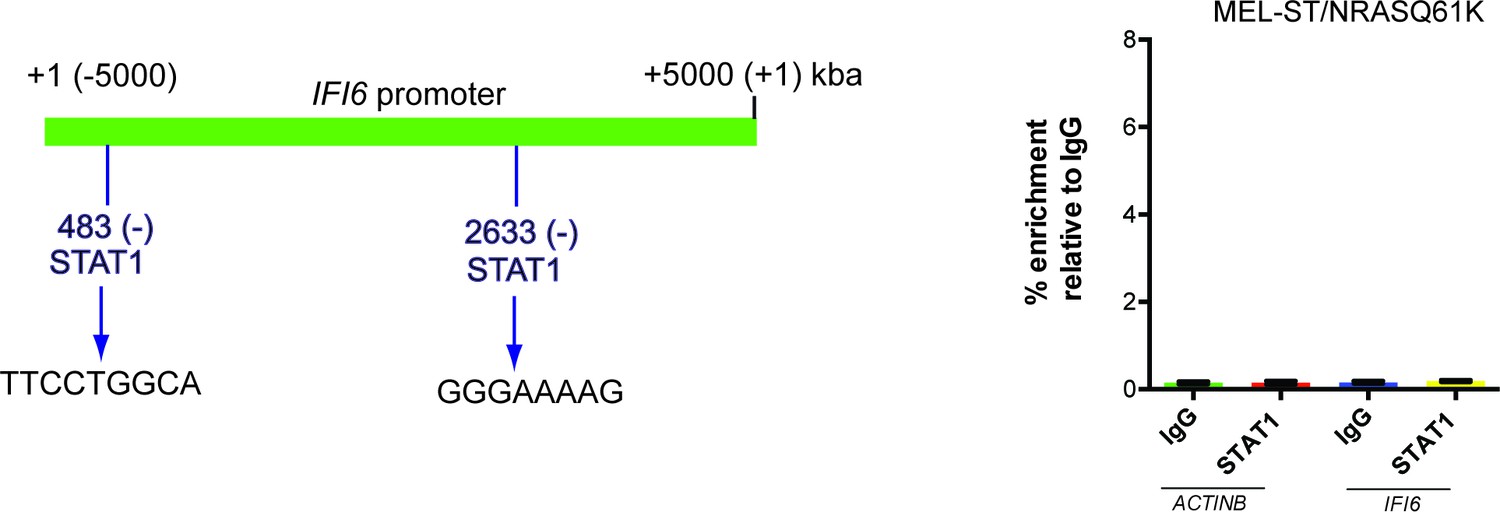
STAT1 is not necessary for IFI6 expression in MEL-ST/NRASQ61K cells.
(Left) IFI6 promoter analysis using rVista 2.0 reveals DNA binding sites for STAT1. (Right) MEL-ST/NRASQ61K cells were analyzed for STAT1 enrichment using the ChIP assay.% STAT1 enrichment (%) relative to IgG on the ACTIN or IFI6 gene promoter is shown.
Figure 1—figure supplement 5
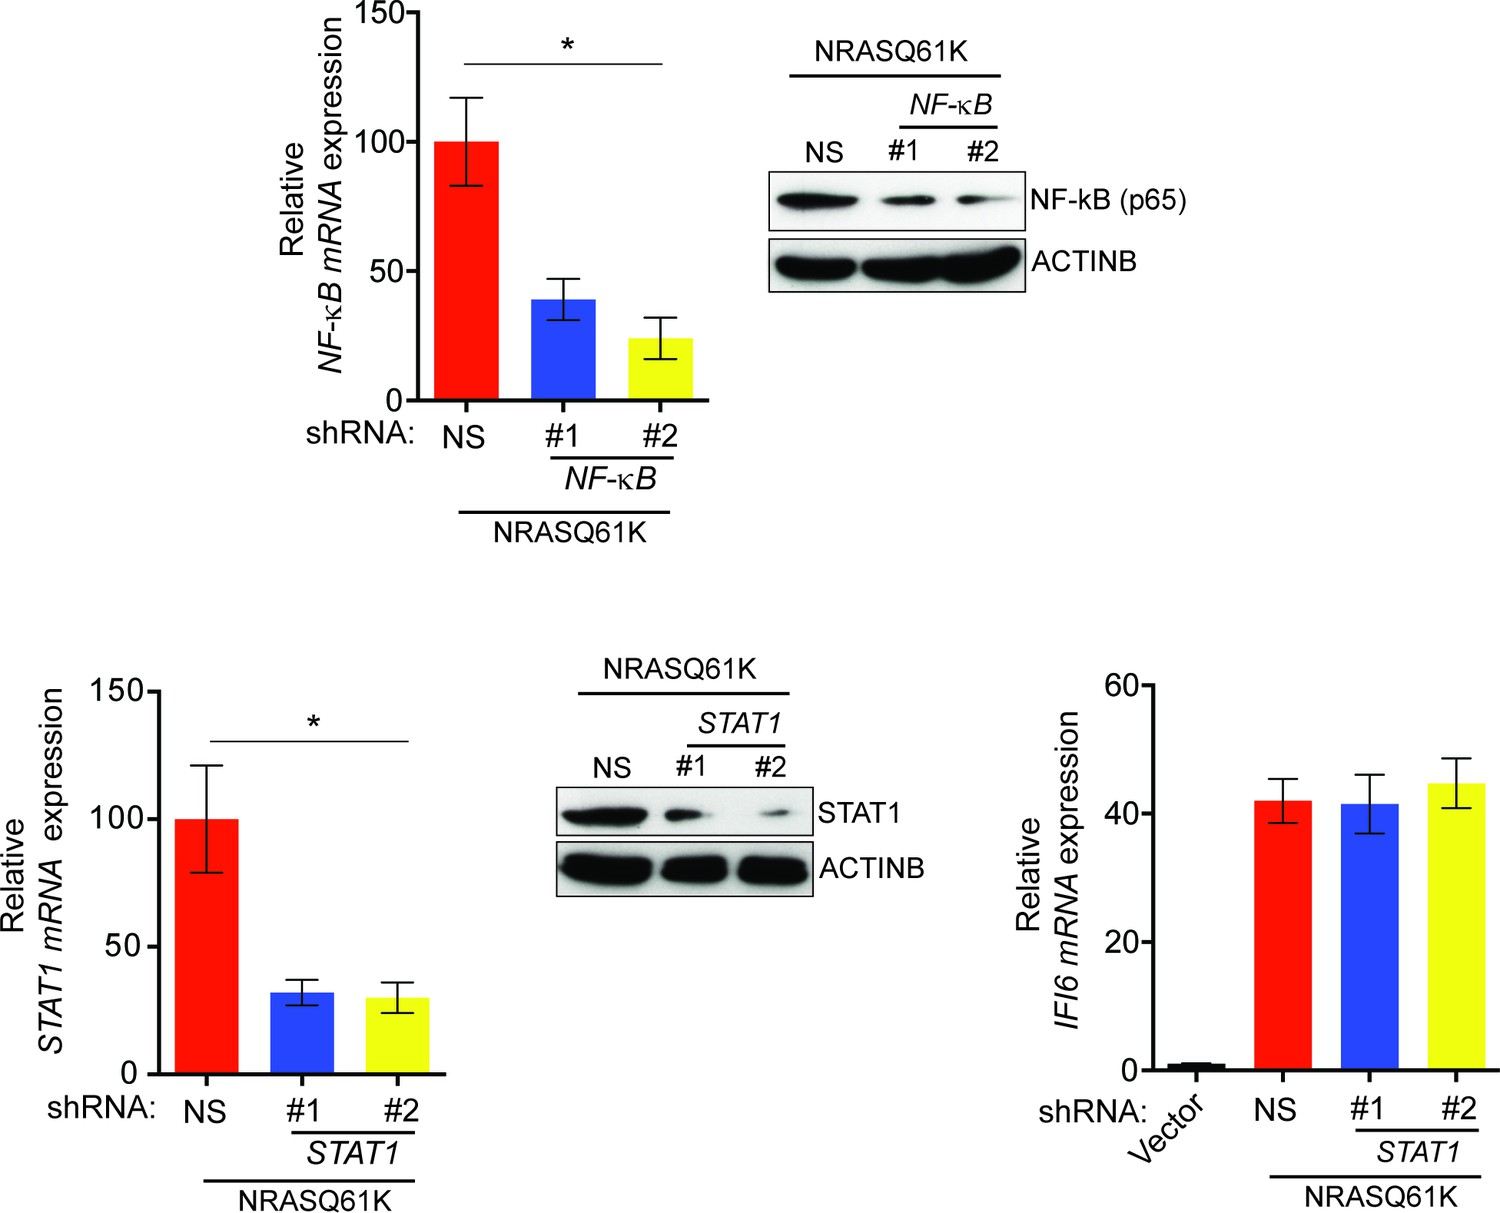
Oncogenic NRASQ61K transcriptionally upregulates IFI6 via transcription factor NF-κB.
(Top Left) mRNA expression of NF-κB was analyzed in NRASQ61K-transformed MEL-ST cells expressing either NF-κB or non-specific (NS) shRNA. Relative expression of NF-κB mRNA in cells expressing NF-κB shRNA in comparison to NS shRNA expressing cells is shown. (Top Right) Immunoblot analysis to determine NF-κB protein levels in MEL-ST/NRASQ61K cells expressing either NF-κB or NS shRNA. (Bottom Left) mRNA expression of STAT1 was analyzed in NRASQ61K-transformed MEL-ST cells expressing either STAT1 or non-specific (NS) shRNA. Relative expression is shown. (Bottom Middle) Immunoblot analysis to determine STAT1 protein levels in NRASQ61K-transformed MEL-ST cells expressing indicated shRNA. (Bottom Right) RT-qPCR analysis to determine IFI6 mRNA levels in MEL-ST cells expressing either empty vector or NRASQ61K along with STAT1 or NS shRNA. In all panels, data are presented as mean ± SEM; *p<0.05.
Figure 1—figure supplement 6

IKKβ is necessary for NF-κB activation and NRASQ61K-induced IFI6 upregulation.
(Top left) IKKβ mRNA levels in MEL-ST/NRASQ61K cells expressing IKKβ shRNA or non-specific (NS) shRNA was analyzed by RT-qPCR. Relative mRNA expression of IKKβ in IKKβ shRNA expressing cells in comparison to NS shRNA expressing cells is plotted. (Top right) Relative expression of the indicated proteins in MEL-ST cells expressing IKKβ shRNA or NS shRNA was analyzed by immunoblotting. (Bottom left) MEL-ST cells expressing IKKβ shRNA or NS shRNA were transfected with an NF-κB–responsive firefly luciferase reporter along with control TK-renilla luciferase reporter construct. Relative firefly luciferase activity under the indicated conditions is shown. (Bottom Right) % enrichment of NF-κB measured via ChIP on ACTINB or IFI6 promoters in MEL-ST cells expressing an empty vector or NRASQ61K along with NS shRNA or IKKβ shRNAs. Data are presented as mean ± SEM; *p<0.05, and **p<0.005.
Figure 2 with 2 supplements
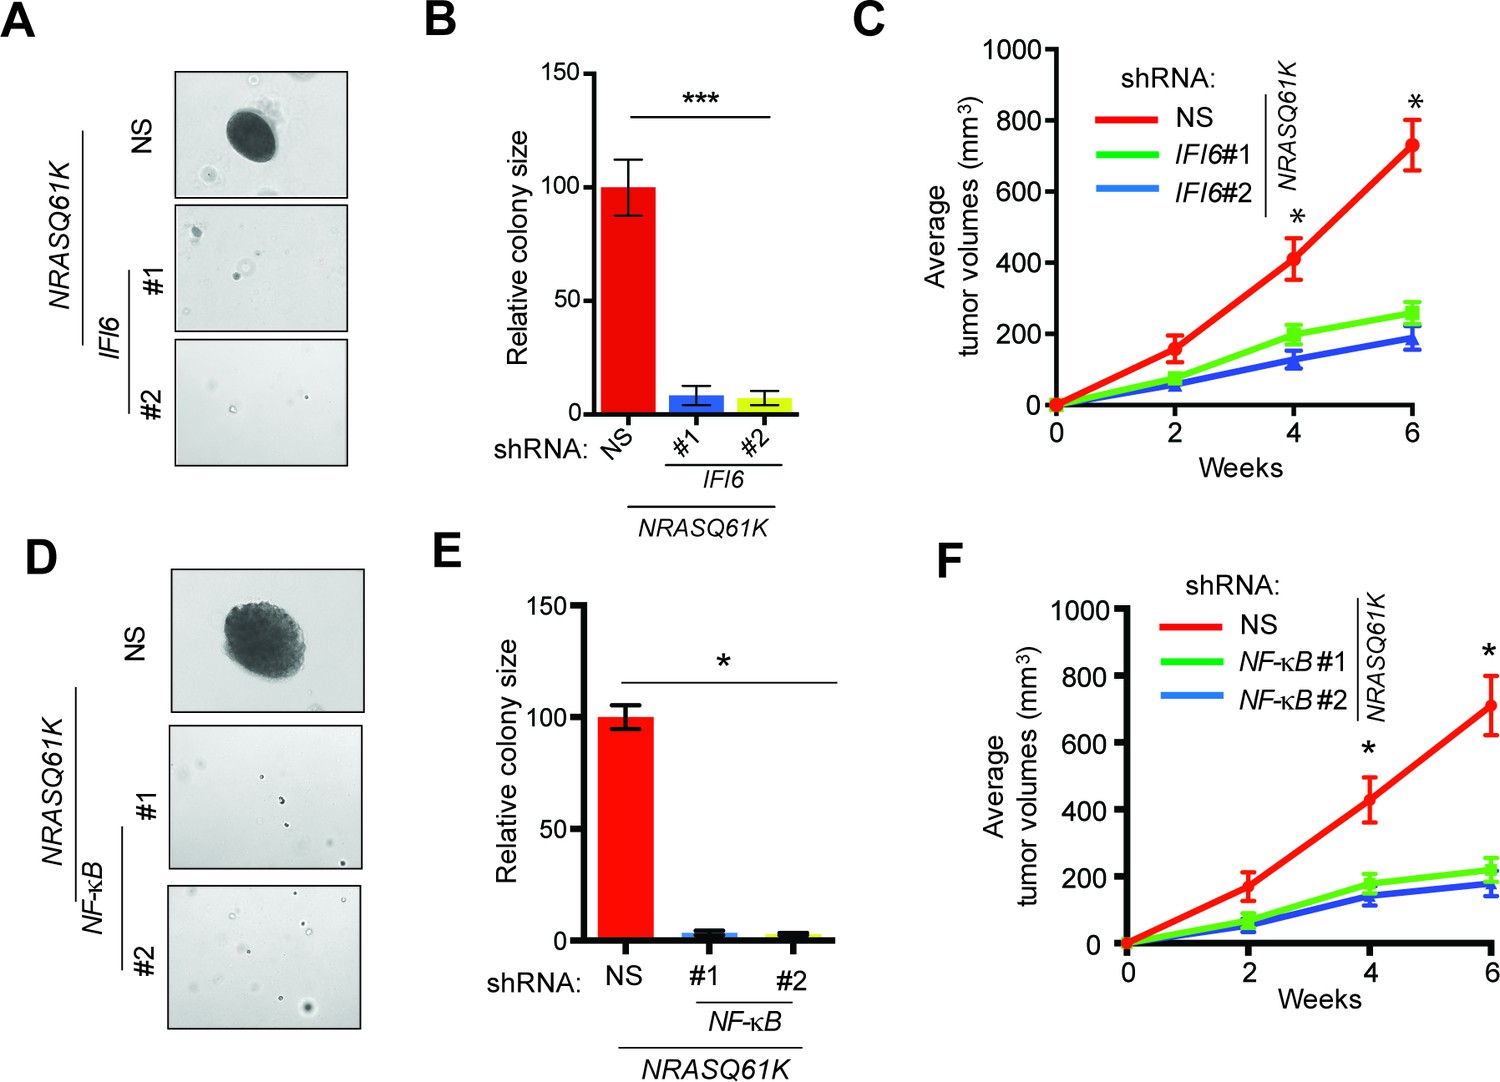
IFI6 is necessary for NRASQ61K-induced melanocyte transformation.
(A) MEL-ST/NRASQ61K cells expressing IFI6 or non-specific (NS) shRNA were analyzed for colony-forming potential using a soft agar assay. Representative images are shown. (B) Relative colony size for the soft-agar assay presented in panel A is shown. (C) MEL-ST/NRASQ61K cells expressing IFI6 or non-specific (NS) shRNA were injected subcutaneously into the flanks of athymic nude mice. Average tumor volumes (n = 5) for MEL-ST/NRASQ61K cells expressing NS or IFI6 shRNA are shown at the indicated time points. (D). MEL-ST/NRASQ61K cells expressing NS or NF-κB shRNA were analyzed for colony-forming potential using a soft agar assay. Representative images are shown. (E) Relative colony size for the soft-agar assay presented in panel D is shown. (F) MEL-ST/NRASQ61K cells expressing NS or NF-κB shRNA were injected subcutaneously into the flanks of athymic nude mice. Average tumor volumes (n = 5) for MEL-ST/NRASQ61K cells expressing NS or NF-κB shRNA are shown at the indicated time points. In all panels, data are presented as mean ± SEM, and *p<0.05 and ***p<0.0005.
Figure 2—figure supplement 1
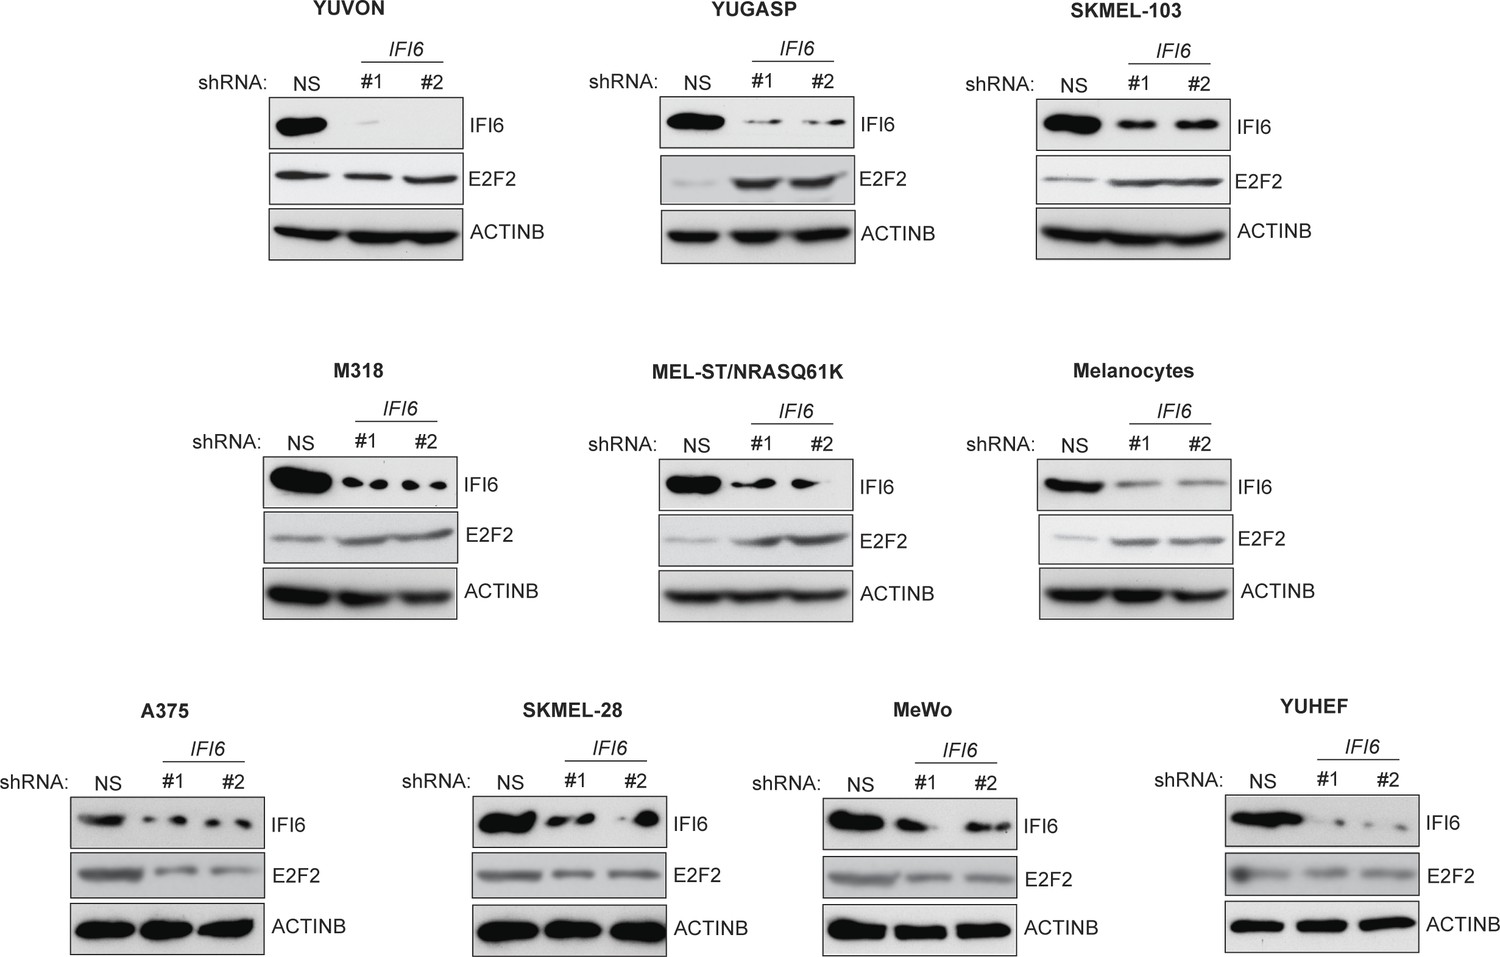
Monitoring expression of IFI6 and E2F2 proteins following IFI6 knockdown.
Indicated cell lines expressing non-specific (NS) or IFI6 shRNA were analyzed for IFI6, E2F2, and ACTINB protein expression by immunoblotting.
Figure 2—figure supplement 2
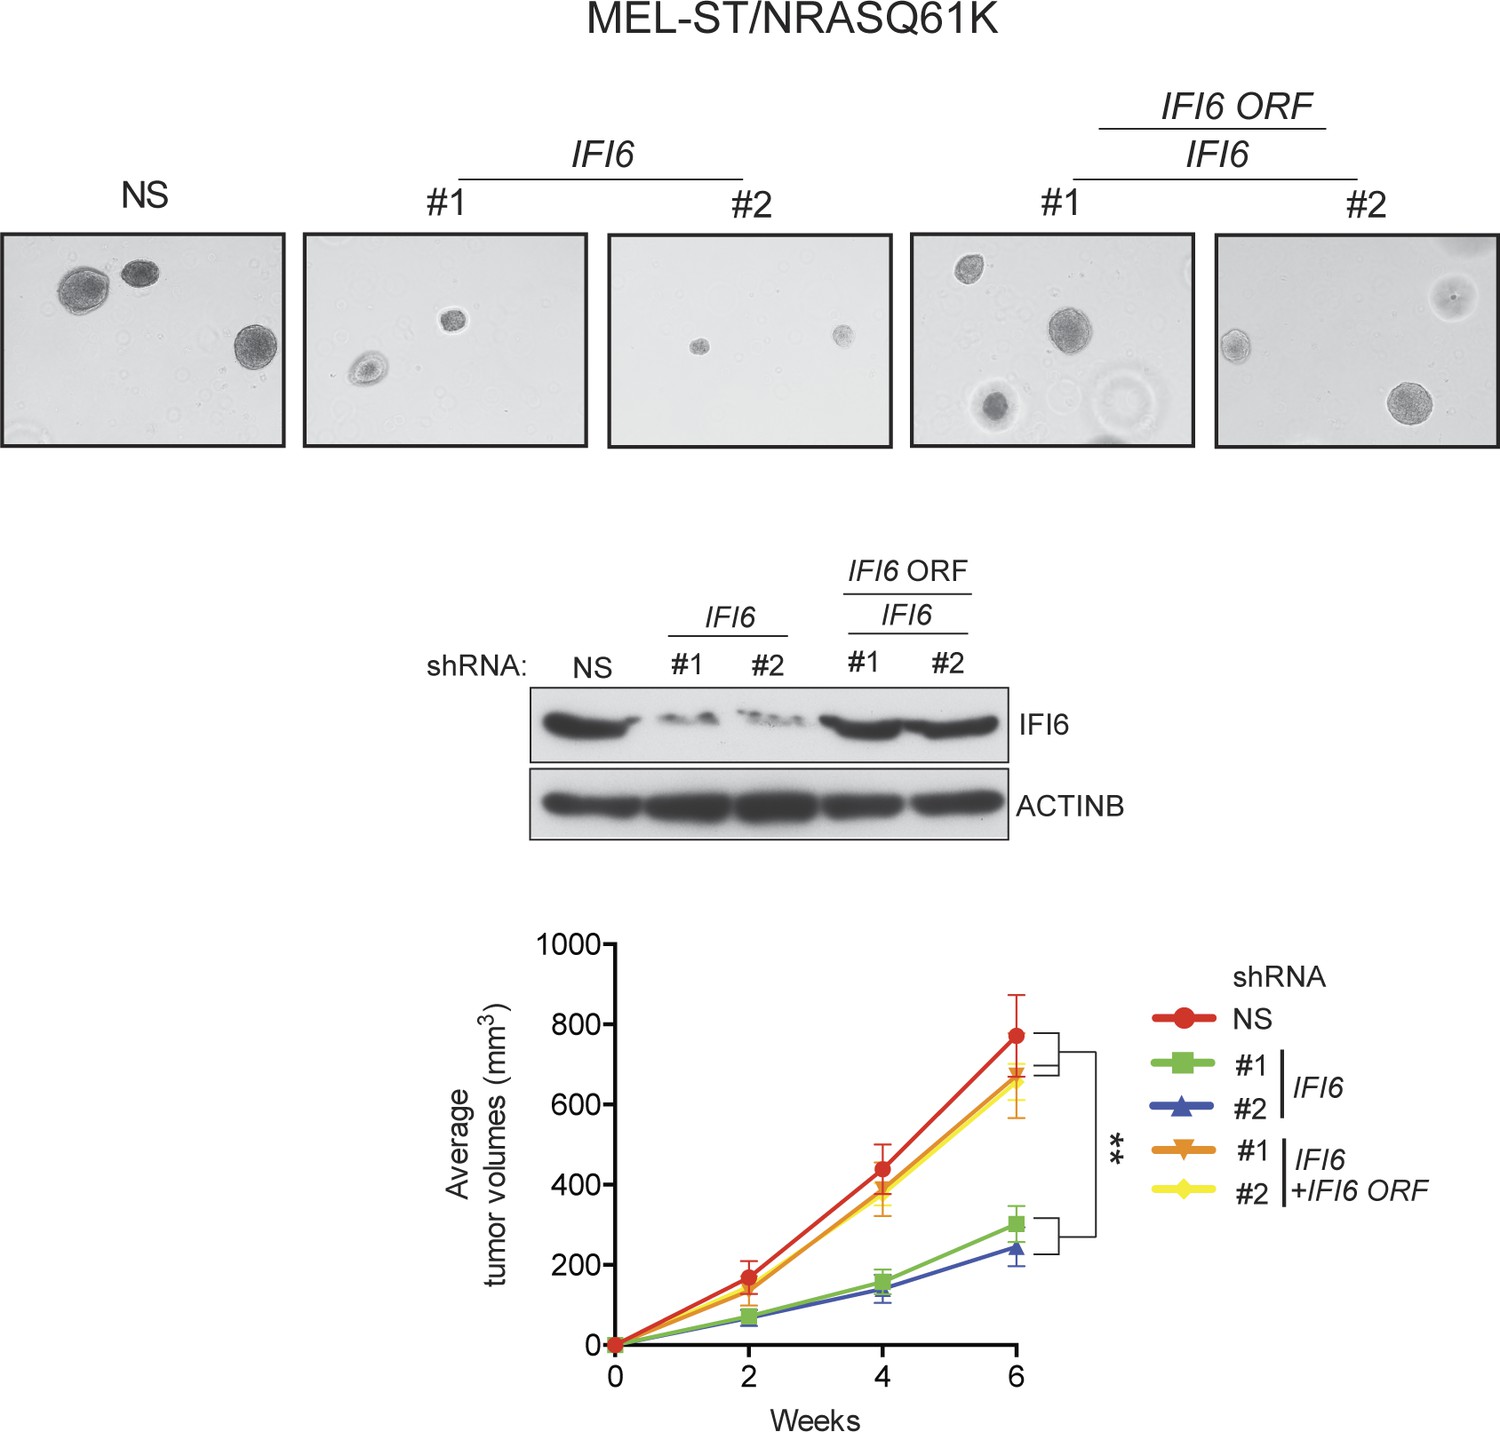
Ectopic expression of shRNA-resistant IFI6 ORF rescues tumor growth in MEL-ST/NRASQ61K cells expressing IFI6 shRNA.
(Top panel) Anchorage-independent growth in soft agar was evaluated using MEL-ST/NRASQ61K cells expressing non-specific (NS) shRNA or IFI6 shRNA with or without the shRNA-resistant IFI6 open reading frame (ORF). Representative images under the indicated conditions are shown. (Middle Panel) MEL-ST/NRASQ61K cells expressing the indicated constructs were analyzed for relative protein levels of IFI6 or ACTINB by immunoblotting. (Bottom Panel) MEL-ST/NRASQ61K cells expressing the indicated constructs were injected subcutaneously into athymic nude mice. Average tumor volumes (n = 8) under the indicated conditions are shown at indicated times. Data are presented as mean ± SEM; **p<0.005.
Figure 3 with 2 supplements
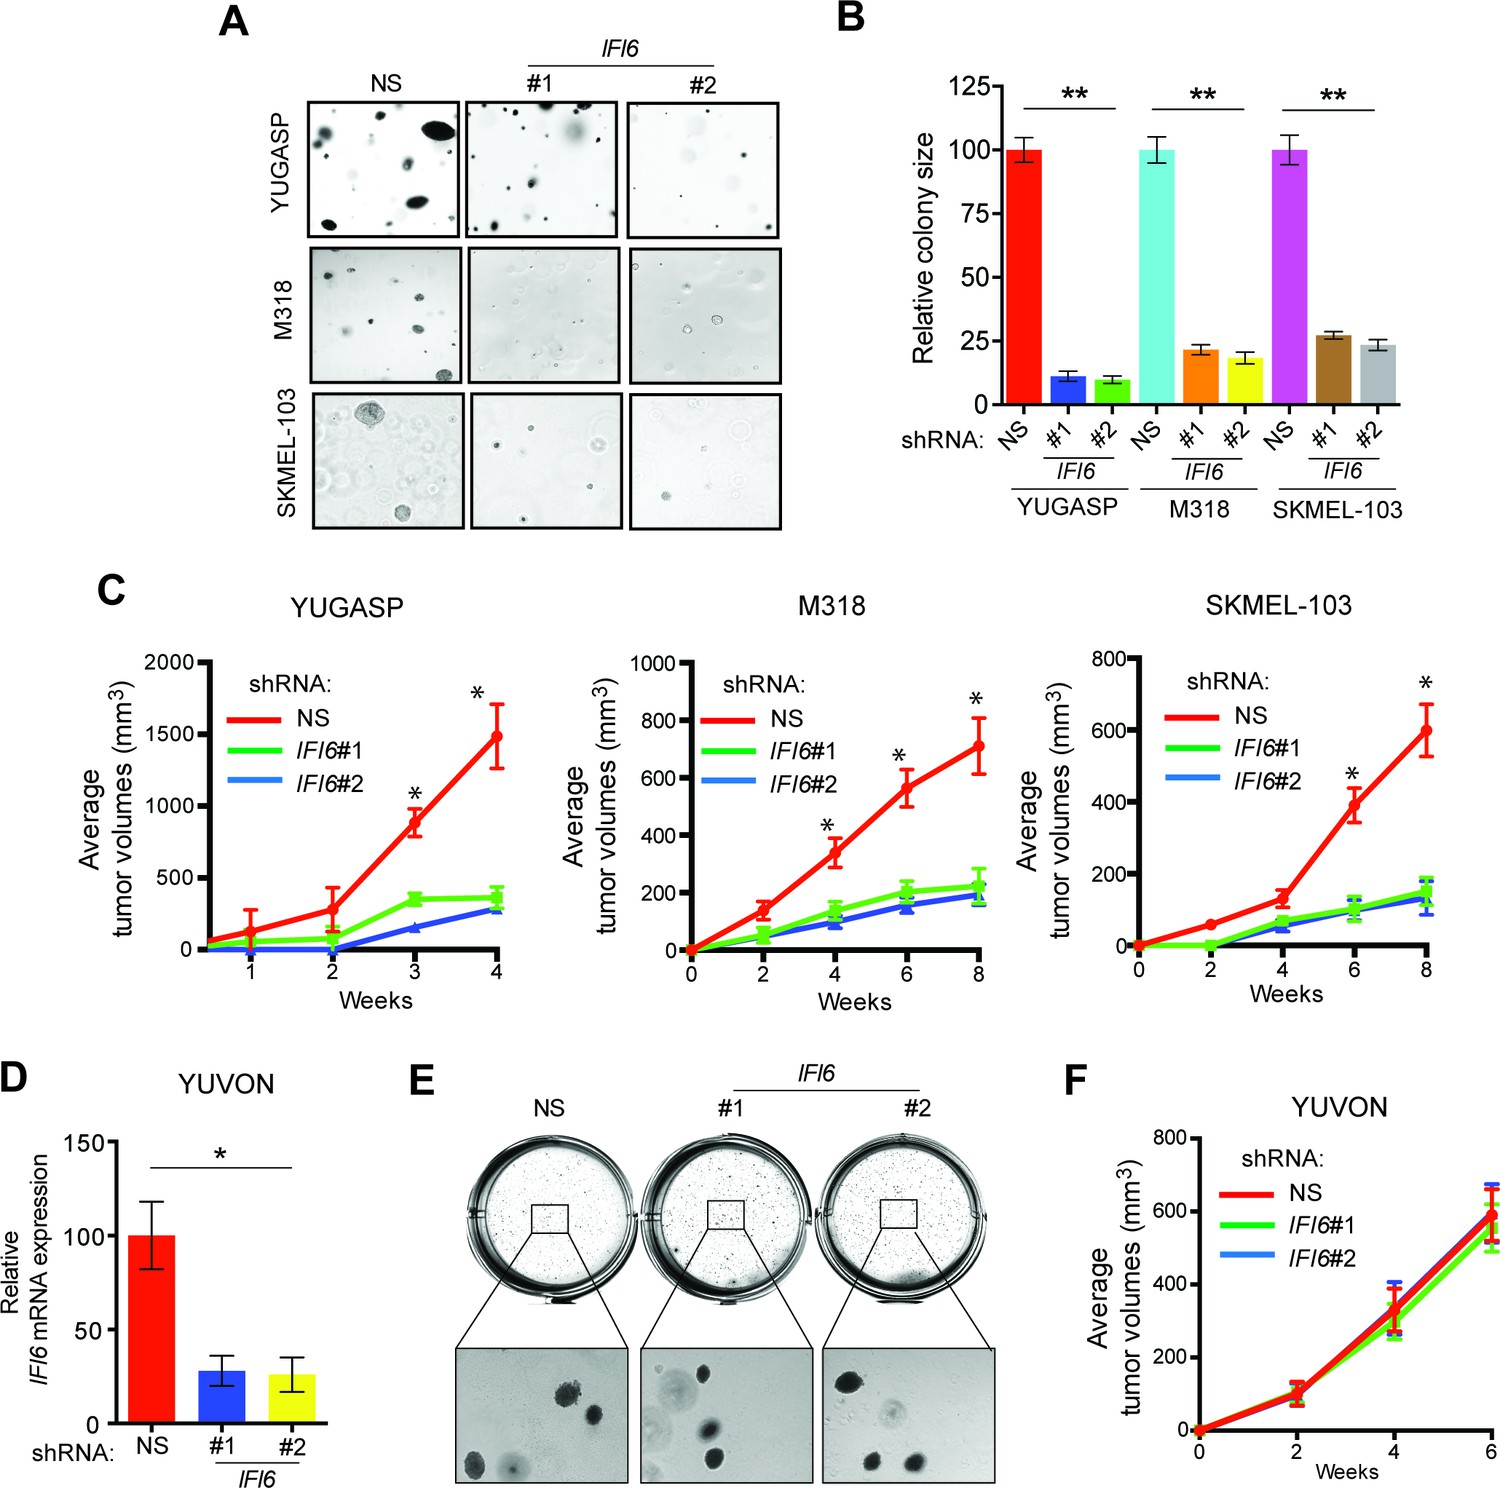
IFI6 is necessary for NRAS-mutant melanoma tumor growth.
(A) NRAS-mutant melanoma cell lines expressing either non-specific (NS) or IFI6 shRNA were analyzed for anchorage-independent growth using the soft agar assay. Representative images for the indicated melanoma cell lines expressing NS or IFI6 shRNA are shown. (B) Relative colony size in the soft agar assay presented in panel A are plotted for the indicated melanoma cell lines expressing either NS or IFI6 shRNA. (C) The indicated NRAS-mutant melanoma cell lines expressing either NS or IFI6 shRNA were injected subcutaneously into the flank of athymic nude mice. Average tumor volumes (n = 5) at the indicated time points are shown. (D) YUVON cells expressing NS or IFI6 shRNA were analyzed for IFI6 mRNA expression by RT-qPCR. Relative IFI6 mRNA expression (%) in YUVON cells expressing IFI6 shRNA in comparison to NS shRNA-expressing cells is shown. (E) YUVON cells expressing NS or IFI6 shRNA were analyzed for their ability to grow in soft agar. Representative wells of YUVON cells expressing the indicated shRNA and microscopic images are shown. (F) YUVON cells expressing NS or IFI6 shRNA were injected subcutaneously in athymic nude mice. Average tumor volumes (n = 5) for the indicated time points are shown. In all panels, data are presented as mean ± SEM, and *p<0.05 and **p<0.005.
Figure 3—figure supplement 1

IFI6 is necessary for NRAS-mutant melanoma cell growth.
Representative soft agar well images of NRAS-mutant melanoma cell lines expressing non-specific (NS) or IFI6 shRNAs.
Figure 3—figure supplement 2
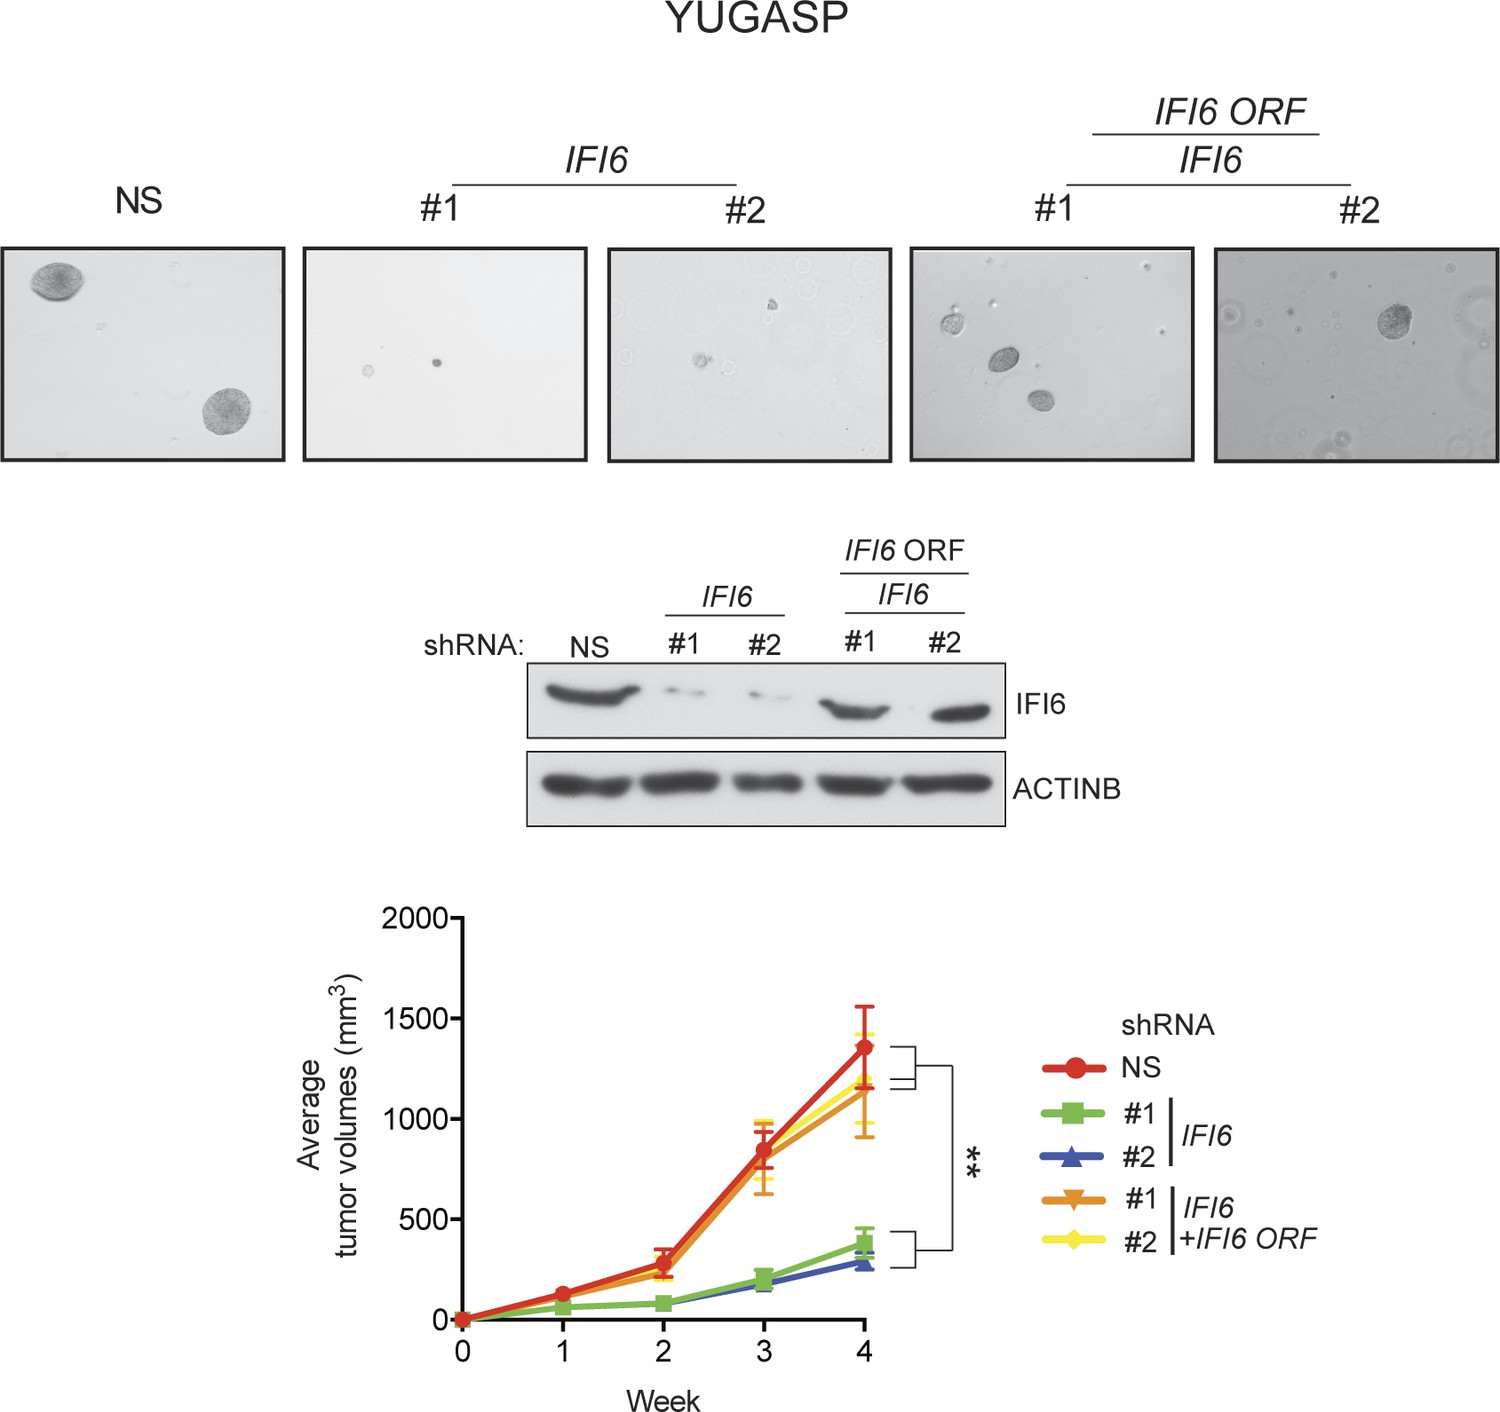
Ectopic expression of shRNA-resistant IFI6 ORF rescues tumor growth in YUGASP cells expressing IFI6 shRNA.
(Top panel) Anchorage-independent growth in soft agar was evaluated using YUGASP cells expressing non-specific (NS) shRNA or IFI6 shRNA with or without the shRNA-resistant IFI6 open reading frame (ORF). Representative images under the indicated conditions are shown. (Middle panel) YUGASP cells expressing the indicated constructs were analyzed for relative protein levels of IFI6 or ACTINB by immunoblotting. (Bottom panel) YUGASP cells expressing the indicated constructs were injected subcutaneously into athymic nude mice. Average tumor volumes (n = 8) under at indicated times are shown. Data are presented as mean ± SEM; **p<0.005.
Figure 4 with 4 supplements

IFI6 loss results in E2F2-mediated dysregulation of DNA replication and induction of cellular senescence in melanoma cells.
(A) YUGASP cells expressing either IFI6 or non-specific (NS) shRNA were analyzed by RT-qPCR. Expression of each gene was calculated in IFI6 knockdown cells relative to NS shRNA-expressing cells. (B) FACS analysis of YUGASP cells expressing NS or IFI6 shRNA. The percentage of cells in S phase is shown in red. (C) YUGASP cells expressing NS or IFI6 shRNA were analyzed using a DNA fiber assay. Representative images of the DNA fibers are shown. (D) YUGASP cells expressing NS or IFI6 shRNA were analyzed using the DNA fiber assay. Percentages of ongoing (ON), newly fired (NF), and terminated (Tr) DNA forks are shown. (E) YUGASP, SKMEL-103, and M318 cells expressing NS or IFI6 shRNA were analyzed for SA-β-gal activity. Representative images of cells stained for SA-β-gal activity for the indicated melanoma cell lines expressing NS or IFI6 shRNA are shown. (F) Percentage of SA-β-gal-positive cells for the experiment shown in panel E for the indicated melanoma cell lines expressing NS or IFI6 shRNA is plotted. (G) YUGASP, SKMEL-103 and M318 cells expressing each shRNA were analyzed for H3K9Ac, γH2A.X, and H2A.X using immunoblot. ACTINB was used as a loading control. In all panels, data are presented as mean ± SEM, and *p<0.05, **p<0.005.
Figure 4—figure supplement 1

IFI6 knockdown results in upregulation of E2F2 and its target genes.
(Top) mRNA levels of the indicated genes in SKMEL-103 cells expressing non-specific (NS) or IFI6 shRNA were analyzed by RT-qPCR. Relative mRNA expression for indicated genes in IFI6 shRNA in comparison to NS shRNA expressing cells is shown. (Bottom) mRNA levels of the indicated genes in M318 cells expressing NS or IFI6 shRNA were analyzed by RT-qPCR. Relative mRNA expression for indicated genes in IFI6 shRNA in comparison to NS shRNA expressing cells is shown. In all panels, data are presented as mean ± SEM; *p<0.05.
Figure 4—figure supplement 2
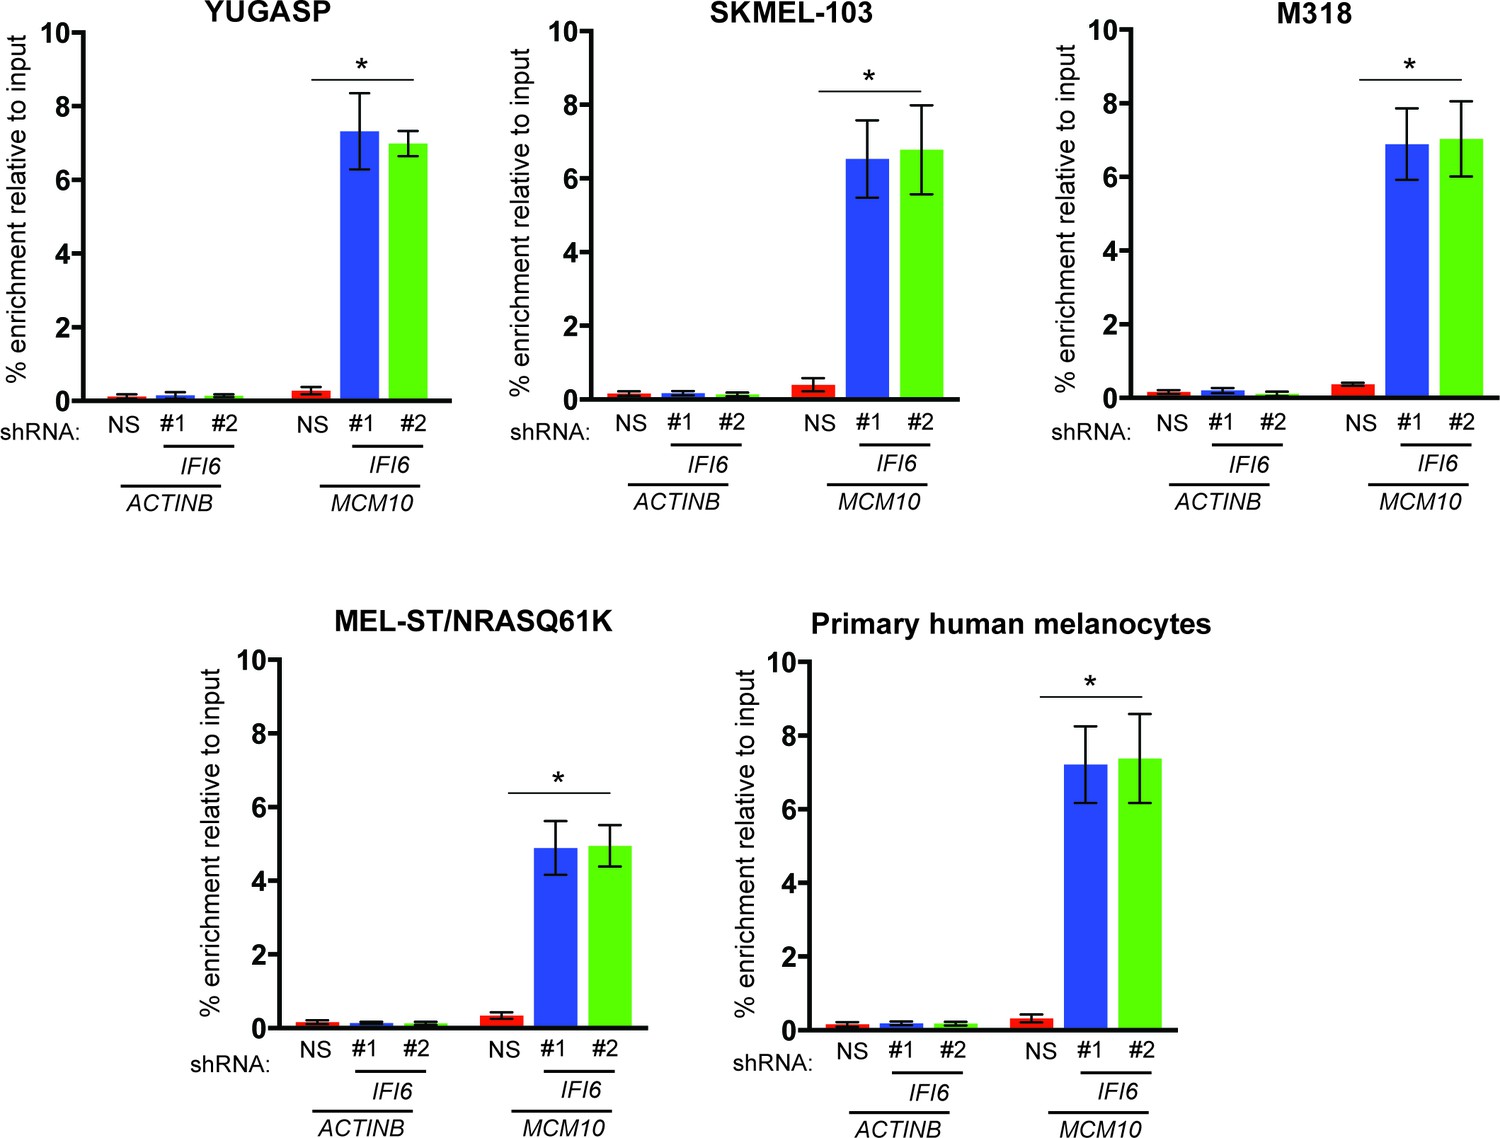
Increased enrichment of E2F2 on MCM10 promoter following IFI6 knockdown.
Indicated cells expressing a non-specific (NS) or IFI6 shRNA were analyzed for E2F2 enrichment on MCM10 promoter or as control on ACTINB promoter by ChIP assay.% enrichment of E2F2 relative to input under indicated conditions on either MCM10 or ACTINB promoters are shown. In all panels, data are presented as mean ± SEM; *p<0.05.
Figure 4—figure supplement 3
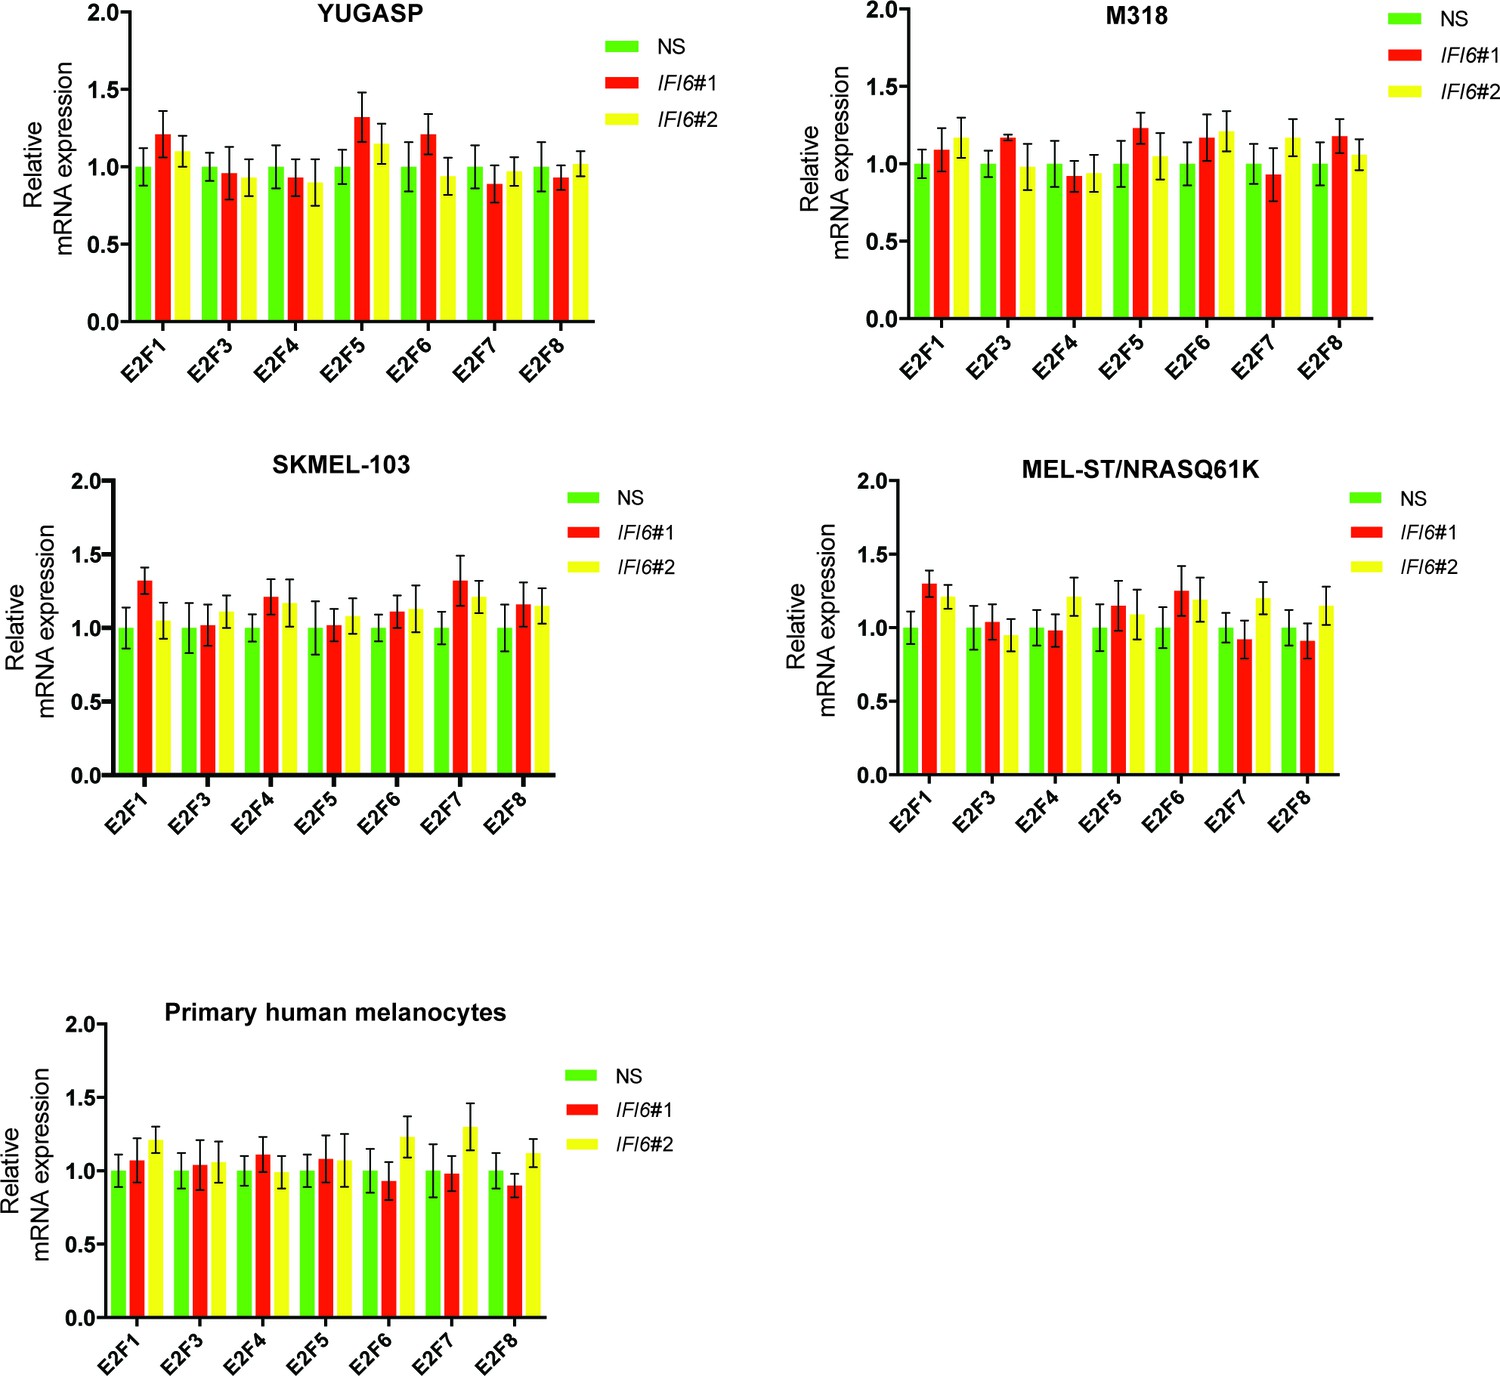
IFI6 knockdown affects expression of E2F2 but not the expression of other E2F family genes.
mRNA levels of the indicated E2F genes in the indicated cells expressing non-specific (NS) or IFI6 shRNA were analyzed by RT-qPCR. Relative mRNA expression for the indicated E2F genes in the indicated cells expressing IFI6 shRNAs in comparison to NS shRNA expressing cells are shown.
Figure 4—figure supplement 4

Simultaneous knockdown of IFI6 and E2F2 restores DNA replication defect.
(Top) YUGASP cells expressing non-specific (NS), IFI6, or E2F2 shRNA (alone or in combination) were analyzed by FACS. Histograms for each condition are shown. (Bottom) DNA replication of YUGASP cells expressing the indicated shRNA was analyzed by the DNA fiber assay. Representative images are shown.
Figure 5
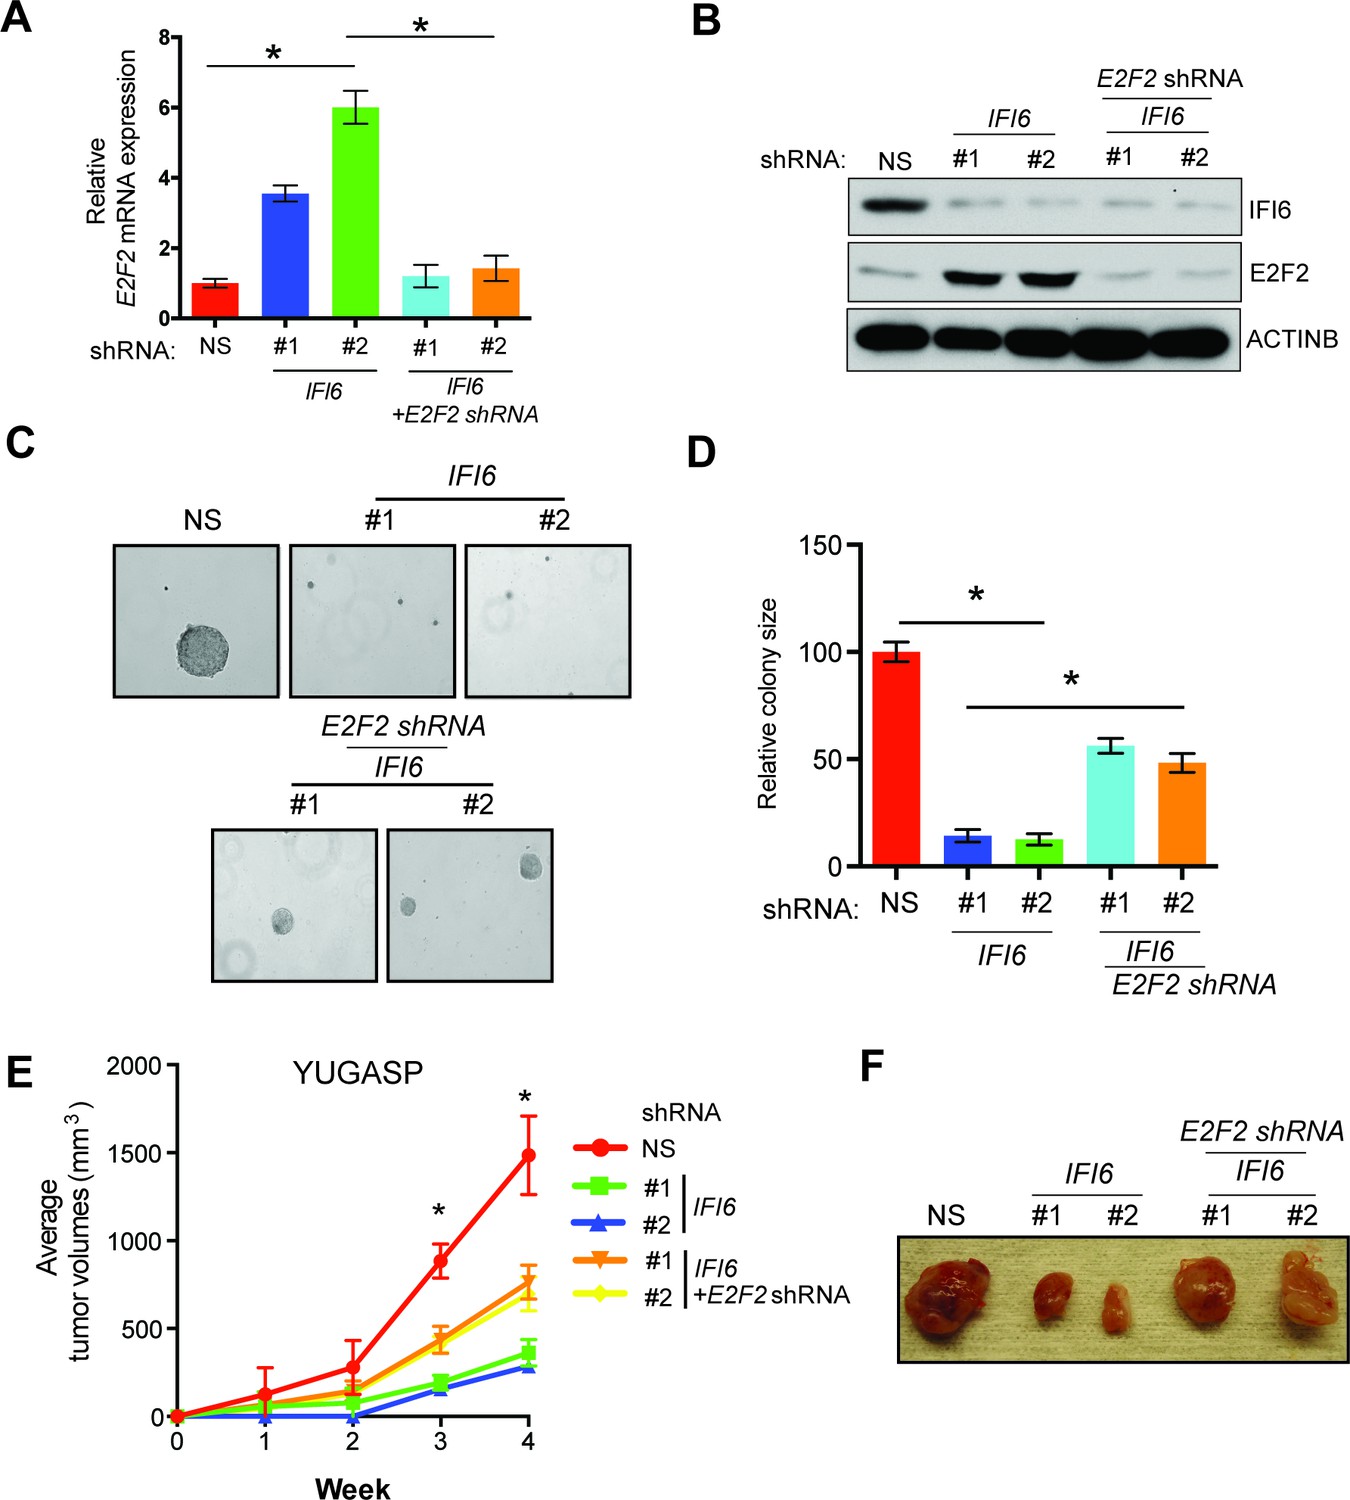
E2F2 mediates the loss of IFI6-induced tumor suppression.
(A) YUGASP cells expressing either non-specific (NS) or IFI6 shRNA, alone or in combination with E2F2 shRNA, were analyzed for E2F2 mRNA expression by RT-qPCR. A relative E2F2 mRNA expression under the indicated conditions is shown. (B) YUGASP cells expressing either NS or IFI6 shRNA, alone or in combination with E2F2 shRNA were analyzed for E2F2, IFI6, and ACTINB protein expression by immunoblotting. (C) YUGASP cells expressing either NS or IFI6 shRNA, alone or in combination with E2F2 shRNA were analyzed for colony-forming potential. Representative soft agar images are shown. (D) Relative colony size in the soft agar assay presented in panel C under the indicated conditions is shown. (E) YUGASP cells expressing either NS or IFI6 shRNA, alone or in combination with E2F2 shRNA, were injected subcutaneously into the flank of athymic nude mice. Average tumor volumes (n = 5) formed from each cell line at the indicated times are shown. (F) Representative tumor images for the experiment presented in panel E under the indicated conditions are shown. In all panels, data are presented as mean ± SEM, and *p<0.05.
Figure 6 with 1 supplement
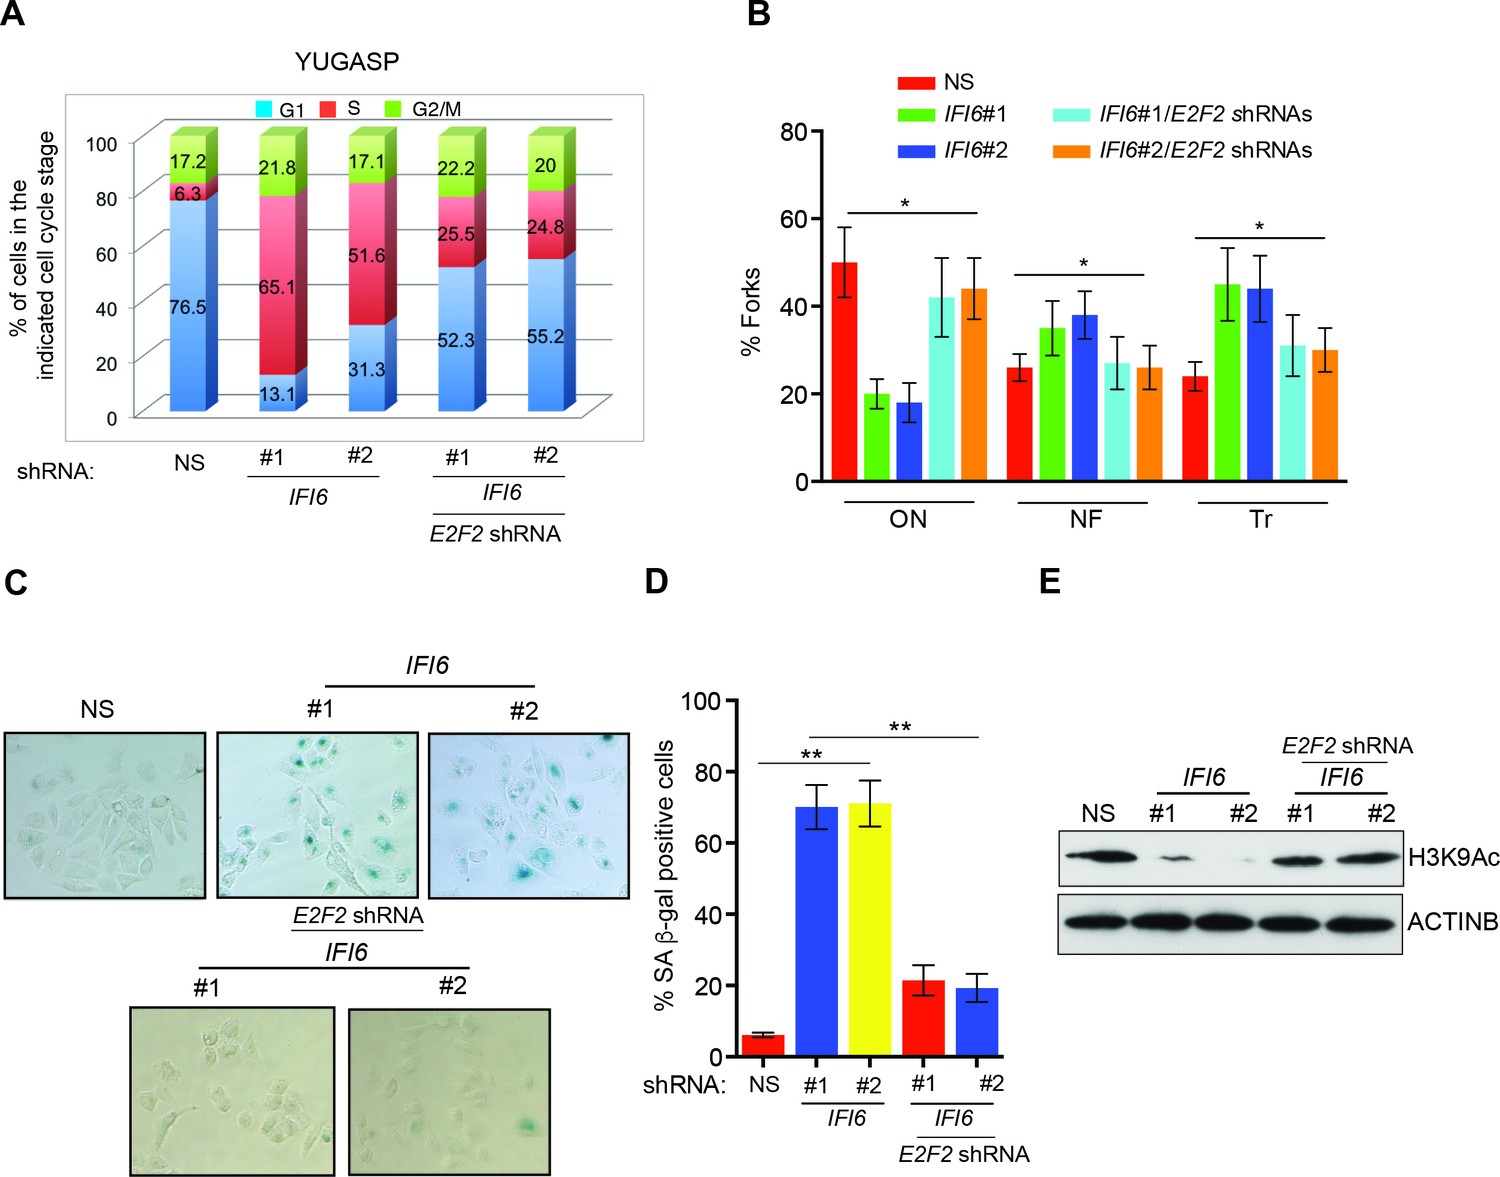
E2F2 mediates the loss of IFI6-induced dysregulated DNA replication.
(A) YUGASP cells expressing either non-specific (NS) or IFI6 shRNA, alone or in combination with E2F2 shRNA were analyzed by FACS. The percentages of cells in each cell cycle stage are shown. (B) YUGASP cells expressing either NS or IFI6 shRNA, alone or in combination with E2F2 shRNA, were analyzed using the DNA fiber assay. The percentages of ongoing (ON), newly fired (NF), and terminated (Tr) DNA forks are shown. (C) YUGASP cells expressing either NS or IFI6 shRNA, alone or in combination with E2F2 shRNA, were analyzed for SA-β-gal activity. Representative images of cells stained for SA-β-gal activity are shown. (D) Percentage of SA-β-gal-positive cells for the experiment presented in the panel C is plotted. (E) YUGASP cells expressing each shRNA were analyzed for H3K9Ac by immunoblotting. ACTINB was used as a loading control. In all panels, data are presented as mean ± SEM, and *p<0.05, **p<0.005.
Figure 6—figure supplement 1
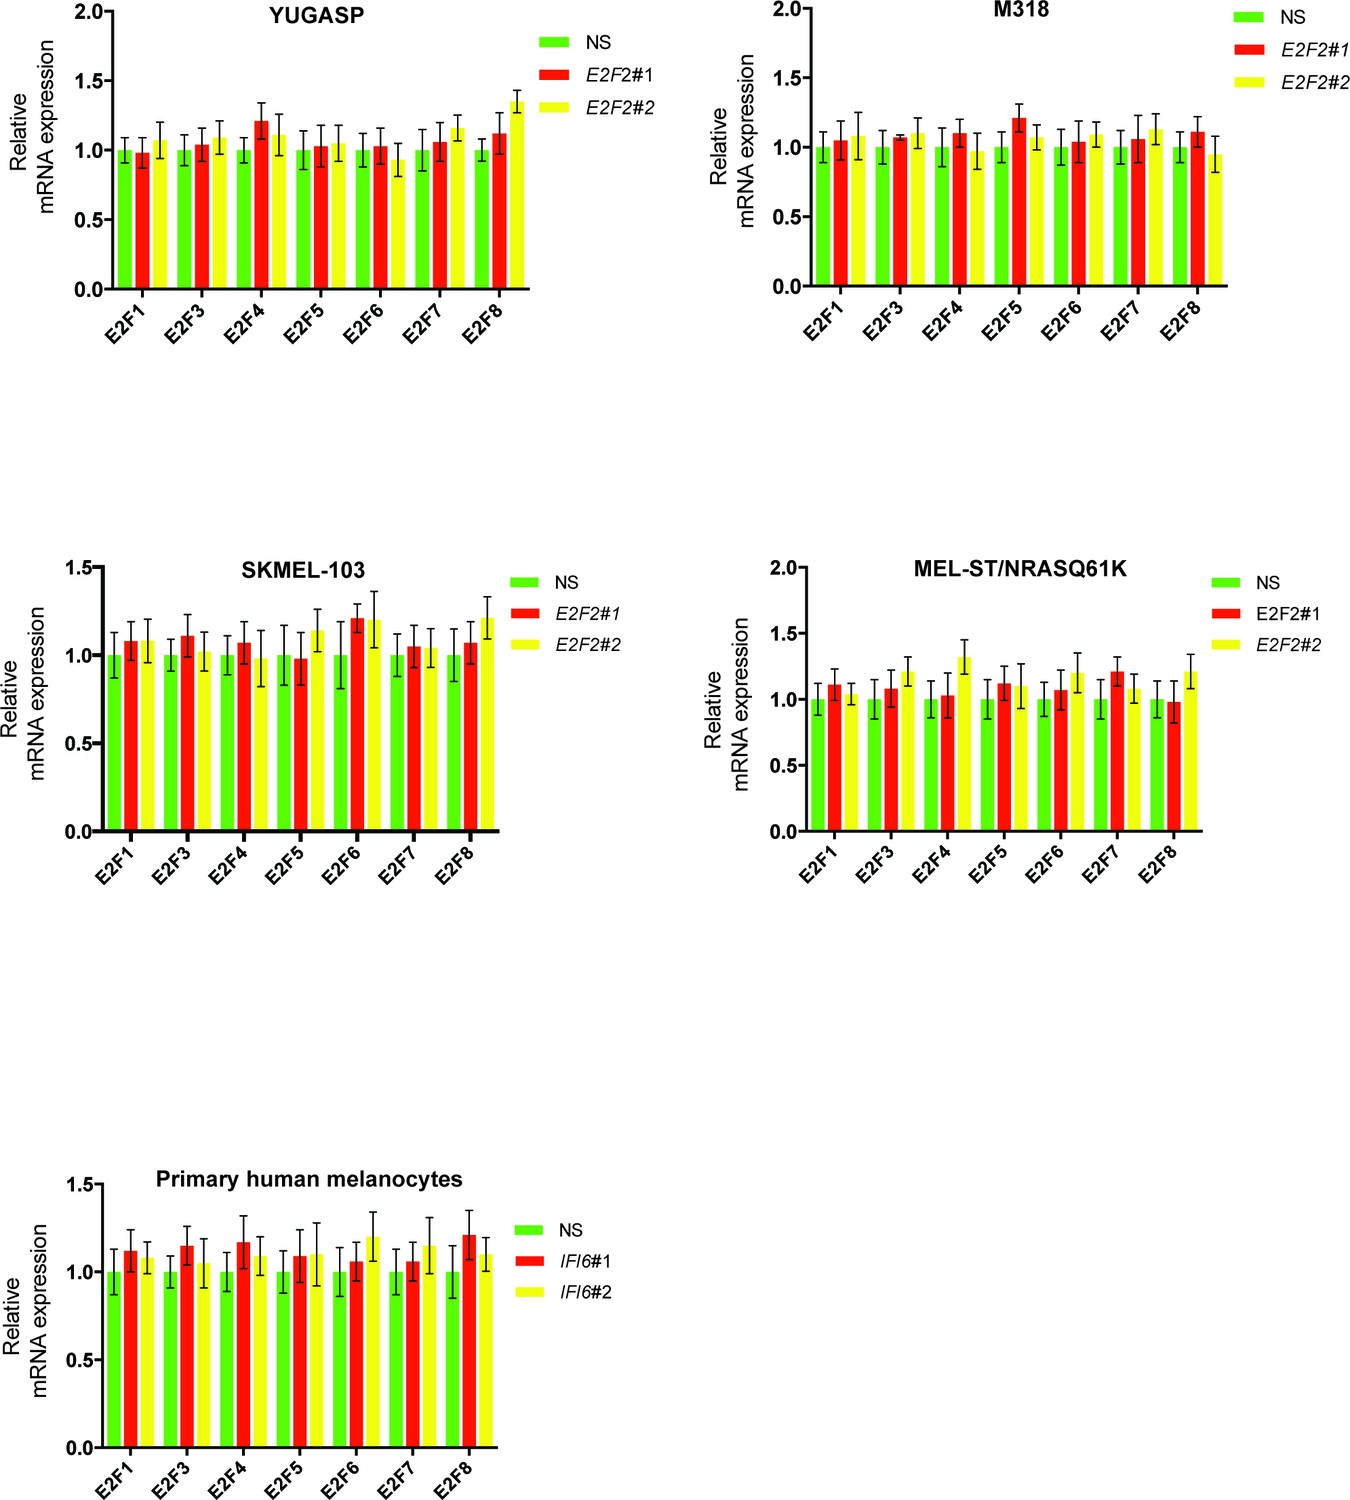
E2F2 shRNA does not affect the mRNA expression of other E2F family genes.
mRNA levels of E2F family genes in cells expressing non-specific (NS) or E2F2 shRNA were analyzed by RT-qPCR. Relative mRNA expression for the indicated E2F genes in indicated cells expressing E2F2 shRNAs in comparison to NS shRNA expressing cells are shown.
Figure 7 with 1 supplement
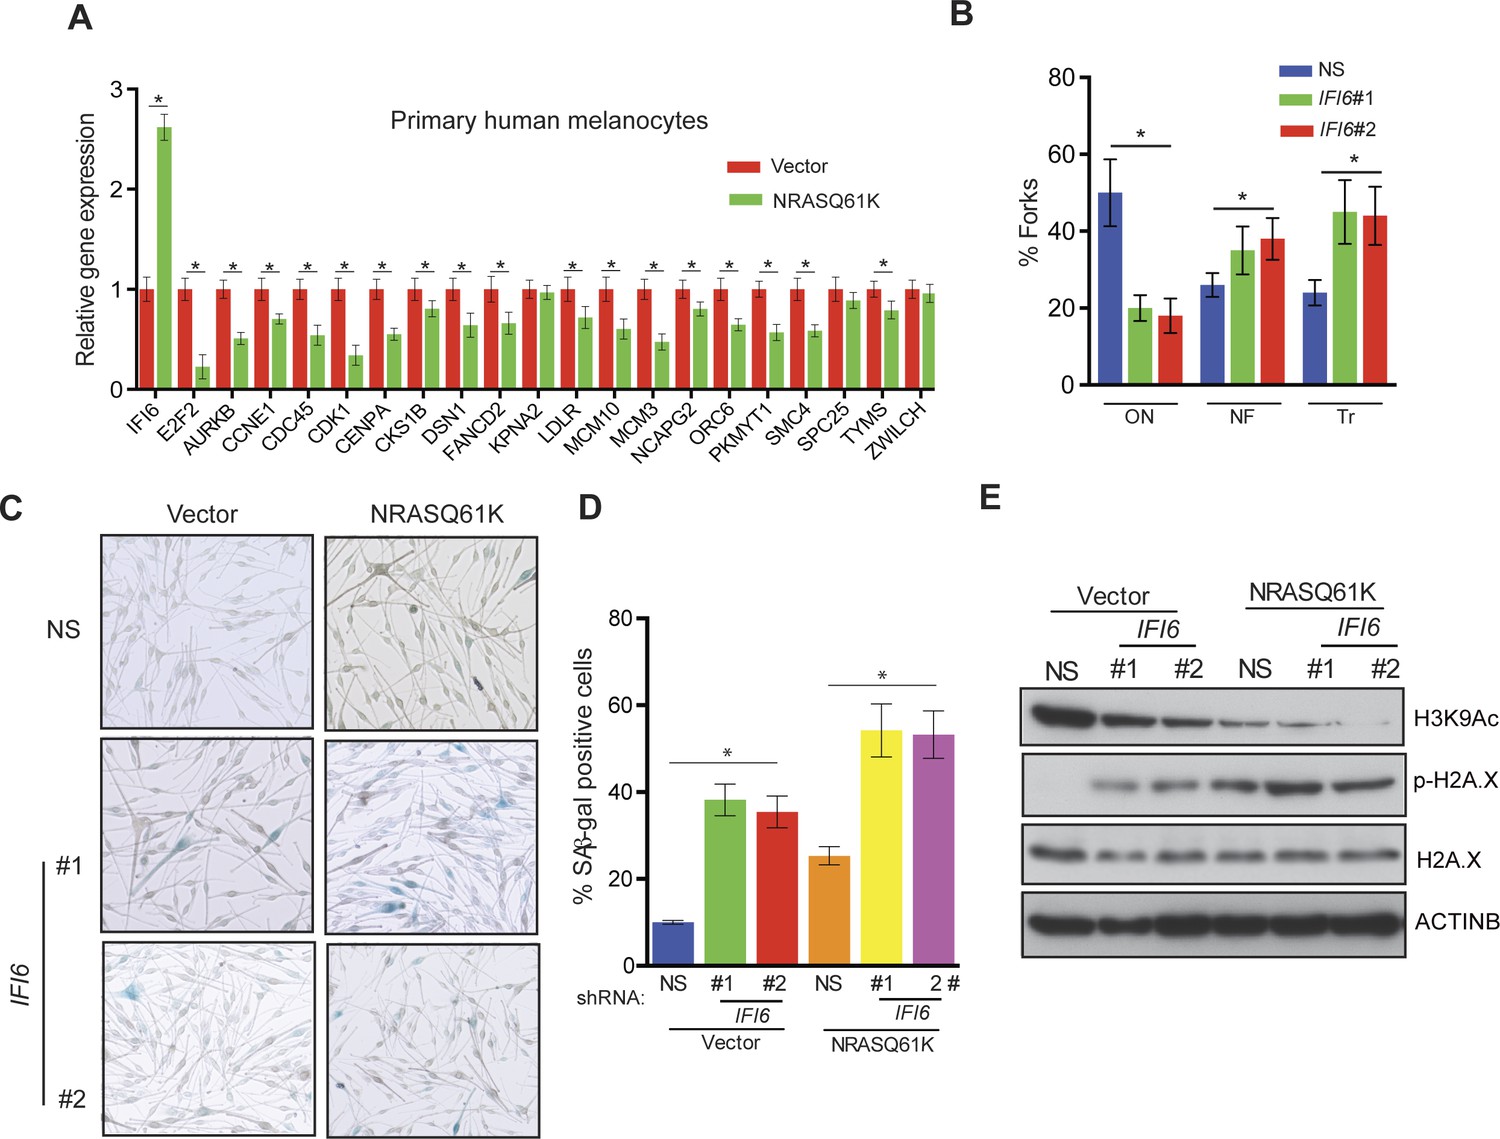
IFI6 loss results in DNA replication stress and senescence induction in primary human melanocytes.
(A) Primary human melanocytes expressing NRASQ61K or an empty vector were analyzed for the indicated genes by qRT-PCR. Relative gene expression is shown. (B) Primary human melanocytes expressing indicated shRNA were analyzed by DNA combing assay. Percentages of ongoing (ON), newly fired (NF), and terminated (Tr) DNA forks are shown. (C) Melanocytes expressing non-specific (NS) or IFI6, shRNA with either empty vector or NRASQ61K, were analyzed by SA-β-gal assay. Representative images are shown. (D) Percentage of SA-β-gal–positive cells expressing NS or IFI6 shRNA with either vector or NRASQ61K for the experiment presented in panel C is shown. (E) Melanocytes expressing NS or IFI6 shRNA in combination with either empty vector or NRASQ61K, were analyzed for the indicated proteins by immunoblotting. Data are presented as mean ± SEM, and *p<0.05.
Figure 7—figure supplement 1
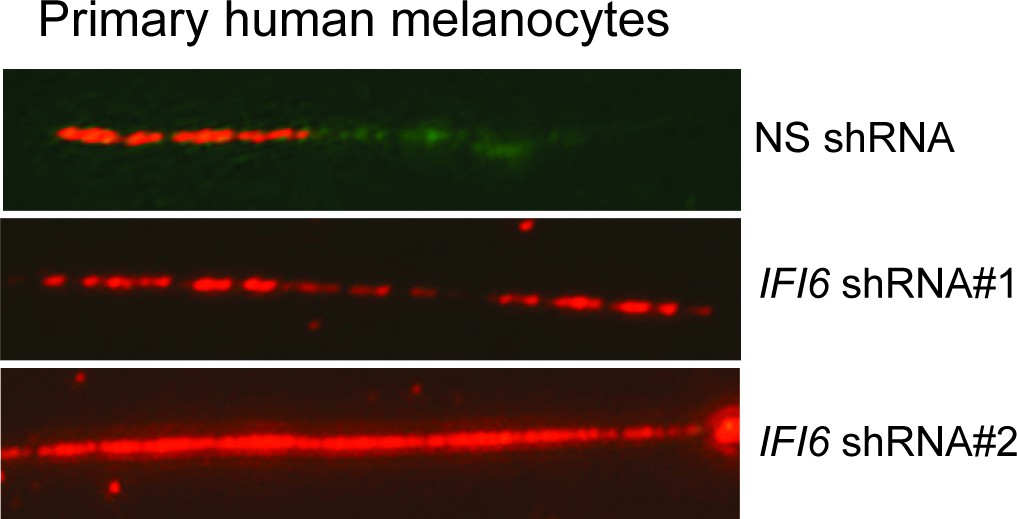
DNA fiber assay results of primary human melanocytes expressing IFI6 shRNA.
DNA replication in primary human melanocytes expressing non-specific (NS) or IFI6 shRNA was analyzed by DNA fiber assay. Representative images are shown.
Figure 8 with 2 supplements
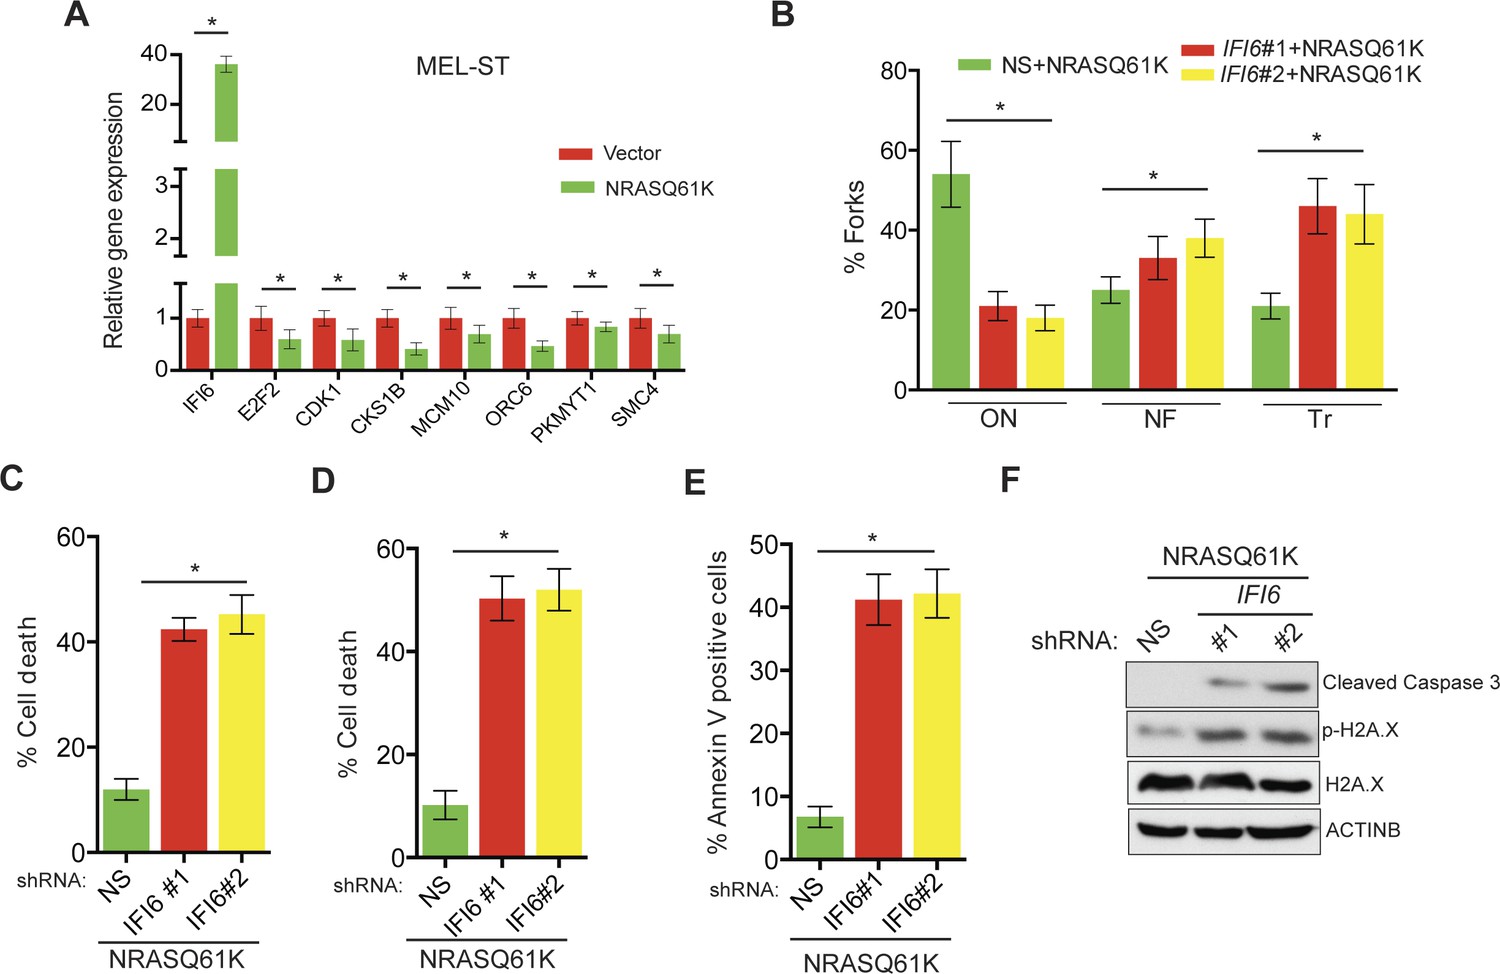
IFI6 loss results in DNA replication stress and apoptosis induction in MEL-ST/NRASQ61K cells.
(A) MEL-ST cells expressing empty vector or NRASQ61K were analyzed by RT-qPCR. The expression of each gene in MEL-ST/NRASQ61K cells is shown relative to expression in empty vector control. (B) MEL-ST/NRASQ61K cells with the indicated shRNA were analyzed for DNA replication using the DNA fiber assay. The percentages of ongoing (ON), newly fired (NF), and terminated (Tr) DNA forks are shown. (C) Growth In Low Attachment (GILA) assay was performed using MEL-ST/NRASQ61K cells expressing either non-silencing (NS) or IFI6 shRNA. Cell death (%) was measured 48 hr after plating under the indicated conditions using the trypan blue exclusion assay and plotted. (D) MEL-ST/NRASQ61K cells expressing either NS or IFI6 shRNA were plated on poly-HEMA plates. Cell death (%) was measured 48 hr after plating under each condition using the trypan blue exclusion assay and plotted. (E) MEL-ST/NRASQ61K cells expressing either NS or IFI6 shRNA were plated on poly-HEMA plates. Apoptotic cell death (%) was measured 48 hr after plating under each condition by annexin V-FITC staining and plotted. (F) MEL-ST/NRASQ61K cells expressing either NS or IFI6 shRNA were plated on poly-HEMA plates. After 48 hr, the indicated proteins were analyzed by immunoblotting. ACTINB was used as a control. In all panels, data are presented as mean ± SEM, and *p<0.05.
Figure 8—figure supplement 1
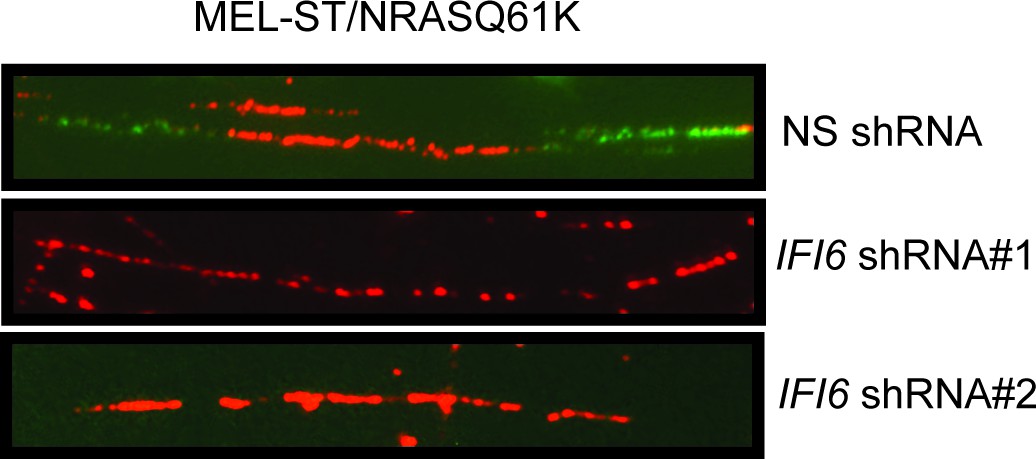
DNA fiber assay results in MEL-ST/NRASQ61K cells.
DNA replication in NRASQ61K-transformed MEL-ST cells expressing either non-specific (NS) or IFI6 shRNA was analyzed by DNA combing assay. Representative images are shown.
Figure 8—figure supplement 2
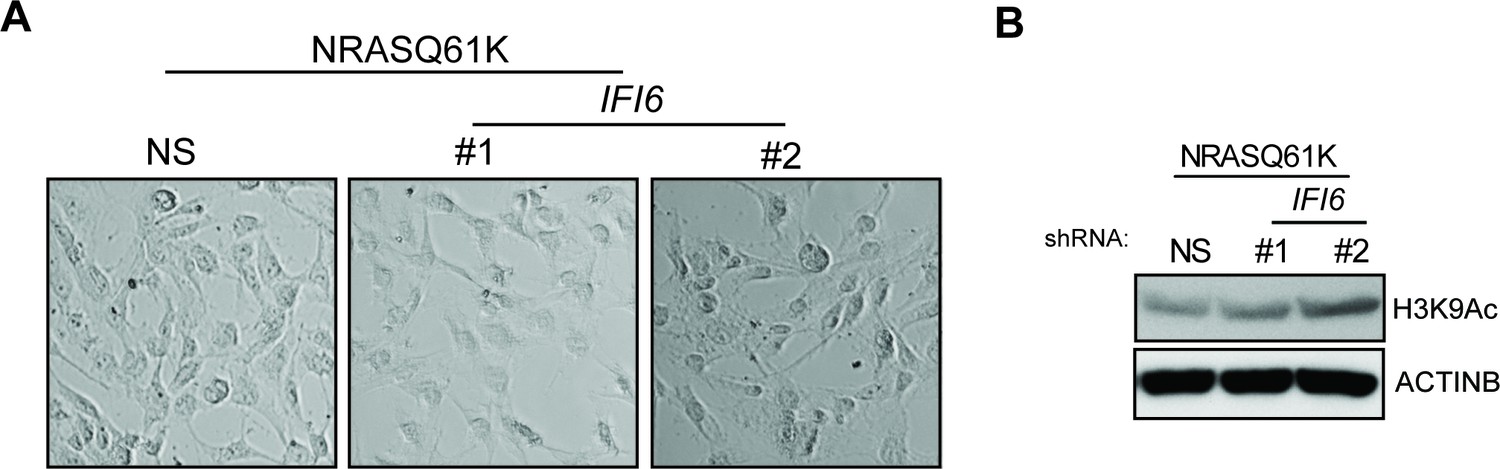
IFI6 knockdown in MEL-ST/NRASQ61K does not induce senescence.
(Left panel) MEL-ST/NRASQ61K cells expressing non-specific (NS) or IFI6 shRNA were analyzed for senescence induction by using the SA-β-gal assay. Representative images are shown. (Right panel) MEL-ST/NRASQ61K cells expressing NS or IFI6 shRNA were analyzed for H3K9Ac mark by immunoblotting. ACTINB was used as a loading control.
Figure 9 with 1 supplement
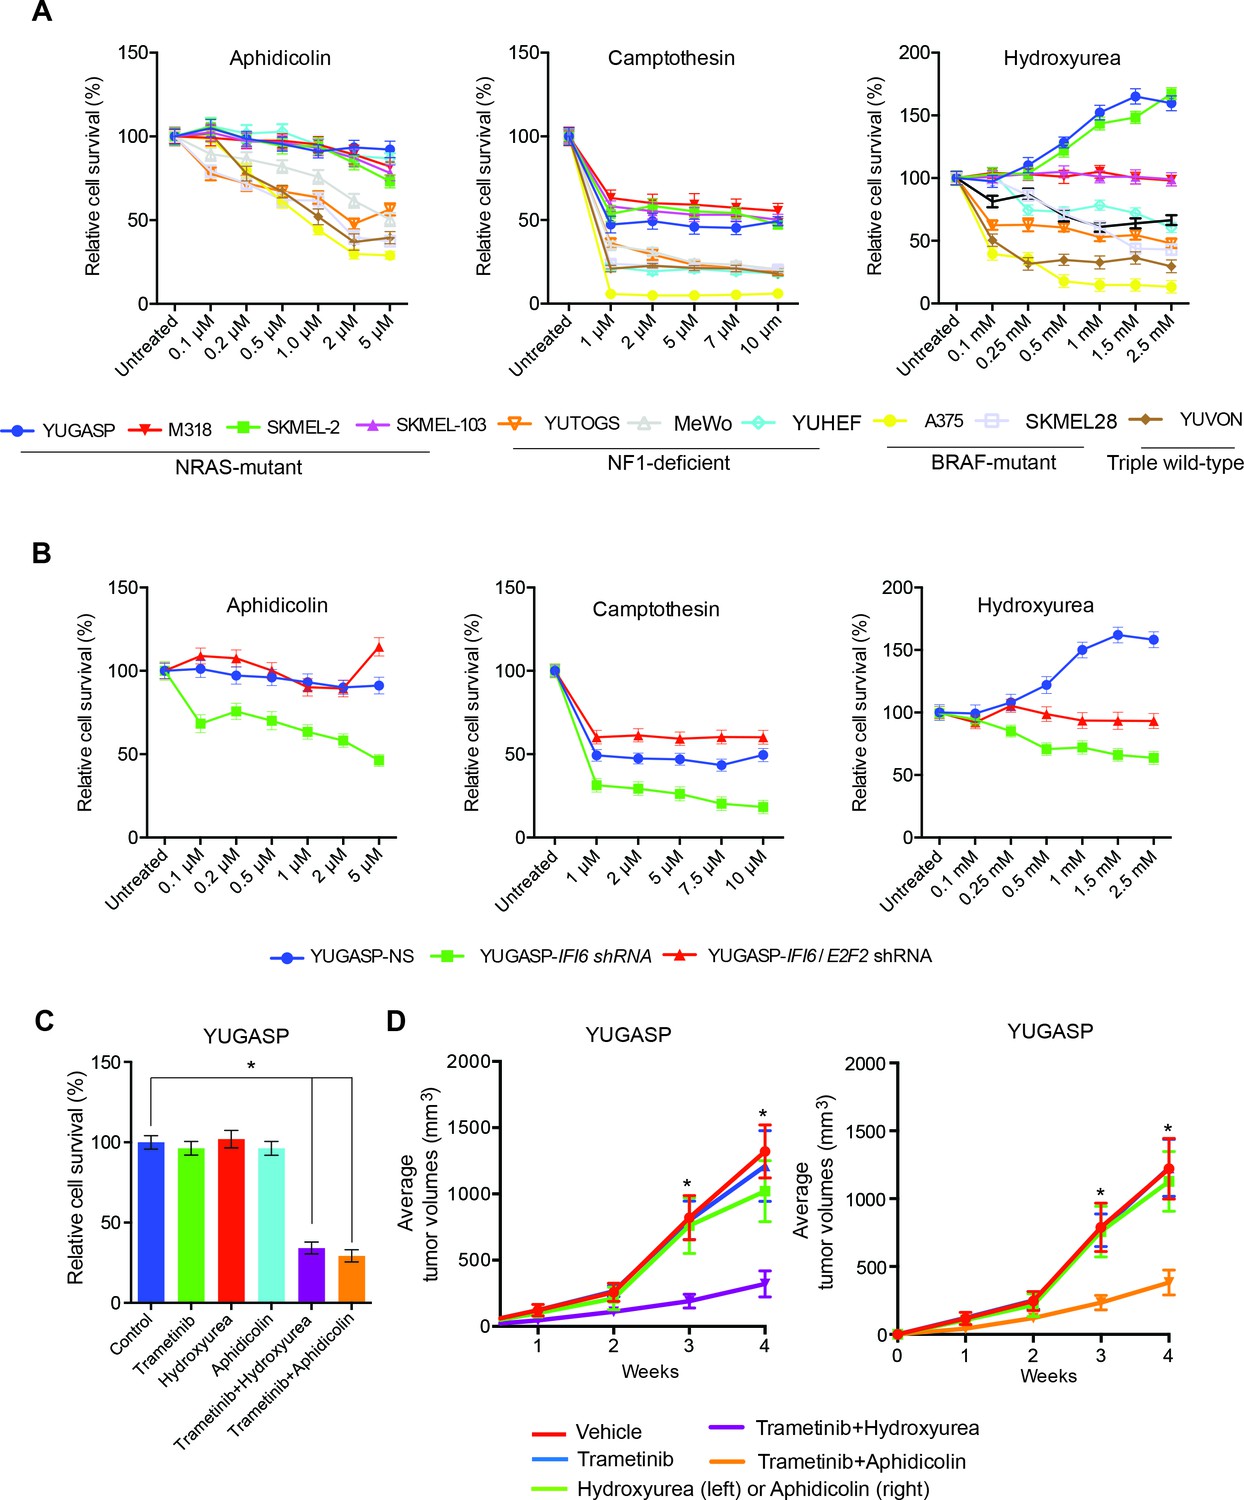
Targeting the DNA replication stress resistance pathway to treat NRAS-mutant melanoma.
(A) Indicated melanoma cell lines were treated with indicated drugs and analyzed by MTT assay after 48 hr of drug treatment. Survival was determined relative to vehicle-treated cells. (B) Indicated NRAS-mutant melanoma cell lines expressing IFI6 or NS shRNA, or simultaneously expressing IFI6 and E2F2 shRNA, were treated with each DNA replication stress-inducing agent for 48 hr and analyzed by MTT assay. Survival was determined relative to cells expressing NS shRNA. (C) Melanoma cells were treated with trametinib (1 nM) alone or in combination with DNA replication stress-inducing agents (0.2 µM aphidicolin or 0.25 mM hydroxyurea) for 48 hr and analyzed by MTT assay. Survival was determined relative to vehicle-treated cells. (D) Melanoma cells were injected subcutaneously into athymic nude mice (n = 5). The mice were treated on alternate days with trametinib (0.1 mg/kg, orally) alone or in combination with DNA replication stress-inducing agents (50 mg/kg aphidicolin i.p. or 50 mg/kg hydroxyurea, i.p.). Average volumes for tumors formed from each cell line at the indicated times are shown (n = 5). In all panels, data are presented as mean ± SEM, and *p<0.05.
Figure 9—figure supplement 1
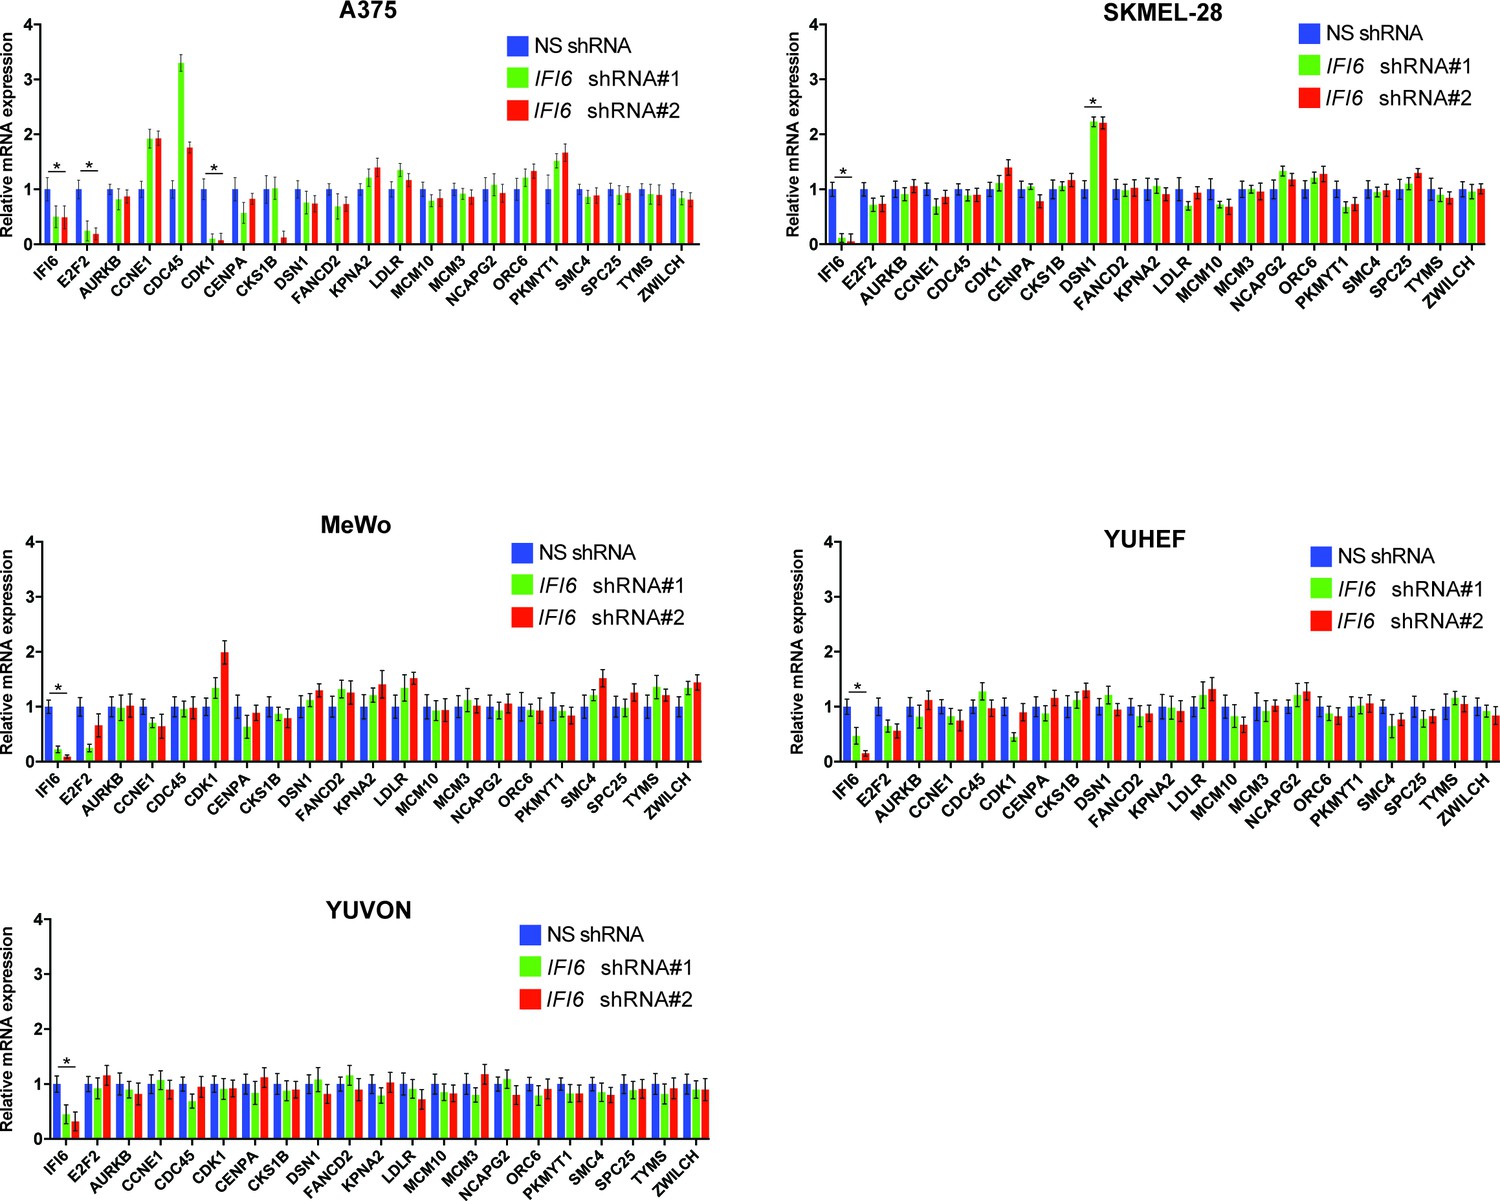
IFI6 knockdown in non-NRAS mutant melanoma cells does not induce expression of E2F2 or its target genes.
mRNA levels of the indicated genes in melanoma cell lines expressing non-specific (NS) shRNA or IFI6 shRNA were analyzed by RT-qPCR. Relative mRNA expression for IFI6 shRNAs expressing melanoma cells in comparison to NS shRNA is shown. In all panels, data are presented as mean ± SEM; *p<0.05.
Figure 10
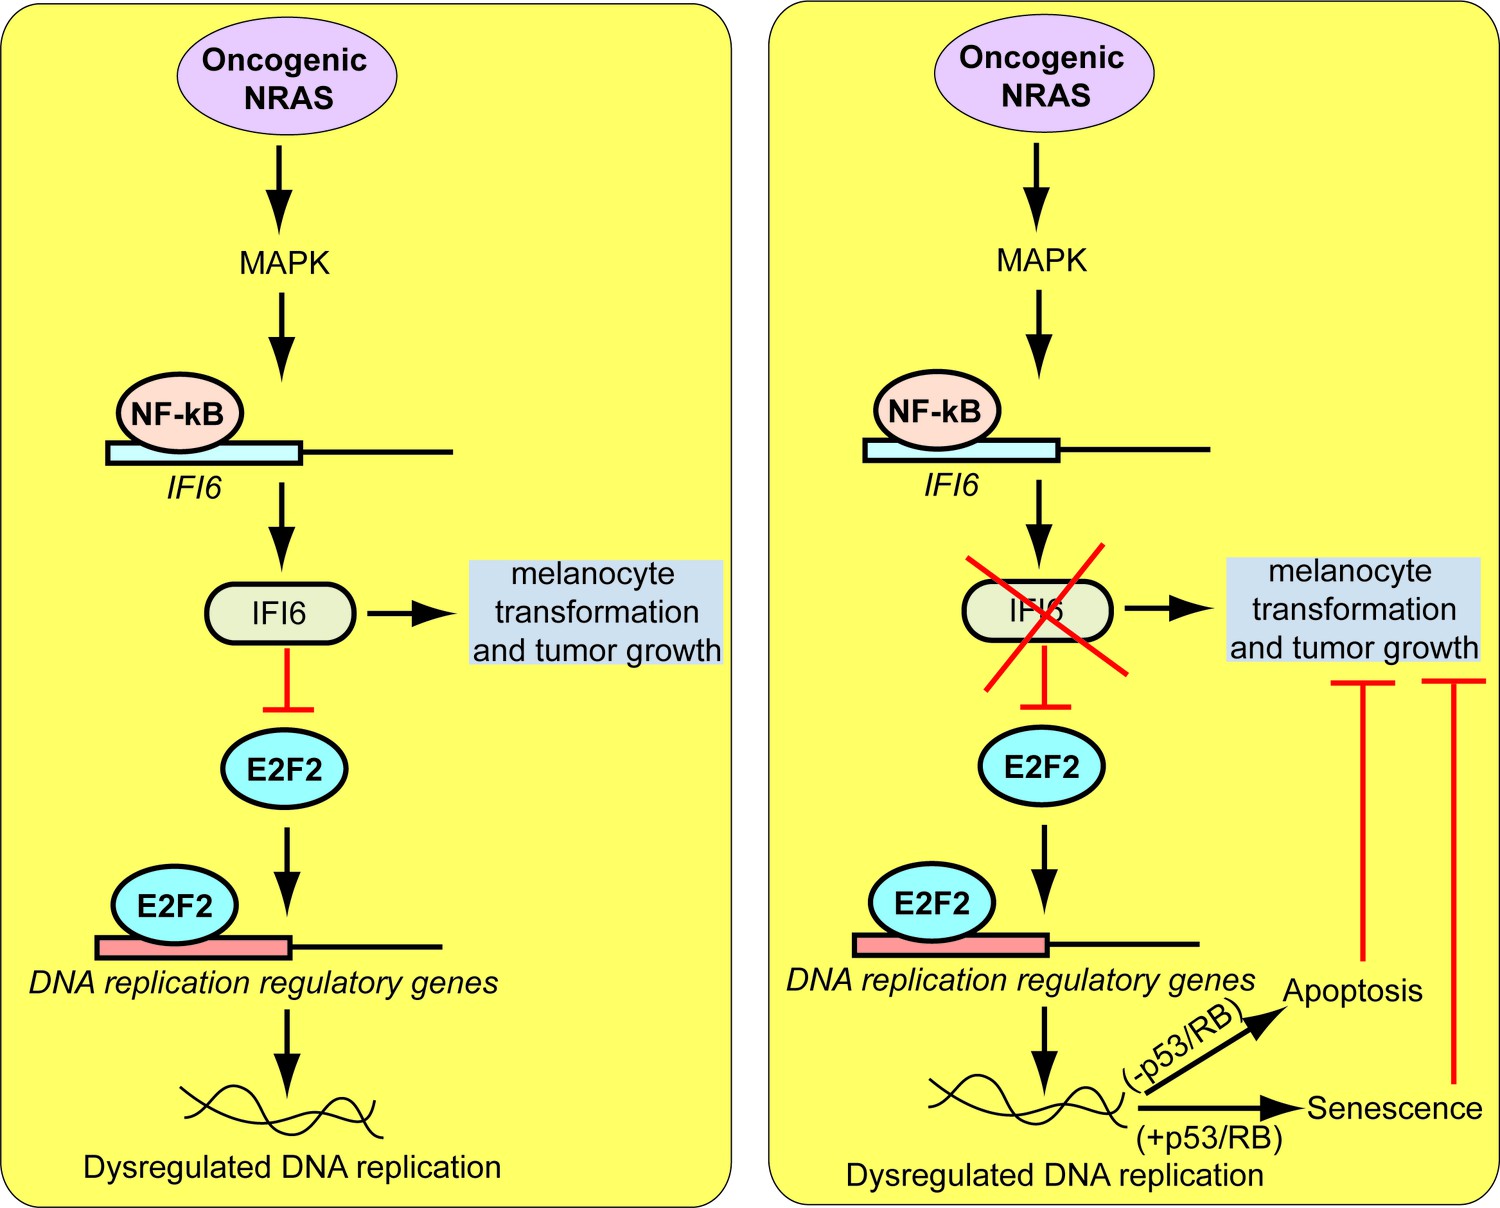
Proposed model for the role of IFI6 in melanoma tumor growth.
The model shows the mechanism by which IFI6 contributes to NRASQ61K-induced transformation and the maintenance of oncogenic NRAS-mutant melanoma tumor growth.
Additional files
-
Supplementary file 1
Files related to microarray analysis and tables for reagents.
(A) List of genes that are significantly upregulated (p<0.05, Fold-change = 2 fold or more) in NRASQ61K expressing MEL-ST cells. (B) Fold change (FC) for significantly altered genes (p-value<0.05) in YUGASP cells expressing IFI6 shRNAs. (C) Biological pathway enrichment analysis report. (D) Primer sequences for RT-qPCR analysis; clone ID and catalog numbers for shRNAs (Open Biosystems); antibodies used; source and concentration of chemical inhibitors used.
- https://doi.org/10.7554/eLife.16432.031
-
Supplementary file 2
Analysis of MAP kinase regulated and BRAF-signature genes for correlation with BRAF/NRAS/NF1 mutation status using melanoma TCGA dataset.
- https://doi.org/10.7554/eLife.16432.032
Download links
A two-part list of links to download the article, or parts of the article, in various formats.
Downloads (link to download the article as PDF)
Open citations (links to open the citations from this article in various online reference manager services)
Cite this article (links to download the citations from this article in formats compatible with various reference manager tools)
Interferon alpha-inducible protein 6 regulates NRASQ61K-induced melanomagenesis and growth
eLife 5:e16432.
https://doi.org/10.7554/eLife.16432


