Subthalamic, not striatal, activity correlates with basal ganglia downstream activity in normal and parkinsonian monkeys
- The Hebrew University-Hadassah Medical School, Israel
- The Hebrew University, Israel
- University of Rochester School of Medicine, United States
- Hadassah University Hospital, Israel
Figures
Figure 1
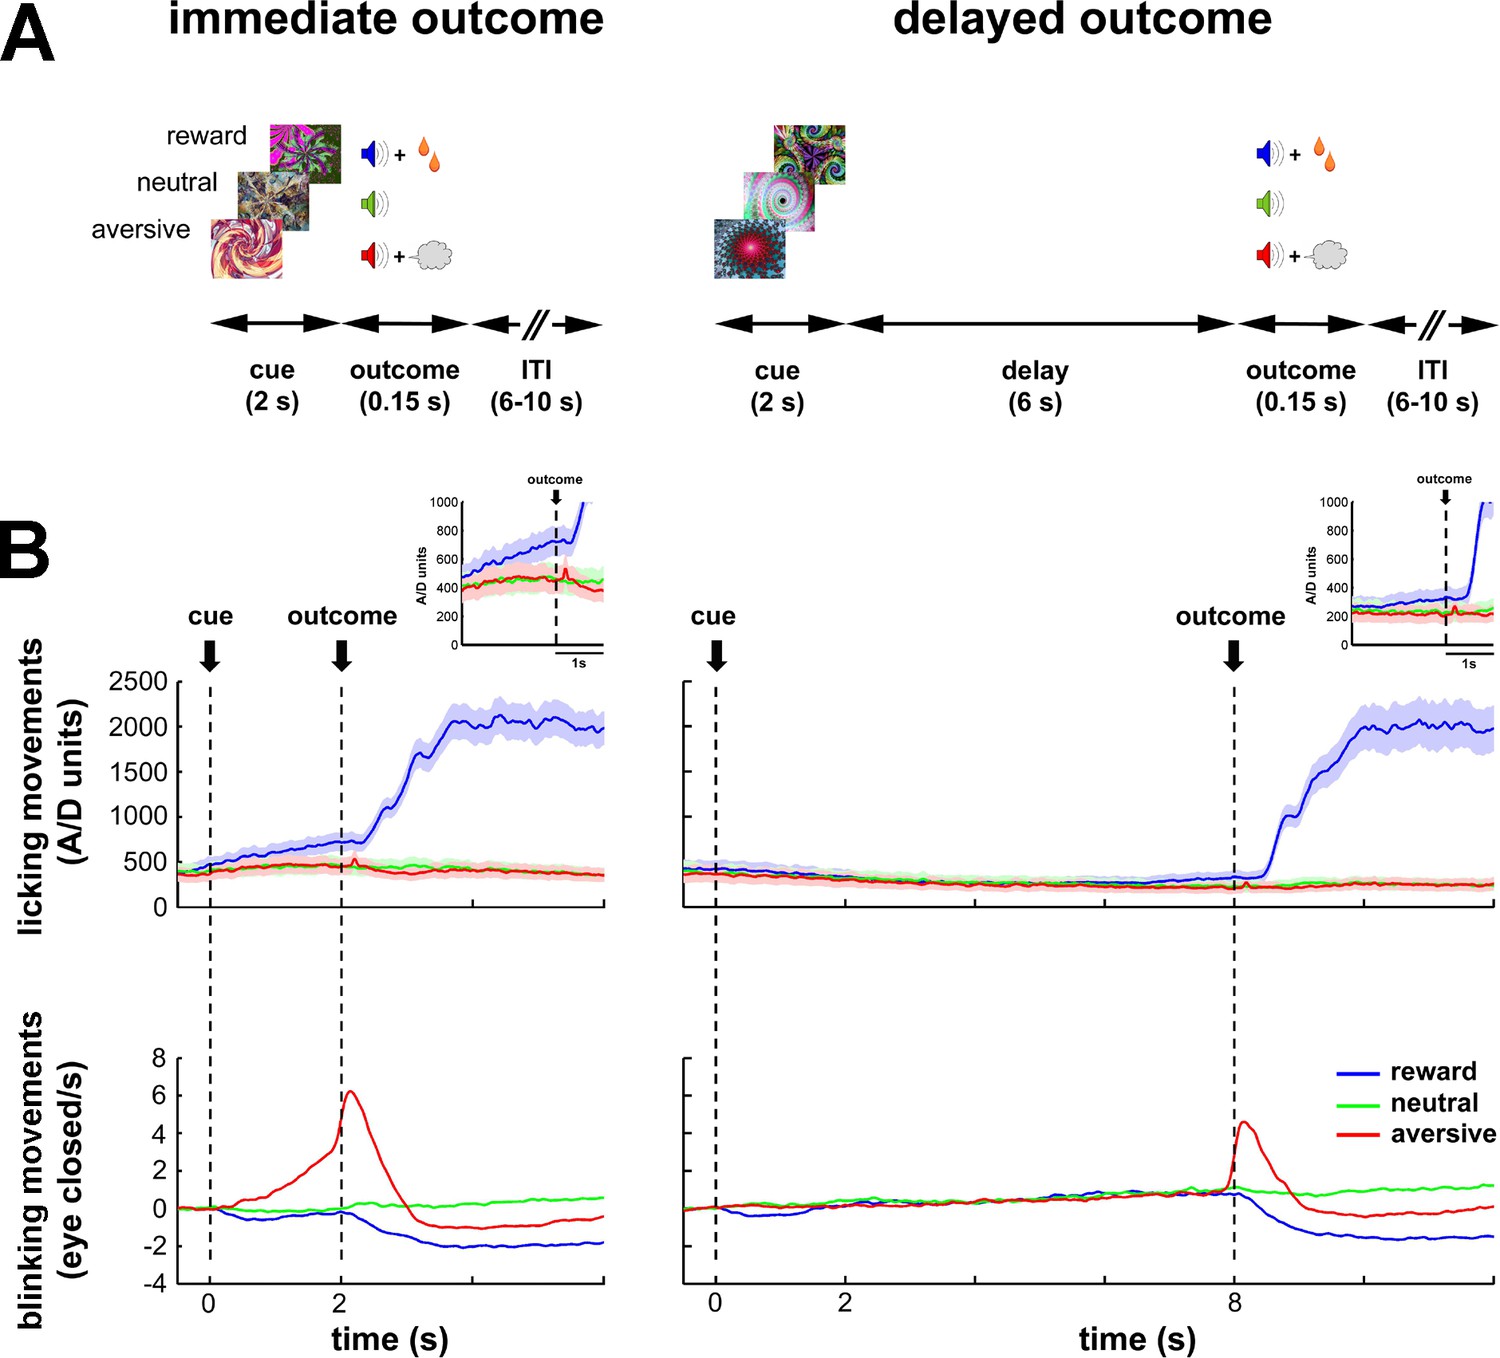
Task design and behavioral monitoring.
(A) Temporal discounting classical conditioning task. Each trial started with the presentation of a visual cue (2 s) that predicted the delivery of food (reward/appetitive trials), airpuff (aversive trials) or sound only (neutral trials). Cue offset was immediately followed by the outcome period (immediate outcome condition) or by a 6-s delay period which preceded the outcome period (delayed outcome condition). The outcome period (0.15 s) was followed by a variable inter-trial interval (ITI) of 6–10 s. Trial order and ITI duration were randomized. (B) Animals' task performance. Frequency of licking (top) and blinking (bottom) movements over time are aligned to cue onset (time = 0). Time 2 and 8 s correspond to outcome delivery in the immediate and delayed conditions, respectively. Data were averaged for each session (hundreds of trials) and then across sessions (N = 41 and 30, monkey K and S, respectively). Data were grouped since no significant differences were found between the two monkeys. Solid line and shaded envelope represent mean ± standard error of the mean (SEM), respectively. Color code indicates the cue/outcome value: blue-appetitive, green-neutral and red-aversive.
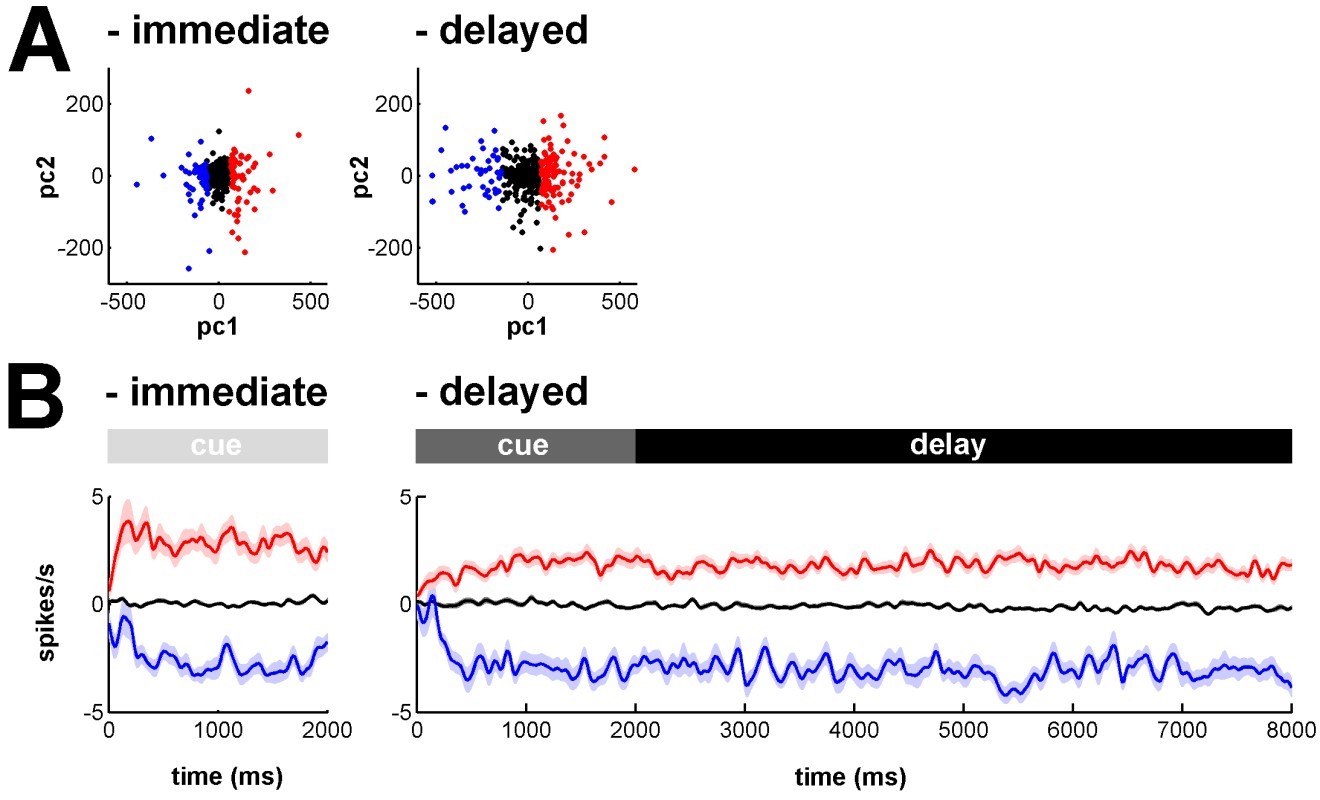
Figure 2
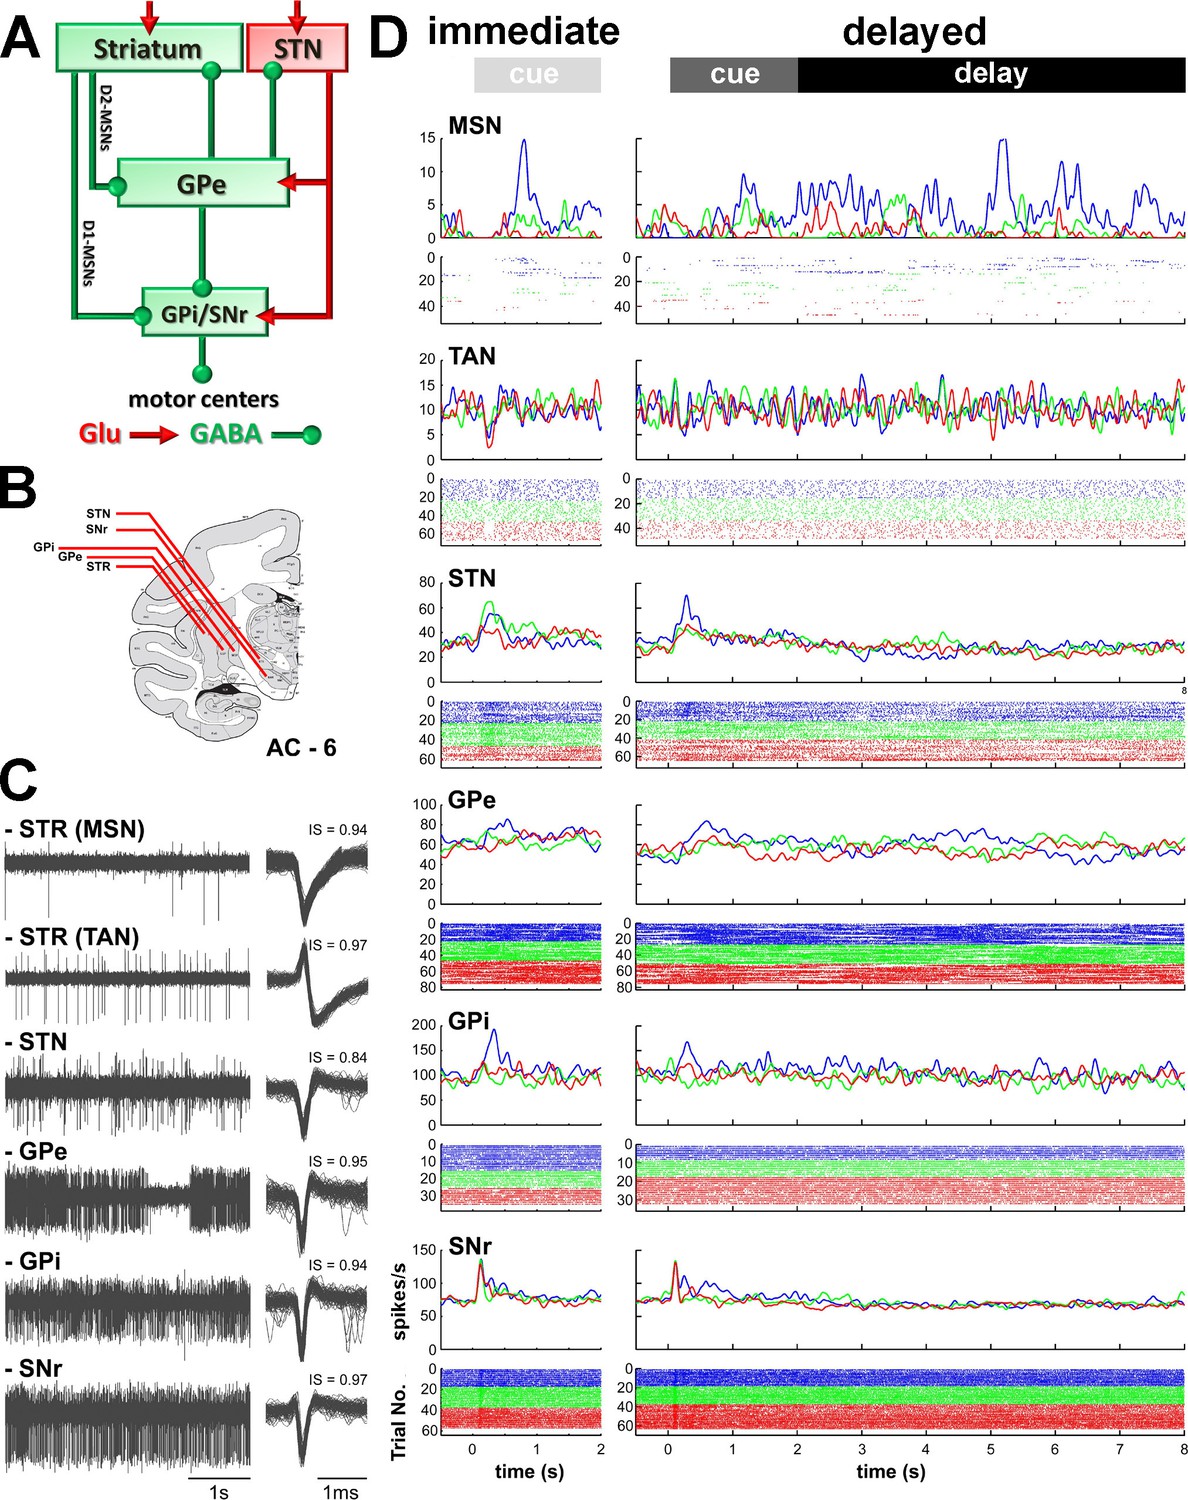
Recordings sites and neuronal activities in the BG network.
(A) Schematic model of BG functional connectivity. Glutamatergic and GABAergic connections are shown in red and green, respectively. D1-/D2-MSNs: striatal medium spiny (projection) neurons expressing D1/D2 dopamine receptors; STR: striatum; STN: subthalamic nucleus; GPe-i: external or internal segment of the globus pallidus; SNr: substantia nigra reticulata. (B) Representative coronal section - 6 mm from the anterior commissure (AC - 6), adapted from Martin and Bowden (2000). (C) Left, examples of 4 s of multi-unit activity, online filtered between 250 and 6000 Hz. Right, 100 randomly chosen superimposed waveforms of the extracellular action potentials of a cell sorted from its multi-unit activity. IS indicates the isolation score of the sorted cell. (D) Peri-stimulus time histograms (PSTHs) and raster plots of 6 cells (single units) recorded in the different structures of BG, aligned to cue onset (time = 0). Time 2 and 8 s indicate outcome delivery in the immediate and delayed outcome conditions, respectively. PSTHs were built by summing activity across trials at a 1-ms resolution and then smoothing with a Gaussian window (SD = 20 ms). Each line of dots in the raster plots corresponds to activity during a trial and each dot represents a single spike. Color code indicates trial type according to outcome: appetitive trials in blue, neutral trials in green and aversive trials in red.
Figure 3
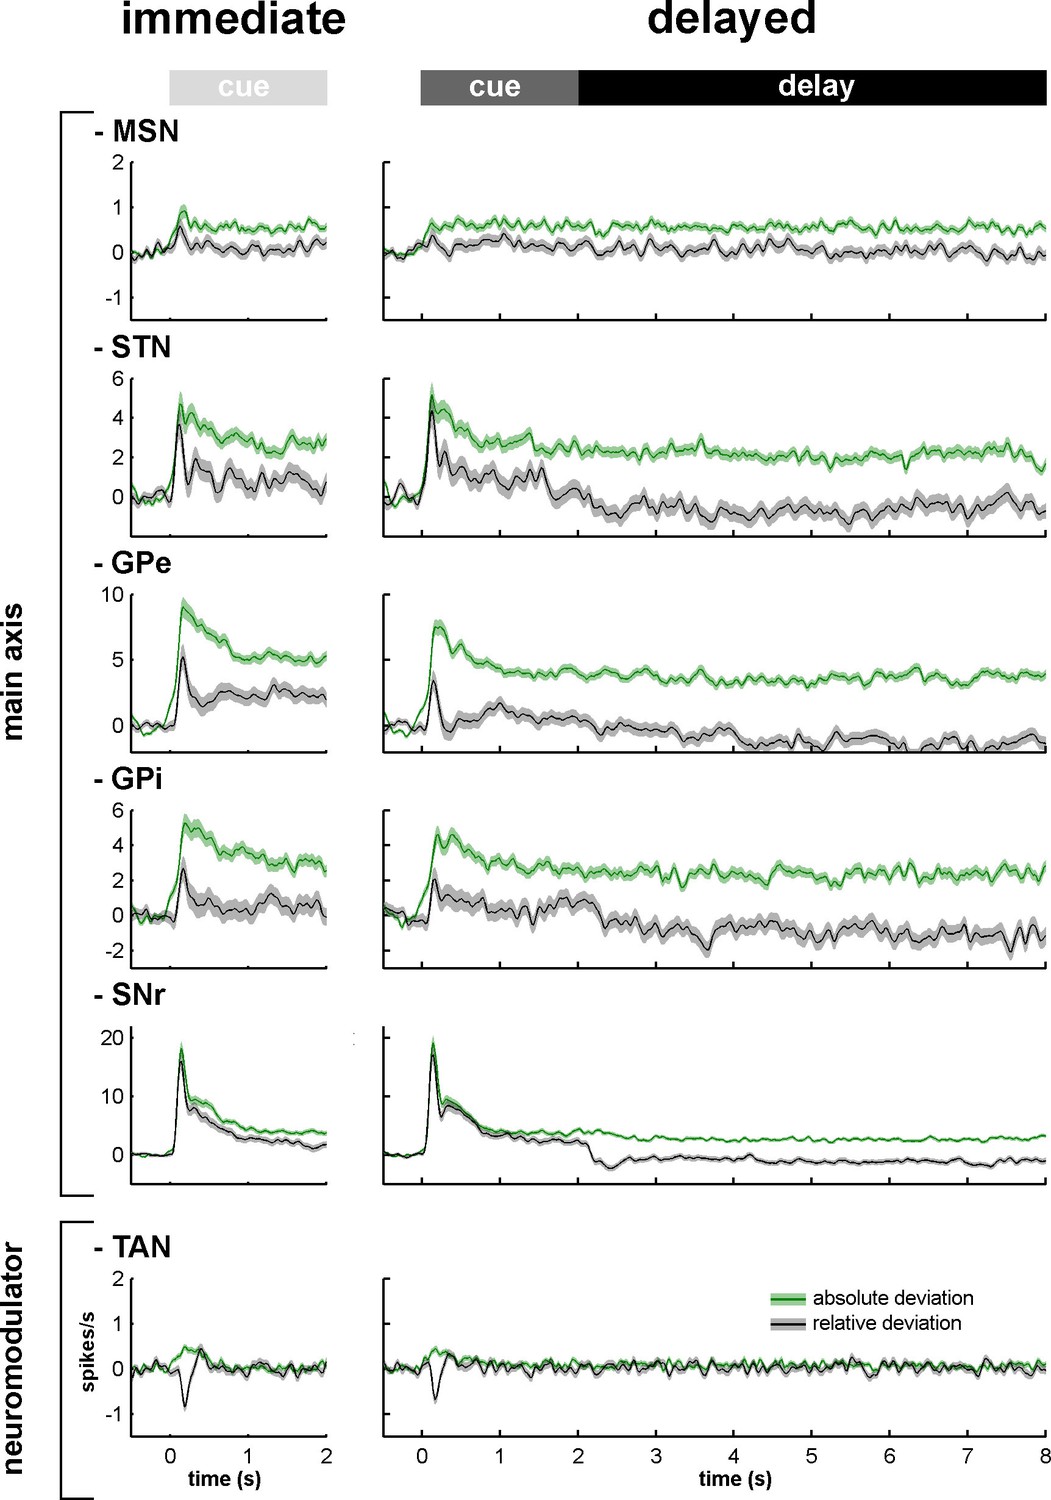
Relative and absolute population responses to the task behavioral events.
The response of a single neuron to the cue was calculated as the relative or absolute deviation from the baseline of the firing rate. The baseline firing rate was calculated during the 500 ms prior to cue onset. For each condition (immediate/delayed), each neuron was tested three times (appetitive, neutral and aversive trials). Relative (black) and absolute (green) population responses to the cue were defined as the average of the relative or absolute responses of all neurons of the same structure, respectively. The shaded areas mark SEMs.
Figure 4
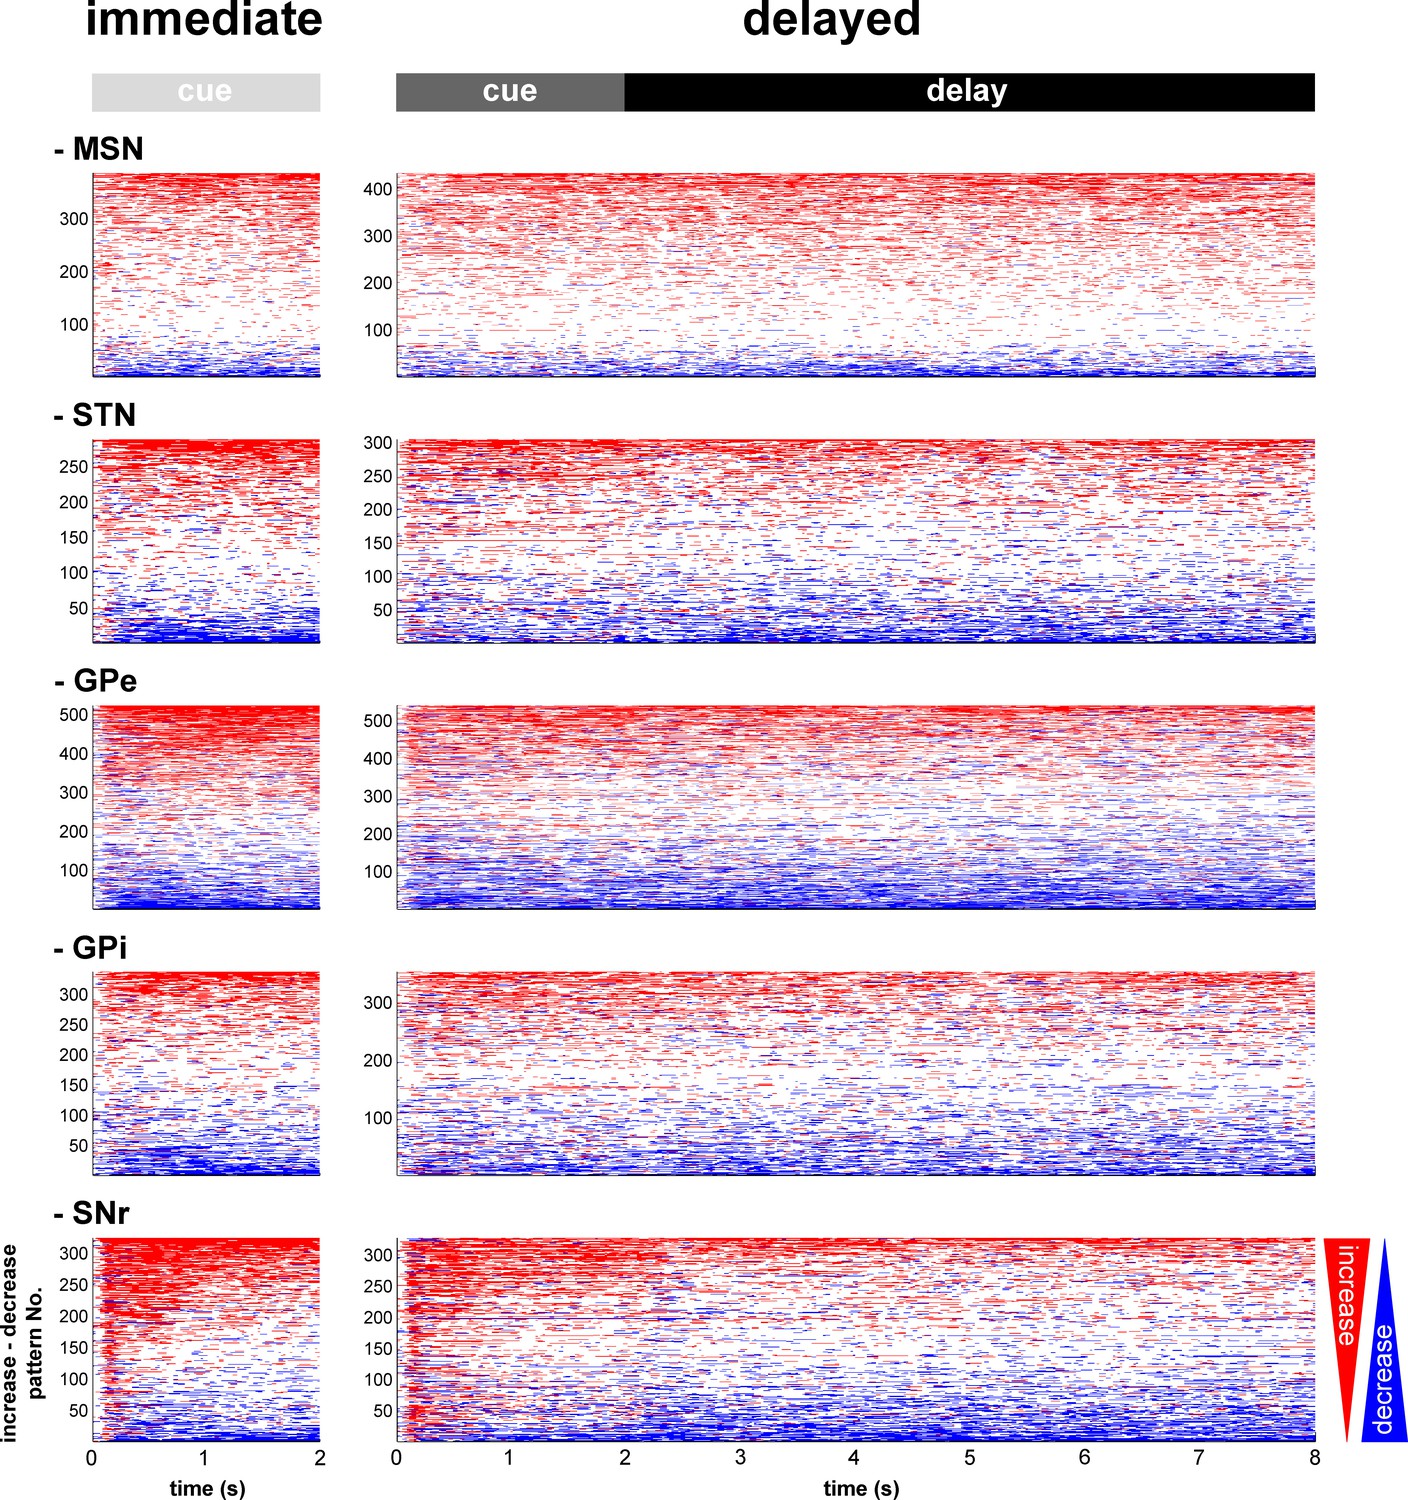
Temporal patterns of increases and decreases in activity of the BG neuronal assemblies.
In the (red/blue) surface plot, each row represents the time course of increases (red) and decreases (blue) in activity of a single neuron from cue onset to outcome delivery. Only modulated neurons are displayed. A neuron was considered modulated if at least one responsive bin was detected past the cue onset (for each neuronal assembly, >80% of the neurons were modulated whatever the cue value, in both conditions). The temporal patterns of increases and decreases in activity are ordered such that modulatory activities consisting of longer increases are at the top and ones consisting of longer decreases are at the bottom.
Figure 5

The BG main axis exhibits persistent modulations of activity.
For each neuronal assembly of the BG main axis, the black histograms (left) represent the fraction of responsive neurons (in the appetitive, neutral and aversive trials) at each time bin (20 ms) from cue onset to outcome delivery in both conditions. The bar plot (right) depicts the mean fraction of responsive neurons (average of the fractions of responsive neurons over a task period) in the different task periods (cue period of the immediate condition and cue and delay periods of the delayed condition) compared to the mean fraction of responsive neurons in the cue period of the immediate condition.
-
Figure 5—source data 1
Fraction of responsive neurons during the different task periods.
- https://doi.org/10.7554/eLife.16443.009
Figure 6 with 2 supplements
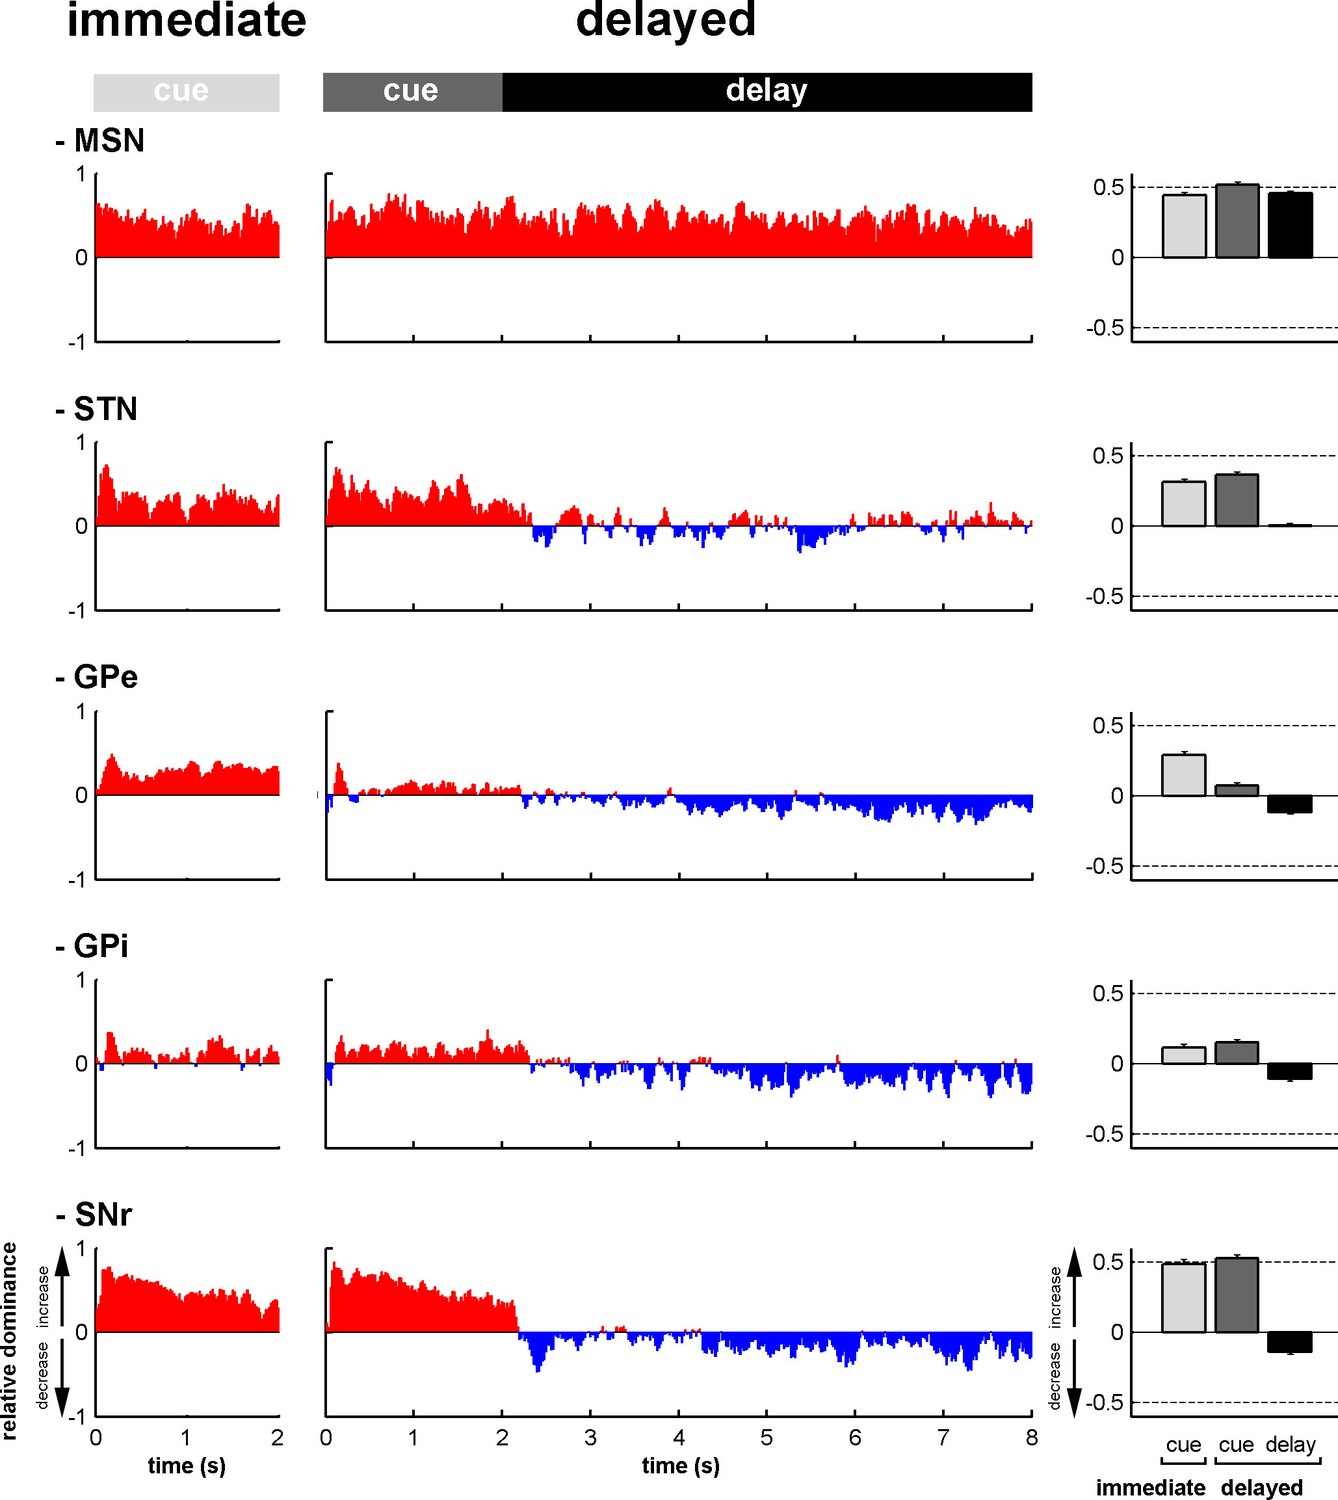
Modifications in subthalamic activity are concomitant with reversal of the increase/decrease balance of activity in the BG downstream structures.
Left, relative dominance of the increases and decreases in spiking activity (I/D balance) from cue onset (time = 0) to outcome delivery (time = 2 or 8 s in the immediate and delayed conditions, respectively), along the BG main axis. On the y-axis, as values approach 1, increases prevail over decreases and vice-versa as values approach -1. Values close to 0 indicate equal weight of increases and decreases. Right, the mean value of the I/D balance for the different task periods in each neuronal assembly. Error bars represent SEMs.
-
Figure 6—source data 1
Increase/decrease balance of activity during the different task periods.
- https://doi.org/10.7554/eLife.16443.011
Figure 6—figure supplement 1
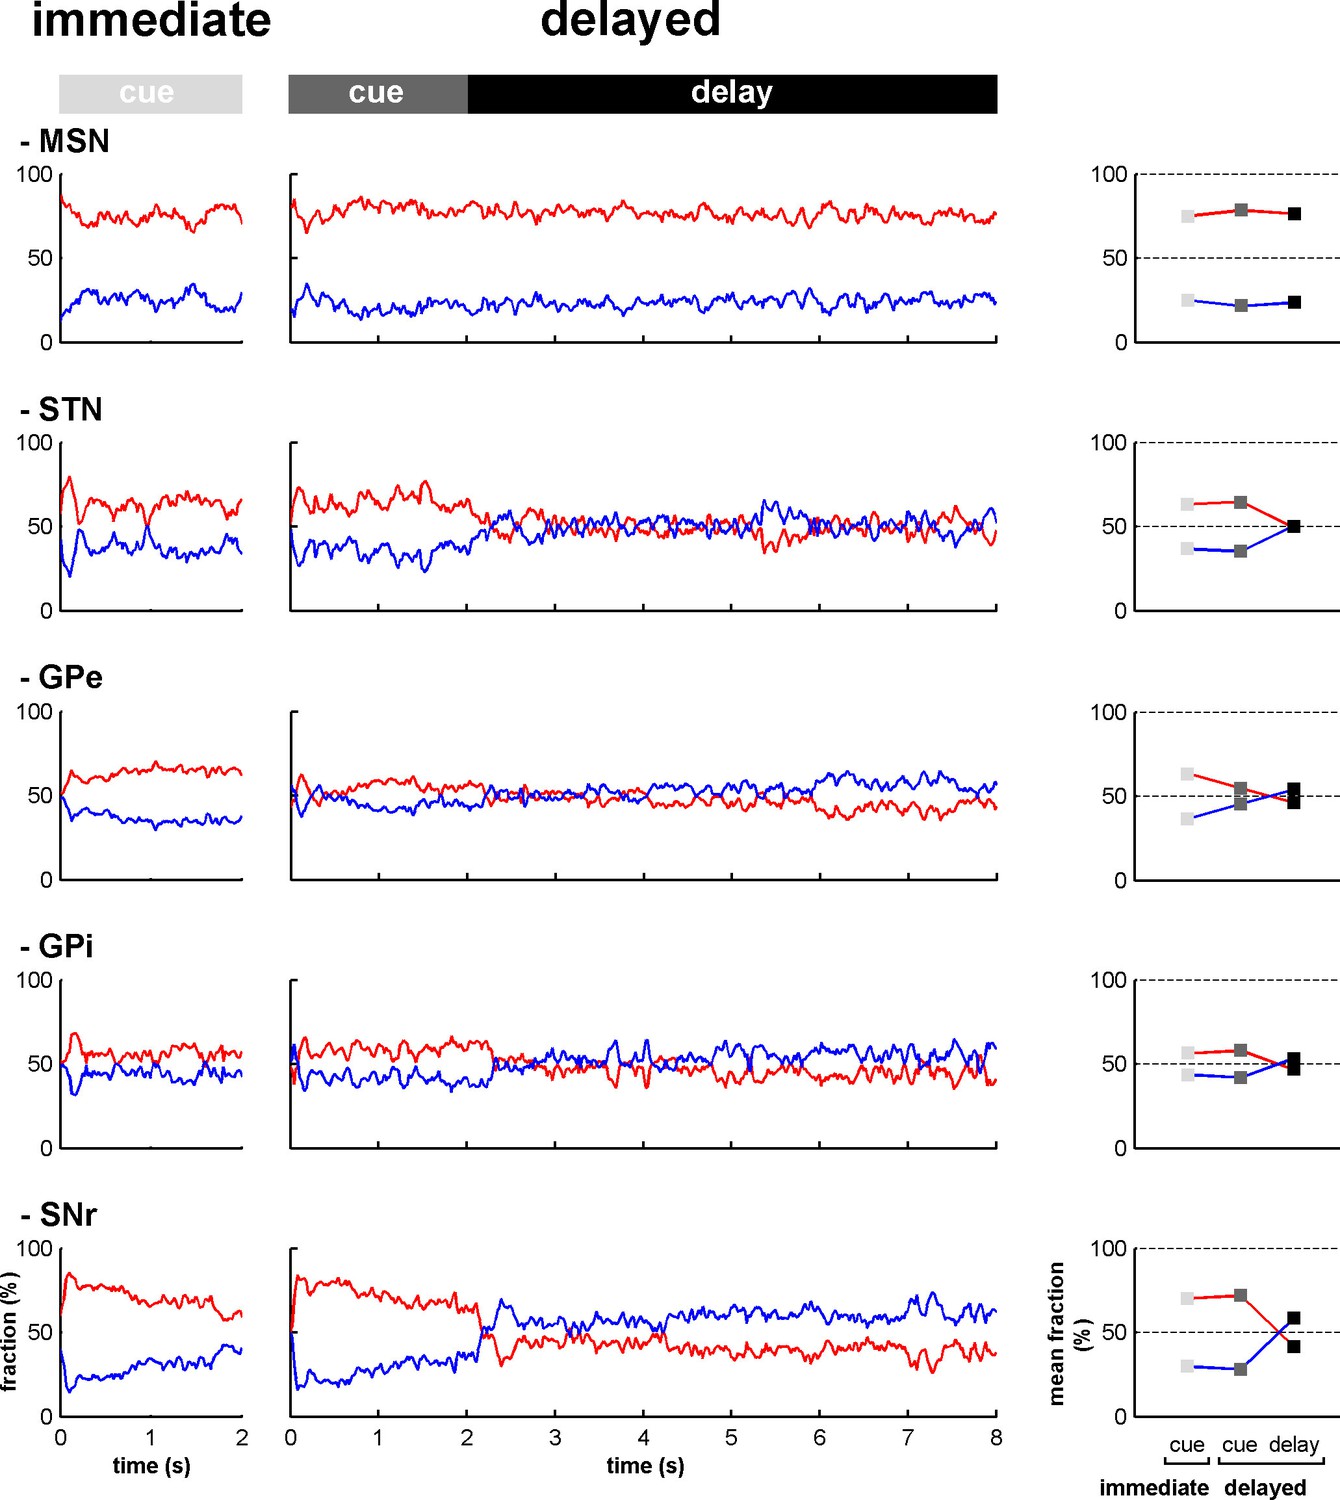
Fraction of increases and decreases in activity along the BG main axis.
Left, fractions of increases (red) and decreases (blue) in activity out of the total number of responsive neurons at each time bin (20 ms) from cue onset to outcome delivery in the immediate and delayed task conditions. Right, mean fraction of increases and decreases in activity in the different task periods. Error bars (difficult to see because of their small size) represent SEMs.
Figure 6—figure supplement 2
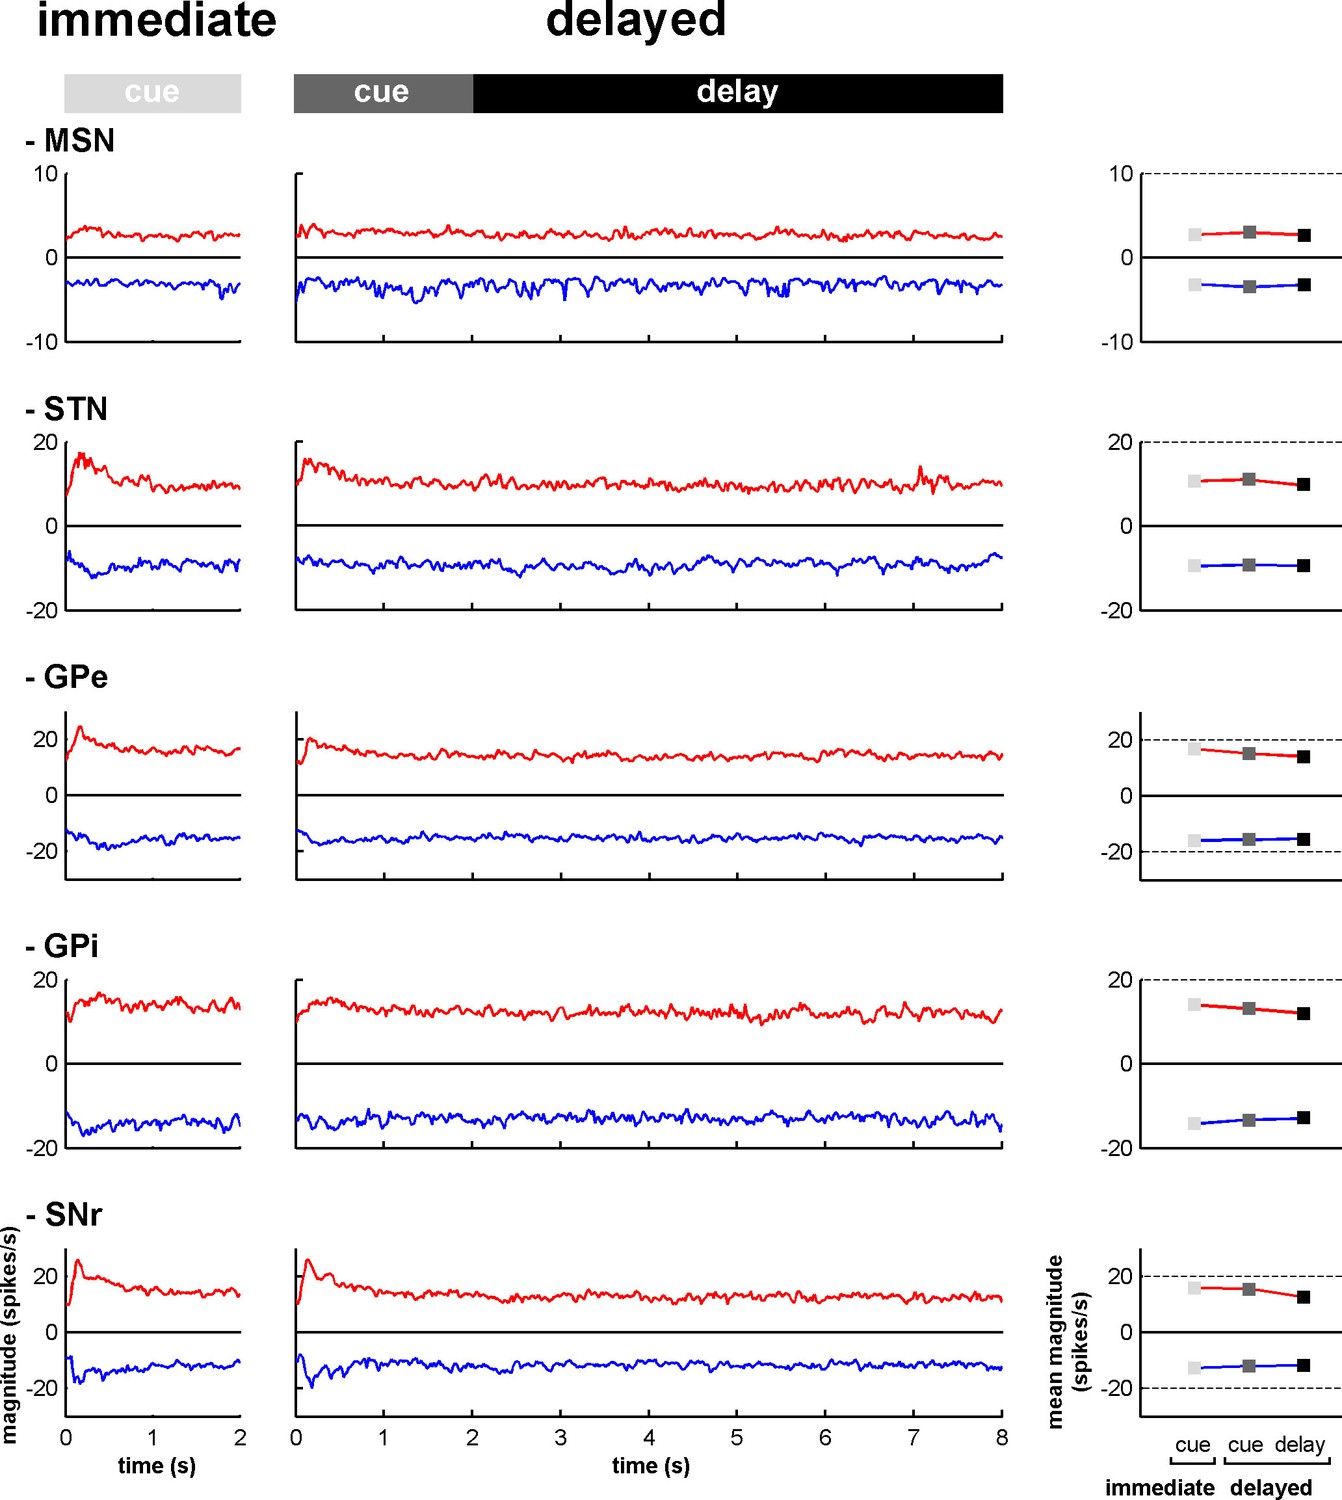
Magnitude of increases and decreases in activity along the BG main axis.
Left, magnitudes of the modulations in activity (in spikes/s) for the neurons exhibiting increases (red) and decreases (blue) in activity (compared to the baseline firing rate calculated during the 500 ms prior to cue onset) at each time bin (20 ms) from cue onset to outcome delivery in the immediate and delayed task conditions. Right, mean magnitude of increases and decreases in activity in the different task periods. Same conventions as in Figure 6—figure supplement 1.
Figure 7
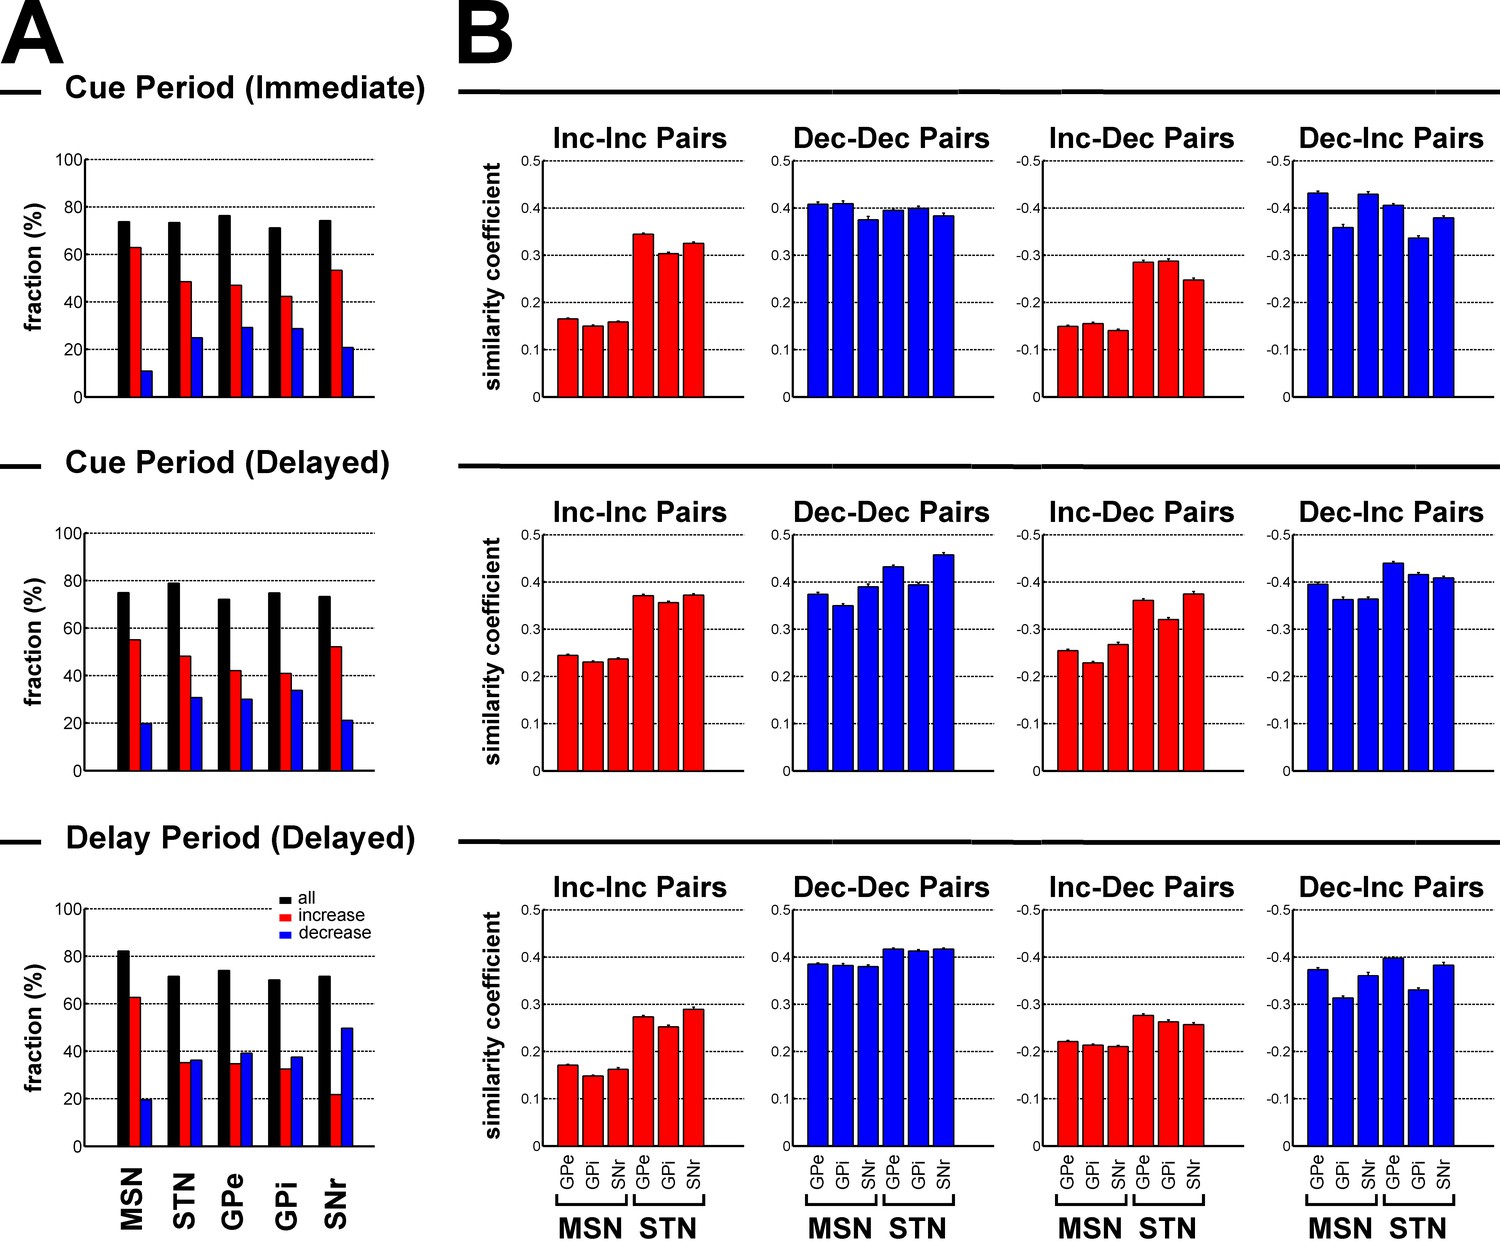
Subthalamic, not striatal, activity fluctuations correlate with modulations in BG downstream activity.
(A) Fraction of neuronal responses depending on their principal polarity along the BG main axis for the different task periods. The sum of the fractions of increases (red) and decreases (blue) is shown in black. (B) Mean similarity coefficient of the neuronal responses of striatal (MSN) or subthalamic - BG downstream neuron pairs exhibiting similar (Increase-Increase or Decrease-Decrease pairs) and opposite (Increase-Decrease or Decrease-Increase pairs) polarity, for the different task periods. The similarity coefficient ranges from −1 (i.e., opposite neuronal activity) to +1 (i.e. same neuronal activity).
Figure 8
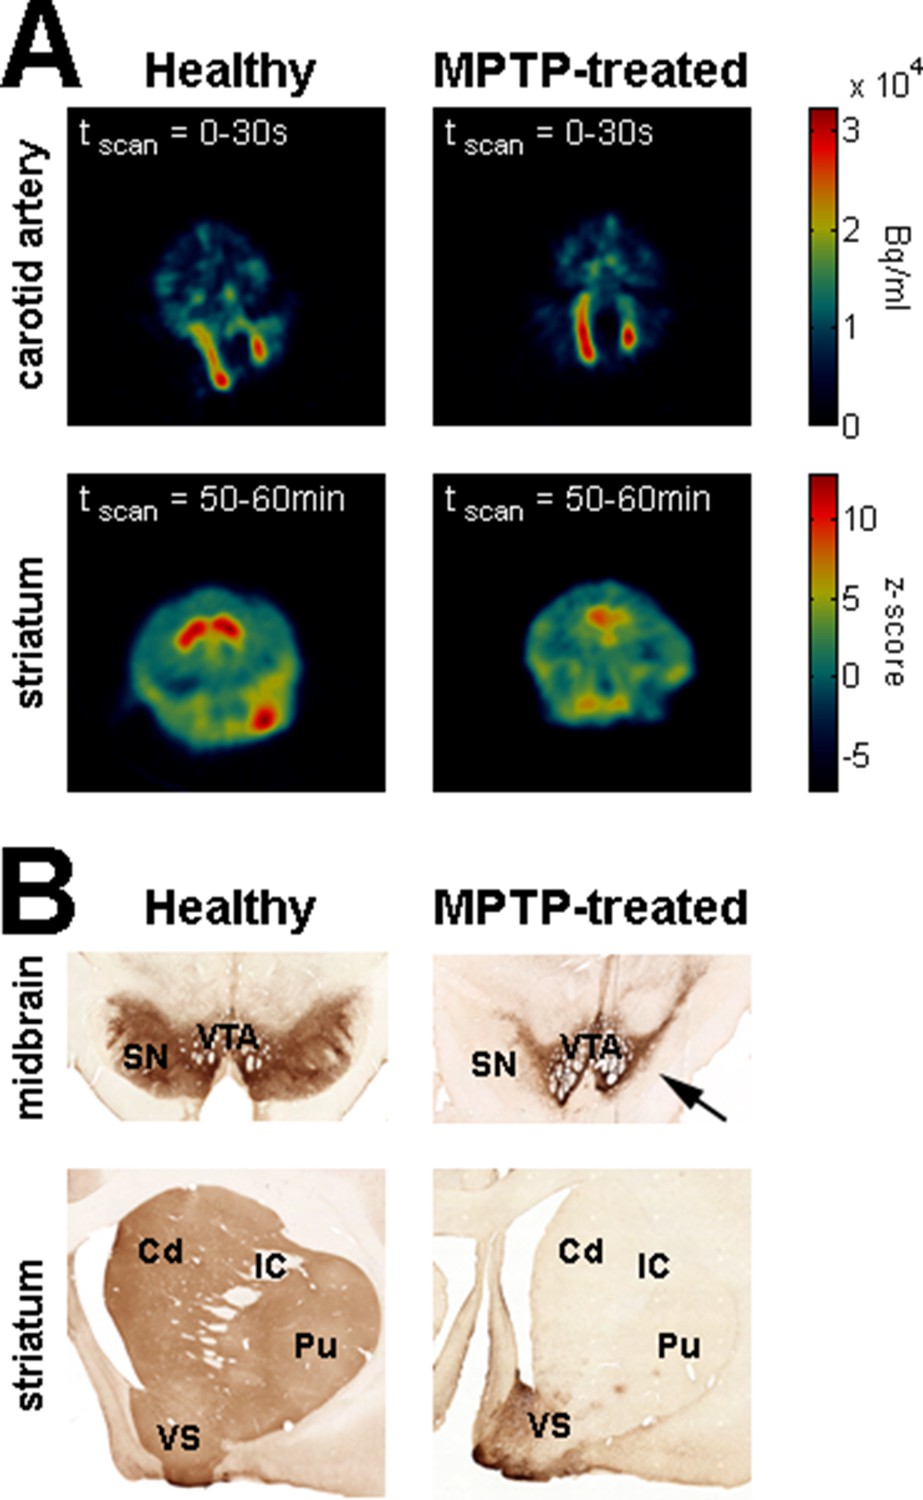
Dopamine depletion assessment in parkinsonism.
(A) Dynamic positron emission tomography (PET) of healthy monkey's brain (left) and MPTP-treated monkey's brain (Monkey K, right). The top panels are PET images showing the regional distribution of F-18 FDOPA at the carotid level during the first 30 s following the injection of the radioligand. The color bar (top panels) indicates the radioactivity concentration in Bq/ml. The bottom panels are PET images (acquired from 50 to 60 min after the injection of the radioligand) showing the regional distribution of F-18 FDOPA at the striatal level. Radioactivity concentration was Z-normalized, using the radioactivity concentration in the region of interest (ROI) for the cerebellum (i.e., region of non-specific F-18 FDOPA uptake). The color bar (bottom panels) indicates the relative radioactivity concentration in z-score. (B) Photomicrographs of tyrosine hydroxylase (TH) staining demonstrating the loss of the midbrain dopaminergic neurons of the ventral tier of the substantia nigra compacta in the MPTP-treated monkey (Monkey S, right) compared with a healthy animal (left). The top and bottom photomicrographs illustrate the midbrain and (rostral) striatum levels, respectively. After MPTP intoxication, TH-positive cells were lost in the ventral tier of the substantia nigra compacta (see arrow) and relatively spared in the ventral tegmental area. Note the lack of TH-positive staining in the dorsal striatum (caudate nucleus and putamen) compared to the ventral striatum (particularly the shell of nucleus accumbens) in the MPTP-treated monkey. Cd: caudate nucleus; IC: internal capsule; Pu: putamen; SN: substantia nigra; VTA: ventral tegmental area.
Figure 9
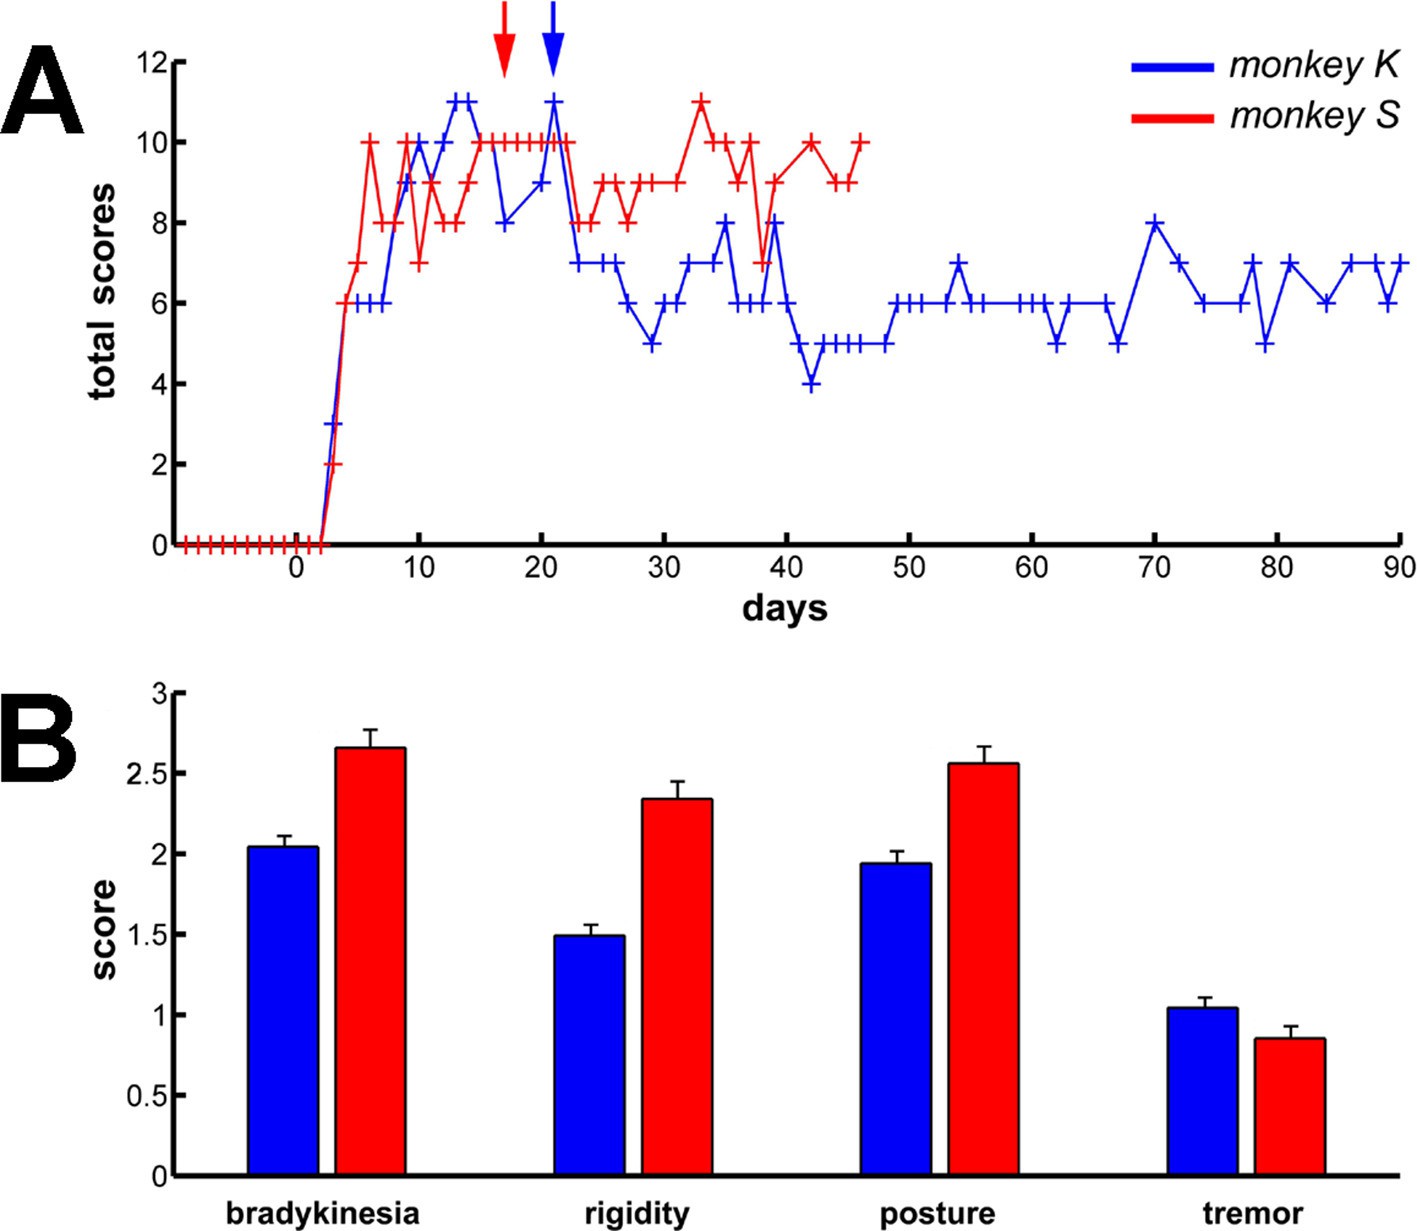
Long term and persistent parkinsonian motor symptoms following MPTP intoxication.
(A) Evolution of the sum of the scores of the major parkinsonian motor symptoms (bradykinesia, rigidity, posture and tremor) in each monkey before and after MPTP intoxication, up to the completion of the recordings. Day 0 indicates the first MPTP injection. Arrows mark the first day of dopamine-replacement therapy for each monkey. After initiation of dopamine-replacement therapy, scoring of the parkinsonian motor symptoms was made off dopaminergic medication (overnight washout >12 hr). The level of parkinsonism was assessed by using a primate parkinsonism scale that rates each motor parkinsonian symptom (bradykinesia, rigidity, posture and tremor) from 0 (normal) to 3 (severe). Hence, the minimum score is 0 and the maximum is 12. (B) Mean scores for the four motor symptoms (ranges from 0-normal to 3-severe) during the complete recording period in each MPTP-treated monkey. Error bars represent SEMs.
Figure 10
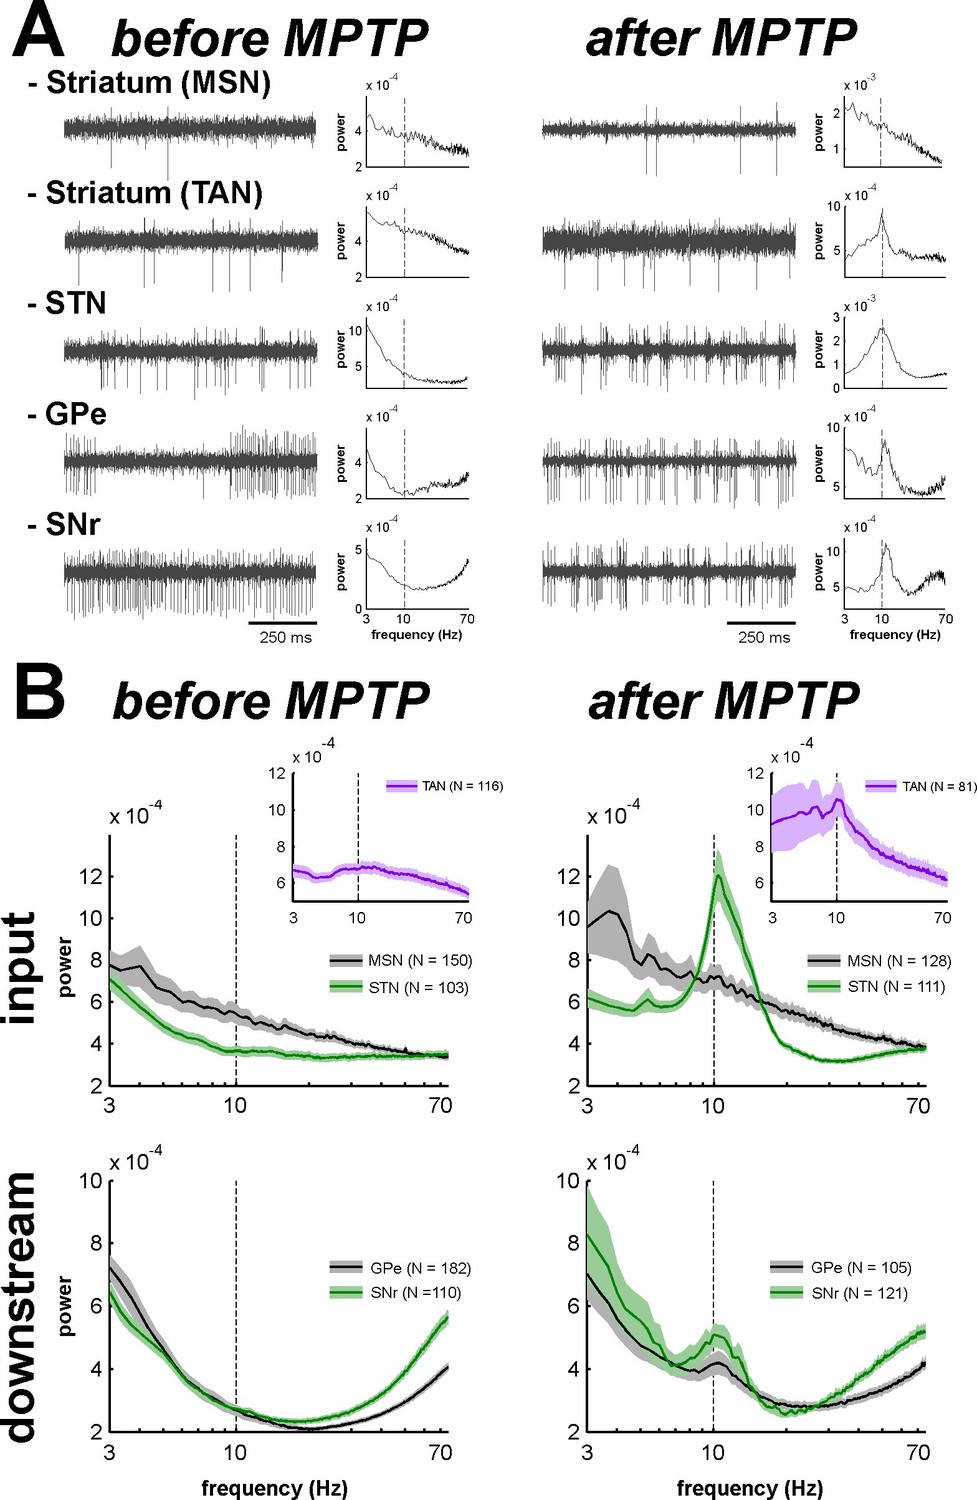
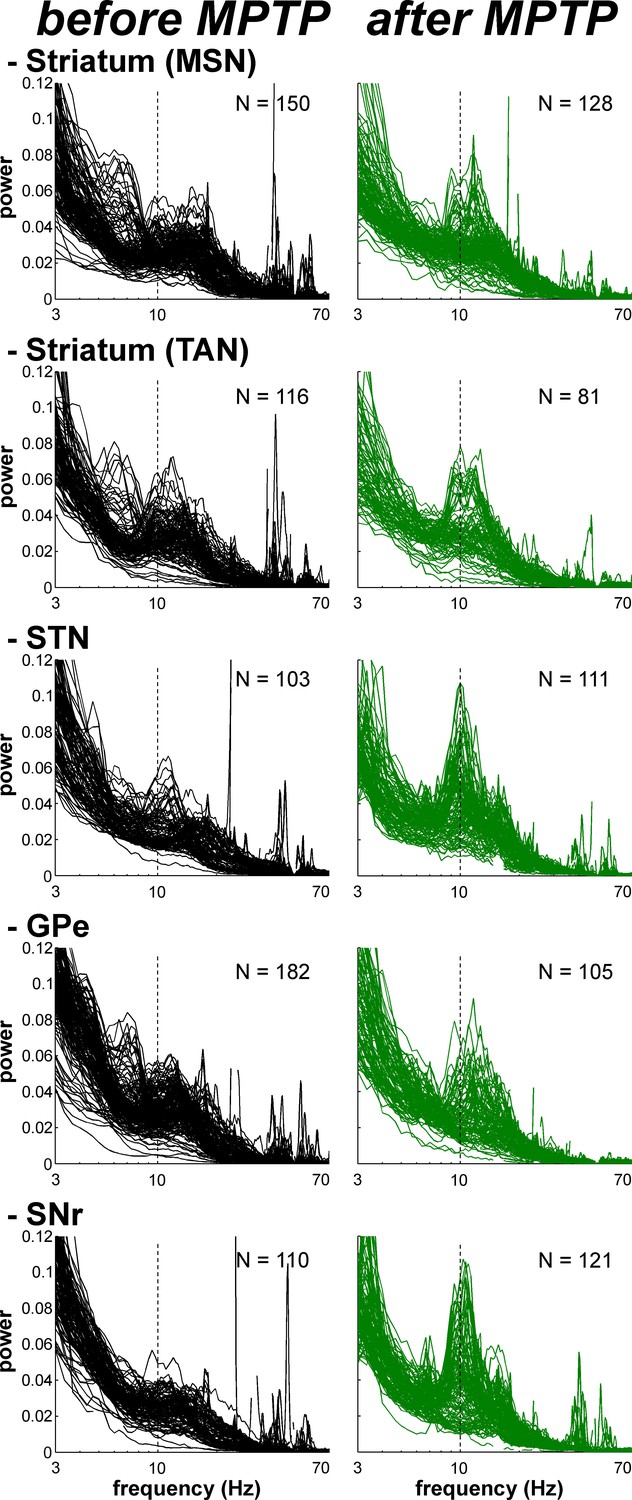
Abnormal oscillatory spiking activity is not shared by all BG neuronal components in parkinsonism.
(A) Examples of 1 s traces of multi-unit activity recorded in the vicinity of an isolated neuron (striatal MSN, striatal TAN, STN, GPe and SNr neurons) in the normal (before MPTP, left) and parkinsonian (after MPTP, right) state and PSDs of the respective multi-unit activity. Multi-unit activity was online filtered between 250 and 6000 Hz. PSD was calculated over the complete recording span of the multi-unit activity constrained by the period of stable discharge rate and satisfactory isolation quality of the isolated neuron. Abscissas of the PSDs are in log scale. (B) Average PSDs of activity of MSN, STN (BG input stage, top panels), GPe and SNr (BG downstream stages, bottom panels) recordings, before and after MPTP intoxication (left and right, respectively). Average PSD of activity of striatal TANs is in the inset of the top panels. Abscissas are in log scale. The shaded areas mark SEMs. N is the number of recording sites averaged.
-
Figure 10—source data 1
Power spectral densities of the multi-unit activity before and after MPTP.
- https://doi.org/10.7554/eLife.16443.018
Figure 11

Mean PSD peak value in the 8–15 Hz range for the BG neuronal components before and after MPTP intoxication.
Mean PSD peak value in the 8–15 Hz range is defined as the average of the PSD peak values in the 8–15 Hz range (Z normalized) of all the PSDs. Error bars represent SEMs.
Figure 12
Exaggerated 8–15 Hz oscillations of LFPs within all structures of the BG network in parkinsonism.
Superimposed PSDs of the LFPs recorded in the different BG nuclei (Striatum, STN, GPe and SNr) in the normal (before MPTP) and parkinsonian (after MPTP) state. A custom-made artifact removal procedure was used to clean sharp peak artifacts recorded by the high impedance microelectrodes. Abscissas are in log scale. N is the number of recording sites.
-
Figure 12—source code 1
Custom-made artifact removal procedure.
- https://doi.org/10.7554/eLife.16443.021
-
Figure 12—source data 1
Power spectral densities of the local field potential before and after MPTP.
- https://doi.org/10.7554/eLife.16443.022
Figure 13
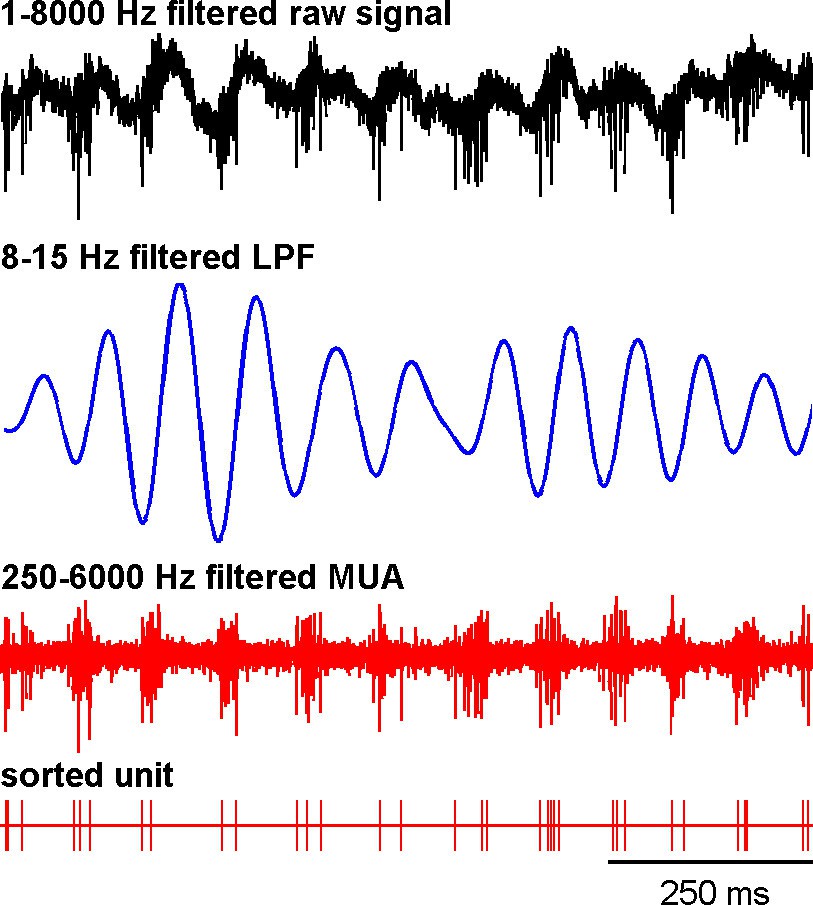
Recording of the subthalamic spiking and LFP activity after MPTP intoxication.
The traces reflect the different filter properties applied to the signal recorded by the electrode. Upper trace depicts the broad (1–8000 Hz) band-pass filtered trace. The second trace is band-pass filtered at the low beta range (8–15 Hz) and depicts LFP oscillations. In the third trace, a 250–6000 Hz band-pass filter is used and reveals the multi-unit activity (MUA) that exhibits a periodic oscillatory pattern synchronized to the 8–15 Hz LFP oscillation. Below the 250–6000 Hz filtered MUA is the digital display of the spikes detected online from the MUA using the online template-matching algorithm.
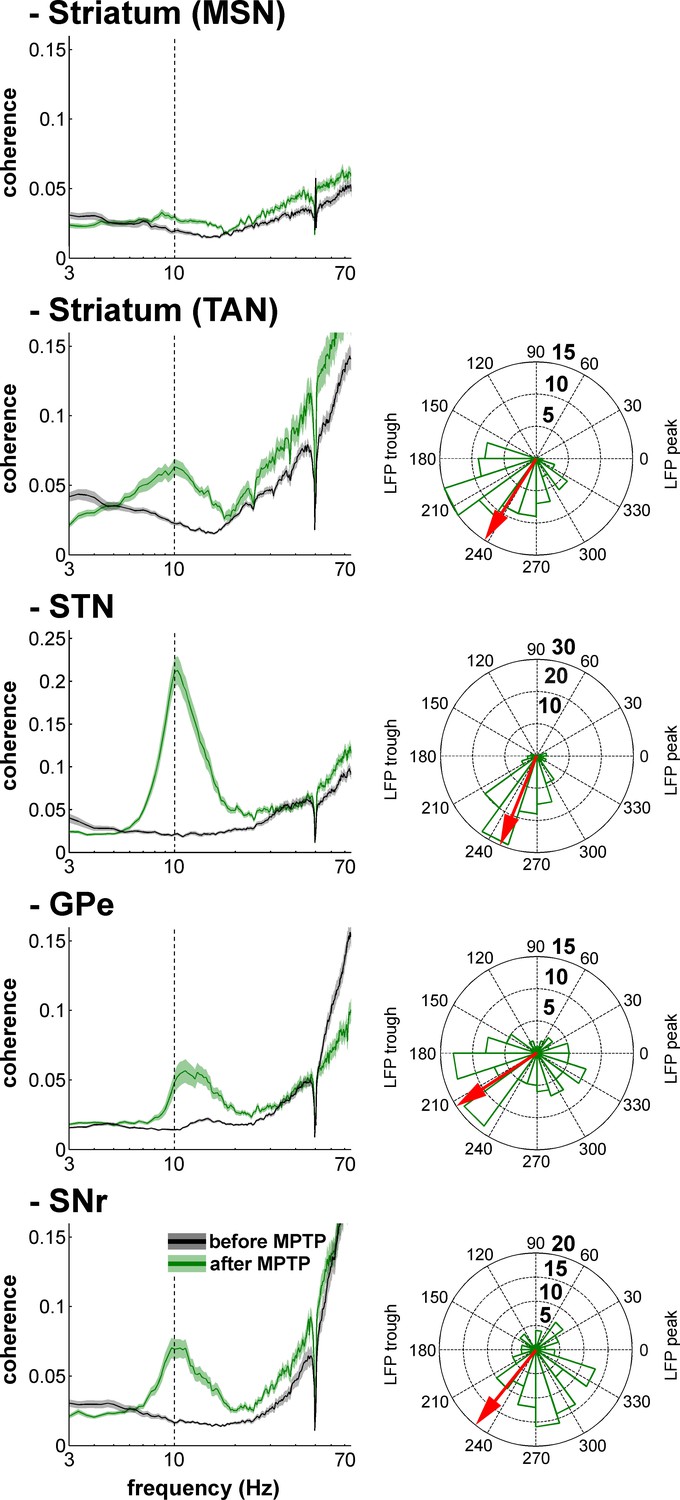
Figure 14 with 1 supplement

Single-unit spiking activity and LFP synchronization for the BG neuronal assemblies before and after MPTP intoxication.
Left, average spike-field coherences between the spike train of the neurons (single-unit spiking activity) and the LFPs recorded in their vicinity before and after MPTP. Abscissas are in log scale. Right, phase histograms of the phases of the single-unit spiking activity relative to the LFP at the frequency of coherence peak values calculated in the 8–15 Hz range, after MPTP intoxication. The red arrows represent the mean phase of the spiking activity relative to the LFP peak (phase = 0 degree). Numbers in bold indicate the numbers of spike-LFP pairs. Given the absence of spike-field coherence for the MSNs after MPTP intoxication, the phase histogram of the MSN spike-LFP pairs was not calculated.
-
Figure 14—source data 1
Spike-LFP synchronization before and after MPTP.
- https://doi.org/10.7554/eLife.16443.025
Figure 14—figure supplement 1
Multi-unit spiking activity and LFP synchronization for the BG neuronal assemblies before and after MPTP intoxication.
Same convention as Figure 14, except that the spiking activity corresponds to multi-unit activity rather than single-unit activity.
Figure 15 with 1 supplement
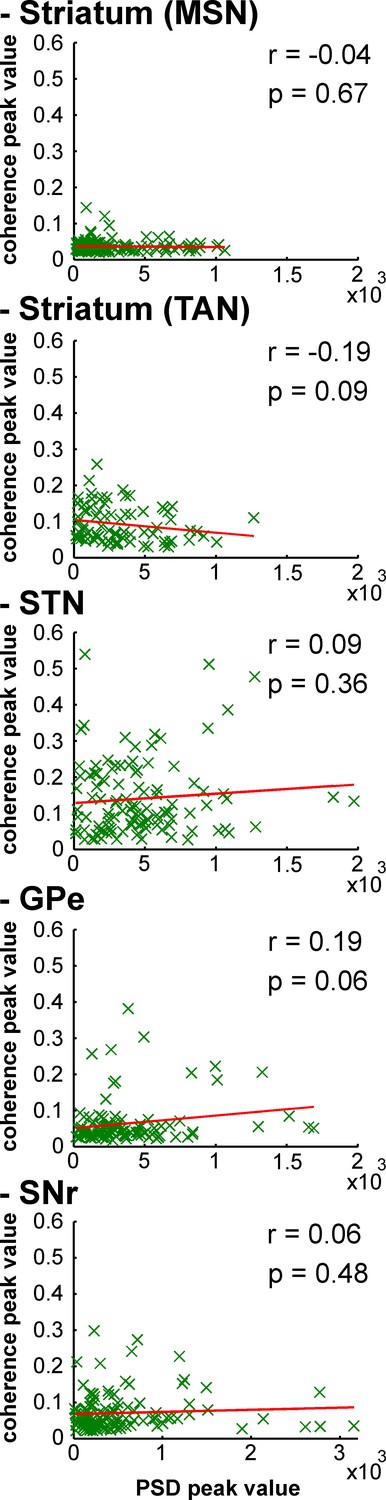
Strength of LFP oscillations is not related to the degree of synchronization between single-unit spiking activity and LFP oscillations along the BG network after MPTP intoxication.
Scatter plots of the 8–15 Hz LFP PSD peak values and the 8–15 Hz spike-field coherence peak values for the different BG neuronal components. Red line represents the linear regression line between the LFP PSD peak values and the spike-field coherence peak values. r is the Pearson correlation coefficient and p indicates the probability that r = 0.
Figure 15—figure supplement 1
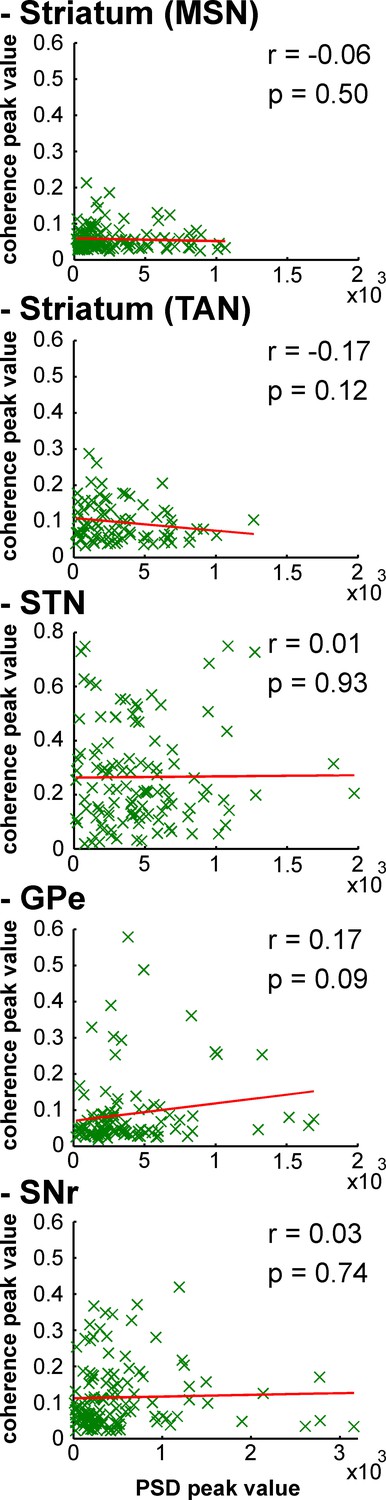
Strength of LFP oscillations is not related to the degree of synchronization between multi-unit spiking activity and LFP oscillations along the BG network after MPTP intoxication.
Same convention as Figure 15, except that multi-unit spiking activity, rather than single-unit spiking activity, was used to calculate the spike-field coherence.
Figure 16

Population spike-triggered averages of LFP after MPTP intoxication show larger fluctuations around spike times of STN, BG downstream neurons and striatal TANs, but not around spike times of striatal MSNs.
For each BG neuronal assembly, population STA LFP was defined as the average of the STAs LFP of all neurons. After MPTP intoxication, STAs LFP were calculated before and after random dilution of the spike trains of the neurons. LFP was recorded in the vicinity of the neuron (i.e., spiking activity and LFP were recorded on the same electrode). Dashed vertical lines indicate the time of the spikes (time = 0). The shaded areas mark SEMs
Figure 17
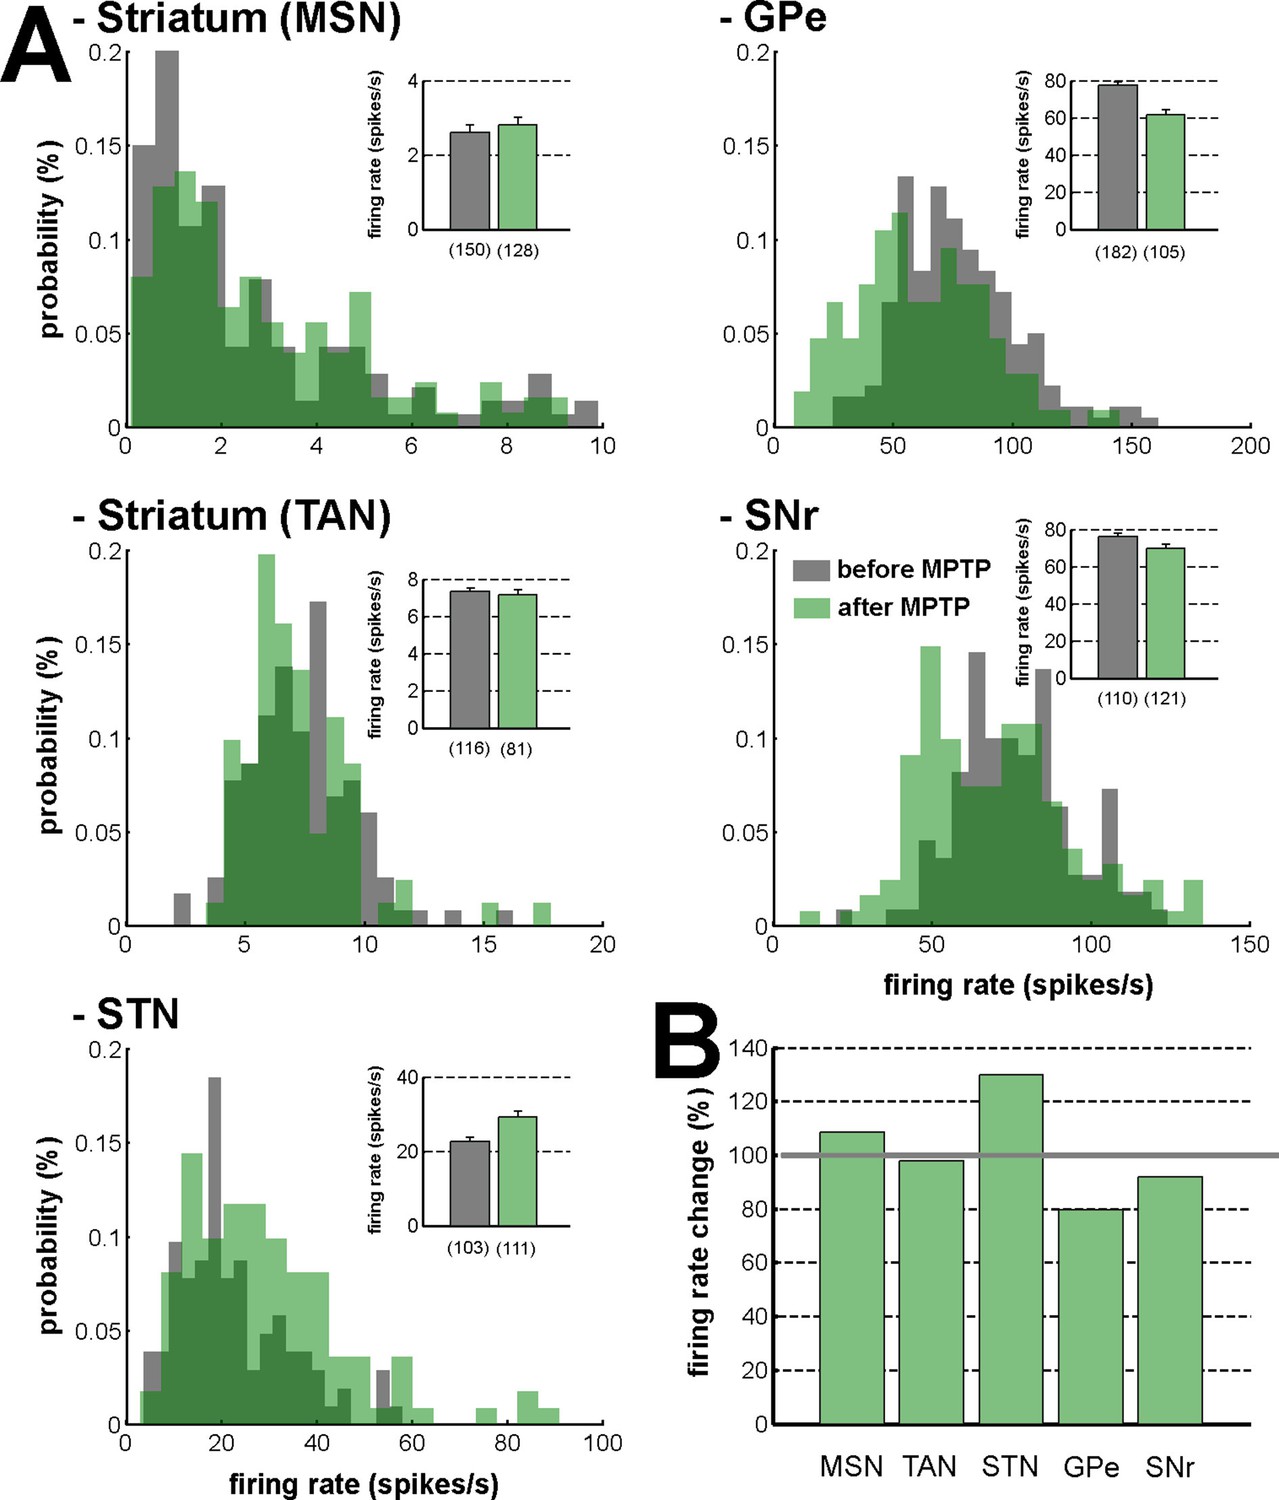
Firing rate in the BG network before and after MPTP intoxication.
(A) Distribution of the firing rate of the neuronal components of the BG network. Gray - before MPTP; light green - after MPTP; dark green - overlapping bins. Inset, mean firing rate before and after MPTP intoxication. Error bars represent SEMs. Numbers in parentheses indicate the number of neurons. (B) Percentage of change in the firing rate after MPTP intoxication, for the neuronal components of the BG network. Gray line (100%) represents the healthy (before MPTP) firing rate.
Author response image 1
Clustering analysis of MSN activity profiles in the immediate and delayed conditions.
https://doi.org/10.7554/eLife.16443.031Tables
Table 1
Neuronal database. N is the number of recorded neurons that passed inclusion criteria. The recording span represents the stable recording period (in seconds) for each neuron. The isolation score ranges from 0 to 1. The recording span and isolation score were averaged for each structure and state. Values are means ± standard deviation (SD). For each neuronal assembly, statistics were calculated and are presented for both monkeys.
| Neuronal assembly | before MPTP | after MPTP | ||||
|---|---|---|---|---|---|---|
| N | Recording span (s) | Isolation score | N | Recording span (s) | Isolation score | |
| striatum (MSN) | 150 | 1096.8 ± 564.8 | 0.85 ± 0.10 | 128 | 950.6 ± 616.1 | 0.85 ± 0.12 |
| striatum (TAN) | 116 | 1568.8 ± 907.6 | 0.89 ± 0.08 | 81 | 1217.8 ± 708.8 | 0.89 ± 0.09 |
| STN | 103 | 1080.0 ± 411.1 | 0.77 ± 0.12 | 111 | 780.0 ± 317.7 | 0.80 ± 0.12 |
| GPe | 182 | 1760.4 ± 978.2 | 0.91 ± 0.08 | 105 | 877.7 ± 332.7 | 0.91 ± 0.09 |
| GPi | 119 | 1437.0 ± 607.9 | 0.89 ± 0.08 | none | ||
| SNr | 110 | 1205.2 ± 366.4 | 0.90 ± 0.08 | 121 | 874.7 ± 445.4 | 0.90 ± 0.09 |
Download links
A two-part list of links to download the article, or parts of the article, in various formats.
Downloads (link to download the article as PDF)
Open citations (links to open the citations from this article in various online reference manager services)
Cite this article (links to download the citations from this article in formats compatible with various reference manager tools)
Subthalamic, not striatal, activity correlates with basal ganglia downstream activity in normal and parkinsonian monkeys
eLife 5:e16443.
https://doi.org/10.7554/eLife.16443


