Physical association between a novel plasma-membrane structure and centrosome orients cell division
- National Institute for Basic Biology, National Institutes of Natural Sciences, Japan
- Sorbonne Universités, UPMC Université Paris 06, CNRS, France
- National Institutes of Natural Sciences, Japan
- School of Life Science, The Graduate University for Advanced Studies, Japan
Figures
Figure 1

Ciona intestinalis epidermal cell mitosis and the posterior nuclear positioning prior to the final cell division.
(A) Representative epidermal cell divisions (white arrows) from the 10th to the 11th cell cycle in an embryo expressing PH-GFP/H2B-mCherry; frames are from Video 1. Elapsed time: 32'–43' shows the 10th cell division, while 150'–157' shows the 11th cell division. During this process, the embryo changes into a tadpole-shape consisting of a head and tail. Anterior: left. Dorsal: upper. Bar: 30 µm. (B, C) In the final mitotic division, ascidian epidermal cells do not divide following the Sachs’s and Herwig’s rules. (B) Rose diagram showing the angle of the cell division axis relative to the embryonic A-P axis in the 11th cell division. Following the 10th cell division, we selected daughter cells that were produced via an A-P oriented cell division with less than 30° of the cell division axis relative to the embryonic A-P axis and then measured their cell division angle at the 11th cell division. n = 95; cells from three embryos were used. (C) Rose diagram showing the angle of the cell division axis relative to the long axis of the cell in the last cell division. n = 160 cells from three embryos. (D) Representative frames of a 4D confocal dataset imaging epidermal cells of an embryo expressing PH-GFP/H2B-mCherry. Nuclei show a posteriorly biased positioning prior to M-phase. Numbered arrows indicate the same nucleus in the sequence. Time elapsed from the start of recording is shown in orange. Bar: 10 µm. (E) Bee-swarm plots indicating the nuclear position relative to the centre of the cell along the embryonic A-P axis, measured just before the breakdown of the nuclear membrane, in the 10th and 11th cell-division cycles. n = 106 cells each at the 10th and 11th division cycles from three embryos. Black lines show the average nuclear position relative to the centre of the cell (blue dotted line); the average positions were 0.18 and 1.0 µm toward the posterior side at the 10th and 11th division cycle, respectively. p-values were obtained using the Welch's t-test.
Figure 2
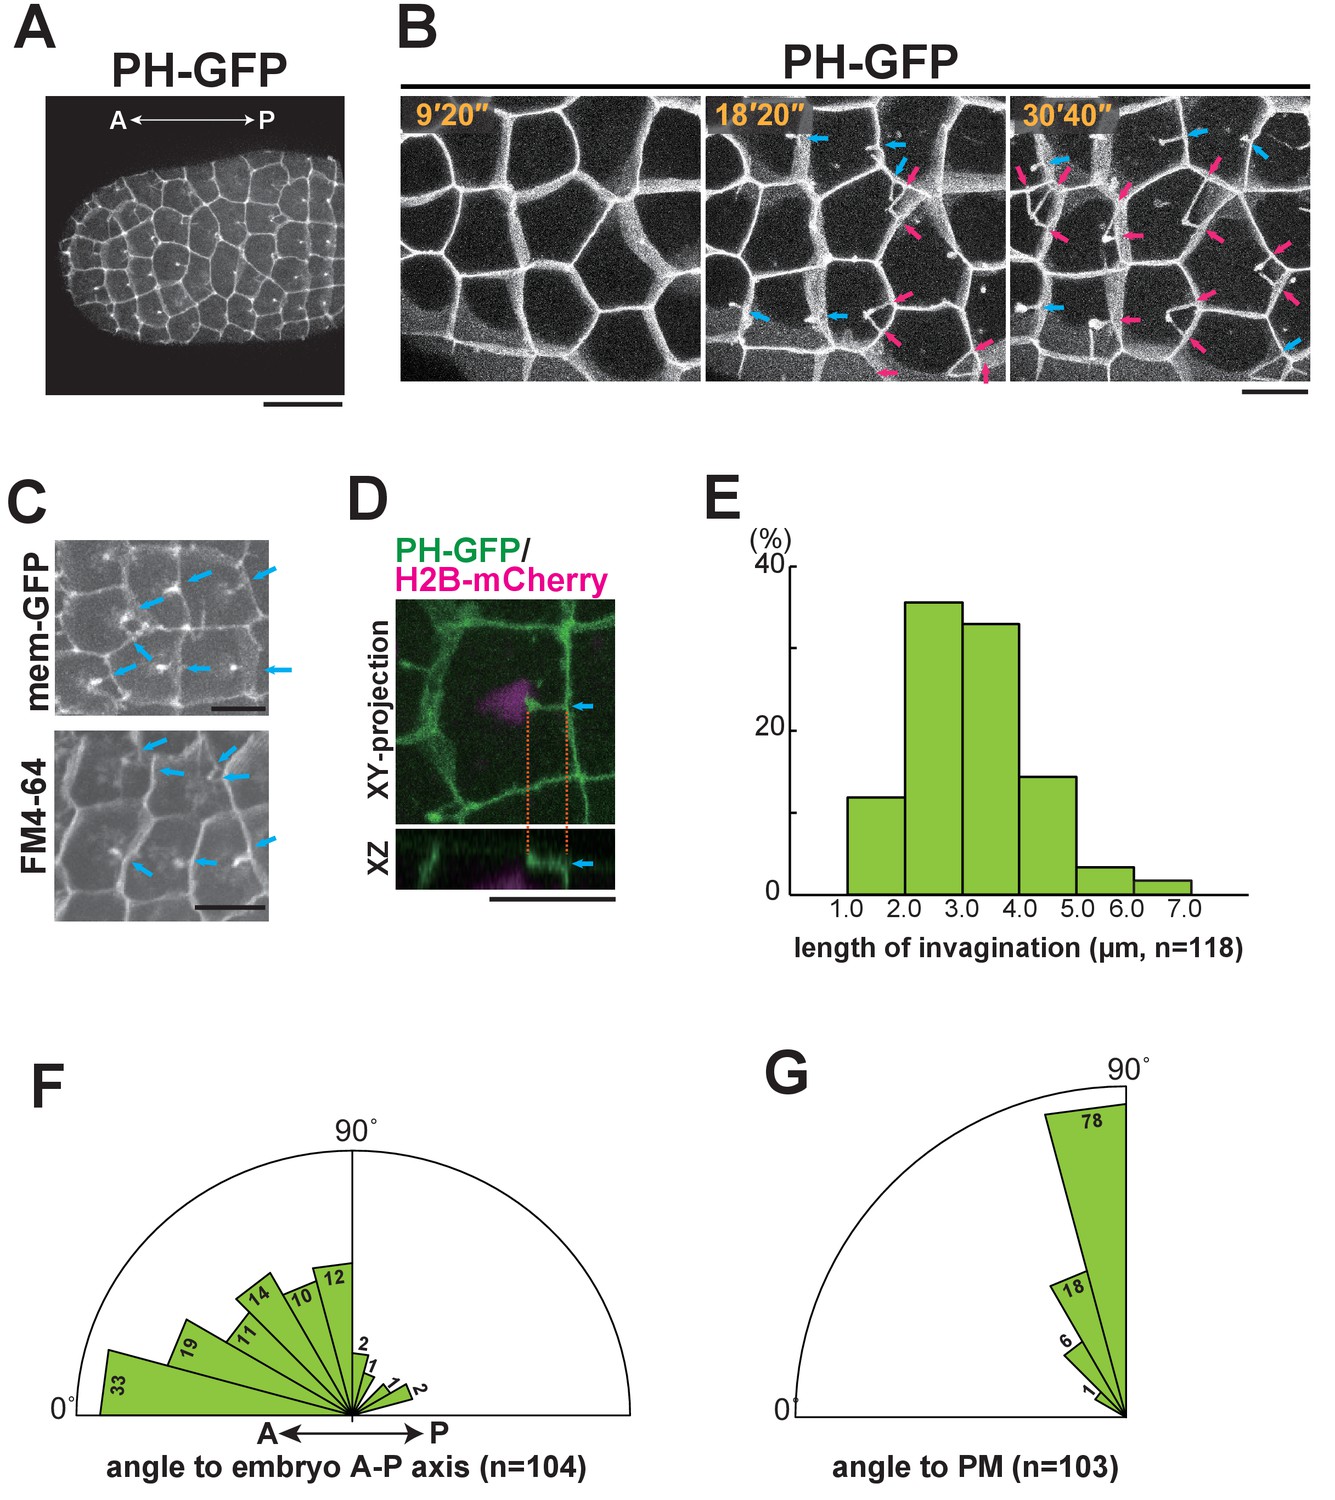
Characterisation of the invaginating membrane structure.
(A) Low-magnification image of epidermal cells in a normal Ciona intestinalis embryo expressing PH-GFP, during the 11th cell division cycle. A maximum-intensity projection image of the confocal stack is shown. Anterior: left; ventral side: facing. Black bar: 30 µm. (B) High-magnification images of epidermal cells in a normal embryo expressing PH-GFP, during the 11th cell-division cycle. Images are from Video 2; elapsed times are indicated. Anterior: left. Both blue and red arrows indicate membrane invaginations; red arrows show invaginations forming a wedge shape. (C) Membrane invaginations in epidermal cells in a membraneGFP-expressing embryo (upper panel) and a FM4-64 stained embryo (lower panel). Anterior: left; ventral: facing. Bars: 10 µm. Blue arrows: invaginations. (D) A membrane invagination formed near the apical cortex in an epidermal cell expressing PH-GFP/H2B-mCherry. XY-projection panel shows a maximum-intensity projection of the confocal stack; the YZ panel was reconstructed from the same confocal data set. Blue arrows: invaginations. Orange dotted lines indicate the same invagination in both panels. Bar: 10 µm. (E) Histogram showing the distribution of invagination length, calculated from confocal images. n = 118 invaginations counted from three embryos. (F) Rose diagram showing the angle of the invagination relative to the embryonic A–P axis. Almost all of the invaginations had an angle <90°, meaning they formed toward the anterior. n = 104; invaginations counted in three embryos. (G) Rose diagram showing the angle of invagination relative to the plasma membrane from which it arises, indicating that the invaginations extends perpendicular to the lateral membrane. n = 103 invaginations counted in three embryos.
Figure 3
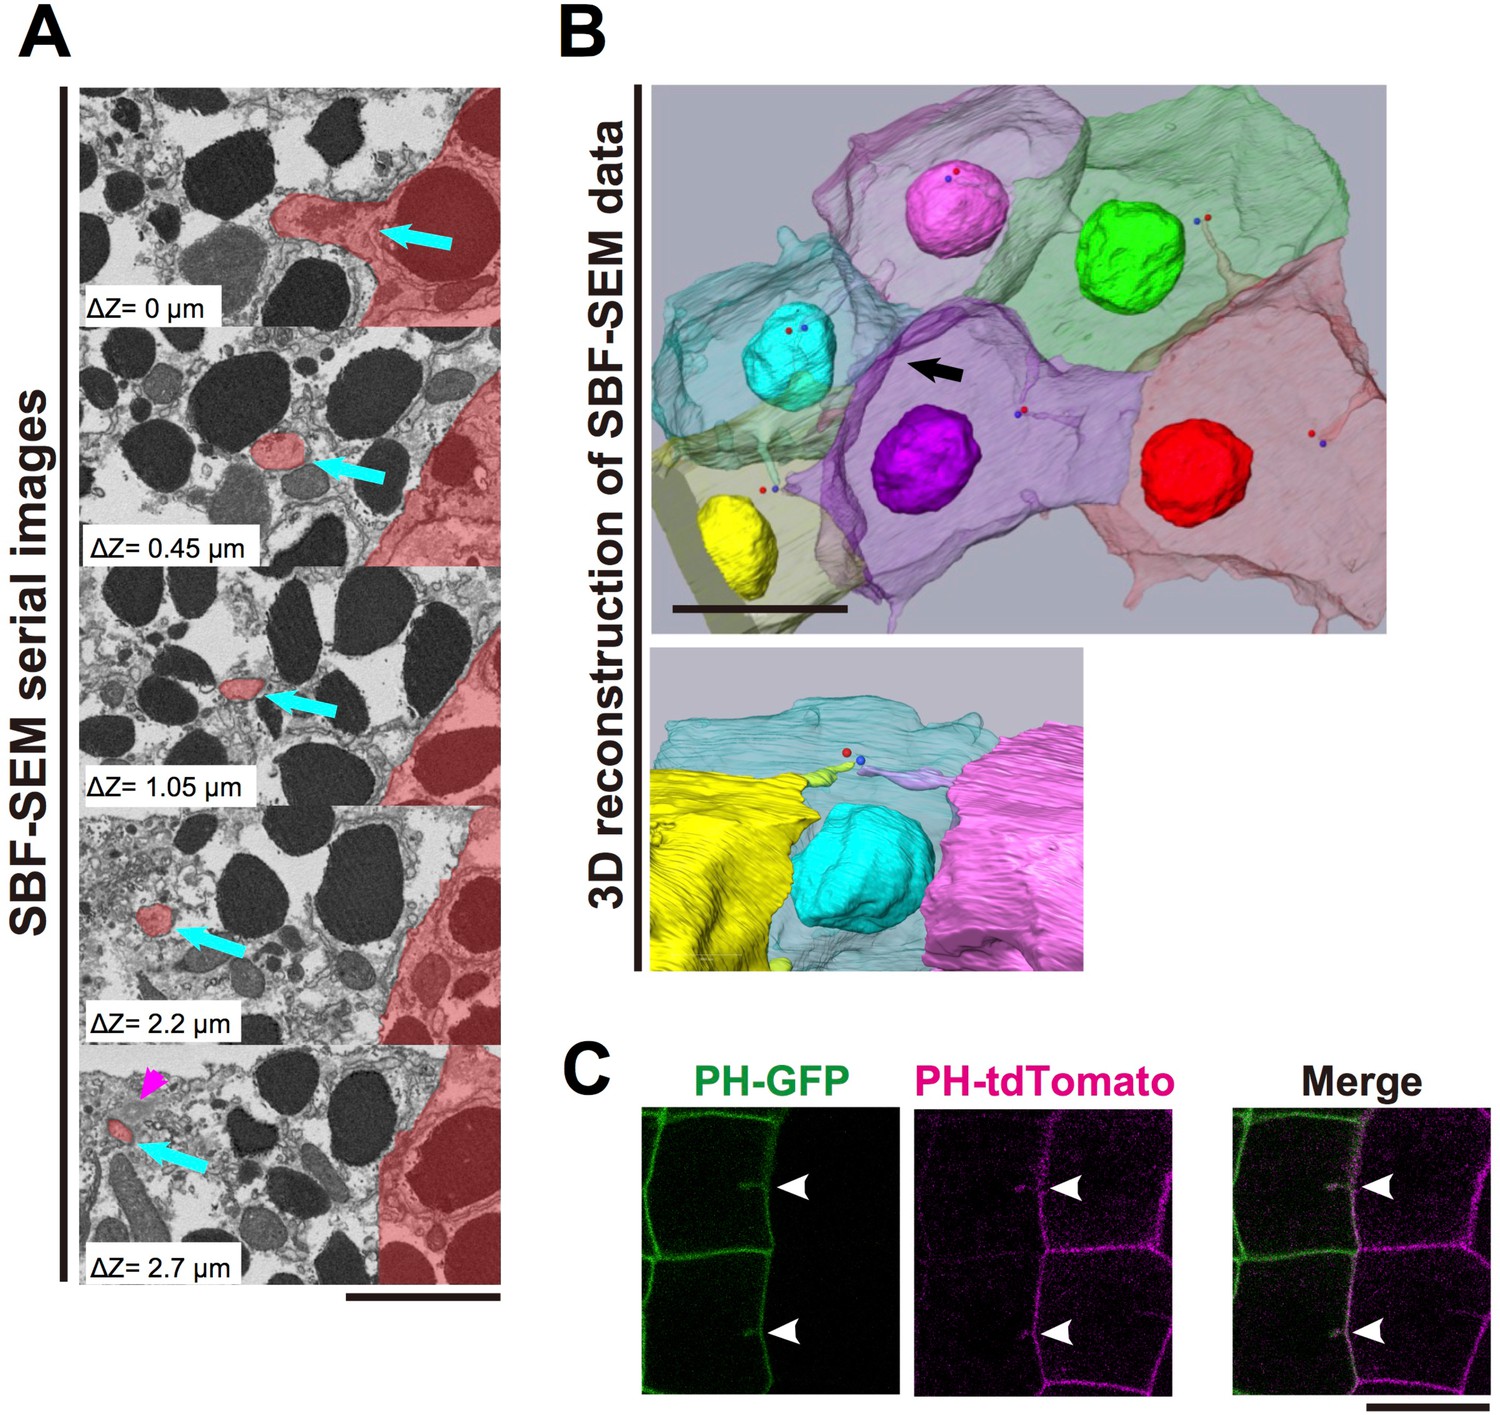
The invaginations consist of two plasma membranes and elongate toward the centrosome.
(A) Selected z-sections from the SBF-SEM sequence in Video 3; ΔZ indicates the depth below the top panel. Blue arrows: invaginations. Magenta arrowhead: centriole. The posterior cell is coloured in red. Bar: 2 µm. (B) A segmentation figure of 3D-reconstructed SBF-SEM data derived from Video 5. Lower panel: view from the perspective of the black arrow in the upper panel. Individual cells are labelled in the same colour code in both images. Red and blue balls indicate the position of a pair of centrioles. Bar: 10 µm. (C) Two-colour labelling of the anterior (PH-GFP) and posterior (PH-tdTomato) lineage epidermal cells showing that the invaginations are derived from the plasma membranes of both neighbouring cells. White arrowheads: invaginations on the border that were labelled with both colours. Bar: 10 µm.
Figure 4
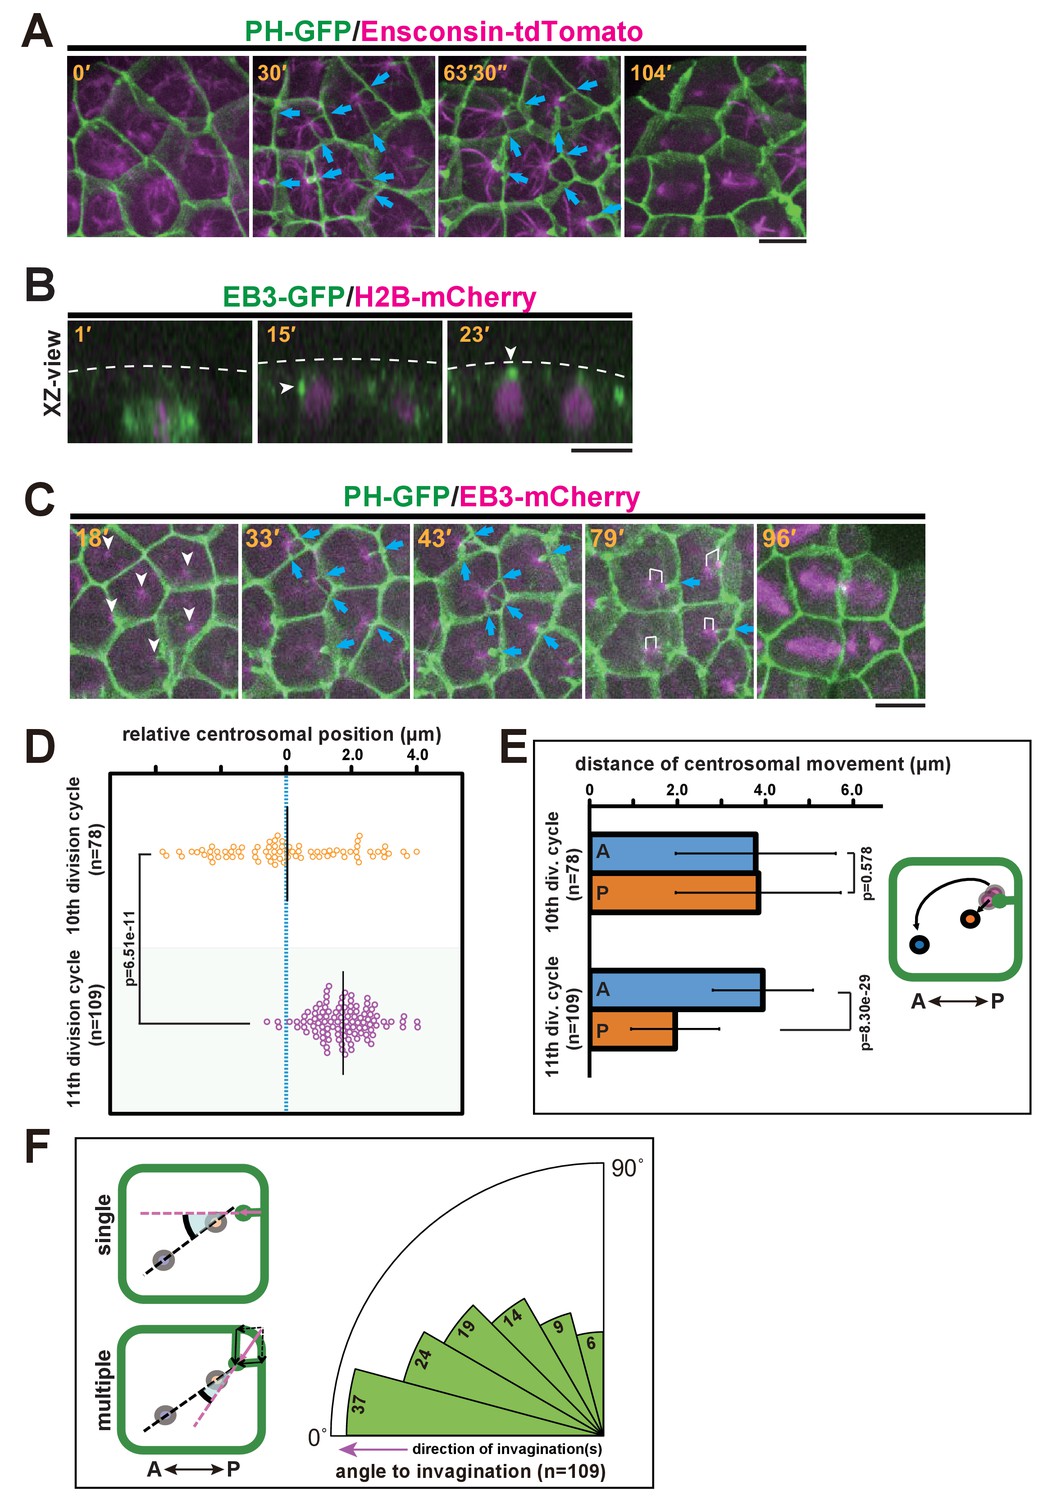
Quantitative description of centrosome behaviour in relation to the membrane invaginations.
(A) Epidermal cells in the 11th cell cycle showing the interphase microtubule array along the A-P axis and membrane invaginations toward the microtubule nucleation site in an embryo expressing PH-GFP/Ensconsin-tdTomato. Blue arrows: invaginations. Panels: frames from Video 6; elapsed time is indicated. (B, C) Centrosome dynamics in the 11th cell cycle epidermal cells in an embryo expressing EB3-GFP/H2B-mCherry or PH-GFP/EB3-mCherry; elapsed time is indicated in each panel. Bars: 10 µm. (B) XZ-view of epidermal cells in transition from late 10th cell cycle to early 11th cell cycle in an embryo expressing EB3-GFP/ H2B-mCherry. Frames were selected from Video 7. The focus is on the left daughter cell. Anterior: left. The centrosome (white arrowhead) was located lateral to the nucleus after mitotic division (15') but moved toward the apical cortex (dotted line). (C) XY-projection images of 11th cell cycle epidermal cells in an embryo expressing PH-GFP/EB3-mCherry, highlighting the elongation of membrane invaginations toward the MTOC. Anterior: left. Each frame was selected from Video 8. White arrowheads: microtubule nucleation sites. Blue arrows: invaginations. White brackets: pairs of centrosomes. (D) Centrosome position just before duplication during the 10th (n = 78 cells) and 11th (n = 109 cells) cell cycles. Black bars show the average centrosome position relative to the centre of the cell (blue dotted line); the average centrosome position was 0.03 and 1.7 µm toward the posterior side at the 10th and 11th cell cycles, respectively. p-values were obtained using the Welch's t-test. (E) Migration distance of anterior and posterior centrosomes determined by recording centrosome positions just before duplication and after the migration ceased during the 10th (n = 78 cells from three embryos) and 11th (n = 109 cells from three embryos) cell cycles. Histograms are presented as the mean ± SD, p-values were obtained using the Welch's t-test. Inset: illustration showing how the centrosome behaviours were measured. (F) Relationship between the centrosome axis and the invagination axis. To measure the angle between these axes, we measured the angle of the invagination just before centrosome duplication and the angle of the centrosome axis just after migration (n = 109 cells from three embryos), and calculated the difference between the two angles. For multiple invaginations, a composite vector was used as the angle of the invaginations. Left: illustration showing how two angles were measured. Black dotted line: the centrosome axis. Pink dotted line: the direction of the invagination(s). The bold black arc shows the angle.
Figure 5
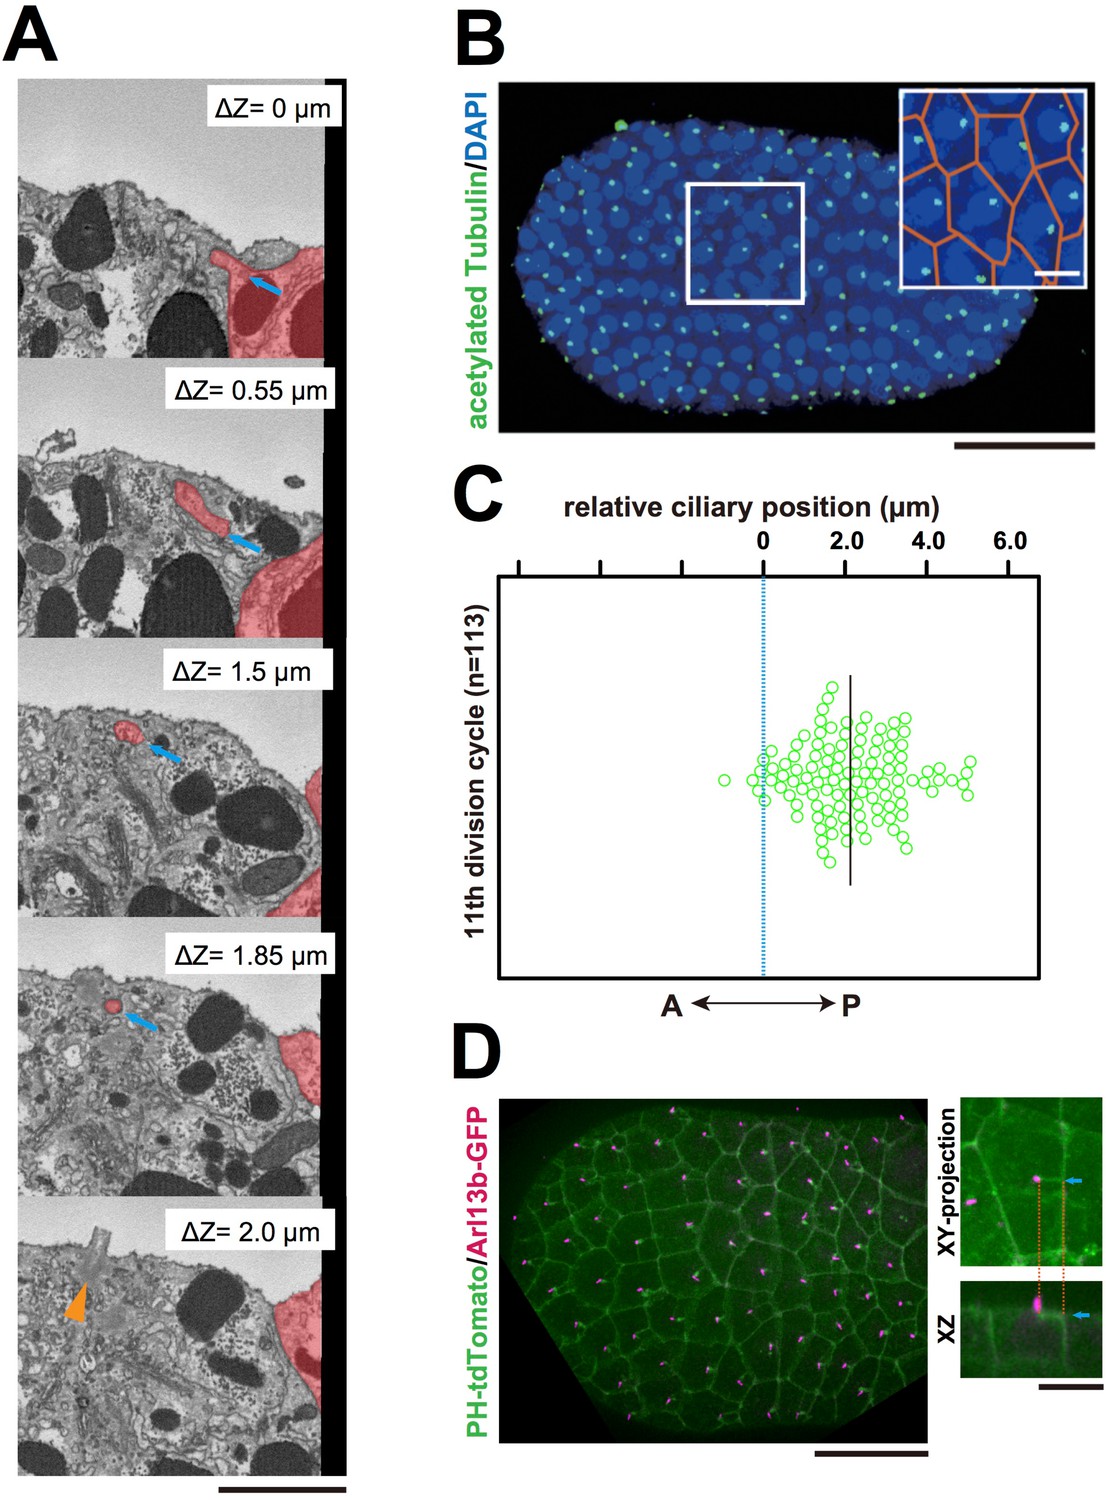
The centriole associated with the membrane invaginations carries the primary cilium.
(A) Selected z-sections from the SBF-SEM sequence in Video 9; ΔZ indicates the depth starting from the z-level of the top panel. Blue arrow: invagination. Orange arrowhead: the centriole and cilium complex. The posterior cell is tinted in red. Bar: 1 µm. (B) Acetylated tubulin immunofluorescence counterstained with DAPI, showing that the epidermal cells of the ascidian embryo contained a primary cilium at the 11th cell cycle stage. A maximum-intensity projection of the confocal z-stack is shown. Black bar: 50 µm. Area in the white square is enlarged in the inset; cell contours were manually outlined in orange. White bar: 10 µm. (C) Analysis of the position of cilia in the ascidian epidermal cells during the last cell cycle, showing a tendency to localise to the posterior side, consistent with previous observations (Thompson et al., 2012). We measured 113 cilia from three embryos. The black bar shows that, relative to the centre of the cell (blue dotted line), the average cilium position was 2.1 µm toward the posterior side of the cell. (D) Membrane invaginations and cilia were observed simultaneously in an embryo expressing PH-tdTomato and ADP-ribosylation factor-like 13b (Arl13b)-GFP; Arl13b labels primary cilia (Duldulao et al., 2009; Paridaen et al., 2013). The XY-projection panel shows a representative epidermal cell from another embryo. The XZ panel was reconstructed from the same z-stack data used for the XY-projection panel. Blue arrows: invaginations. Orange dotted lines indicate the same invagination in both panels. Bar: 10 µm.
Figure 6
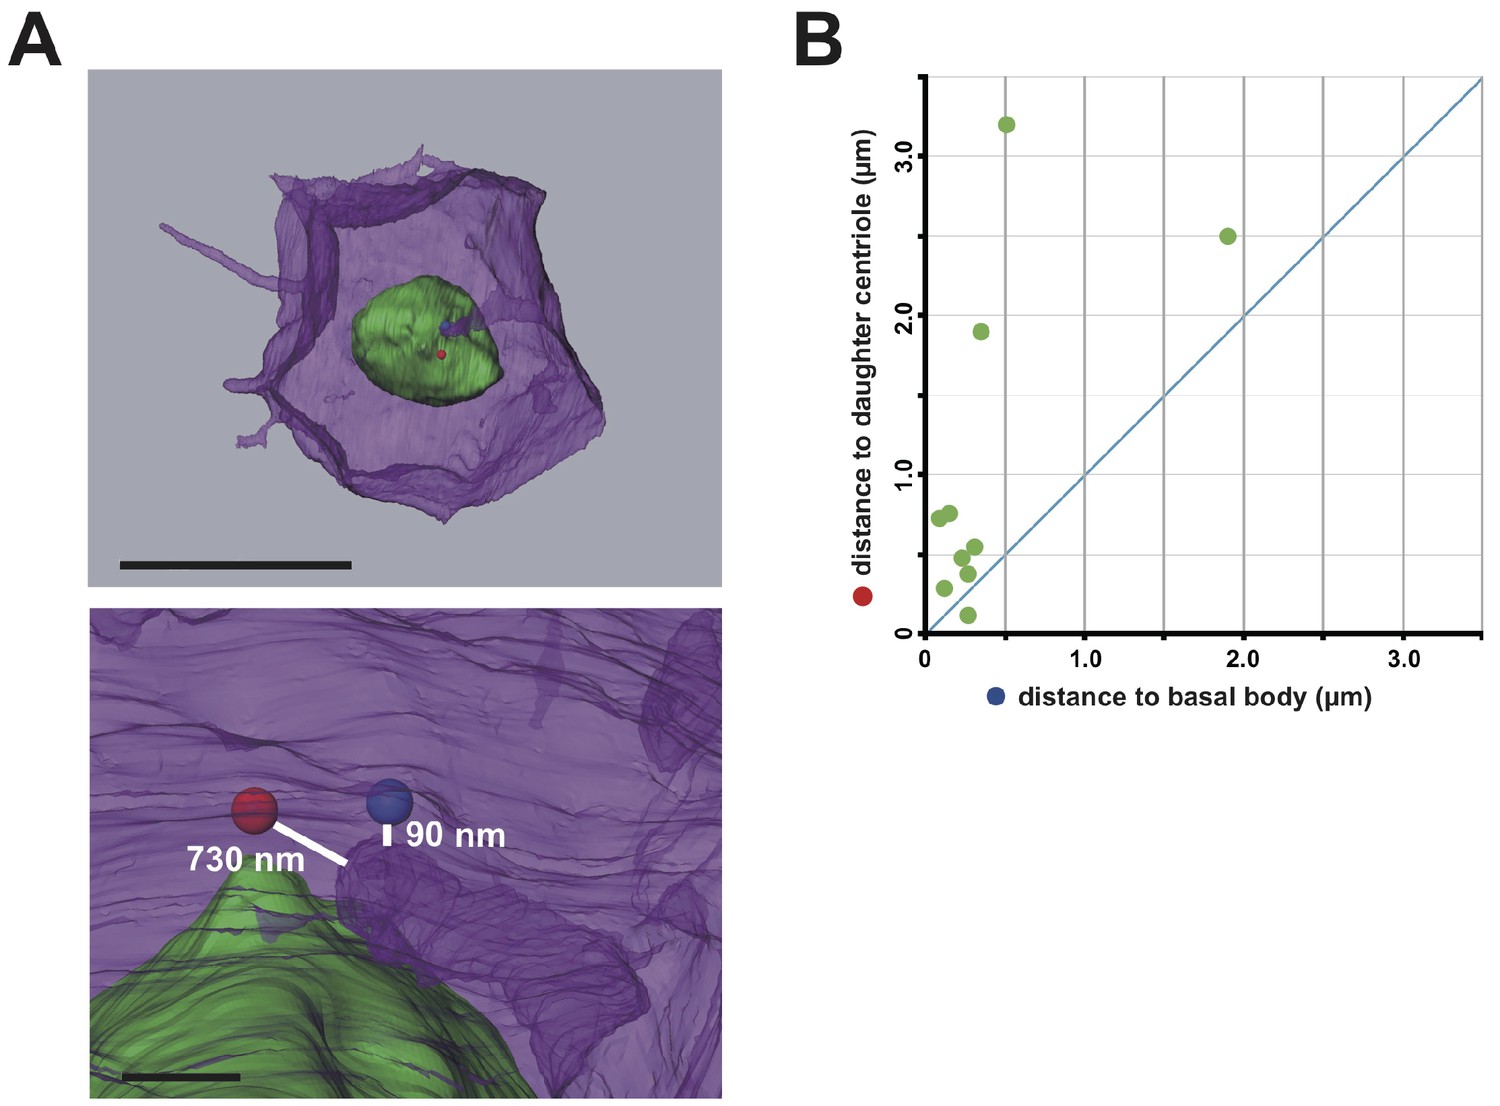
The membrane invagination approaches closer to the basal body than to the daughter centriole.
(A) A representative segmented cell from SBF-SEM data. Green: nucleus. Blue and red balls: the basal body and daughter centriole, respectively. Upper panel: top view of the whole cell. Bar: 10 µm. The lower panel shows a closer view at the tip of the invagination. Distances between 3D objects were measured in AMIRA. We recognized the mother centrioles/basal bodies by the presence of cilia in the serial sections of SBF-SEM. (B) Distance of the tip of the individual invagination to the basal body or daughter centriole. The X- and Y-axis show the distance to the basal body and daughter centriole, respectively. We measured ten invaginations and found that nine of ten invaginations approached the basal body more closely than the daughter centriole.
Figure 7
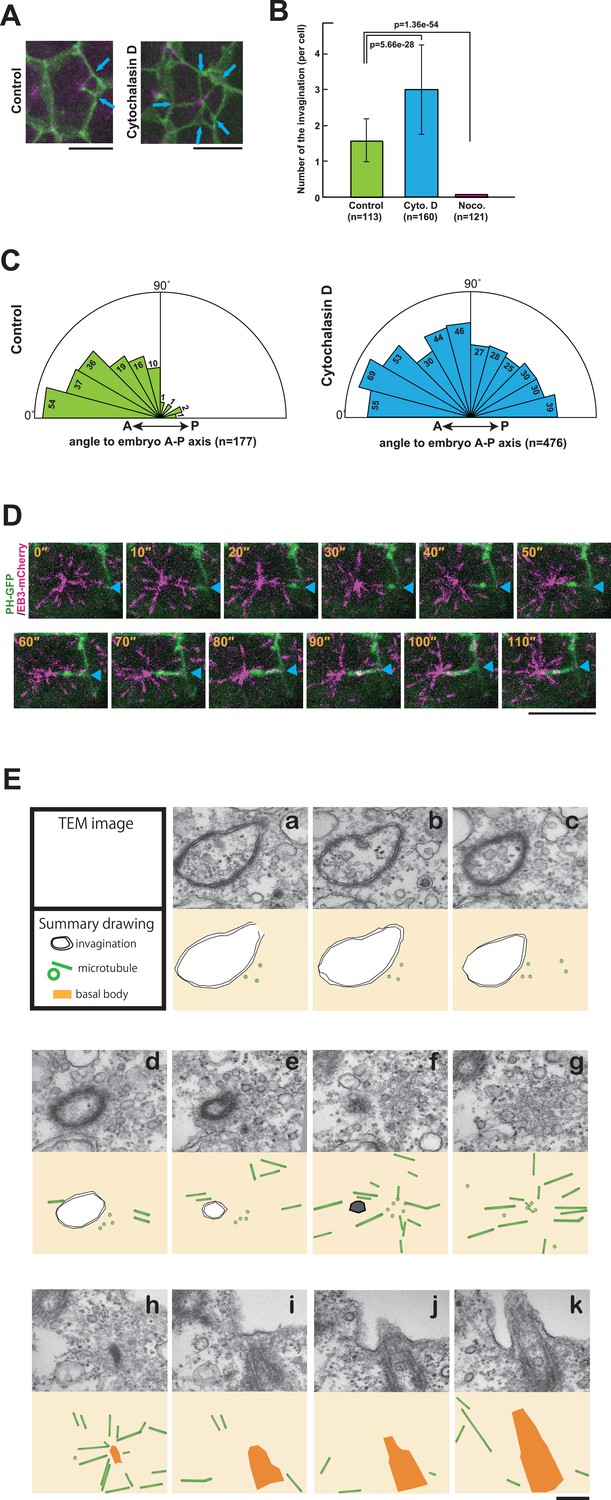
The role of cytoskeletal elements in the formation of the membrane invagination and the implication of microtubule function.
(A) Representative epidermal cells expressing PH-GFP/EB3-mCherry in control and cytochalasin-treated embryos. The cytochalasin panel is from Video 10. Blue arrows: membrane invaginations. Bars: 10 µm. Anterior: left. (B) The number of invaginations after inhibitor treatment: cytochalasin treatment (160 cells from three embryos) increased the number of invaginations, while nocodazole treatment (121 cells from three embryos) decreased the number of invaginations compared to control (113 cells from three embryos). Histograms are presented as the mean ± SD. p-values were obtained using the Welch's t-test. (C) In cytochalasin-treated cells, unlike normal cells, invaginations also formed from the anterior side and extended toward the posterior of the cell. We counted 177 and 476 invaginations, respectively, in three control and three cytochalasin-treated embryos. (D) A high time-resolution timelapse recording of a representative cell expressing PH-GFP/EB3-mCherry. A blue arrowhead indicates the membrane invagination. Time elapsed from the start of recording is shown in orange. Bar: 10 µm. Anterior: left. (E) A series of images from the serial TEM observation. TEM images (upper panels) and the corresponding schematic drawings (lower panels) are shown with the microtubules as green tubes, the membrane invagination as black double-line in a–e, or its tip as a hexagon filled by gray in f, and the basal body as an orange structure in h–k.
Figure 8
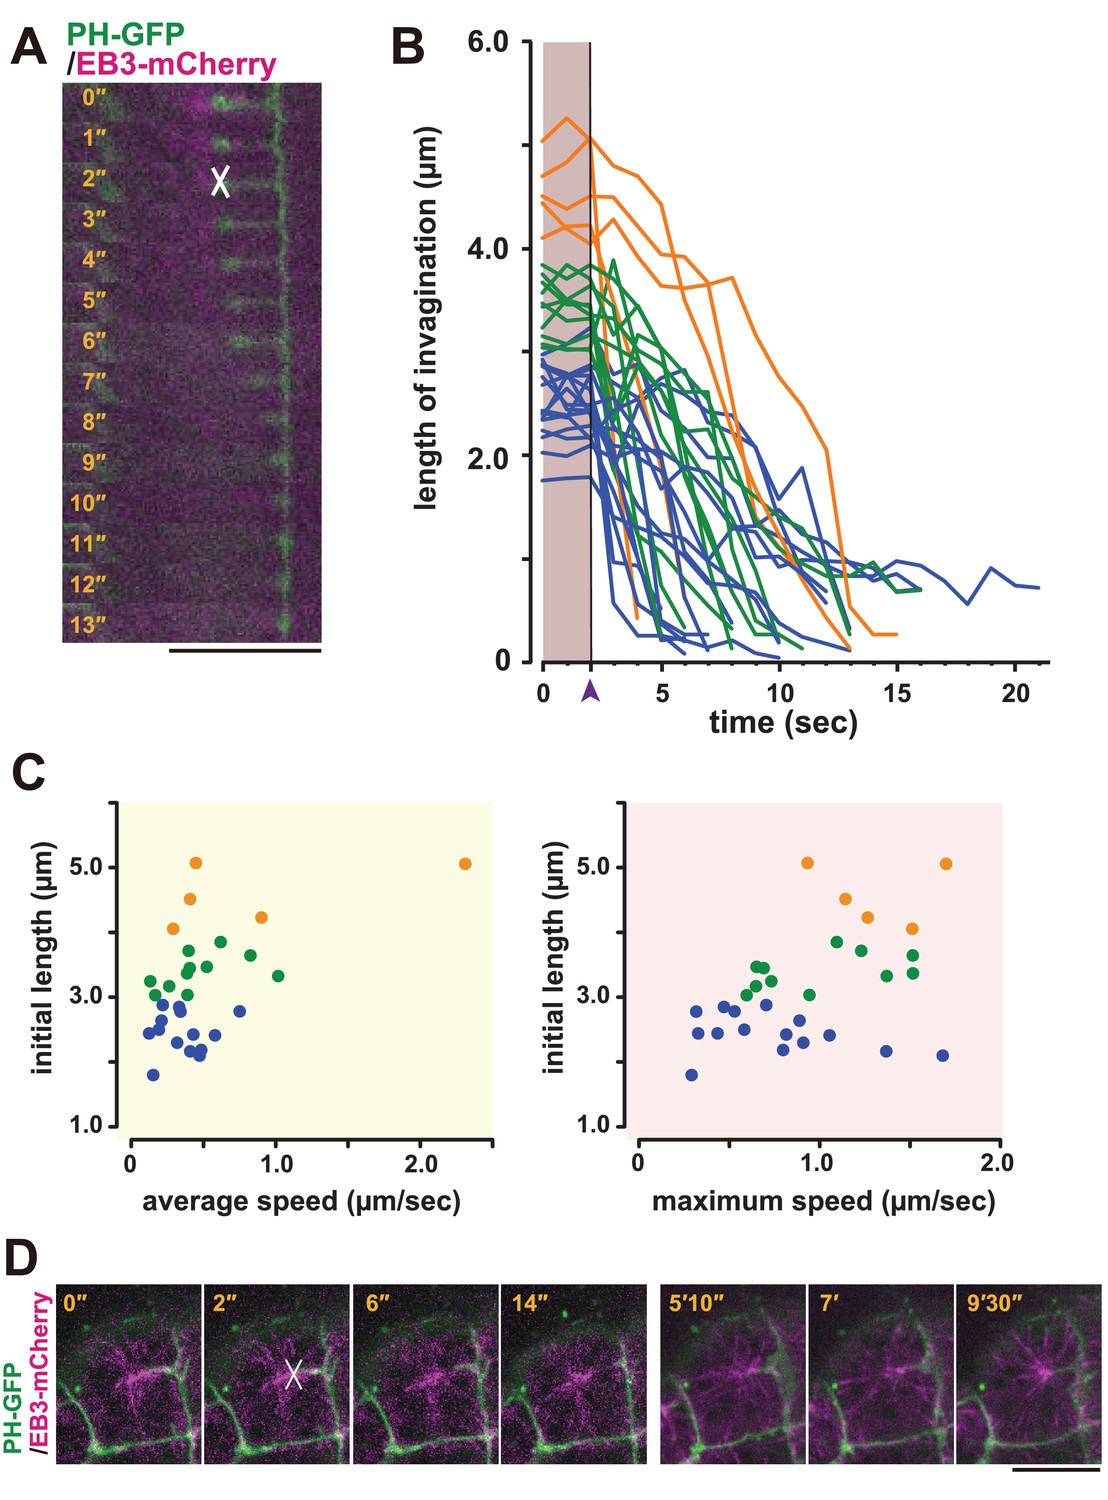
Laser ablation and regeneration of the membrane invagination.
(A, B) Effect of UV laser ablation on membrane invagination in a cell expressing PH-GFP/EB3-mCherry. (A) Image shows frames from Video 12, with the elapsed time indicated. In the 2'' frame, the white 'X' indicates the point of laser ablation. The membrane recoiled rapidly after ablation. Bar: 10 µm. (B) Graph showing measurements of invagination length following laser ablation. The black line, indicated with purple arrow head, shows the time of ablation. A colour code was used to highlight the difference of initial length of the membrane invaginations when the laser ablation was conducted: orange, >4 µm; green, 4 µm to 3 µm; blue, <3 µm. n = 31 invaginations. (C) The correlation between the initial length and average (left) or maximum (right) speed. Coloured dots correspond to the lines in B. The correlation coefficient (r) is 0.52 or 0.44 for the average speed or the maximum speed, respectively (Pearson correlation). (D) The plasma membrane re-invaginated after UV laser ablation. We observed this regeneration event at least five independent experiments. The white 'X' indicates the point of laser ablation. Time elapsed from the start of recording is shown in orange. Frames for 0'-14' correspond to single confocal planes while those for 5'10'–9'30' are max intensity projections. Bars: 10 µm. Anterior: left.
Figure 9
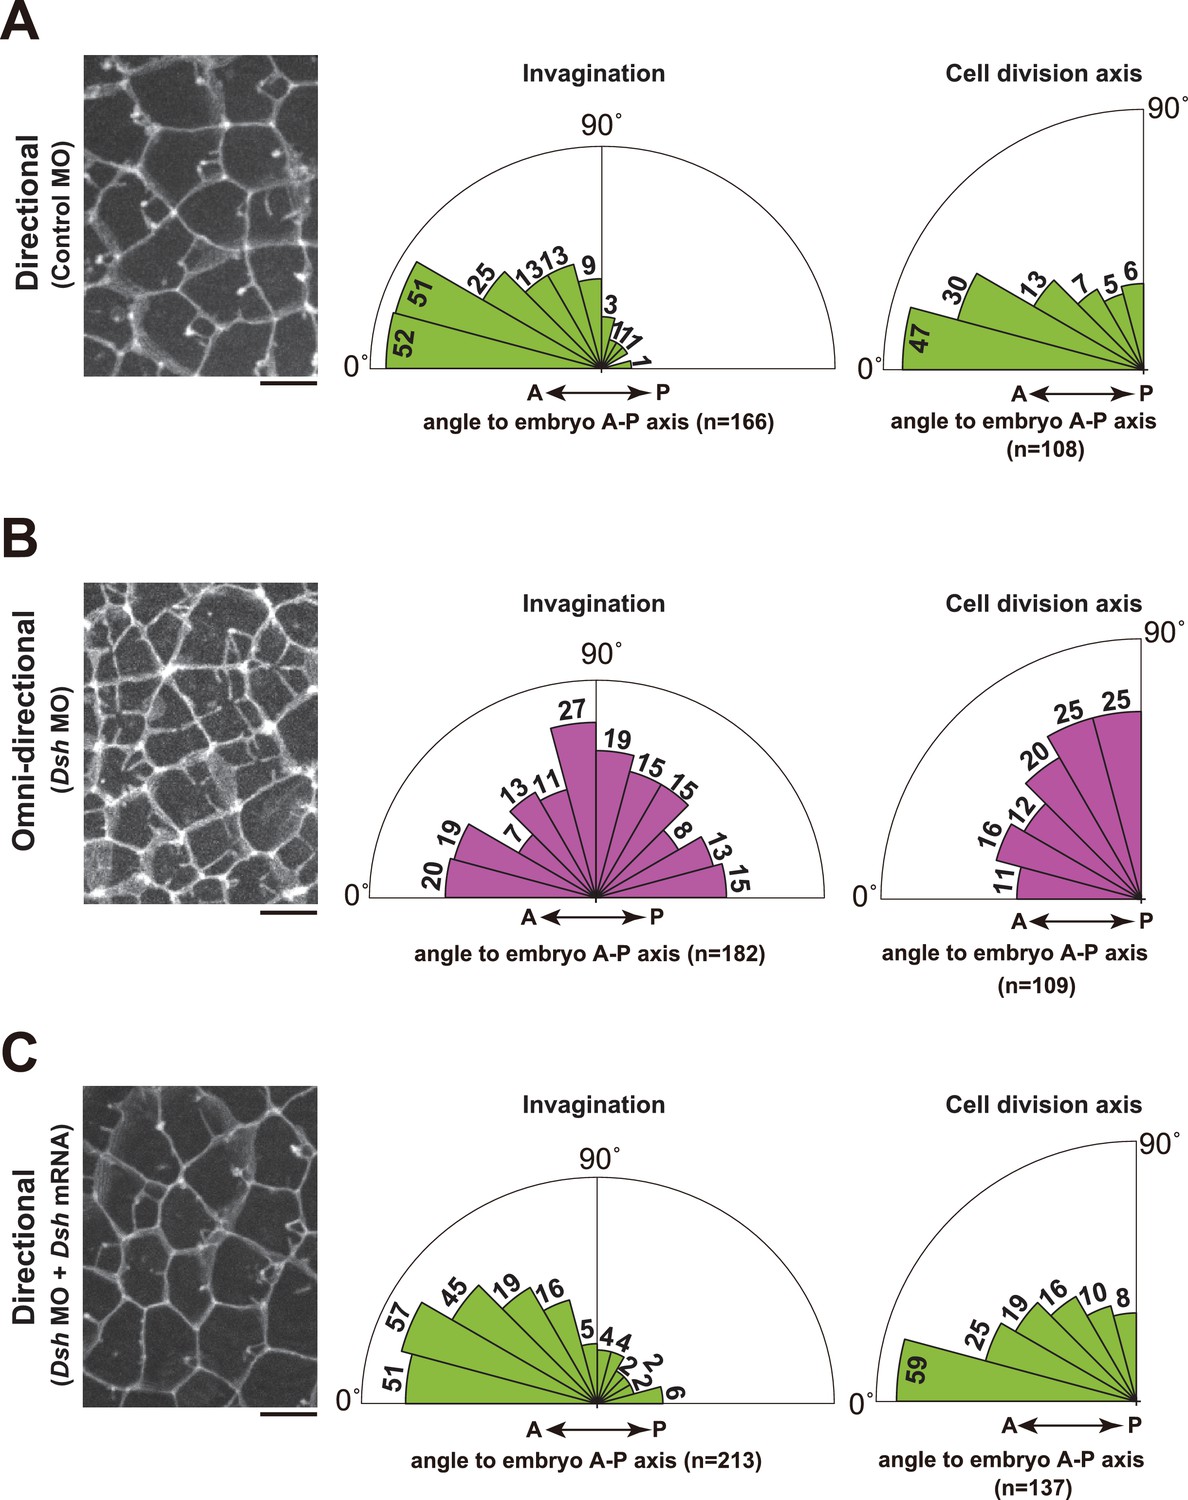
Depletion of Dsh resulted in the radial formation of multiple membrane invaginations and randomized the cell division axis in the 11th cell cycle epidermal cells.
(A) The directional invaginations labeled by PH-GFP in the control MO-injected cells. The bar represents 10 µm (left). Rose diagrams showing the angle of the invagination relative to the embryonic A–P axis, n = 166 invaginations from three embryos (middle), and the angle of cell division relative to the embryonic A–P axis, n = 108 cells from three embryos (right). The results are almost same as the normal embryos in Figure 1 and Figure 2. (B) The omini-directional invaginations labeled by PH-GFP in the Dsh MO-injected cells. The bar represents 10 µm (left). Rose diagrams showing the angle of the invagination relative to the embryonic A-P axis, n = 182 invaginations from three embryos (middle), and the angle of cell division relative to the embryonic A-P axis, n = 109 cells from three embryos (right). In the embryos with radially formed invaginations, the orientation of cell division is randomized. (C) Co-injection of Dsh MO and Dsh mRNA restores directional invaginations. The bar represents 10 µm (left). Rose diagrams showing the angle of the invagination relative to the embryonic A-P axis, n = 213 invaginations from three embryos (middle), and the angle of cell division relative to the embryonic A–P axis, n = 137 cells from three embryos (right). The results are reminiscent of normal and the control MO-injected embryos.
Figure 10
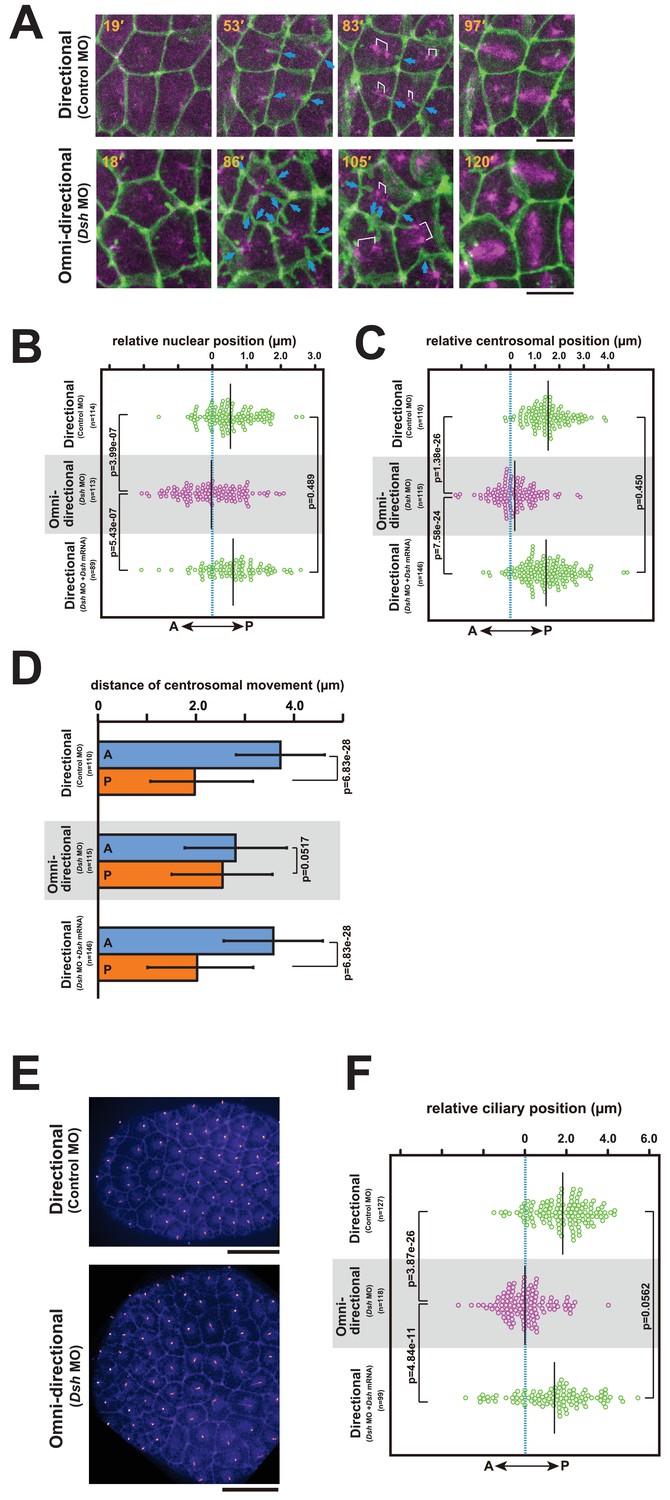
The centrosome dynamics is highly correlated with the directionality of the membrane invagination.
(A) Centrosome dynamics with the directional (upper) or the omni-directional (lower; frames from Video 14) membrane invaginations in embryos injected with MOs and expressing PH-GFP/EB3-mCherry. Blue arrows indicate the invaginations. Elapsed time is indicated in each panel. Anterior is left. Bars: 10 µm. (B) Bee-swarm plots showing the nuclear position relative to the centre of the cell along the embryonic A–P axis with the directional (upper; control MO, n = 114 cells from three embryos and lower; Dsh MO + Dsh mRNA, n = 89 cells from three embryos) and the omini-directional (middle; Dsh MO, n = 113 cells from three embryos) invaginations. Black lines show the average nuclear position relative to the centre of the cell (blue dotted line); the average position was 0.53, −0.03 and 0.6 µm toward the posterior side in the embryos injected with control MO, Dsh MO and Dsh MO + Dsh mRNA, respectively. p-values were obtained using the Welch's t-test. (C) Centrosome position relative to the centre of the cell along the embryonic A–P axis just before duplication with the directional (upper; control MO, n = 110 cells from three embryos and lower; Dsh MO + Dsh mRNA, n = 146 cells from three embryos) and the omini-directional (middle; Dsh MO, n = 115 cells from three embryos) invaginations. Black lines show the average centrosome position relative to the centre of the cell (blue dotted line); the average centrosome position was 1.54, 0.18 and 1.46 µm toward the posterior side in the embryos injected with control MO, Dsh MO and Dsh MO + Dsh mRNA, respectively. p-values were obtained using the Welch's t-test. (D) Histograms showing migration distance of anterior and posterior centrosomes over the period from centrosome duplication to the end of migration in epidermal cells with the directional (upper; control MO, n = 110 cells from three embryos and lower; Dsh MO + Dsh mRNA, n = 146 cells from three embryos) and the omini-directional (middle; Dsh MO, n = 115 cells from three embryos) invaginations. Blue and orange columns show the migration of the anterior and posterior centrosomes, respectively. The data are presented as the mean ± SD. p-values were obtained using the Welch's t-test. (E) Cilium positioning in epidermal cells with the directional (upper) or the omini-directional (lower) membrane invaginations in embryos expressing Arl13b-GFP. (F) Bee-swarm plots showing cilium position relative to the centre of the cell along the embryonic A-P axis in epidermal cells with the directional (upper; control MO, n = 127 cells from three embryos and lower; Dsh MO + Dsh mRNA, n = 99 cells from three embryos) and the omini-directional (middle; Dsh MO, n = 118 cells from three embryos) invaginations. Black lines show the average cilium position relative to the centre of the cell (blue dotted line); the average cilium positions were 1.82, 0.00 and 1.42 µm toward the posterior side in embryos injected with control MO, Dsh MO and Dsh MO + Dsh mRNA, respectively. p-values were obtained using the Welch's t-test.
Figure 11
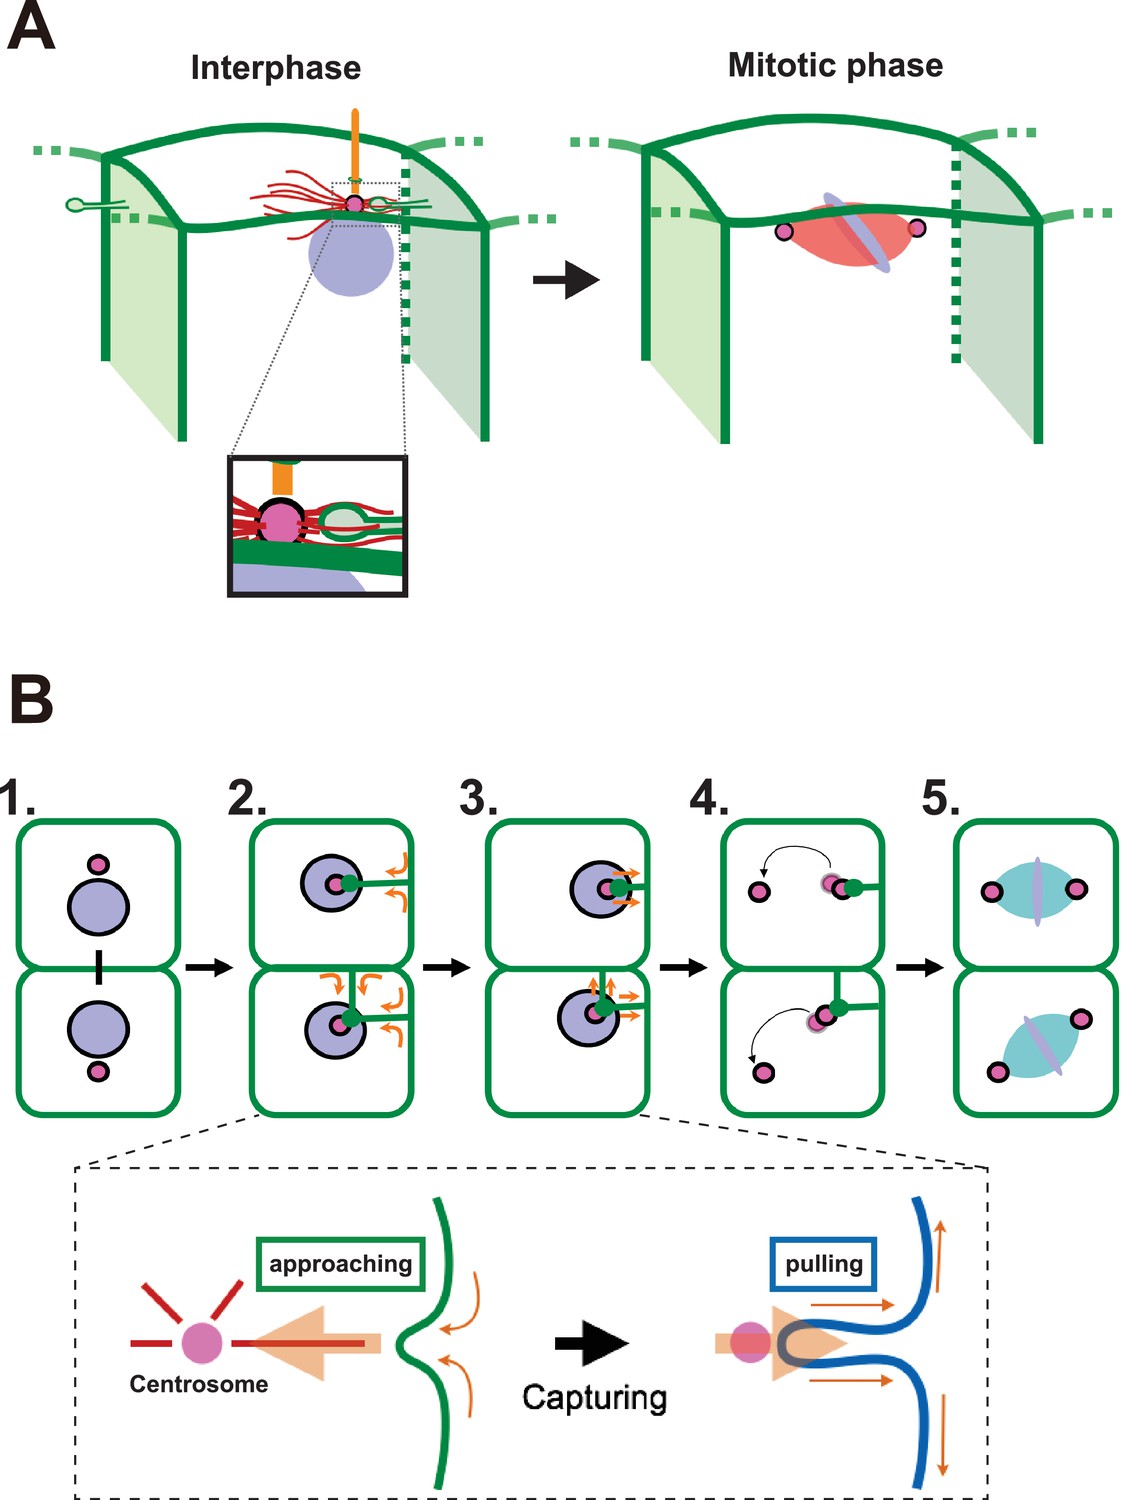
A proposed model for mitotic spindle orientation driven by membrane invaginations.
(A) Graphical summary of the spatial relationship of each component. Anterior is left. Interphase: nuclei (purple), cell membrane (green), centrosome (magenta), microtubule (red) and cilium (orange). Mitotic phase: neither invaginations nor cilia are found. (B) Schematic drawing of the course of 11th epidermal cell division in relation to the invagination. Apical view of cells. Upper panel: (1) Nuclei (purple) and centrosomes (magenta) just after the 10th cytokinesis; (2) After the centrosome migrates toward the apical cortex, the membrane invaginates toward the centrosome from the posterior plasma membrane; (3) The invagination shrinks, pulling the centrosome and nucleus toward the posterior; (4) The centrosomes duplicate and exhibit distinct migratory activities with the less motile centrosome remaining associated with the membrane invagination; (5) The mitotic spindle forms aligned along the A-P axis. In the lower panel, the assumed forces involved in the invagination are shown. MTOC activity on the centrosome causes the 'approaching' invagination from the plasma membrane, likely to be depending on microtubule function. After the centrosome is associated with the tip of membrane invagination, a tensile force acting on the invagination brings the centrosome toward the posterior.
Videos
Video 1
(10 fps) A low-magnification, low-resolution time-lapse movie of an embryo expressing PH-GFP (green) and H2B-mCherry (magenta), made with the maximum-intensity projection of the confocal microscopy data.
Lateral view: facing; anterior: left. Ten minutes are compressed to one second. White arrows: representative cells. This video is related to Figure 1A.
Video 2
(7 fps) A high-magnification, high-resolution time-lapse movie of an embryo expressing PH-GFP, made with the maximum-intensity projection of the confocal microscopy data.
Four minutes and 40 s are compressed to one second. Anterior: left. This video is related to Figure 2B.
Video 3
A video made of serial sections of SBM-SEM images.
Blue arrow: invagination. Magenta arrowhead: centrosome. The depth between each frame is 50 nm. This video is related to Figure 3A.
Video 4
A movie integrating serial sections of SBF-SEM images and segmentations of the structures.
https://doi.org/10.7554/eLife.16550.008
Video 5
3D-segmentations from serial sections of SBM-SEM images: pairs of red and blue balls indicate the positions of centrioles in the cell.
This video is related to Figure 3B.
Video 6
(10 fps) A time-lapse movie of an embryo expressing PH-GFP (green) and ensconsin-tdTomato (magenta), made with the maximum-intensity projection of the confocal microscopy data.
The video starts at the end of the 10th cell division. Five minutes are compressed to one second. Anterior: left. This video is related to Figure 4A
Video 7
(7 fps) A time-lapse movie of an embryo expressing EB3-GFP (green) and H2B-mCherry (magenta), made with the reconstructed cross-sections of confocal microscopy data.
The video starts at the M phase of the 10th cell division. Four minutes and 40 s are compressed to one second. Apical side: up. This video is related to Figure 4B.
Video 8
(10 fps) A time-lapse movie of an embryo expressing PH-GFP (green) and EB3-mCherry (magenta), made with the maximum-intensity projection of the confocal microscopy data.
The video starts at the end of the 10th cell division. Five minutes are compressed to one second. Anterior is left. This video is related to Figure 4C.
Video 9
A video made with serial sections of SBM-SEM images.
Blue arrow: the invagination. Orange arrowhead: the cilia and centriole. The depth between each frame is 50 nm. This video is related to Figure 5A.
Video 10
(12 fps) In a cytochalasin-treated embryo expressing PH-GFP/EB3-mCherry, membranes invaginated from the anterior side and the number of invaginations increased.
Anterior: left. Five minutes are compressed to one second. This video is related to Figure 7A.
Video 11
A video made of sections of serial-TEM images shows the invagination toward the basal body.
This video is related to Figure 7E.
Video 12
(10 fps) A time-lapse movie of an embryo expressing PH-GFP (green) and EB3-mCherry (magenta), made with a time series of a single confocal plane.
Laser irradiation occurs at the third frame. Ten seconds are compressed to one second. Anterior: left. This video is related to Figure 8A.
Video 13
(10 fps) A time-lapse movie of an embryo expressing PH-GFP (green) and EB3-mCherry (magenta), made with a time series of a single confocal plane.
Laser irradiation on the lower invaginations occurs at the 10th frame. This clearly shows a bounce toward the intact invagination after the ablation of the other. Ten seconds are compressed to one second. Anterior: left. This video is related to Figure 8A.
Video 14
(10 fps) A time-lapse movie of an embryo expressing PH-GFP (green) and EB3-mCherry (magenta), made with the maximum-intensity projection of the confocal data.
This shows that the radially formed invatginations affected the centrosome dynamics. Five minutes are compressed to one second. Anterior is left. This video is related to Figure 10A (lower panels).
Download links
A two-part list of links to download the article, or parts of the article, in various formats.
Downloads (link to download the article as PDF)
Open citations (links to open the citations from this article in various online reference manager services)
Cite this article (links to download the citations from this article in formats compatible with various reference manager tools)
Physical association between a novel plasma-membrane structure and centrosome orients cell division
eLife 5:e16550.
https://doi.org/10.7554/eLife.16550


