Lineage tracing of human B cells reveals the in vivo landscape of human antibody class switching
- Stanford University, United States
- University of California Santa Cruz, United States
- Stanford University School of Medicine, United States
- Howard Hughes Medical Institute, United States
Figures
Figure 1 with 7 supplements
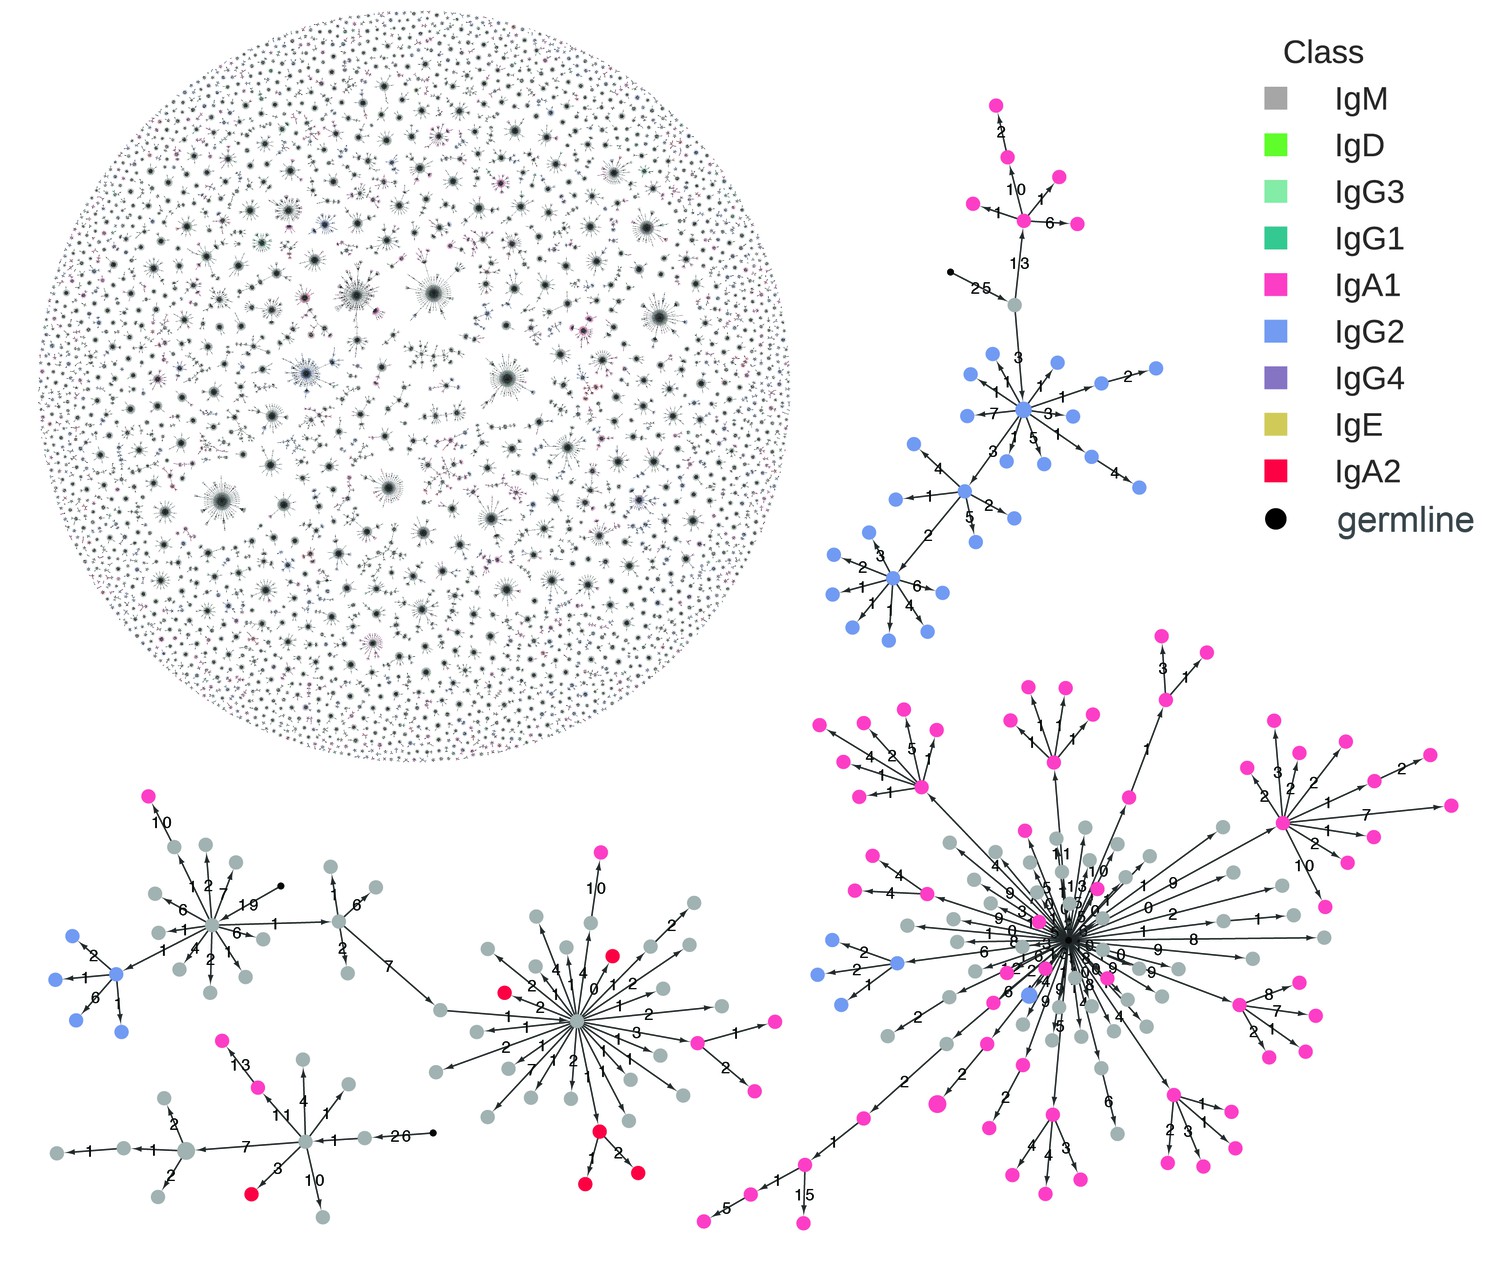
Reconstructed clonal histories of B cell lineages.
Examples of reconstructed clonal histories of antibody lineages in the repertoire of Subject 1A. All lineages with ≥6 sequences, comprising 64% of unique sequences in the repertoire, are shown in the upper left. Four examples among these lineages are also shown. Circles indicate unique IGH sequences colored by class. Edges indicate the minimum evolution tree that spans the clonal lineage and are labeled with the number of substitutions separating the sequences. The tree is rooted on the germline V and J gene sequence, indicated by the small black circle.
Figure 1—figure supplement 1
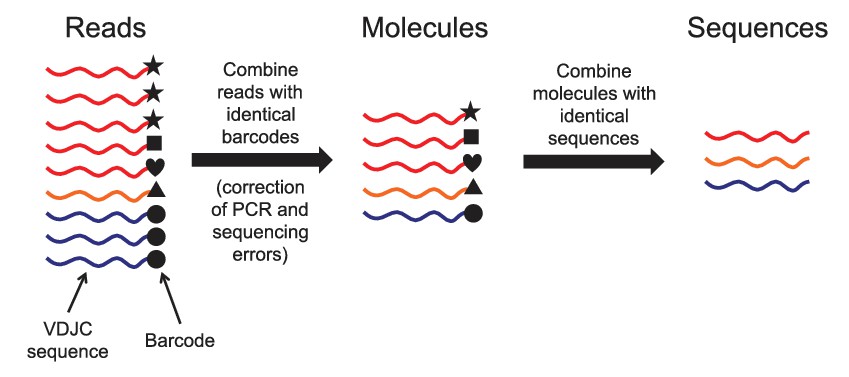
Schematic of immune repertoire sequencing strategy and data processing.
Reads having identical molecular barcodes are combined to yield a consensus read, which corresponds to a single mRNA molecule whose sequence has been corrected for errors arising during PCR and sequencing. Next, molecules having the same VDJC sequence are combined and the molecular abundance of each unique sequence is counted. In our analysis, we considered only the unique sequences and ignored molecular abundance counts.
Figure 1—figure supplement 2
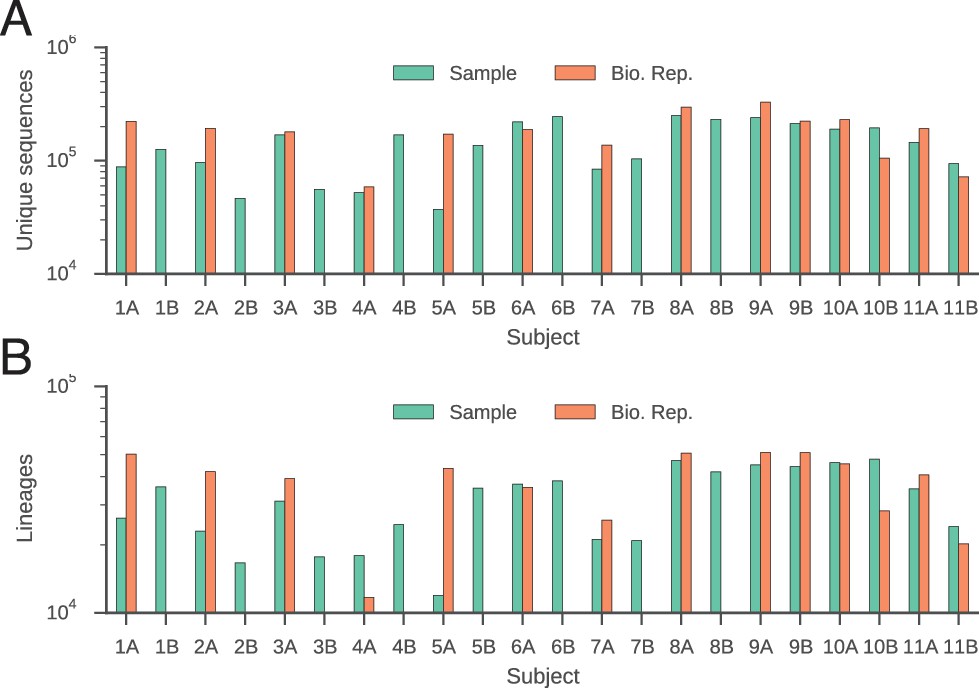
Number of unique sequences (A) and clonal lineages (B) identified in each subject.
Twins are indicated by subject identifiers having the same number, but different letters (e.g. 1A and 1B).
Figure 1—figure supplement 3
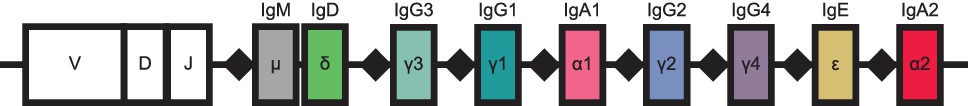
Schematic of human immunoglobulin heavy chain (IGH) locus.
Constant region loci are indicated by colored rectangles, with labels and colors corresponding to class, as in Figure 1. Recombination signal sequences are indicated by black diamonds. Because the intervening DNA is looped out and excised during class switch recombination, class switching can only proceed from left to right. This region is located on chromosome 14.
Figure 1—figure supplement 4
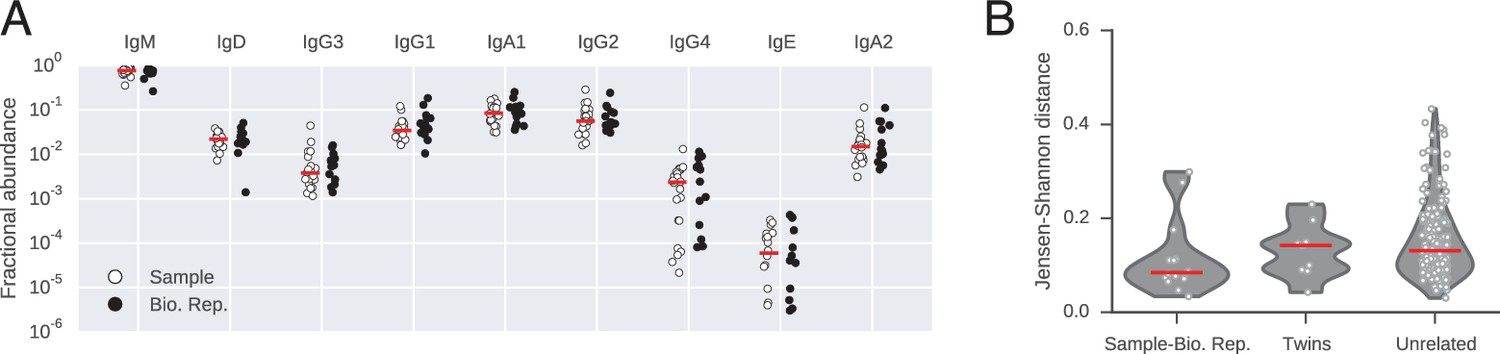
Abundance of antibody classes.
(A) Fraction of IGH sequences belonging to each class for each subject in sample and biological replicate. Median across subjects is indicated by red line. (B) Differences between distributions of antibody classes (measured by Jensen-Shannon distance). Lane 1 compares biological replicates for individual subjects. Lanes 2 and 3 compare pairs of subjects (identical twins or unrelated individuals). Median across comparisons indicated by red line.
Figure 1—figure supplement 5
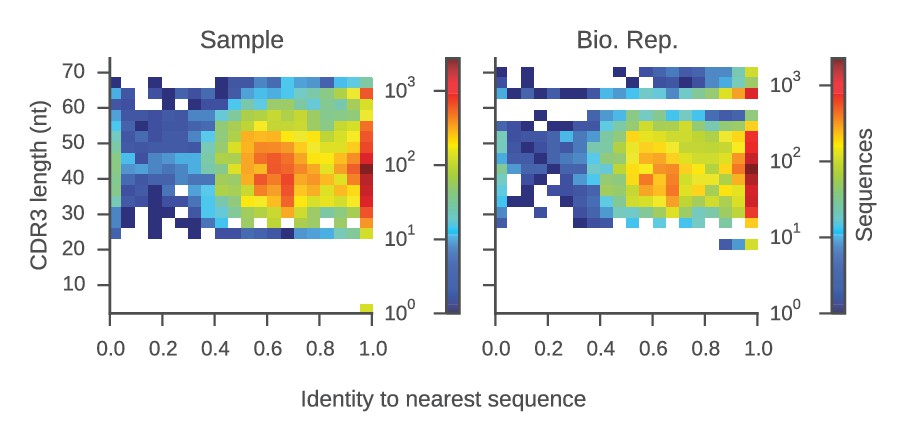
Determination of sequence identity cutoff for clonal lineages.
Distributions of sequence identity within groups of sequences sharing the same V and J genes and CDR3 length (a 'group') from the same repertoire are shown. For each sequence, we calculated the sequence identity with the most similar sequence in its group (its 'nearest neighbor'). Plot displays CDR3 length and identity to the nearest neighbor for all sequences in our data set. Color indicates the number of sequences per bin. This plot reveals two groups of sequences: (1) sequences for which the nearest neighbor has >95% identity, implying that it belongs to a clonal lineage with the nearest neighbor; and (2) sequences for which the nearest neighbor has 40–80% identity, suggesting that it does not belong to a clonal lineage. This indicates that by using a cutoff of 95% sequence identity in the CDR3, one can stringently identify sequences belonging to the same clonal lineage.
Figure 1—figure supplement 6
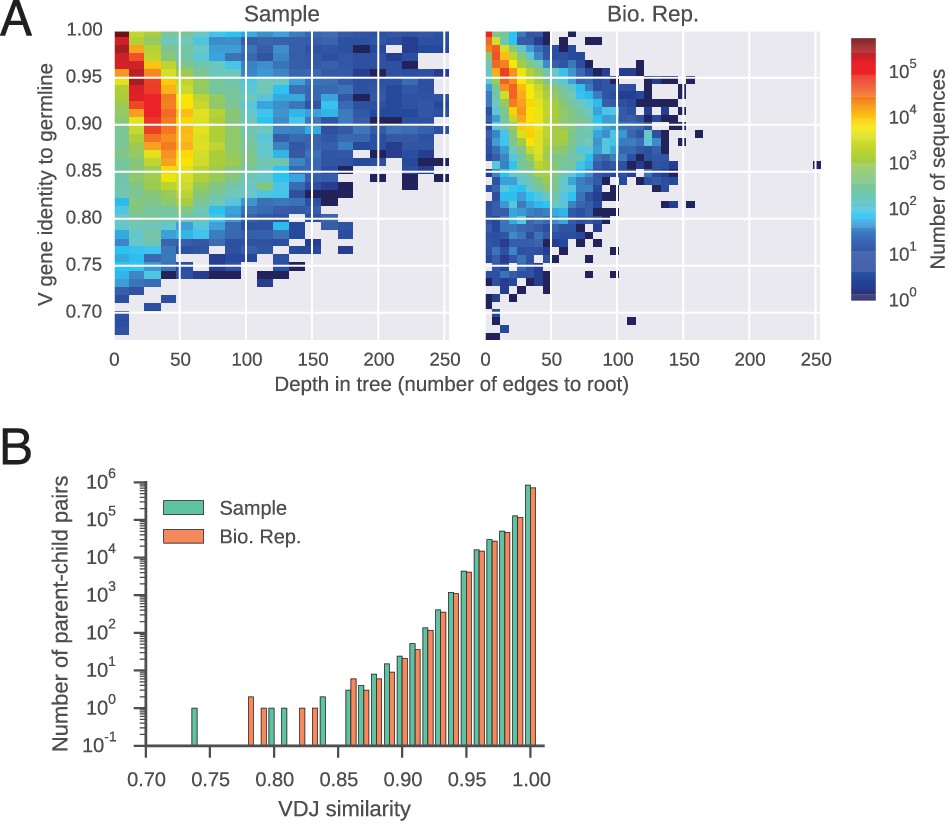
Features of reconstructed antibody lineages.
(A) Somatic mutations accumulate in reconstructed antibody lineages. For every sequence, identity to the germline V gene is plotted against its depth,defined as the number of edges to the root of the tree (the germline sequence). Color indicates number of sequences per bin. (B) Distributions of sequence identity between variable region sequences of parent-child pairs in reconstructed antibody lineages.
Figure 1—figure supplement 7
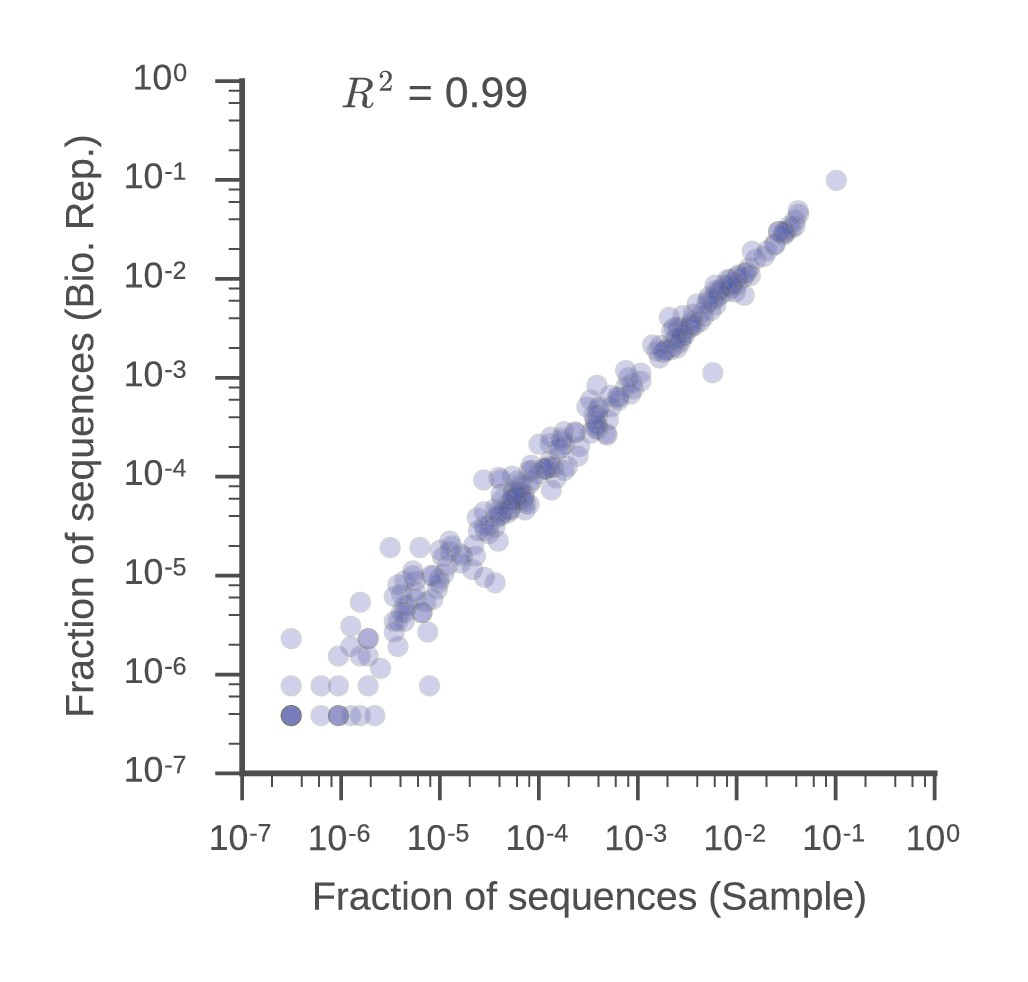
V gene usage is similar in biological replicates.
Fraction of sequences mapping to each V gene in the sample and biological replicate libraries is displayed. Squared Pearson correlation coefficient is shown.
Figure 2 with 11 supplements

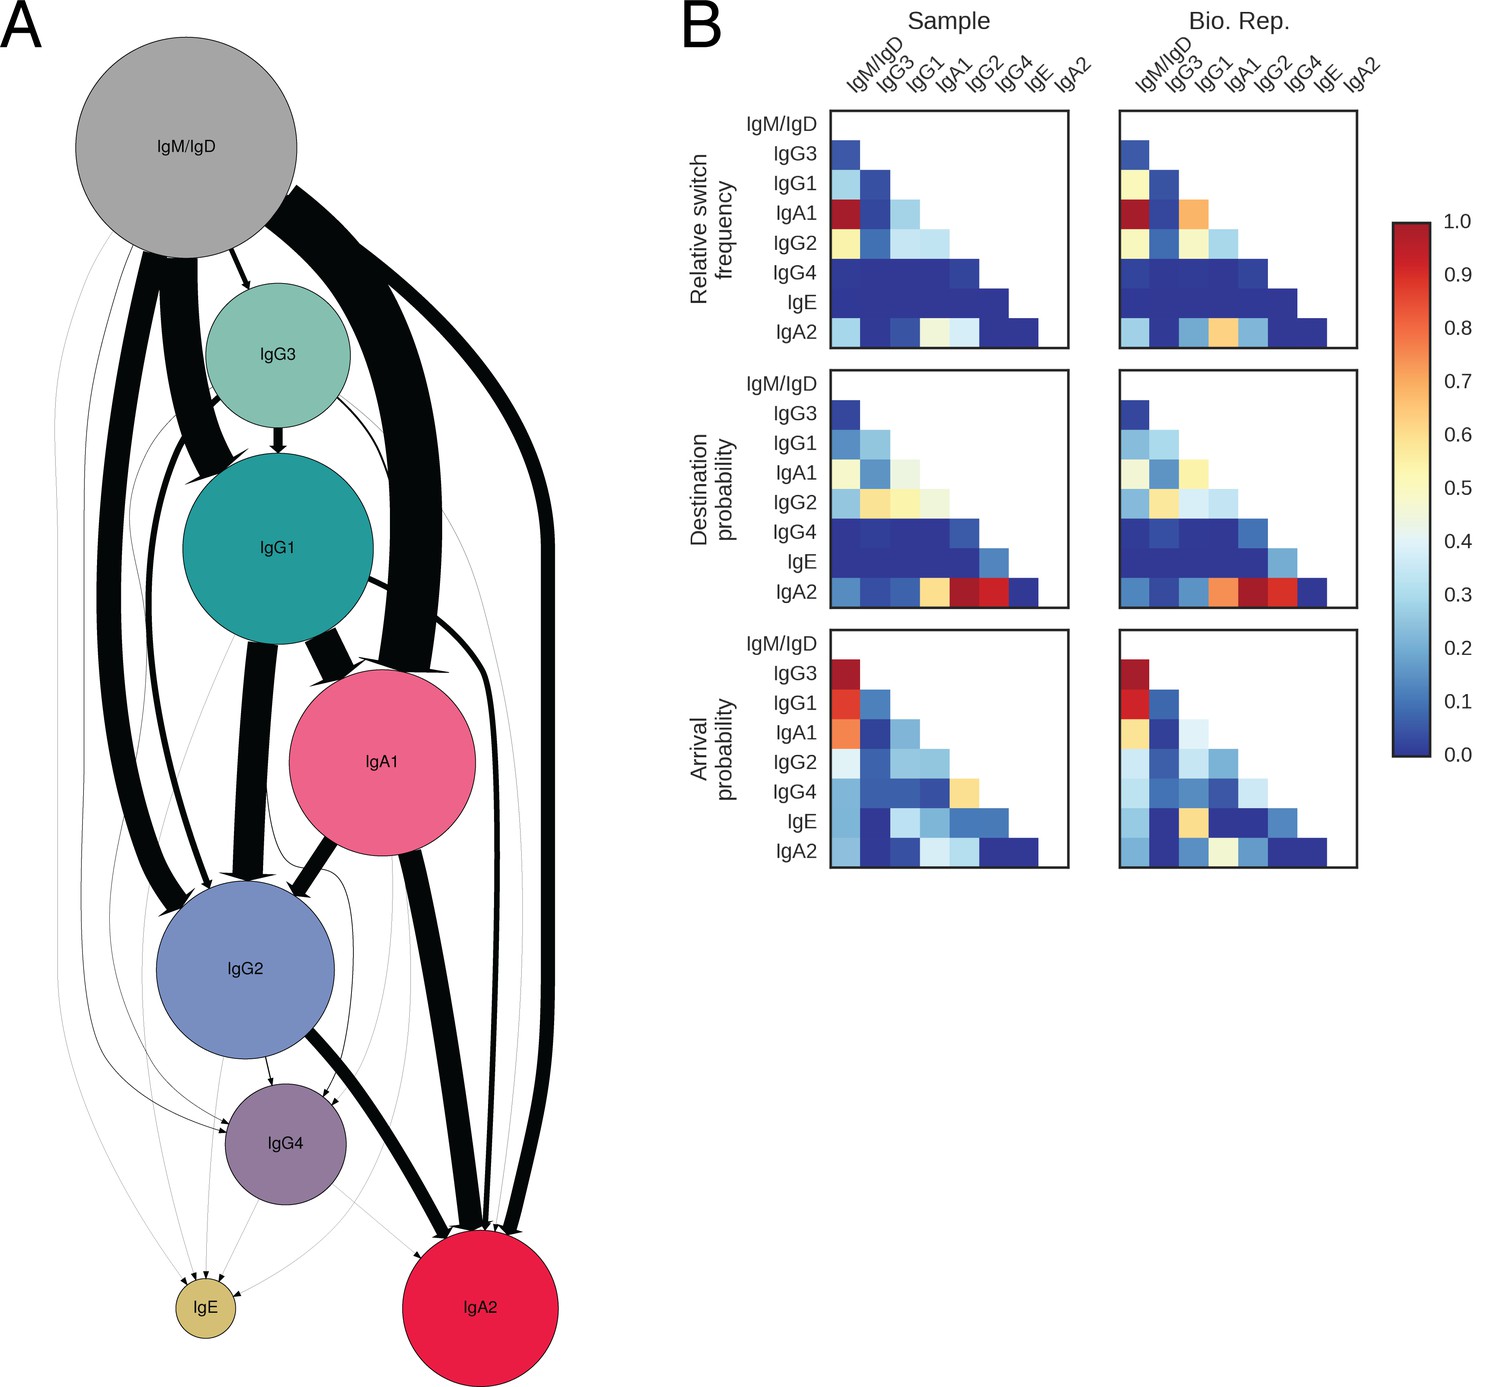
Landscape of human antibody class switching.
(A) State transition diagram of class switching. Classes are indicated as circles and possible switches as arrows. The radius of each circle indicates the relative abundance of the labeled class. The width of each arrow indicates the relative frequency of the switch (also reported in Table 3). Rare classes IgG4 and IgE have been omitted for clarity and are shown in Figure 2—figure supplement 8A. (B) Penetrance of direct switches from IgM/IgD. For each class, the fraction of sequences created by direct switching from IgM is shown (mean ± s.d. across n = 22 subjects for Sample and n = 14 subjects for Bio. Rep.). (C) Rates of CSR. The rate constant of each switch path was estimated by fitting an exponential probability distribution to the distribution of the number of somatic mutations accumulated prior to CSR (Figure 2—figure supplement 11). Distributions of rate constants for switch paths from IgM/IgD to activated classes (gray) and from an activated class to another activated class (white) having ≥500 examplesin both Sample and Bio. Rep. repertoires are shown.
-
Figure 2—source data 1
Counts of class switch events.
Number of events observed for each possible switch from the class indicated by the row to the class indicated by the column. Data from D0 and D28 are provided separately. These data were used to calculate the switching rates depicted in Figure 2A.
- https://doi.org/10.7554/eLife.16578.014
Figure 2—figure supplement 1

Patterns of class switching measured using sequences with identical VDJ sequences but different constant regions are highly similar to those measured using the full lineage reconstruction approach.
(A) Origin of pairs of sequences having identical VDJ sequences but different constant region classes. PCR recombination artifacts (PCR chimeras) were detected by comparing the unique barcodes from each sequencing read. Specifically, a pair of sequences was identified as originating from PCR chimera if at least one V-region barcode was shared between the pair of sequences, accounting for ~5% of sequence pairs. (B) Landscape of antibody class switching measured using only pairs of sequences having identical VDJ sequences but different constant region classes, which did not originate from PCR chimeras. Top panels show the relative frequency of class switch events from the class indicated by the column to the class indicated by the row. Middle panels show the destination probability, which is the probability that a given sequence of class indicated by the column switches to the class indicated to the row. Bottom panels show the arrival probability, which is the probability that a given sequence of class indicated by the row arose via direct switch from the class indicated by the column. Sample (left) and biological replicate (right) are shown. (C) Comparison between the landscape of antibody class switching measured using only pairs of sequences having identical VDJ sequences but different constant region classes and the landscape measured using the full lineage reconstruction approach. The values that define the landscape (relative switch frequencies, destination probabilities, and arrival probabilities) are plotted against the values obtained using all parent-child sequence pairs. Squared Pearson correlation coefficient is shown.
Figure 2—figure supplement 2

Patterns of class switching measured using sequences inheriting all germline mutations from parent are highly similar to those measured using the full lineage reconstruction approach.
(A) Landscape of antibody class switching measured using only sequences inheriting all germline mutations from parent. Top panels show the relative frequency of class switch events from the class indicated by the column to the class indicated by the row. Middle panels show the destination probability, which is the probability that a given sequence of class indicated by the column switches to the class indicated to the row. Bottom panels show the arrival probability, which is the probability that a given sequence of class indicated by the row arose via direct switch from the class indicated by the column. Sample (left) and biological replicate (right) are shown. (B) Comparison between the landscape of antibody class switching measured using only sequences inheriting all germline mutations from parent and the landscape measured using the full lineage reconstruction approach. The values that define the landscape (relative switch frequencies, destination probabilities, and arrival probabilities) are plotted against the values obtained using all parent-child sequence pairs. Squared Pearson correlation coefficient is shown.
Figure 2—figure supplement 3
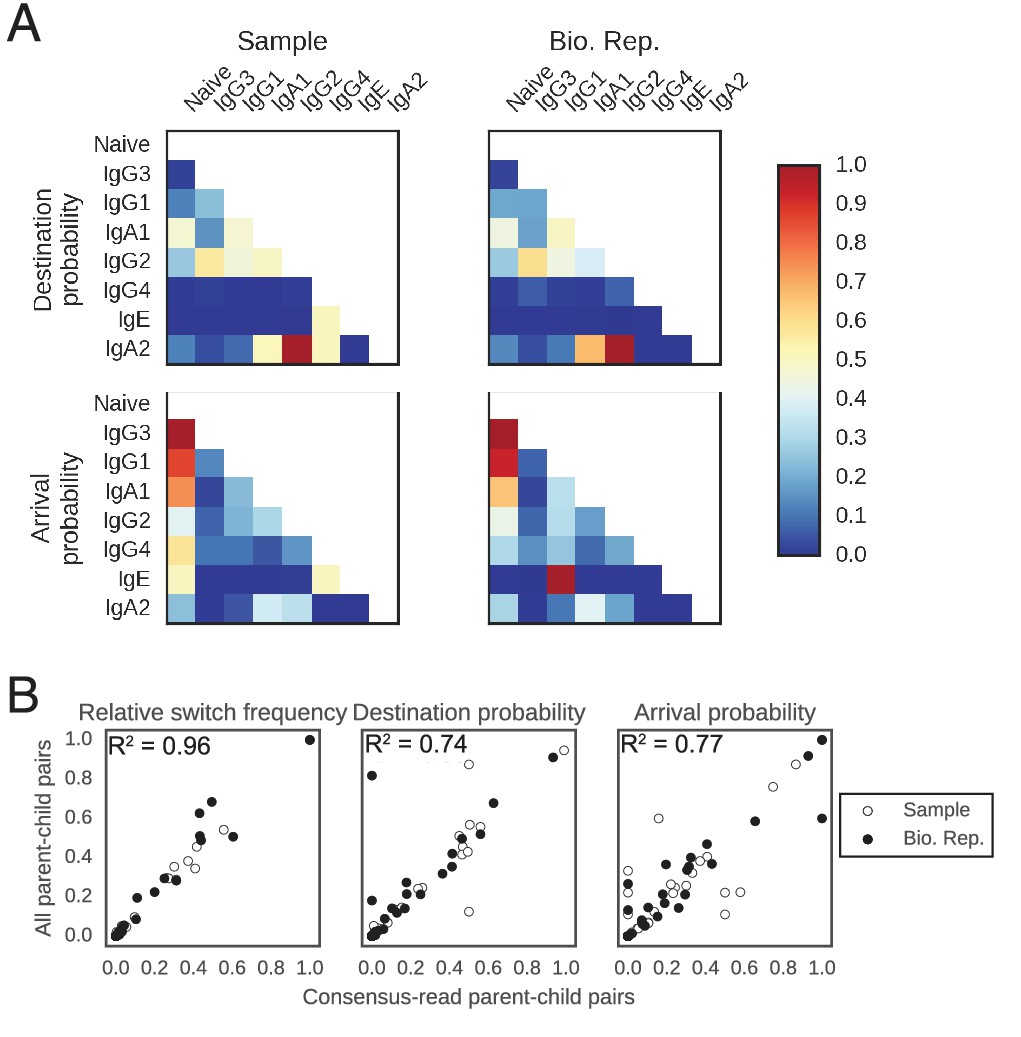
Patterns of class switching measured using sequences supported by consensus reads are highly similar to those measured using the full lineage reconstruction approach.
(A) Landscape of antibody class switching measured using only sequences supported by consensus reads formed from ≥3 sequencing reads. Top panels show the relative frequency of class switch events from the class indicated by the column to the class indicated by the row. Middle panels show the destination probability, which is the probability that a given sequence of class indicated by the column switches to the class indicated to the row. Bottom panels show the arrival probability, which is the probability that a given sequence of class indicated by the row arose via direct switch from the class indicated by the column. Sample (left) and biological replicate (right) are shown. (B) Comparison between the landscape of antibody class switching measured using only sequences supported by consensus reads and the landscape measured using the full lineage reconstruction approach. The values that define the landscape (relative switch frequencies, destination probabilities, and arrival probabilities) are plotted against the values obtained using all parent-child sequence pairs. Squared Pearson correlation coefficient is shown.
Figure 2—figure supplement 4
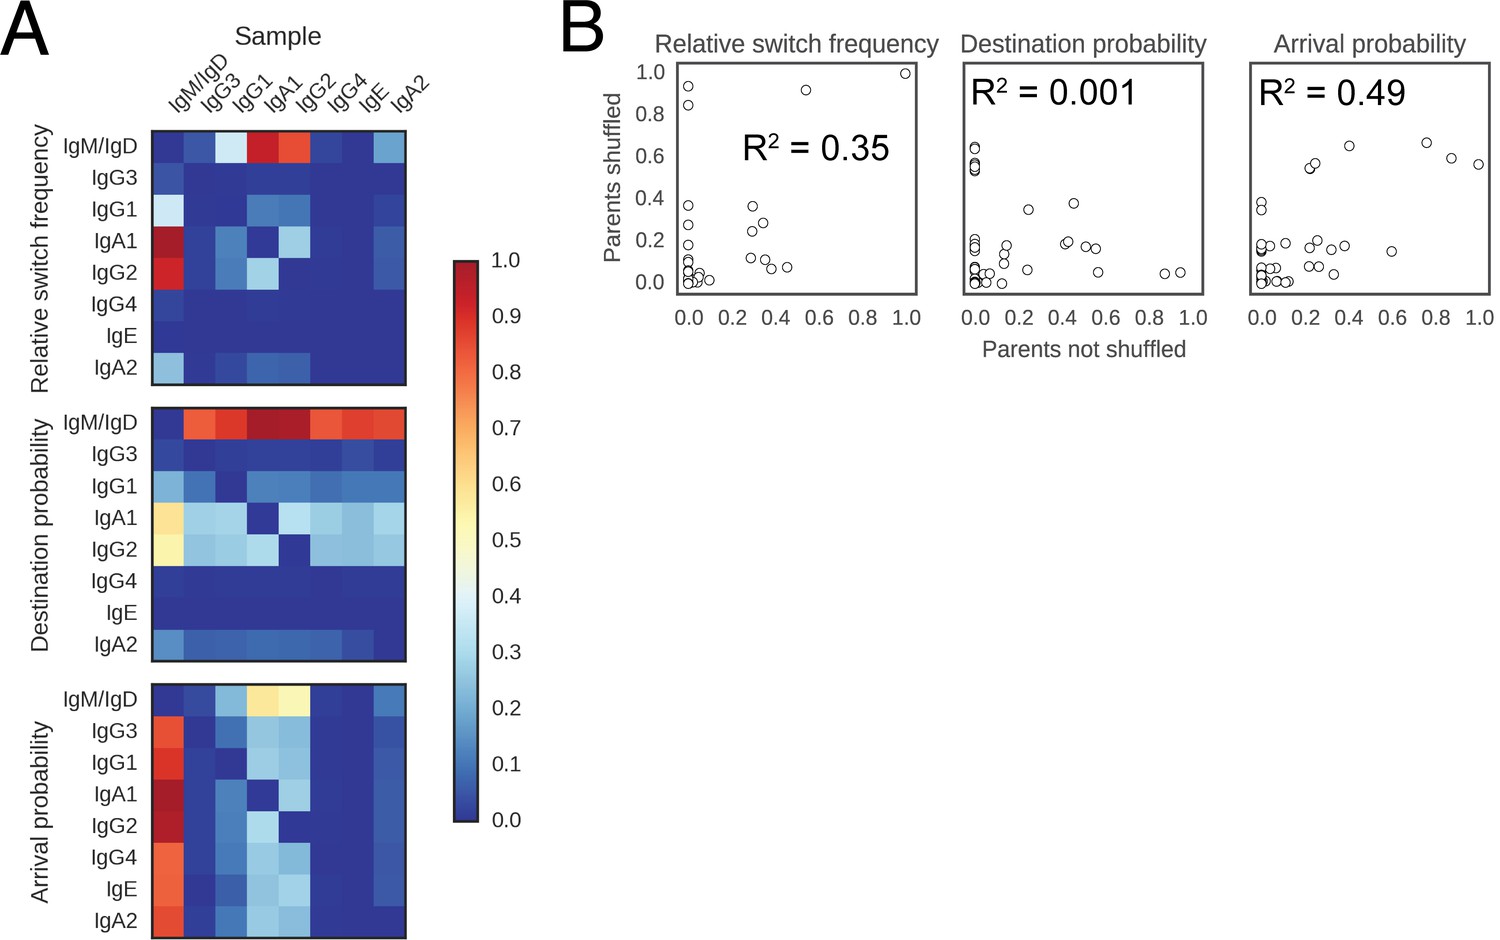
Landscape of class switching cannot be explained by random switching in proportion to the abundance of antibody classes.
(A) Landscape of antibody class switching measured after shuffling parent-child pairs of sequences. Top panel shows the relative frequency of class switch events from the class indicated by the column to the class indicated by the row. Middle panel shows the destination probability, which is the probability that a given sequence of class indicated by the column switches to the class indicated to the row. Bottom panel shows the arrival probability, which is the probability that a given sequence of class indicated by the row arose via direct switch from the class indicated by the column. (B) Comparison of the landscapes of antibody class switching before and after shuffling parent-child pairs of sequences. The values that define the landscapes (relative switch frequencies, destination probabilities, and arrival probabilities) are plotted against each other. Squared Pearson correlation coefficient is shown.
Figure 2—figure supplement 5
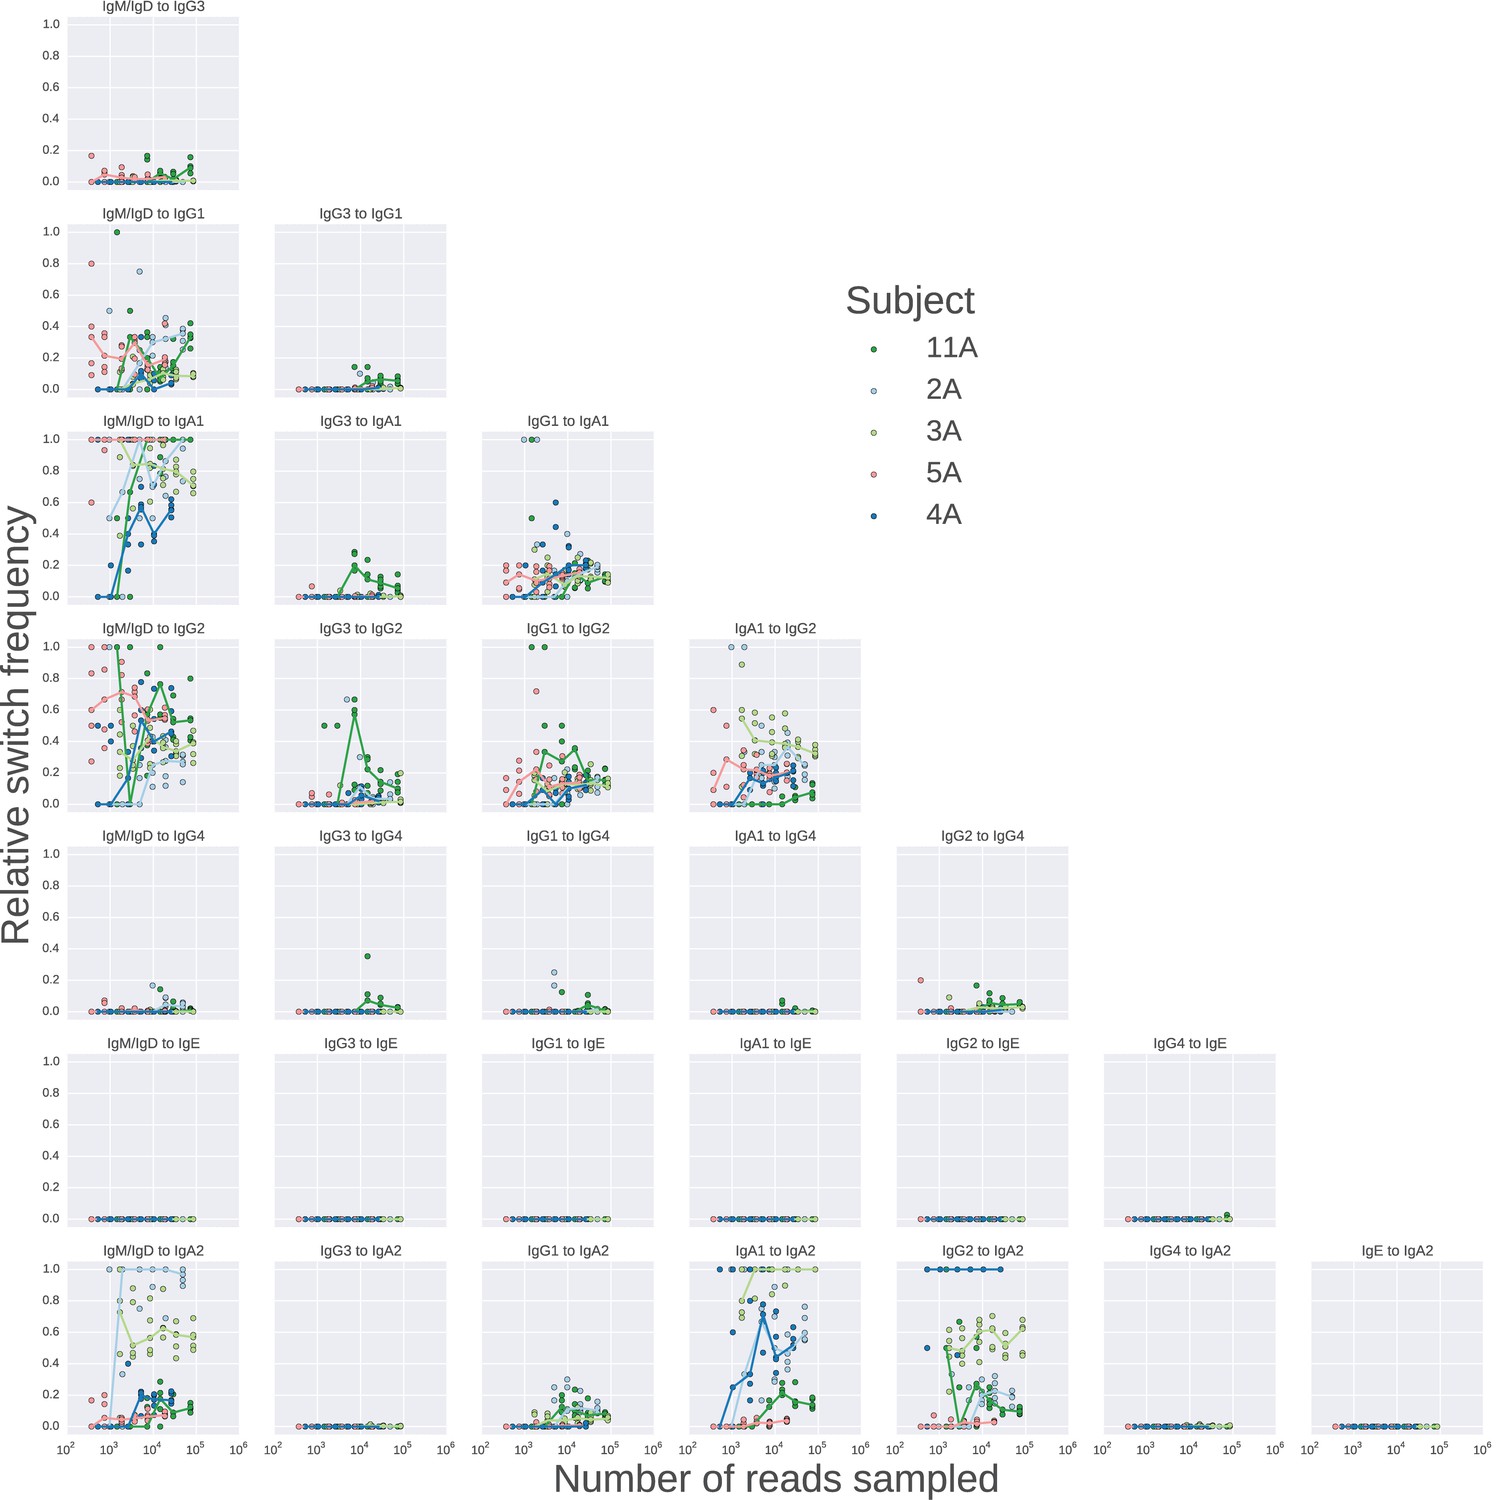
Landscape of class switching saturates with respect to sequencing depth.
Rarefaction analysis of class switching landscapes of five subjects.Sequencing reads were sampled to varying depth, and the class switching landscape was measured in each case, the values of the relative switch frequency are plotted. The relative switch frequency is obtained by dividing the number of switches for a given transition by the maximum number of switches observed for any transition. For each subject, 5 replicate subsamples were performed at each depth, and the values obtained in these replicates are indicated by points, while the line connects medians of the replicates.
Figure 2—figure supplement 6

Rarefaction analysis indicates that switch intermediates are robustly detected.
Sequencing reads were subsampled to varying depth for the five subjects shown in Figure 2—figure supplement 5 with five replicate subsamplings at each depth. Data from all five subjects was pooled and used to calculate the fraction of switches from A to C indicated by the title of each panel that were direct (A -> C) and indirect (A -> B -> C). Median across replicates is indicated by the red line.
Figure 2—figure supplement 7

Class switching landscape is not sensitive to the lineage clustering cutoff parameter.
Clustering to identify clonal lineages of antibodies was performed on all repertoires from D0 with varying values of the clustering cutoff parameter ranging from 0.80 to 0.95. The class switching landscape was then calculated. In this calculation, we included only lineages having ≤2500 sequences in every parameter setting to ensure computational tractability. The landscape in each case is plotted against the landscape measured when the cutoff is 0.95. Squared Pearson correlation is shown.
Figure 2—figure supplement 8
Landscape of class switching in humans.
(A) Class switch state transition diagram including the rare classes IgG4 and IgE. Classes are indicated as pies and possible switches are indicated as arrows. Radius of each pie indicates the relative abundance of the class. The width of each arrow indicates the relative frequency of the switch (also reported in Table 2). (B) Heatmaps showing the class switch landscape as an average across subjects. Top panel shows the relative frequency of class switch events from the class indicated by the column to the class indicated by the row. Middle panel shows the destination probability, which is the probability that a given sequence of class indicated by the column switches to the class indicated to the row. Bottom panel shows the arrival probability, which is the probability that a given sequence of class indicated by the row arose via direct switch from the class indicated by the column. Sample (left) and biological replicate (right) are shown.
Figure 2—figure supplement 9
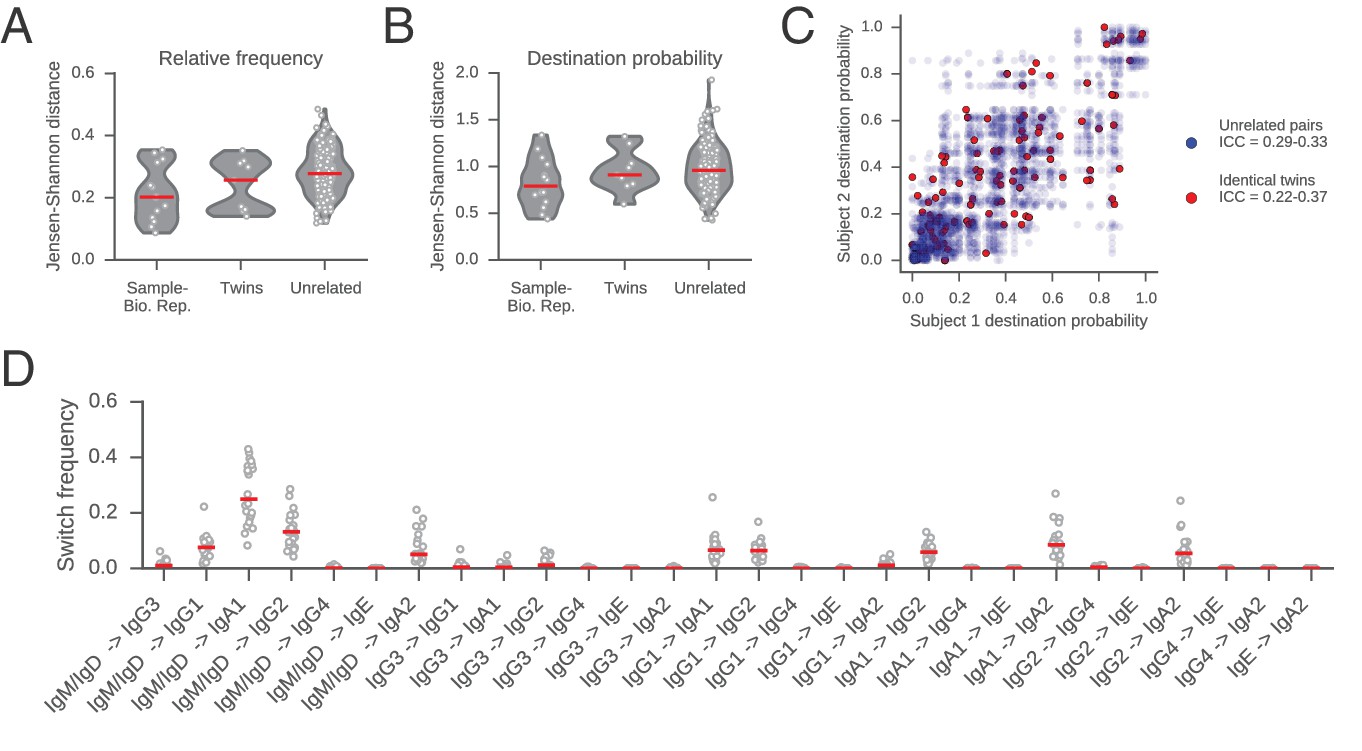
Comparisons of class switch landscapes across individuals.
(A and B) Differences between class switch landscapes (measured by Jensen-Shannon distance). Distances were calculated between the vectors representing (A) relative switch frequency or (B) destination probability. Lane 1 compares the two biological replicates for each subject. Lanes 2 and 3 compare pairs of subjects (identical twins or unrelated individuals). Median is indicated by red line. (C) Comparison of class switching landscapes of identical twins and unrelated pairs of subjects. Destination probabilities of identical twin pairs (red) and all possible pairs of unrelated subjects (blue) are plotted against one another. Intraclass correlation coefficient (ICC) for twins and unrelated pairs was calculated using bootstrap resampling of pairs of subjects (1000 replicates) and reported in the legend (5th to 95th percentile range). (D) Comparison of the relative switch frequency of all possible class switches across subjects. Each point indicates the relative frequency of the switch indicated on the x-axis for an individual subject. Median is indicated by red line. Relative frequency of all switches is similar across all subjects.
Figure 2—figure supplement 10

Class switching landscapes of individual subjects.
(A) Relative switch frequency, (B) destination probability, and (C) arrival probability are shown for each subject. Twins are shown on the same row and zygosity is indicated by row label.
Figure 2—figure supplement 11
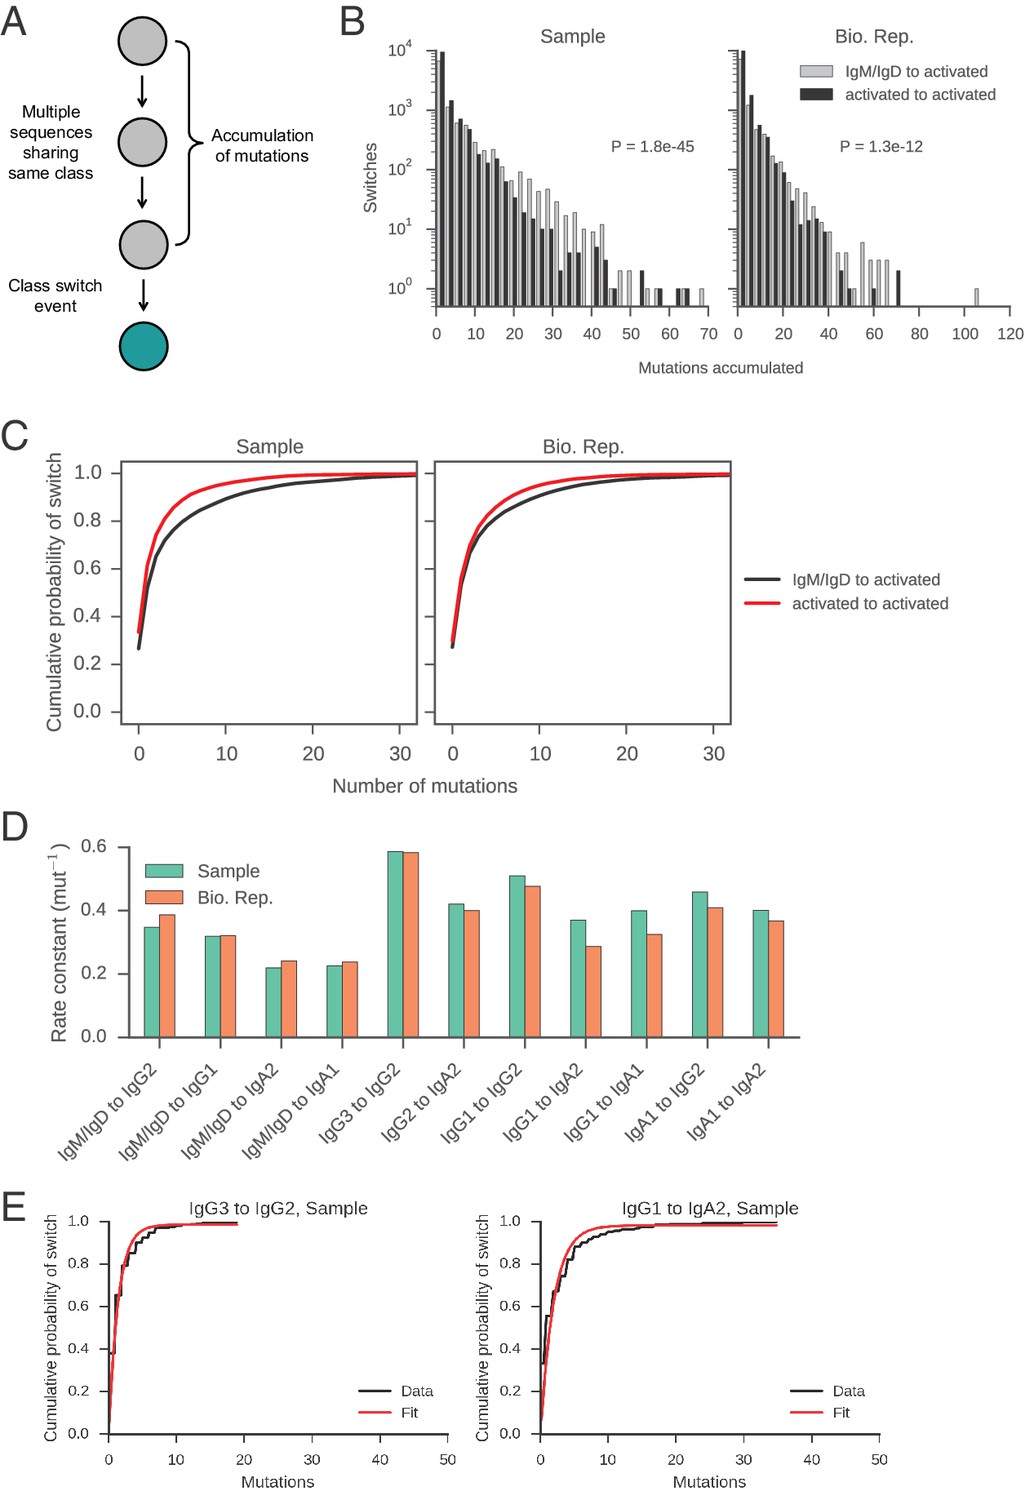
Measurement of rates of class switching.
(A) Motifs analyzed to characterize the rate of CSR. (B) Distributions of mutations accumulated prior to class switching. Switches from IgM/IgD to activated classes (IgG, IgA, IgE) are plotted separately from switches between activated classes, as indicated by color. The p value of Kolmogorov-Smirnov test, two-sample comparing these two distributions is shown. (C) Cumulative probability of class switching as mutations accumulate. Origin and destination of class switch are indicated by color. (D) Rate constants of class switching along all switch paths where we observed >250 direct switches. Exponential distributions were fitted to the distributions of the number of mutations accumulated prior to class switching (see examples in panel E) and the rate constant was extracted. (E) Examples of exponential distributions (modified to have an additional parameter for non-zero y-intercept [CDF(x) = 1 – exp(-ax) + b]) fitted to the empirical distributions of the number of mutations accumulated prior to class switching. Fit was performed using the curve_fit function in the scipy.optimize module in Python, which implements the Levenberg-Marquardt nonlinear least squares algorithm. Rate constants of the fitted exponential distributions are shown in panel D.
Figure 3 with 7 supplements

Class switch fates of closely related sequences are correlated and lose coherence as somatic mutations accumulate.
(A) Concordance between the class switch fates of closely related sequences having ≤2 substitutions from their common progenitor, as measured using Yule’s Q. Distinct switch paths are indicated on the x-axis. Bars show standard deviation of the concordance Q betweenpairs of unrelated sequences, which were obtained by shuffling (1000 replicates). (B) Concordance between the class switch fates of pairs of sequences plotted by their relatedness, as measured by number of mutations from their common progenitor. For comparison, red shading indicates the probability density of concordance between unrelated sequence pairs obtained by shuffling (1000 replicates). To account for variation due to sampling statistics, the number of pairs at each level of relatedness was preserved during shuffling.
Figure 3—figure supplement 1
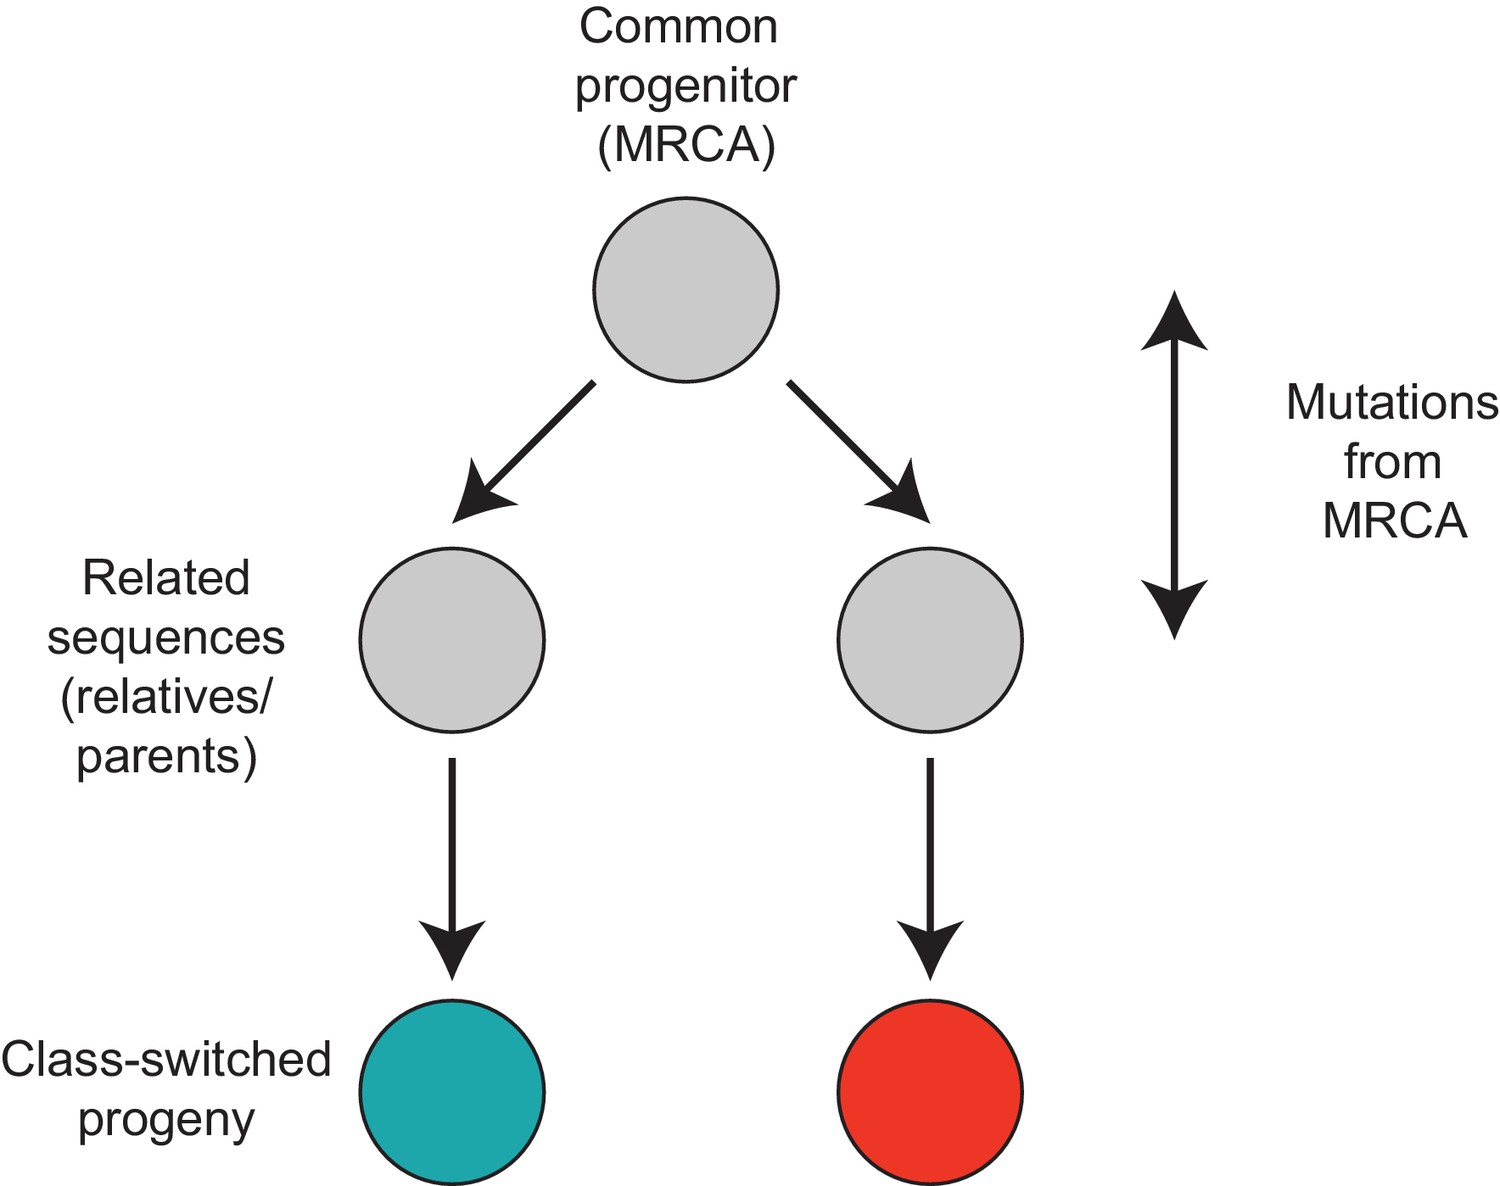
Motif analyzed to characterize the class switch fates of clonally related cells.
https://doi.org/10.7554/eLife.16578.028
Figure 3—figure supplement 2
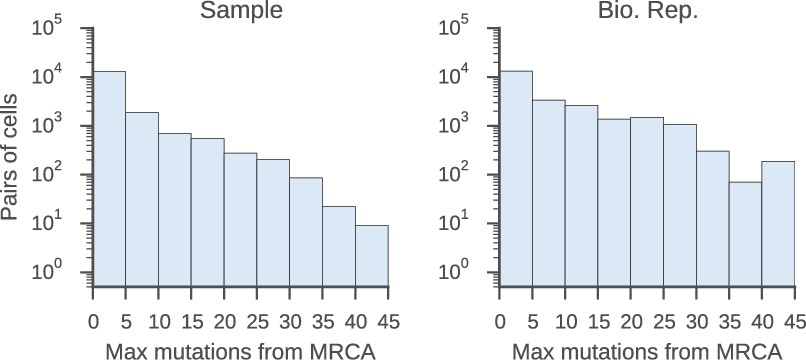
Relatedness of the pairs of cells used to characterize the class switch fates of clonally related cells in vivo.
Distributions of relatedness between pairs of related sequences measured by the maximum number of mutations among the two sequences to their common progenitor (most recent common ancestor [MRCA]).
Figure 3—figure supplement 3

Estimation of significance of correlations between class switch fates of related sequences.
Plots show examples of distributions of Yule’s Q for unrelated sequence pairs obtained by shuffling with 1000 replicates, together with fitted Gaussian distribution and observed value of Yule’s Q for the most closely related cells (2 or fewer mutations from common progenitor) for comparison. We calculated the exact one-sided p value of the observed value of Yule’s Q as the probability of the Gaussian random variable taking a value greater than or equal to the observed value of Q.
Figure 3—figure supplement 4
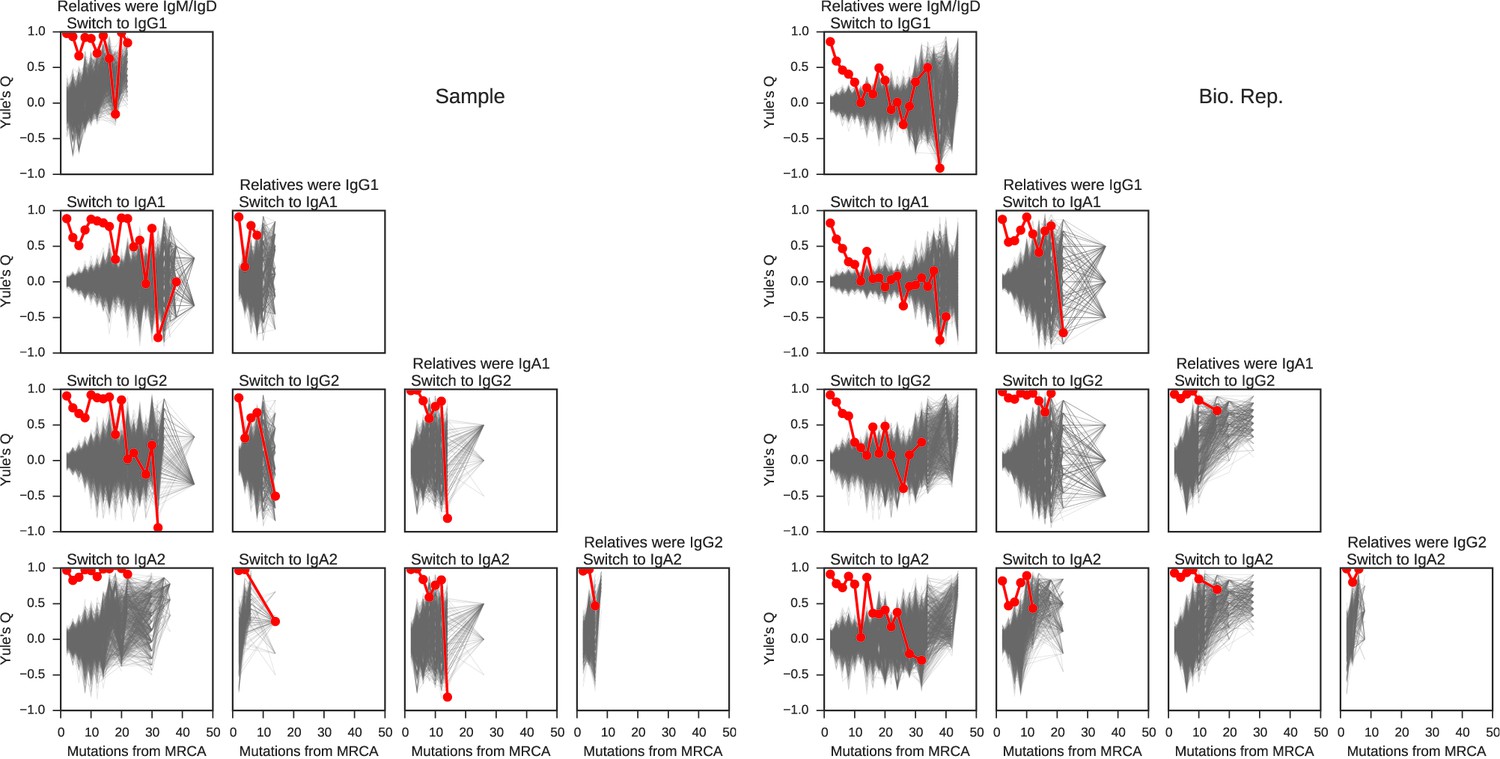
Concordance between the class switch fates of related sequences plotted against relatedness as measured by number of mutations from common progenitor for all common switch paths.
Column header indicates class of the related sequences. Title of each panel indicates the downstream switch destination. Observed data are shown in red. Gray lines indicate concordance between unrelated sequence pairs obtained by shuffling (1000 replicates) while preserving the number of pairs having each degree of relatedness to account for variation due to sampling statistics.
Figure 3—figure supplement 5
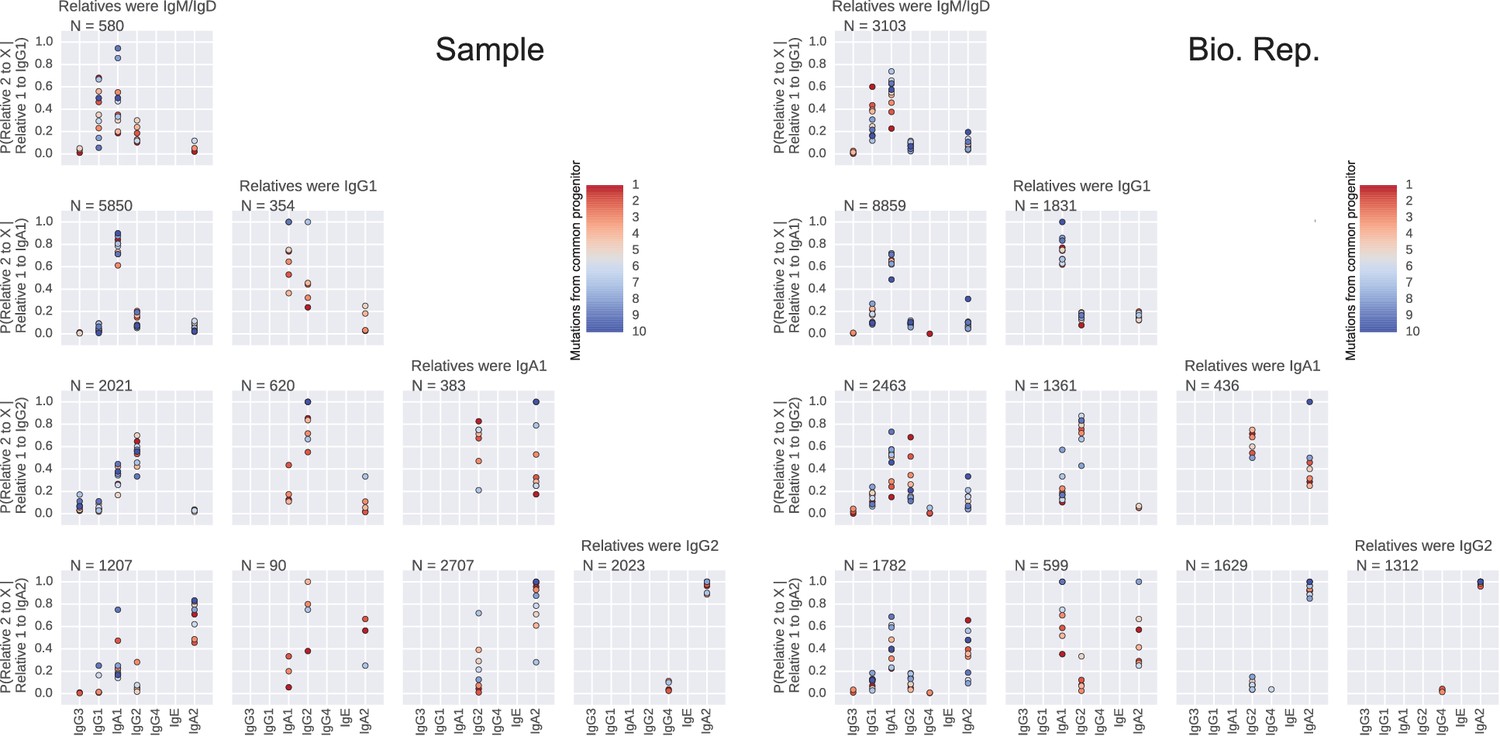
Closely related B cells often switch to the same class.
Probability distributions of class switch fate conditioned upon the fate of closely related cell. These plots represent the probability distribution of class switch fate of 'Related cell 2', given the fate of 'Related cell 1'. Column header indicates class of the related sequences. X-axis label of each row indicates the class switch fate of 'Related cell 1'. Color indicates the relatedness of the cells, measured by the number of mutations from common progenitor. Number of sequence pairs contributing to each panel N is shown. Right panel shows original samples and left panel shows biological replicates.
Figure 3—figure supplement 6

Branch lengths are not associated with particular switching events.
Fraction of switches from naïve classes (IgM/IgD) to each possible destination class is shown as a function of mutational distance (bins in increments of 2 mutations) from (A) common progenitor (most recent common ancestor [MRCA]) to parent cell, and (B) parent cell to switched progeny.
Figure 3—figure supplement 7

Mutational distances among related cells, common progenitors, and switched progeny are not correlated.
Number of mutations from (A) common progenitor (most recent common ancestor [MRCA]) to cell 1 and cell 2, (B) cell 1 to switched progeny and cell 2 to switched progeny, and (C) common progenitor to cell and cell to switched progeny. The mutational distances compared in each panel are indicated by the colored edges in the motif on the right (x-axis, orange; y-axis, blue). Color indicates number of pairs of related sequences in each bin. Squared Pearson correlation values are shown.
Figure 4 with 2 supplements
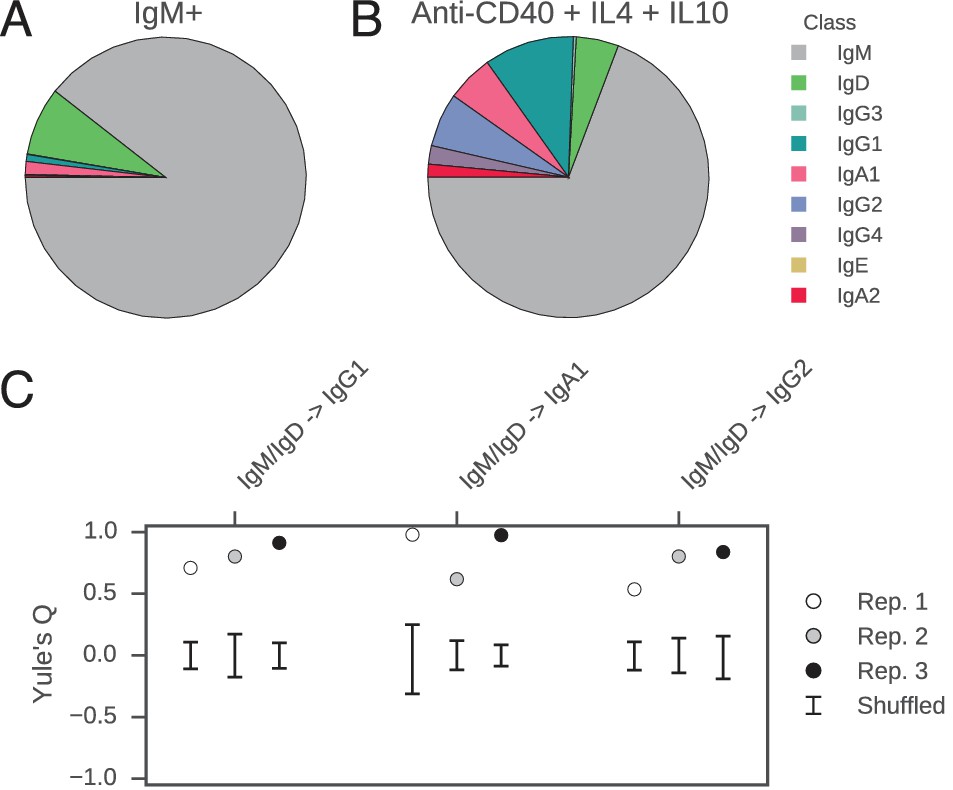
Class switch fates of closely related sequences are correlated in purified B cells induced to class switch in vitro.
(A) Class composition of CD19+ IgM+ cells used to initiate cell culture as measured by sequencing of the IGH locus. (B) Class composition of cells after culture for 8 days in the presence of multimeric CD40L, IL-4 and IL-10 (mean of three replicates). (C) Concordance between class switch fates of closely related sequences having ≤2 mutations from their common progenitor measured using Yule’s Q. Distinct switch paths are indicated on the x-axis. Bars show standard deviation of the concordance Q for unrelated pairs of sequences, which were obtained by shuffling (1000 replicates). Results of three replicate experiments are indicated by color.
Figure 4—figure supplement 1
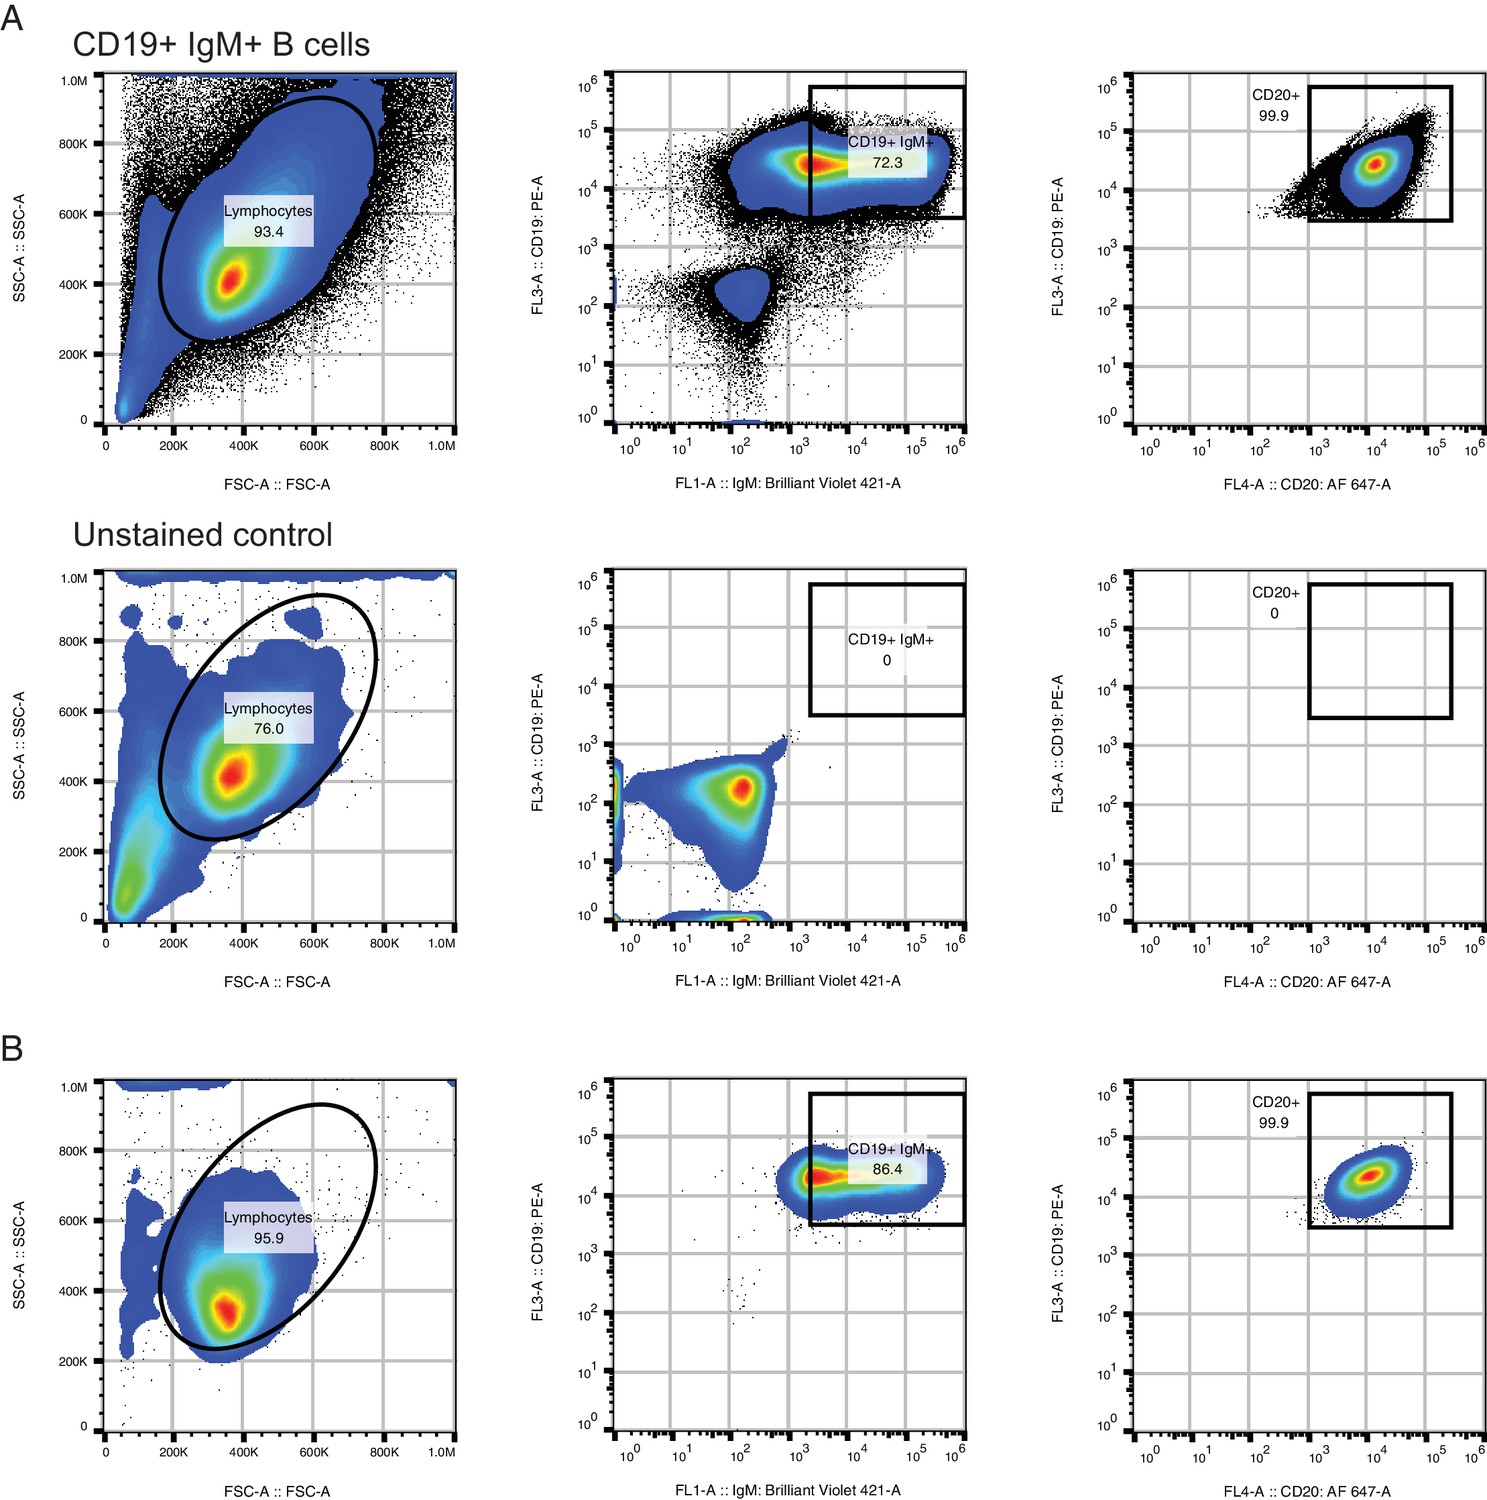
Purification of CD19+ IgM+ B cells for in vitro culture.
(A) Fluorescence activated cell sorting (FACS) procedure for purifying CD19+ IgM+ B cells. Purified B cell populations obtained using RosetteSep were stained with CD19-PE, CD20-AF647, IgM-BV421, passed through a 40 um filter, and sorted on a Sony SH800 instrument (top). Fluorescence intensity cutoffs for CD19+ and IgM+ were set based on an unstained control (bottom). Analysis of CD20-AF647 fluorescence confirmed that 99.9% of CD19+ IgM+ cells were CD20+. Abbreviations: PE, phycoerythrin; AF647, AlexaFluor 647; BV421, Brilliant Violet 421. (B) Analysis of sorted CD19+ IgM+ populations immediately after sort to confirm purity.
Figure 4—figure supplement 2

Relatedness of the pairs of cells used to characterize the class switch fates of clonally related cells in vitro.
Distributions of relatedness between pairs of sister sequences, as measured by the maximum number of mutations among the two sequences to their common progenitor (most recent common ancestor [MRCA]).
Tables
Table 1
Number of unique sequences of each class analyzed in this study.
| Class | Sequences (Sample) | Sequences (Bio. Rep.) |
|---|---|---|
IgM | 2,423,262 | 1,899,952 |
IgD | 70,169 | 60,510 |
IgG3 | 16,981 | 15,625 |
IgG1 | 117,025 | 143,053 |
IgA1 | 276,189 | 231,477 |
IgG2 | 213,574 | 176,484 |
IgG4 | 6,751 | 9,672 |
IgE | 278 | 262 |
IgA2 | 63,374 | 62,251 |
Table 2
Counts of pairs of sequences sharing identical VDJ sequences, but different constant region sequences. Data from all subjects including both original and biological replicate samples are shown.
| IgM/IgD | IgG3 | IgG1 | IgA1 | IgG2 | IgG4 | IgE | IgA2 | |
|---|---|---|---|---|---|---|---|---|
IgG3 | 744 | |||||||
IgG1 | 6440 | 2234 | ||||||
IgA1 | 6374 | 338 | 4676 | |||||
IgG2 | 3210 | 1325 | 5673 | 2291 | ||||
IgG4 | 50 | 46 | 129 | 3 | 61 | |||
IgE | 2 | 0 | 2 | 4 | 0 | 0 | ||
IgA2 | 1619 | 30 | 427 | 2581 | 1630 | 2 | 0 |
Table 3
Number of parent-child pairs having each possible pair of classes. Data from all subjects and both biological replicates are included. Total number of parent-child pairs is 3,304,346. Number in parentheses indicates the relative frequency of each class switch.
| Parent | ||||||||
|---|---|---|---|---|---|---|---|---|
Child | IgM/IgD | IgG3 | IgG1 | IgA1 | IgG2 | IgG4 | IgE | IgA2 |
IgM/IgD | 1,495,250 | |||||||
IgG3 | 2,530(0.09) | 48,357 | ||||||
IgG1 | 19,881(0.74) | 4,726(0.18) | 645,591 | |||||
IgA1 | 26,915(1.00) | 935(0.03) | 17,480(0.65) | 493,999 | ||||
IgG2 | 12,695(0.47) | 3,178(0.12) | 15,663(0.58) | 8,028(0.30) | 375,284 | |||
IgG4 | 312(0.01) | 157(0.006) | 342(0.01) | 57(0.002) | 542(0.02) | 16,091 | ||
IgE | 10(0.0004) | 0(0) | 16(0.0006) | 5(0.0002) | 1(0.00004) | 3(0.0001) | 419 | |
IgA2 | 7,344(0.27) | 139(0.005) | 2,934(0.11) | 12,176(0.45) | 6,455(0.24) | 17(0.0006) | 0(0) | 86,814 |
Table 4
Summary of class switch recombination events that have been observed in human cells. Switches that have previously been observed are indicated as 'Known' and the literature references are provided. All of the previous studies demonstrated the existence of switch events by sequencing recombination junctions or switch circles. 'Novel' indicates switches which have not previously been reported that we observed in our dataset of ~35,000 pairs of sequences sharing identical VDJ sequences, but having different constant region genes. 'Not detected' indicates switches that we did not observe in this dataset of identical sequences.
| Source class | |||||||
|---|---|---|---|---|---|---|---|
Destination class | IgM/IgD | IgG3 | IgG1 | IgA1 | IgG2 | IgG4 | IgE |
IgG3 | Known (Fujieda et al., 1995; Malisan et al., 1996) | ||||||
IgG1 | Known (Fujieda et al., 1995; Malisan et al., 1996) | Novel | |||||
IgA1 | Known (Jabara et al., 1993; Zan et al., 1998) | Known (Lin et al., 2014) | Known (Zan et al., 1998) | ||||
IgG2 | Known (Malisan et al., 1996) | Novel | Novel | Novel | |||
IgG4 | Known (Fujieda et al., 1995; Jabara et al., 1993) | Novel | Novel | Novel | Novel | ||
IgE | Known (Jabara et al., 1993; Xiong et al., 2012) | Not detected | Known (Xiong et al., 2012) | Novel | Not detected | Known (Jabara et al., 1993) | |
IgA2 | Known (He et al., 2007; Lin et al., 2014) | Known (Lin et al., 2014) | Known (Lin et al., 2014) | Known (He et al., 2007; Lin et al., 2014) | Known (Lin et al., 2014) | Novel | Not detected |
Table 5
IGH constant region primers.
| Name | Primer (5’ to 3’) |
|---|---|
IgA_08N | TGACTGGAGTTCAGACGTGTGCTCTTCCGATCTNNNNNNNNGGGGAAGAAGCCCTGGAC |
IgA_12N | TGACTGGAGTTCAGACGTGTGCTCTTCCGATCTNNNNNNNNNNNNGGGGAAGAAGCCCTGGAC |
IgG_08N | TGACTGGAGTTCAGACGTGTGCTCTTCCGATCTNNNNNNNNGGGAAGTAGTCCTTGACCA |
IgG_12N | TGACTGGAGTTCAGACGTGTGCTCTTCCGATCTNNNNNNNNNNNNGGGAAGTAGTCCTTGACCA |
IgM_long_8N | TGACTGGAGTTCAGACGTGTGCTCTTCCGATCTNNNNNNNNGAAGGAAGTCCTGTGCGAG |
IgM_long_12N | TGACTGGAGTTCAGACGTGTGCTCTTCCGATCTNNNNNNNNNNNNGAAGGAAGTCCTGTGCGAG |
IgE_long_8N | TGACTGGAGTTCAGACGTGTGCTCTTCCGATCTNNNNNNNNAAGTAGCCCGTGGCCAGG |
IgE_long_12N | TGACTGGAGTTCAGACGTGTGCTCTTCCGATCTNNNNNNNNNNNNAAGTAGCCCGTGGCCAGG |
IgD_long_8N | TGACTGGAGTTCAGACGTGTGCTCTTCCGATCTNNNNNNNNTGGGTGGTACCCAGTTATCAA |
IgD_long_12N | TGACTGGAGTTCAGACGTGTGCTCTTCCGATCTNNNNNNNNNNNNTGGGTGGTACCCAGTTATCAA |
Table 6
IGH variable region primers.
| Name | Primer (5’ to 3’) |
|---|---|
Primer1_1_70 | ACACTCTTTCCCTACACGACGCTCTTCCGATCTNNNNNNNNSCAGCTGGTGCAGTCTGG |
Primer1/3/5_70 | ACACTCTTTCCCTACACGACGCTCTTCCGATCTNNNNNNNNGTGCAGCTGGTGGAGTCTG |
Primer2 | ACACTCTTTCCCTACACGACGCTCTTCCGATCTNNNNNNNNTCACCTTGAAGGAGTCTGG |
Primer4_1 | ACACTCTTTCCCTACACGACGCTCTTCCGATCTNNNNNNNNTGCAGCTGCAGGAGTCG |
Primer4_2 | ACACTCTTTCCCTACACGACGCTCTTCCGATCTNNNNNNNNGTGCAGCTACAGCAGTGG |
Primer6 | ACACTCTTTCCCTACACGACGCTCTTCCGATCTNNNNNNNNGTACAGCTGCAGCAGTCA |
Download links
A two-part list of links to download the article, or parts of the article, in various formats.
Downloads (link to download the article as PDF)
Open citations (links to open the citations from this article in various online reference manager services)
Cite this article (links to download the citations from this article in formats compatible with various reference manager tools)
Lineage tracing of human B cells reveals the in vivo landscape of human antibody class switching
eLife 5:e16578.
https://doi.org/10.7554/eLife.16578


