The selectivity of the Na+/K+-pump is controlled by binding site protonation and self-correcting occlusion
- The University of Chicago, United States
- Texas Tech University Health Sciences Center, United States
Figures
Figure 1
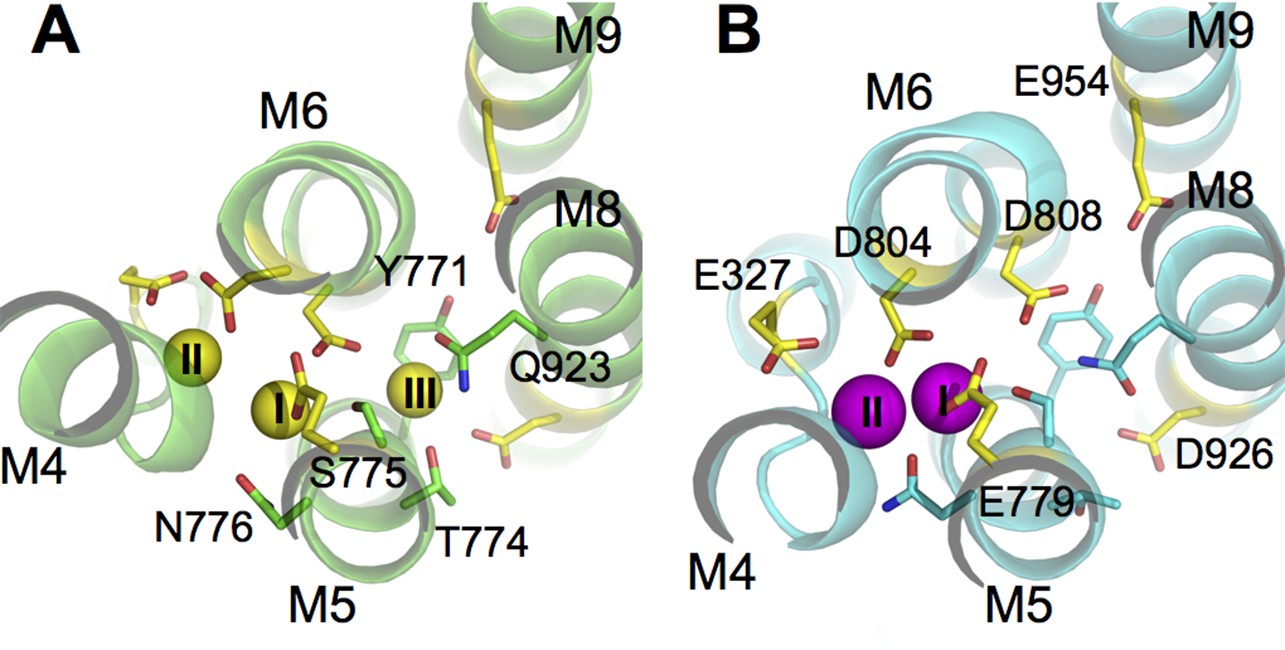
The ion binding sites in (A) Na3·E1·(ADP·Pi) (PDBID 3WGV) and (B) E2(K2) (PDBID 2ZXE) states.
Only the transmembrane helices M4, M5, M6, M8, and M9 from the α subunit are shown. Residues in the binding site are highlighted in stick presentation with those protonatable colored in yellow. Na+ (yellow) and K+ (magenta) ions are in spheres. The binding site number indices are presented on top of the ions. The view is from the extracellular side towards the intracellular side. The figure is produced with PyMOL (DeLano, 2002).
Figure 2
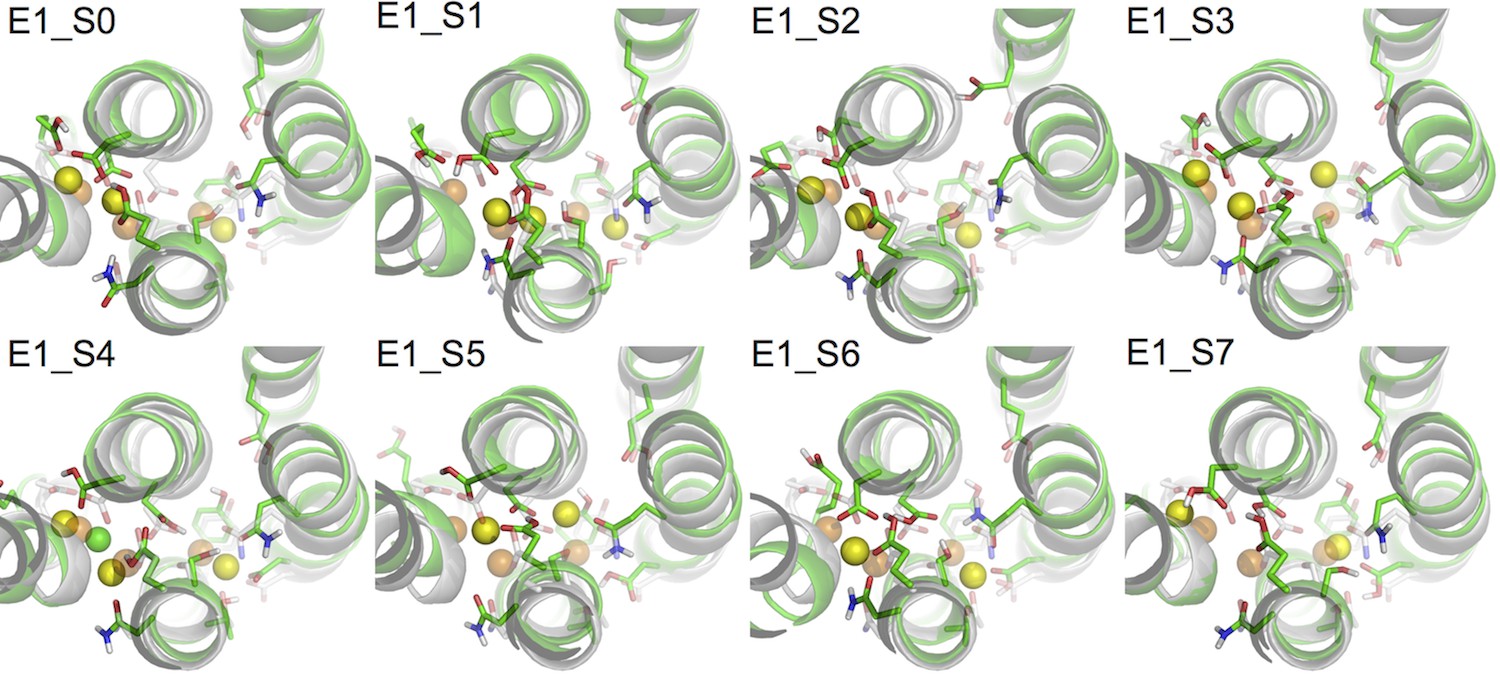
Comparison of snapshots at the end of the MD simulations (green) and the crystal structure of Na3·E1·(ADP·Pi) (PDBID 3WGV) (white).
The binding site residues are shown in stick presentation and the ions are shown as spheres. Binding site Na+ ions from the MD simulation snapshots are in yellow, and the crystal Na+ are in orange. A Cl- ion has entered the binding site in system E1_S4 during the simulation and is shown in green. The view is from the extracellular side towards the intracellular side. The figure is produced with PyMOL (DeLano, 2002).
Figure 3

Ion binding sites selectivity characterized by in states Na3E1·(ADP·Pi) (blue) and E2(K2) (red).
Sites I (square), II (circle), and III (triangle) are distinguished by their shapes. Values from the previous calculations with a smaller reduced region are shown as empty symbols. All the binding site glutamates (i.e., E327, E779, and E954) are kept protonated. The protonation states of the binding site aspartates are indicated below the plot.
Figure 4

Charge-neutralizing mutations and their impact on binding site selectivity.
The wildtype protein is colored black and the mutations in E1 (blue) and E2 (red) are colored differently. Sites I (square), II (circle), and III (triangle) are distinguished by their shapes. The empty symbols represent values calculated from the outward facing P-E2 model.
Figure 5
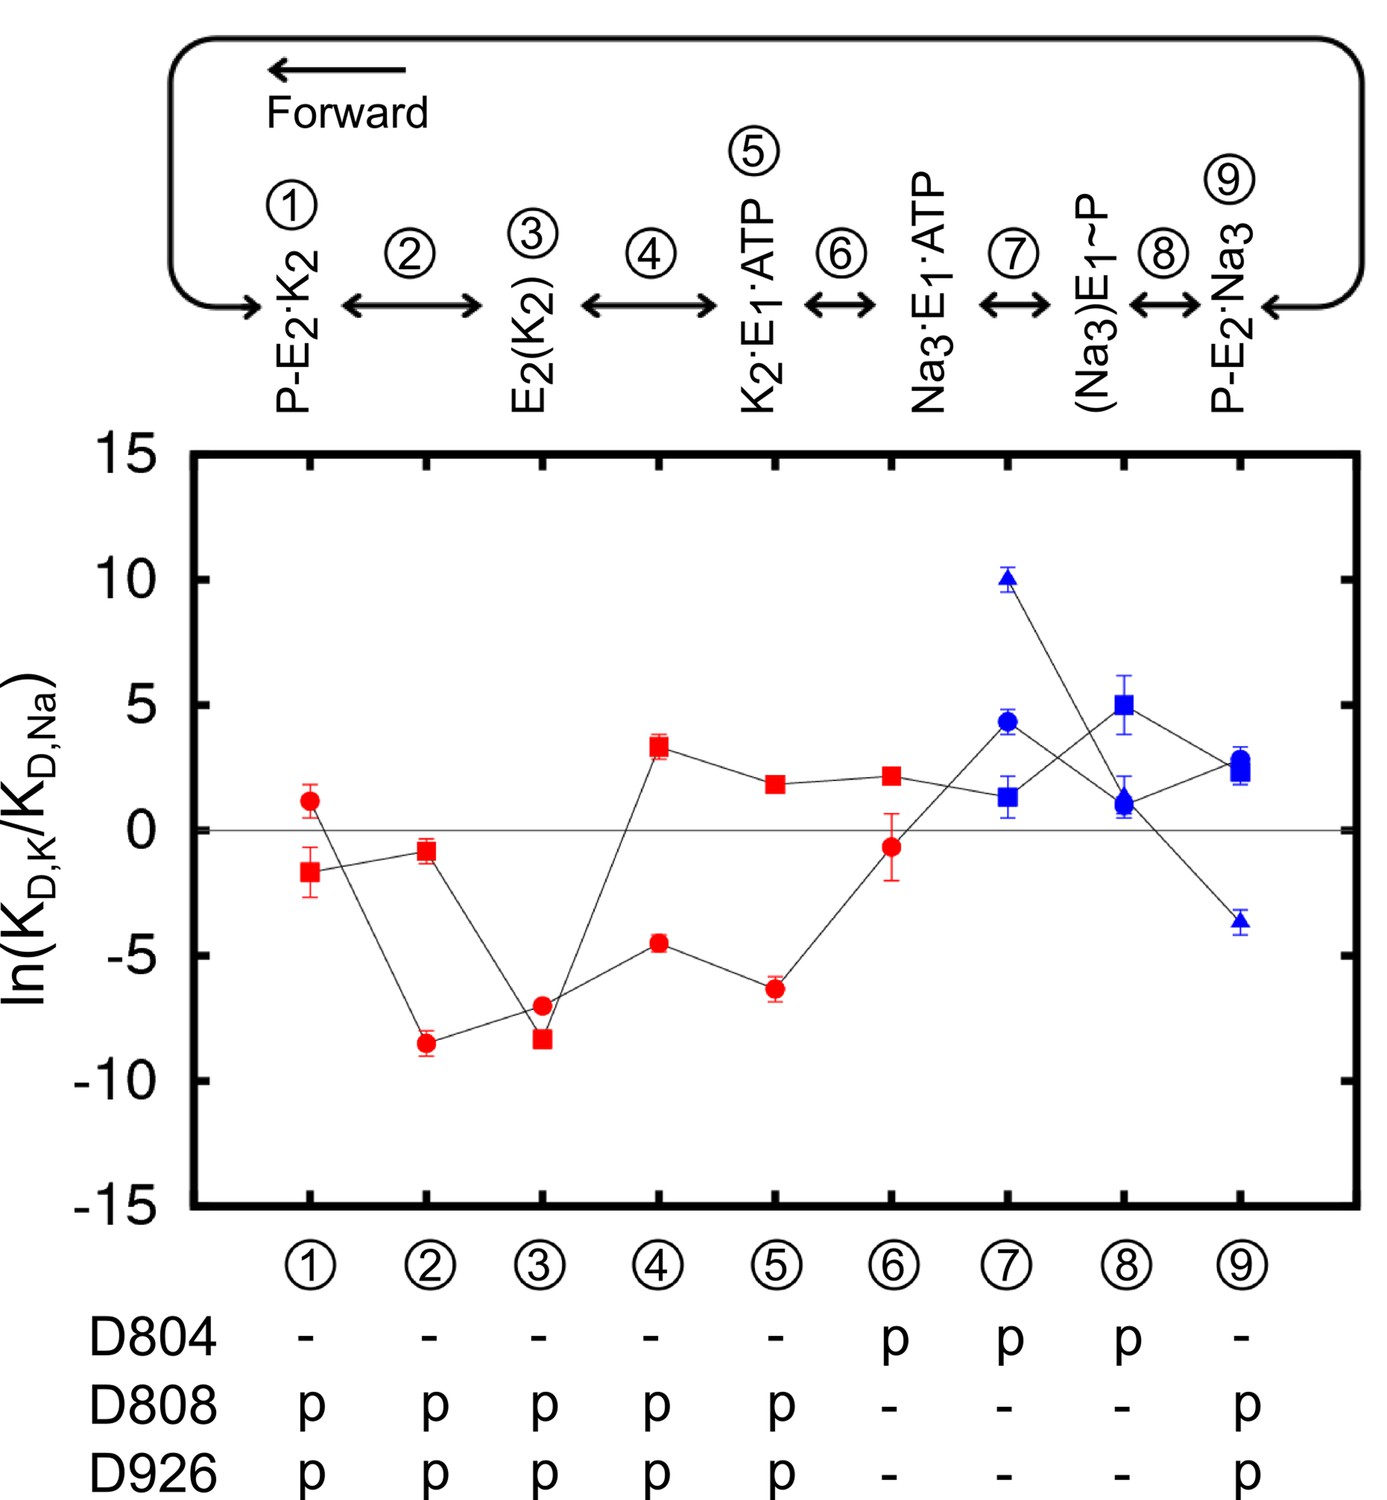
The binding site ion selectivity along the pump cycle.
Sites I (square), II (circle), and III (triangle) are distinguished by their shapes. Different colors indicate whether there are two (red) or three (blue) sites that are included in the calculations. The conformational states are numbered and stamped along the pump cycle in the top panel. The protonation states of the aspartates are indicated below.
Figure 6
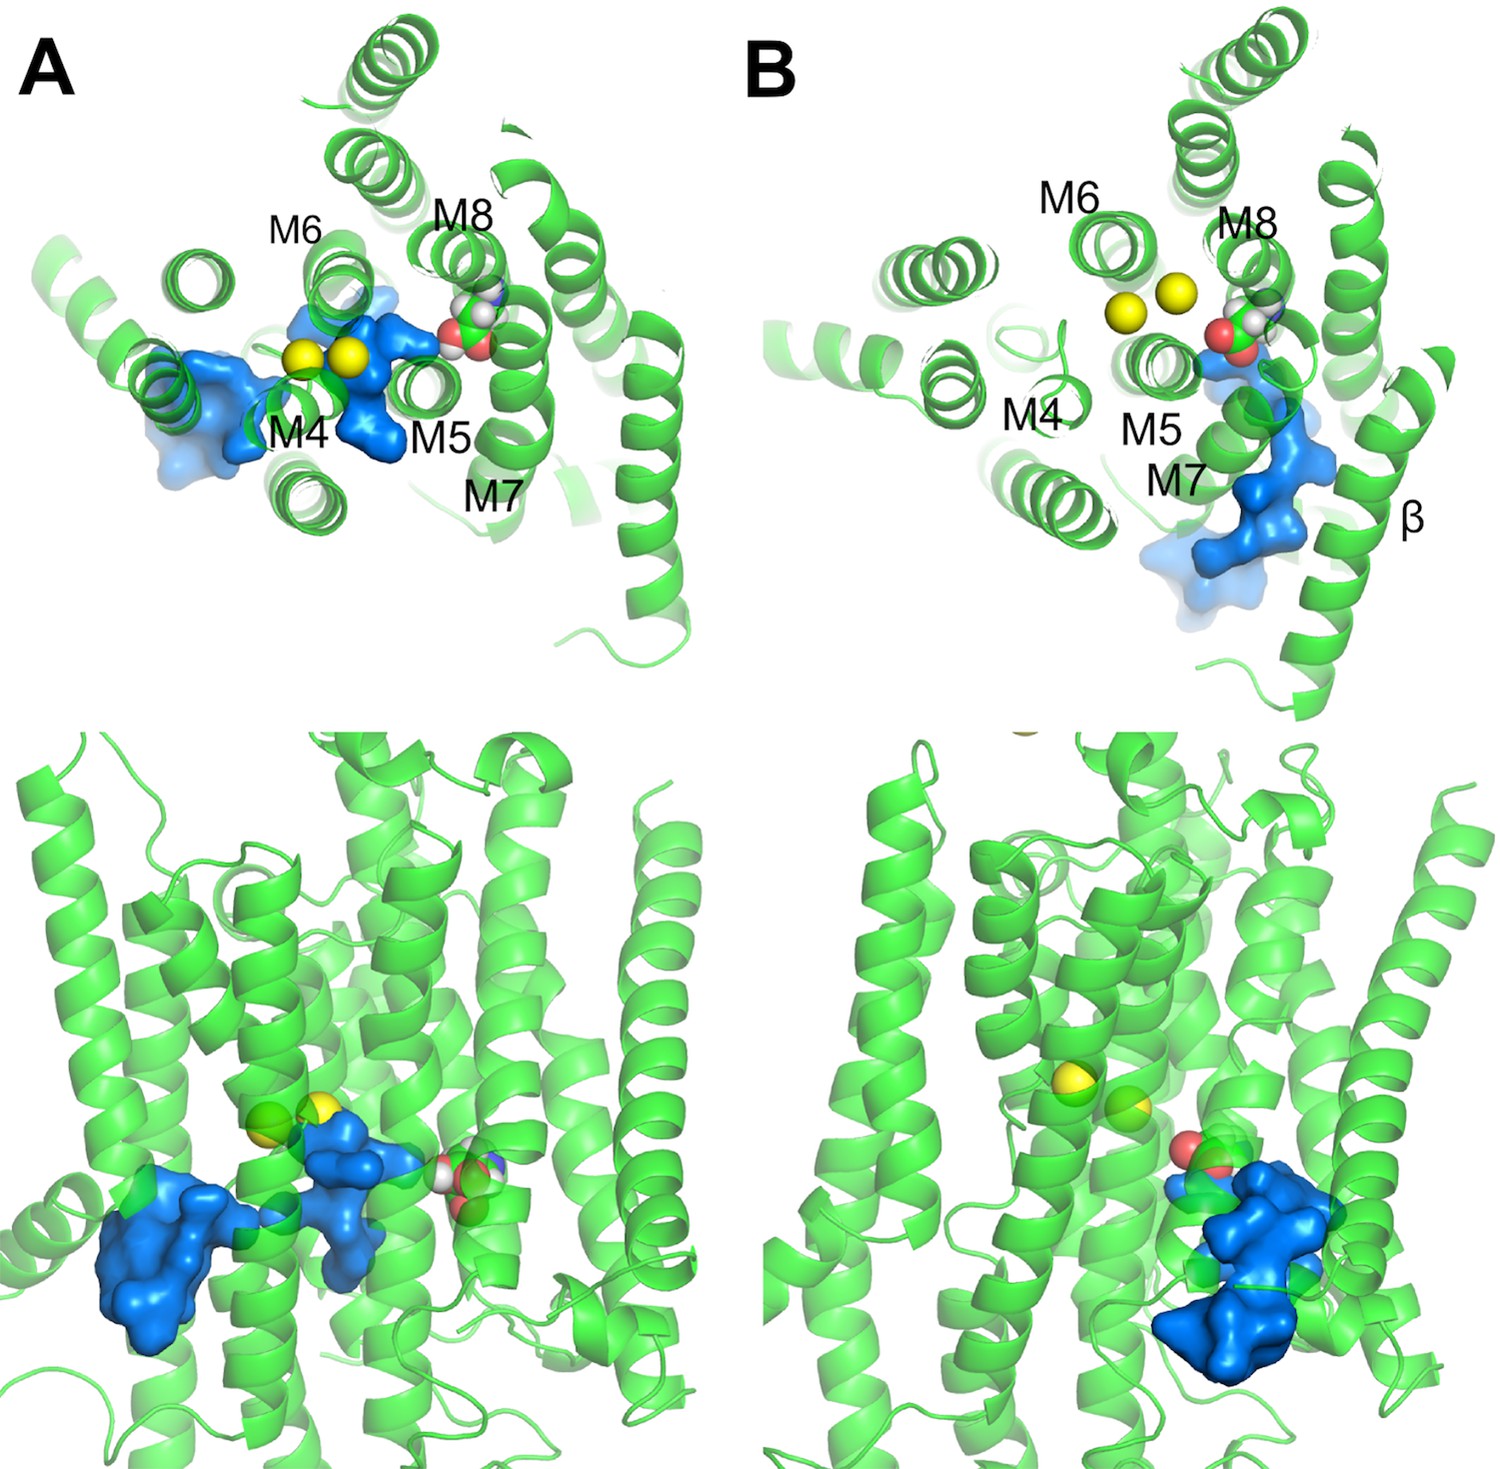
Water pathways from the cytoplasm to D926 in (A) Na2·E1·(ADP·Pi) and (B) P-E2·Na2.
The top (top) and side (bottom) views are shown. D926 are shown in sphere representation. Water path connecting the cytoplasm and the D926 are in surface representation colored in blue. Na+ (yellow) are shown as spheres.
Figure 7
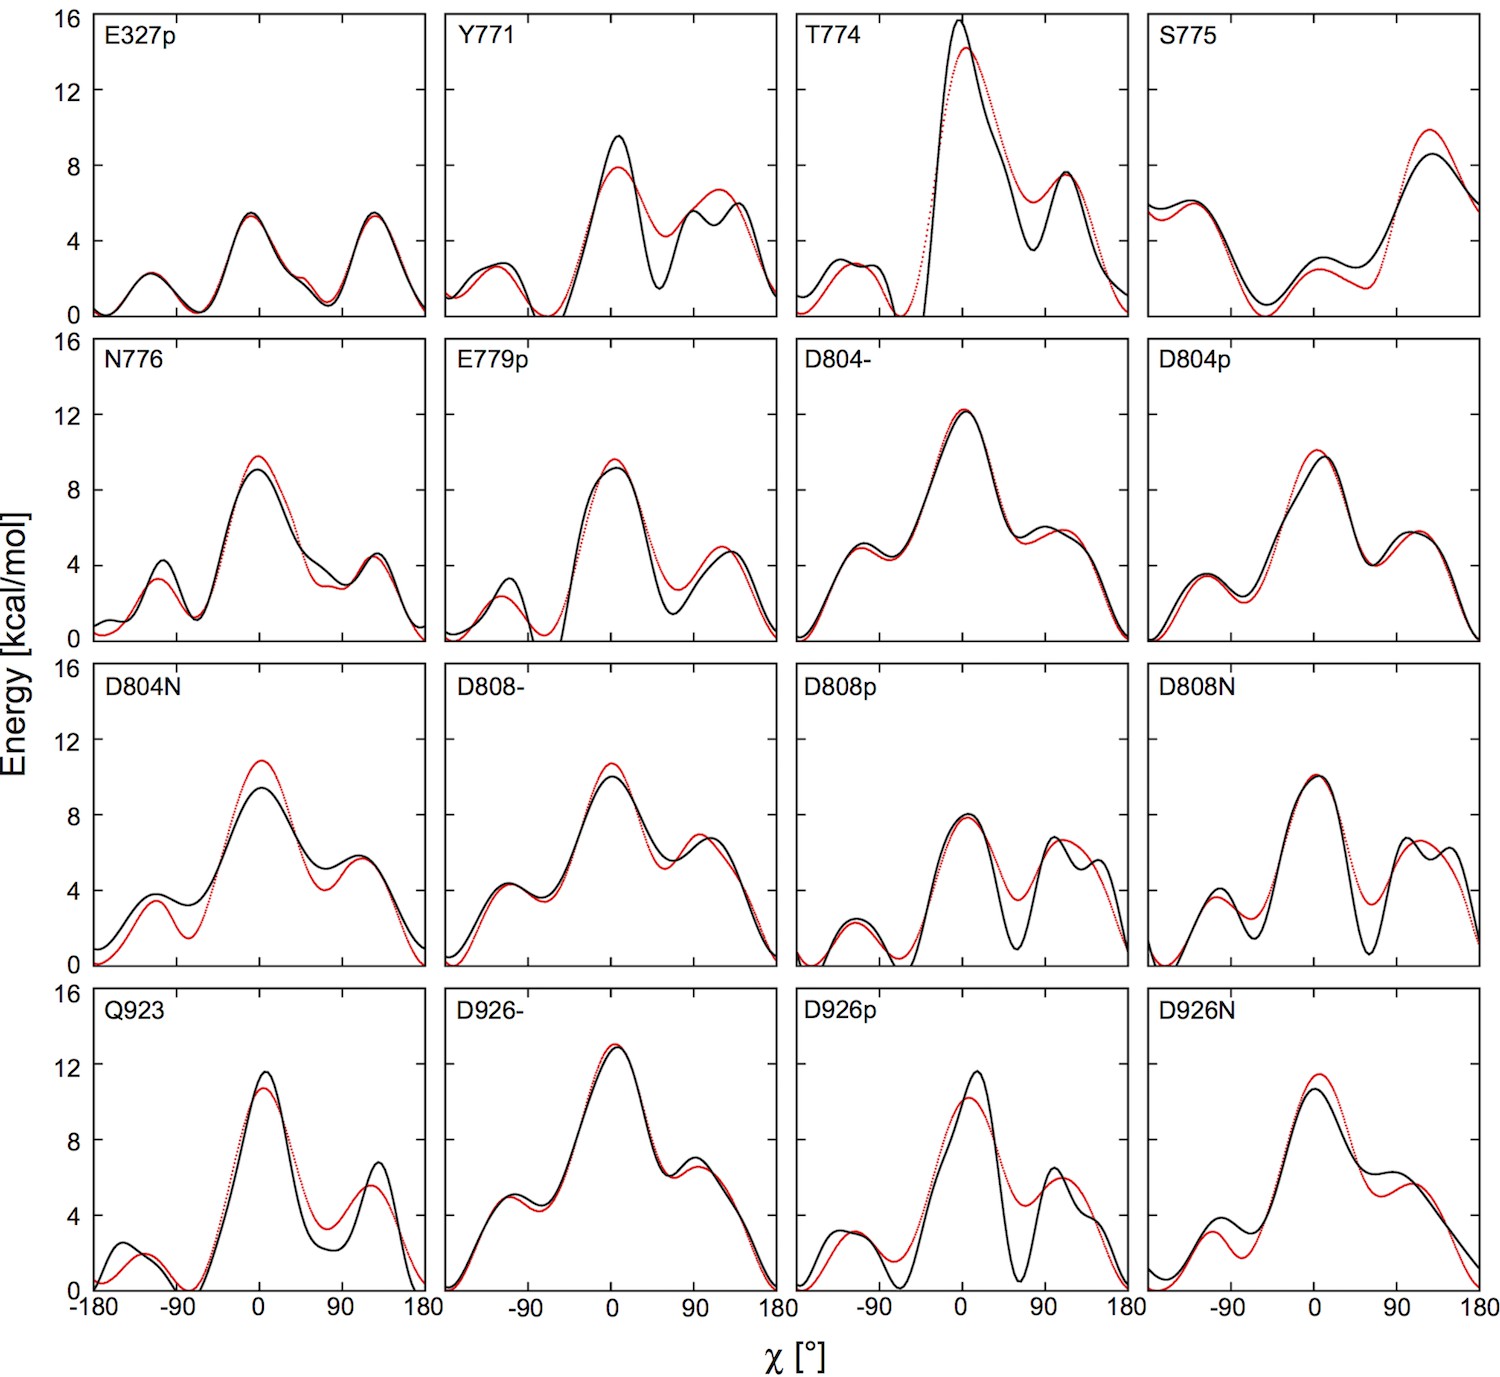
Fitting the potential of mean force (red) with the boosting potential, (black).
https://doi.org/10.7554/eLife.16616.015Tables
Table 1
Atoms coordinating the binding site ions in the crystal structures and from the MD simulations. O is the backbone carbonyl oxygen atom. OG and OG1 are the hydroxyl oxygen atoms in serine and threonine. OD1 and OD2 are the carboxyl oxygen atoms in asparate. OE1 and OE2 are the carboxyl oxygen atoms in glutamate. OH2 is the water oxygen.
| E1 | Site I | Site II | Site III | |||||||||
|---|---|---|---|---|---|---|---|---|---|---|---|---|
| x-ray | MD | x-ray | MD | x-ray | MD | |||||||
| A323 | O | T772 | OG1 | V322 | O | E779 | OE1 | Y771 | O | Y771 | O | |
| E779 | OE1 | T772 | O | V325 | O | D804 | OD1 | T774 | O | T774 | O | |
| D808 | OD1 | N776 | OD1 | E327 | OE2 | D808 | OD1 | Q923 | OE1 | Q923 | OE1 | |
| D808 | OD1 | D804 | OD1 | Water | OH2 | D926 | OD1 | |||||
| D808 | OD2 | Water | OH2 | |||||||||
| E2 | Site I | Site II | ||||||||||
|---|---|---|---|---|---|---|---|---|---|---|---|---|
| x-ray | MD | x-ray | MD | |||||||||
| T772 | O | S775 | OG | V322 | O | A323 | O | |||||
| S775 | OG | N776 | OD1 | V325 | O | V325 | O | |||||
| N776 | OD1 | D804 | OD2 | E779 | OE2 | E779 | OE1 | |||||
| D804 | OD2 | D804 | OD2 | D804 | OD1 | |||||||
Table 2
pKa values of binding site titratable residues calculated from the crystal structures. The crystal structure resolution is given below the PDB ID.
| E1 | E2 | |||
|---|---|---|---|---|
| 3WGV 2.8 Å | 4HQJ 4.3 Å | 2ZXE 2.4 Å | 3B8E 3.5 Å | |
| D804 | 5.9(6.2)* | 11.1 (11.2) | 3.7 | 0.8 (2.1) |
| D808 | 3.5(3.1) | 3.7 (3.7) | 5.8 | 6.8 (6.6) |
| D926 | 6.4(7.2) | 5.6 (5.6) | 8.9 | 7.4 (8.4) |
| E327 | 11.0(11.3) | 5.7 (5.6) | 8.3 | 10.8 (9.9) |
| E779 | 9.9(8.4) | 7.4 (7.3) | 10.7 | 9.6 (8.0) |
| E954 | 9.6(9.7) | 9.2 (9.2) | 10.3 | 10.7 (10.3) |
-
*If two chains are present in the same asymmetric unit, the pKa of the same residue in the other chain is shown inside the parenthesis.
Table 3
Summary of the all-atom simulation systems and the FEP/H-REMD reduced systems. The binding site residues E327, E779, and E954 were kept protonated in all the systems.
| Systems | Binding site residues | Simulation time (ns) | |||
|---|---|---|---|---|---|
| MD | FEP/H-REMD | ||||
| Wildtype | |||||
| E1_S0 | D804- | D808- | D926- | 140 | 2 × 128 |
| E1_S1 | D804p | D808- | D926- | 300 | 2 × 128 |
| E1_S2 | D804- | D808p | D926- | 139 | 2 × 128 |
| E1_S3 | D804- | D808- | D926p | 503 | 2 × 128 |
| E1_S4 | D804p | D808p | D926- | 94 | |
| E1_S5 | D804p | D808- | D926p | 87 | |
| E1_S6 | D804- | D808p | D926p | 277 | |
| E1_S7 | D804p | D808p | D926p | 141 | |
| E2_S0 | D804- | D808p | D926- | 193 | 2 × 128 |
| E2_S1 | D804- | D808p | D926p | 350 | 2 × 128 |
| P-E2_S0 | D804- | D808p | D926p | 100 | 2 × 128 |
| Mutants | |||||
| E1_S1M | D804N | D808- | D926- | 40 | 2 × 128 |
| E1_S2M | D804- | D808N | D926- | 40 | 2 × 128 |
| E1_S3M | D804- | D808- | D926N | 40 | 2 × 128 |
| E2_S1M | D804N | D808- | D926p | 40 | 2 × 128 |
| E2_S2M | D804- | D808N | D926p | 40 | 2 × 128 |
| E2_S3M | D804- | D808- | D926N | 40 | 2 × 128 |
| P-E2_S1M | D804N | D808- | D926p | 40 | 2 × 128 |
| P-E2_S2M | D804- | D808N | D926p | 40 | 2 × 128 |
Table 4
The binding free energy difference () at all the binding sites calculated from FEP/H-REMD simulations. The energy values are in kcal/mol.
| Systems | Binding sites | ||
|---|---|---|---|
| I | II | III | |
| Wildtype | |||
| E1_S0 | 0.1 ± 0.1 | 4.5 ± 0.1 | 1.8 ± 0.1 |
| E1_S1 | 3.7 ± 0.2 | 1.7 ± 0.1 | 4.7 ± 0.1 |
| E1_S2 | -3.5 ± 1.0 | 3.8 ± 0.3 | 2.9 ± 0.6 |
| E1_S3 | -1.5 ± 0.2 | 4.7 ± 0.4 | -0.5 ± 0.3 |
| E2_S0 | -4.4 ± 0.3 | -6.1 ± 0.0 | |
| E2_S1 | -3.5 ± 0.1 | -6.1 ± 0.1 | |
| P-E2_S0 | -1.0 ± 0.6 | 0.7 ± 0.4 | |
| Mutants | |||
| E1_S1M | 1.4 ± 0.1 | 5.7 ± 0.0 | 2.4 ± 0.1 |
| E1_S2M | 4.3 ± 0.7 | 6.6 ± 0.6 | 5.2 ± 0.9 |
| E1_S3M | -0.6 ± 0.1 | 1.7 ± 0.1 | 0.0 ± 0.0 |
| E2_S1M | -3.3 ± 0.3 | -5.7 ± 0.0 | |
| E2_S2M | -5.4 ± 0.1 | -6.4 ± 0.1 | |
| E2_S3M | -3.8 ± 0.1 | -7.2 ± 0.1 | |
| P-E2_S1M | 0.8 ± 0.9 | 1.9 ± 0.4 | |
| P-E2_S2M | 1.6 ± 0.5 | 1.9 ± 0.4 | |
Table 5
Selectivity in the form of at the binding sites along the pump cycle from state P-E2·K2 to P-E2·Na3. The energies are in kcal/mol.
| *p/- | -/p | p/p | p/p | p/p | ||||||||
|---|---|---|---|---|---|---|---|---|---|---|---|---|
| s/- | -/s | s/p | p/s | s/s | ||||||||
| (1) P-E2.K2 | -0.7 ± 1.0 | 0.1 ± 0.5 | -1.0 ± 0.6 | 0.7 ± 0.4 | -0.6 ± 0.7 | |||||||
| (2) Intermediate | 0.0 ± 0.4 | 1.8 ± 1.3 | -0.5 ± 0.3 | -5.1 ± 0.3 | -4.0 ± 0.9 | |||||||
| (3) E2(K2) | -4.9 ± 0.8 | -3.0 ± 0.5 | -5.0 ± 0.2 | -4.2 ± 0.1 | -9.3 ± 0.5 | |||||||
| (4) Intermediate | 0.6 ± 0.7 | -0.8 ± 0.3 | 2.0 ± 0.3 | -2.7 ± 0.2 | -1.6 ± 0.4 | |||||||
| (5) K2.E1 | 1.5 ± 0.3 | 1.1 ± 0.2 | 1.1 ± 0.1 | -3.8 ± 0.3 | -1.2 ± 0.5 | |||||||
| (6) K2.E1* | 0.6 ± 0.5 | 0.7 ± 0.4 | 1.3 ± 0.2 | -0.4 ± 0.8 | 0.1 ± 0.7 |
| *s/-/- | -/s/- | s/s/- | s/s/- | s/s/- | s/s/s | s/s/s | s/s/s | s/s/s | s/s/s | s/s/s | s/s/s | |
|---|---|---|---|---|---|---|---|---|---|---|---|---|
| p/-/- | -/p/- | p/s/- | s/p/- | p/p/- | p/s/s | s/p/s | s/s/p | p/p/s | p/s/p | s/p/p | p/p/p | |
| (7) Na3·E1(ADP·Pi) | -1.0 ± 0.5 | 1.7 ± 0.2 | 0.7 ± 0.7 | 2.2 ± 0.2 | 3.0 ± 1.0 | 0.8 ± 0.5 | 2.6 ± 0.3 | 6.0 ± 0.3 | 2.1 ± 1.5 | 5.8 ± 1.1 | 7.4 ± 0.8 | 7.5 ± 2.0 |
| (8) Intermediate | 2.9 ± 1.0 | -0.5 ± 1.2 | 1.5 ± 1.6 | 2.6 ± 1.3 | 2.5 ± 1.3 | 3.0 ± 0.7 | 0.6 ± 0.2 | 0.8 ± 0.5 | 4.0 ± 0.8 | 2.8 ± 1.1 | 2.7 ± 0.5 | 3.5 ± 1.5 |
| (9) P-E2·Na3 | 2.3 ± 0.3 | 1.6 ± 0.5 | 2.1 ± 0.3 | 2.4 ± 0.3 | 4.6 ± 0.5 | 1.4 ± 0.3 | 1.7 ± 0.3 | -2.2 ± 0.3 | 3.1 ± 0.8 | -0.6 ± 0.6 | -0.8 ± 0.6 | -1.2 ± 1.2 |
-
*The top and bottom rows represent the starting and ending binding site ion configurations. A 'p' represents a K+ (potassium) ion and an 's' represents a Na+ (sodium) ion. The binding sites I, II, and III in this order are separated by '/'.
Table 6
Binding site residues and the fitted parameters ki and χ0,i.
| k1 | χ0,1 | k2 | χ0,2 | k3 | χ0,3 | k4 | χ0,4 | k5 | χ0,5 | k6 | χ0,6 | |
|---|---|---|---|---|---|---|---|---|---|---|---|---|
| M4 | ||||||||||||
| E327p | -0.932 | 53.11 | 1.055 | 61.08 | 1.844 | 62.05 | -0.312 | 56.44 | 0.392 | 89.04 | 0.225 | 82.28 |
| M5 | ||||||||||||
| Y771 | -2.19 | 62.51 | 1.219 | 89.27 | 2.46 | 60.91 | 0.662 | 40.85 | 0.721 | 44.75 | 0.639 | 50.42 |
| T774 | -4.25 | 35.82 | 2.437 | 101.3 | 3.602 | 61.71 | 1.128 | 44.86 | 1.071 | 91.96 | 0.857 | 76.09 |
| S775 | 3.068 | -26.37 | 0.124 | 38.67 | 1.291 | 62.22 | ||||||
| N776 | 2.664 | -166.23 | 0.918 | 87.15 | 1.709 | 62.85 | -0.53 | 71.79 | -0.495 | 50.76 | -0.406 | 75 |
| E779p | -2.508 | 29.17 | 1.792 | 88.01 | 2.591 | 62.28 | 0.487 | 24.81 | 0.476 | 73.74 | 0.462 | 53.74 |
| M6 | ||||||||||||
| D804- | 3.895 | -172.95 | 0.489 | 80.04 | 1.897 | 60.56 | -0.197 | 82.91 | -0.271 | 82.85 | -0.193 | 79.47 |
| D804p | 2.968 | -157.98 | 0.532 | 81.76 | 1.835 | 60.45 | -0.247 | 31.05 | -0.296 | 89.84 | -0.278 | 83.37 |
| N804 | 2.981 | -160.18 | 0.371 | 84 | 1.451 | 59.42 | ||||||
| D808- | 3.215 | -159.94 | 0.21 | 57.87 | 1.744 | 59.13 | ||||||
| D808p | -2.298 | 55.97 | 1.204 | 66.88 | 2.44 | 62.53 | 0.746 | 37.74 | 0.715 | 55.74 | 0.627 | 63.72 |
| N808 | -2.344 | 29.85 | 1.771 | 63.6 | 2.654 | 64.99 | 0.914 | 39.19 | 0.73 | 58.37 | 0.63 | 61.7 |
| M8 | ||||||||||||
| Q923 | -2.943 | 33.4 | 2.217 | 87.95 | 2.671 | 61.48 | 0.603 | 74.2 | 0.535 | 30.65 | 0.551 | 44.23 |
| D926- | 4.361 | -169.1 | 0.454 | 95.51 | 1.902 | 60.16 | -0.283 | 92.02 | -0.306 | 88.18 | -0.215 | 85.37 |
| D926p | -2.704 | 28.74 | 1.477 | 93.38 | 2.744 | 61.08 | 0.816 | 58.99 | 0.852 | 58.37 | 0.809 | 58.93 |
| N926 | 3.674 | -157.18 | 0.479 | 89.17 | 1.377 | 61.78 | -0.625 | 82.59 |
Download links
A two-part list of links to download the article, or parts of the article, in various formats.
Downloads (link to download the article as PDF)
Open citations (links to open the citations from this article in various online reference manager services)
Cite this article (links to download the citations from this article in formats compatible with various reference manager tools)
The selectivity of the Na+/K+-pump is controlled by binding site protonation and self-correcting occlusion
eLife 5:e16616.
https://doi.org/10.7554/eLife.16616


