Origin of a folded repeat protein from an intrinsically disordered ancestor
- Max Planck Institute for Developmental Biology, Germany
Figures
Figure 1 with 2 supplements
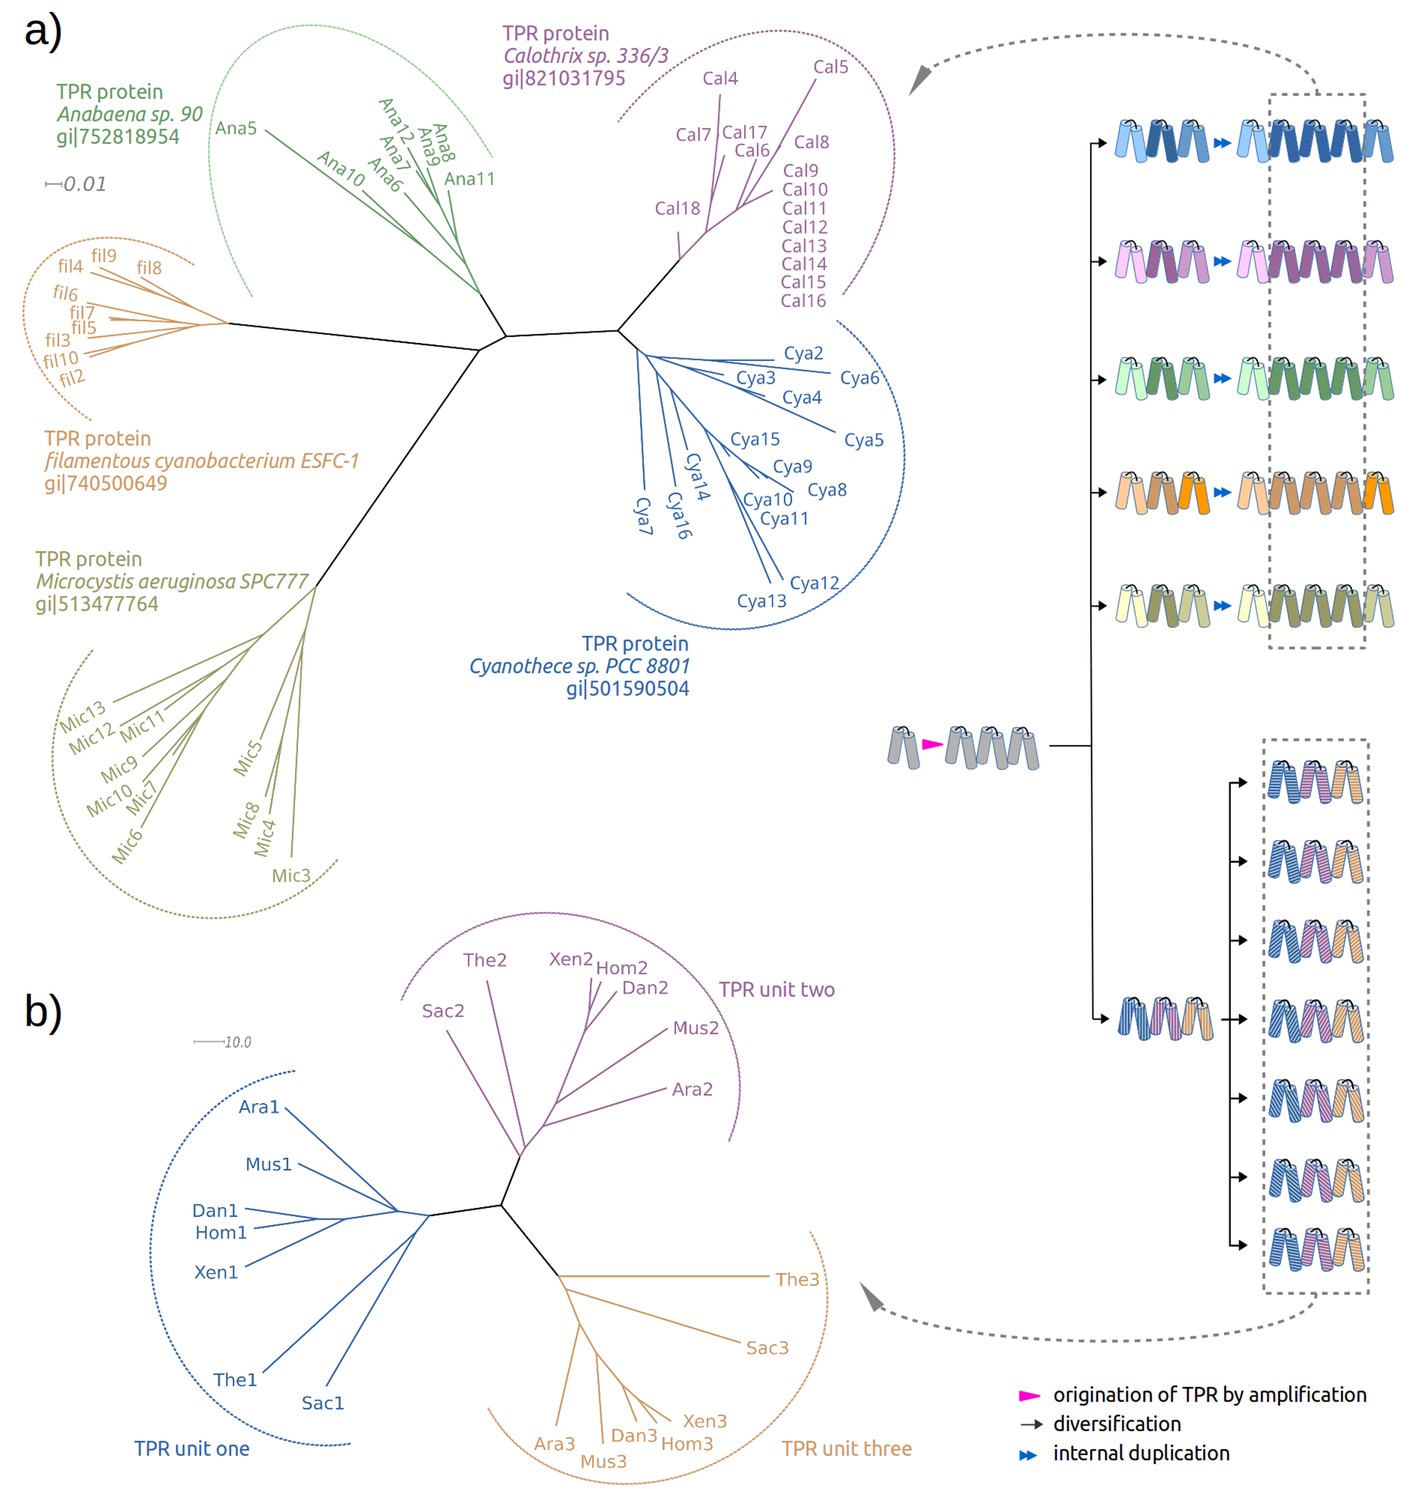
Two evolutionary scenarios for TPRs, illustrated by neighbor-joining phylogenetic trees.
(a) Amplification from single helical hairpin, as seen in TPR proteins from Cyanobacteria. (b) Divergent evolution of a TPR with multiple repeat units, as seen in the TPR domains of Serine/threonine-protein phosphatase 5 (Ara: Arabidopsis thaliana, Dan: Danio rerio, Hom: Homo sapiens, Mus: Musca domestica, Sac: Saccharomyces cerevisiae, The: Theileria annulata, Xen: Xenopus (Silurana) tropicalis). Since evolutionary reconstructions are subject to Occam’s razor and reflect the hypothesis with the fewest assumptions, we have postulated here one amplification event from one precursor hairpin. Our findings would however also be fully compatible with the precursor hairpin yielding a population of homologous variants, some of which were independently amplified to TPR-like folds; one or more survivors among these would have become the ancestor(s) of today’s TPR proteins. In this more complex scenario, the homology of TPR proteins, which we trace through the comparison of individual hairpins, is still given, but the TPR fold could have arisen from several independent amplifications, and not just a single one.
Figure 1—figure supplement 1
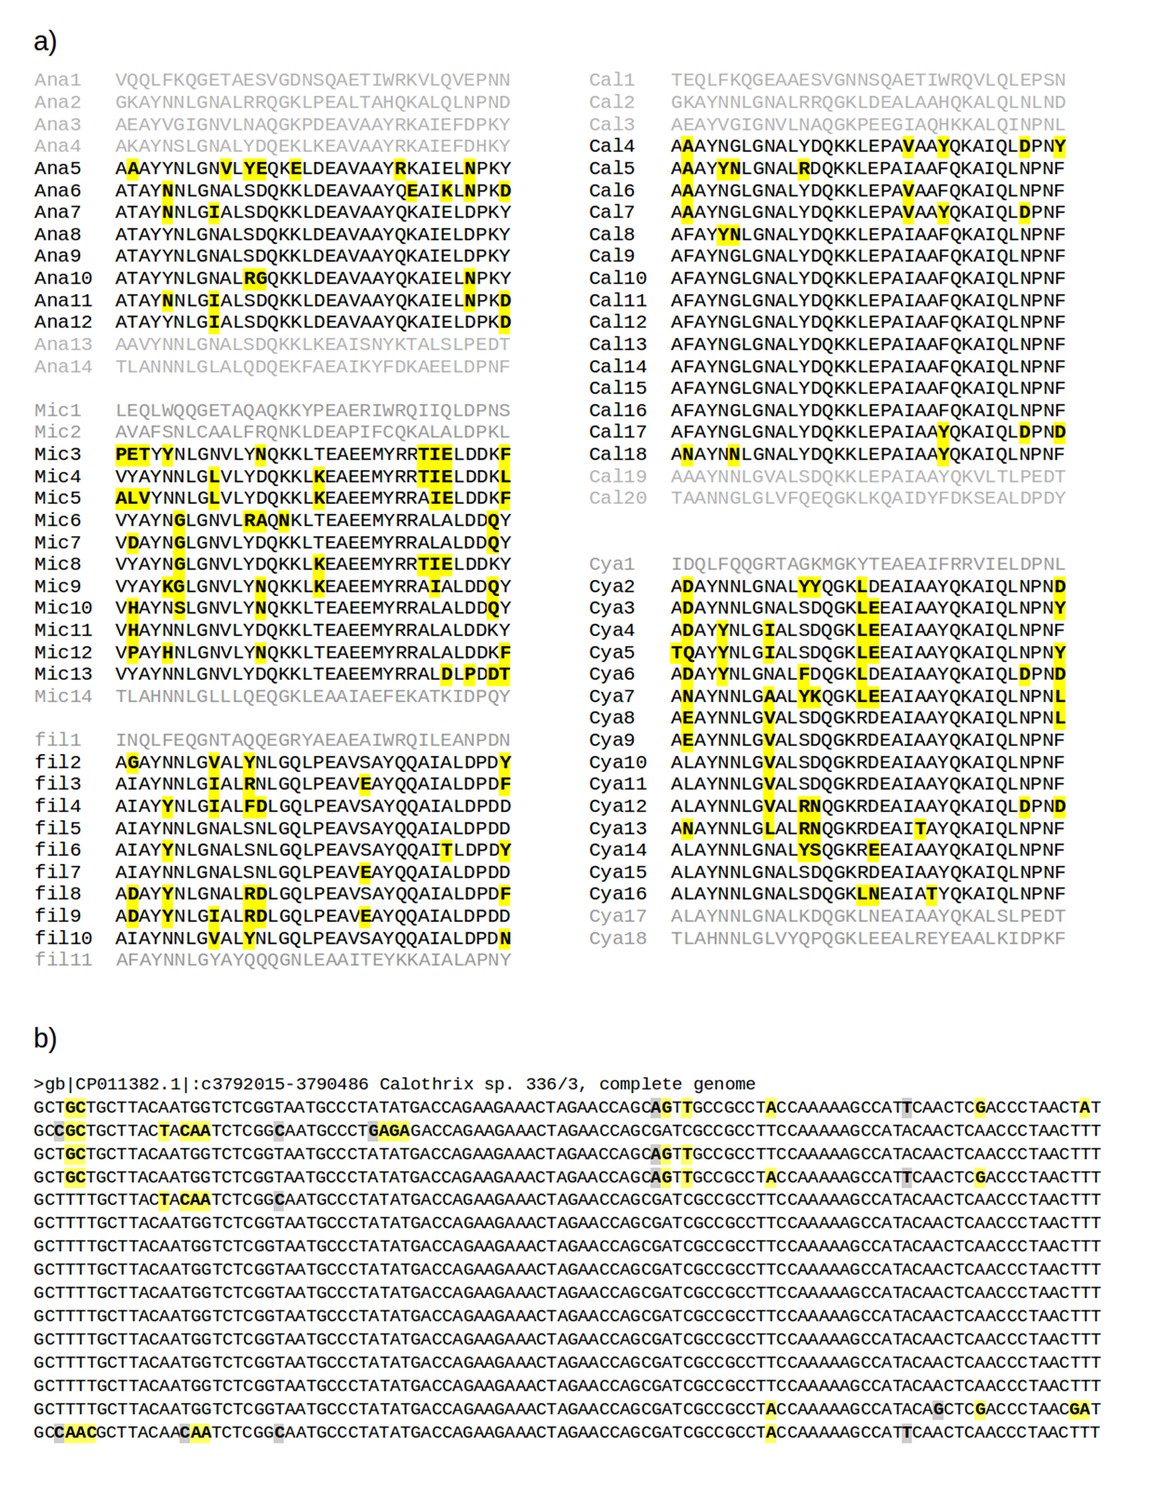
Multiple sequence alignments of recently amplified TPR repeat units.
(a) Alignments of the TPR units used for the phylogeny in Figure 1a. Residues different from the most common one in each column are shown in bold face and highlighted in yellow. Abbreviations: Ana: Anabaena sp. 90 (gi: 752818954, accession: WP_041458168.1); Cal: Calothrix sp. 336/3 (gi: 821031795, accession: WP_046815017.1); Cya: Cyanothece sp. PCC 8801 (gi: 501590504, accession: WP_012594639.1); fil: filamentous cyanobacterium ESFC-1 (gi: 740500649, accession: WP_038331513.1); Mic: Microcystis aeruginosa SPC777 (gi: 513477764, accession: EPF24195.1). (b) The corresponding alignment of the DNA sequences for the most recently amplified TPR units, Cal4-Cal18, of which the central repeats, Cal9-Cal16, are fully identical. Synonymous mutations (highlighted in gray) are found at less than 1% of the nucleotides, illustrating the recent time point of the amplification. Non-synonymous mutations (highlighted in yellow) are about 2.5 times as frequent as synonymous ones.
Figure 1—figure supplement 2
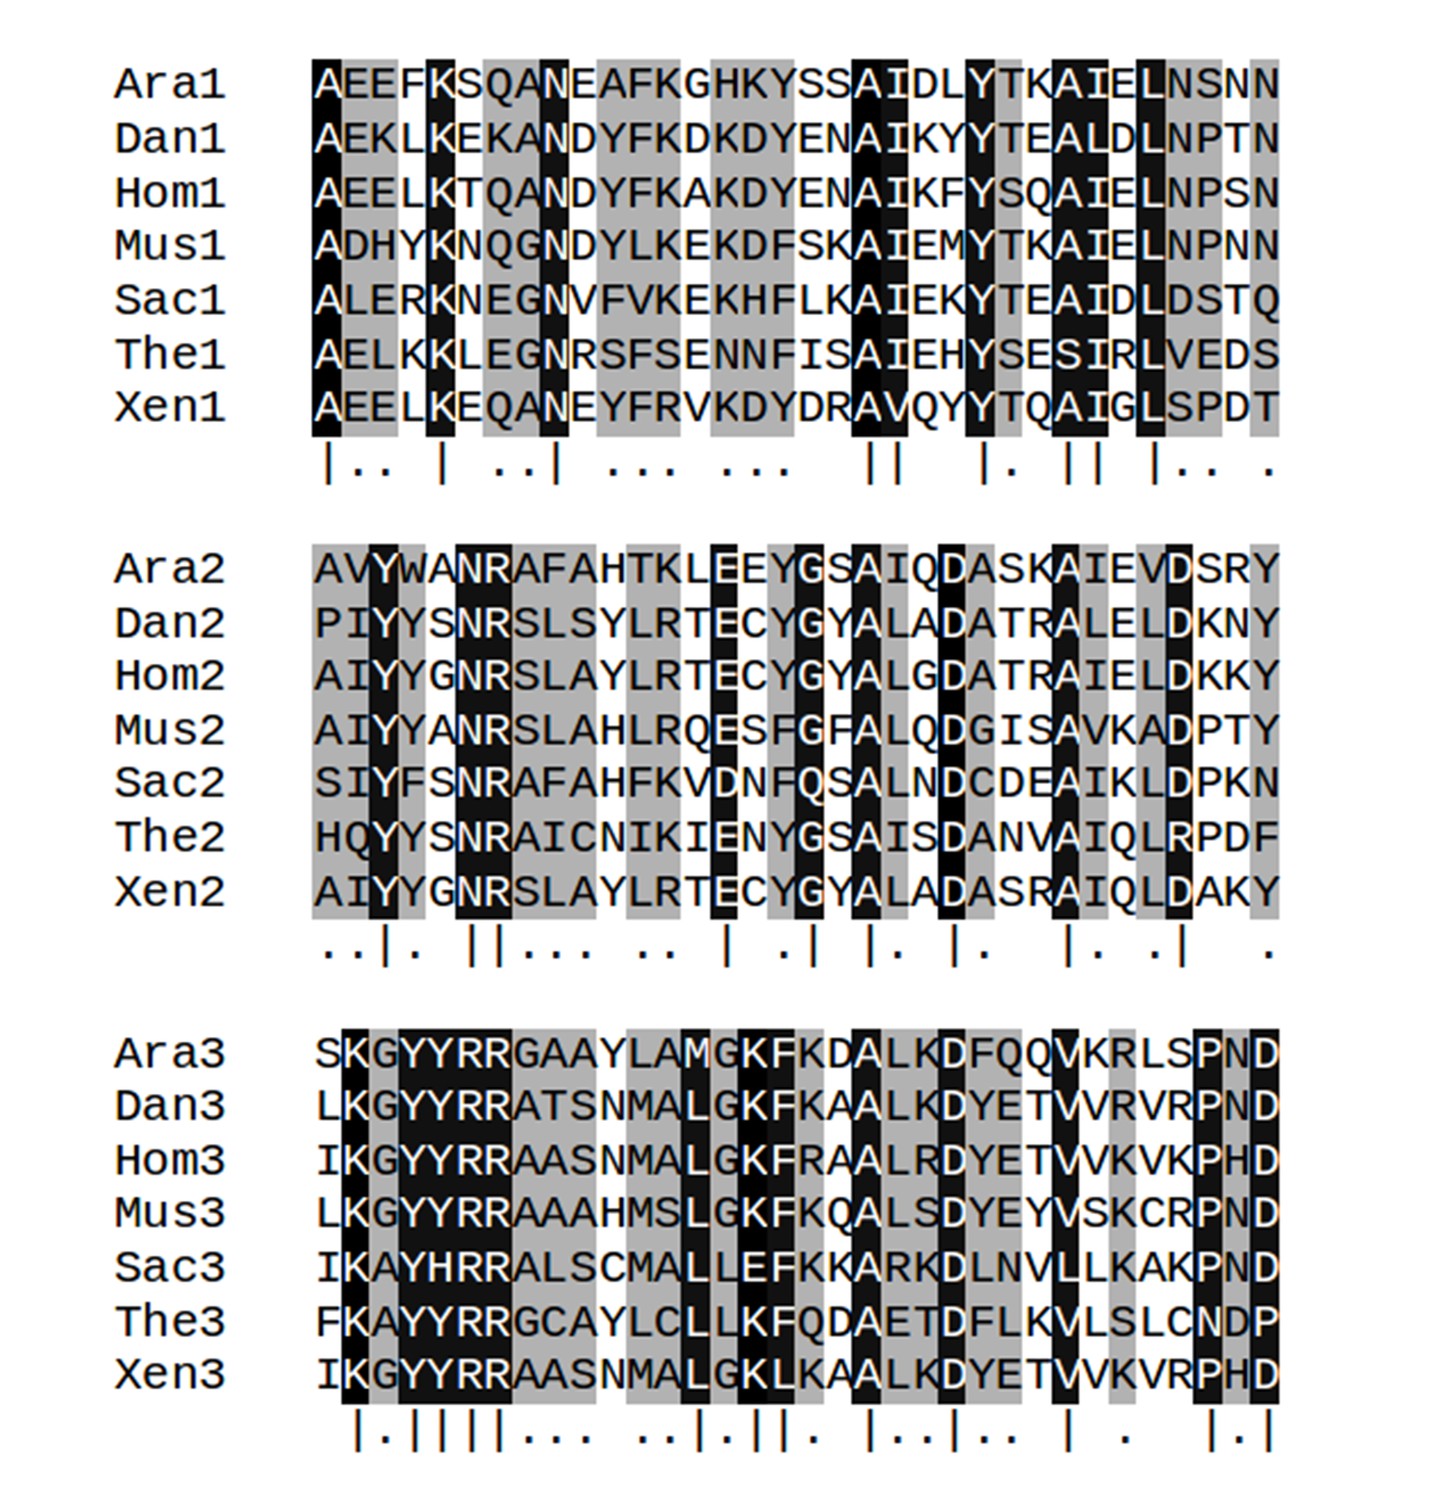
Multiple sequence alignments of the three TPR repeat units in serine/threonine-protein phosphatase 5 from seven taxa.
Columns with identify ≥80% are highlighted in black and marked by vertical bars (|); column with identify <80% but ≥50% are highlighted in gray and marked by dots (.). Abbreviations: Ara: Arabidopsis thaliana (gi: 18406066, accession: NP_565985.1); Dan: Danio rerio (gi: 126158897, accession: NP_001014372.2); Hom: Homo sapiens (gi: 5453958, accession: NP_006238.1); Mus: Musca domestica (gi: 557765703, accession: XP_005182549.1); Sac: Saccharomyces cerevisiae S288c (gi: 398365781, accession: NP_011639.3); The: Theileria annulata strain Ankara (gi: 84994100, accession: XP_951772.1); Xen: Xenopus tropicalis (gi: 56118654, accession: NP_001007891.1).
Figure 2

TPR-like hairpins found in non-repetitive proteins in the PDB.
(a) Structure gallery of non-repetitive helical hairpins in the PDB that share both sequence and structure similarity to TPR unit hairpin. Only the 34 amino-acid helical hairpins are shown. The helical hairpins in 30S ribosomal protein s20 (RPS20), mitochondrial import receptor subunit (Tom20), and microtubule interacting and transport domain (MIT) are depicted in cyan, green, and yellow, respectively. The structure of a TPR with a consensus sequence, CTPR3, is shown in the center with the middle TPR unit highlighted in red. PDB IDs and chain names of the proteins are given in parentheses. In the superposition, all helical hairpins are superimposed onto the middle TPR unit of CTPR3. (b) Multiple sequence alignment of the helical hairpin sequences listed in (a). The eight TPR signature positions are marked by dots in CTPR3. Columns with sequence identity ≥ 80% are in black, and columns with sequence identity ≥ 50% are in gray.
Figure 3
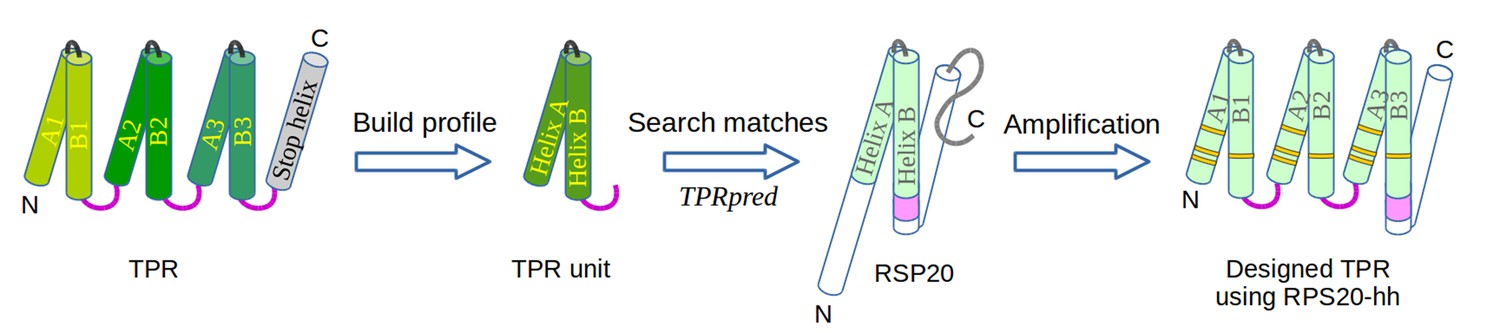
The design of TPR using RPS20.
RPS20-hh is identified by TPRpred to match the sequence profile of TPR units. Their structures are also very similar (helices are shown as cylinders), except for the last four residues (colored in light and dark magenta). We designed a TPR protein using a RPS20-hh with up to five mutations (yellow strips) in each repeat unit. The C-terminal loop in the TPR unit (dark magenta loop) is used to replace the corresponding C-terminus (light magenta cylinder) of RPS20-hh to connect adjacent repeats. The C-terminal helix in RPS20 (white cylinder) was used as the stop helix in the design.
Figure 4 with 3 supplements

Sequence positions considered for optimizing the designed proteins.
(a) Sequence logo of the TPR motif. A TPR consensus sequence (Main et al., 2003b) (PDB: 1na0, chain A) and its secondary structure determined by DSSP (Kabsch and Sander, 1983) are aligned below the sequence logo. The eight TPR signature positions are underscored in the consensus sequence. The five interface positions are highlighted in yellow. (b) Sequence logo of RPS20-hh. The RPS20-hhta sequence and its predicted secondary structure using Quick2D (Biegert et al., 2006) is aligned below the sequence logo. The derived interface positions are highlighted in yellow. The four residues subjected to mutations are colored in red. The four positively charged residues selected for mutation to lower the surface charge are in blue. (c) The locations of the interface positions displayed on a TPR (left) and a RPS20 structure (right). In both structures, the interface positions are labeled and highlighted as yellow spheres. The TPR structure is CTPR3 (PDB: 1na0, chain A), which is shown as a cartoon and is colored using the same scheme as the secondary structure representation in (a). The stop helix is in gray. The RPS20 structure is from T. thermophilus (PDB: 4gkj, chain T), in which the RPS20-hh fragment is colored using the same scheme as the secondary structure representation in (b). The sequence logos were generated using WebLogo (Crooks et al., 2004). Sequences from representative proteome 75% (Chen et al., 2011) downloaded from Pfam families TPR_1 and Ribosomal_S20p were used as input to WebLogo (9338 and 972 sequences, respectively). The structures were rendered using PyMOL (Schrödinger, 2010).
Figure 4—figure supplement 1
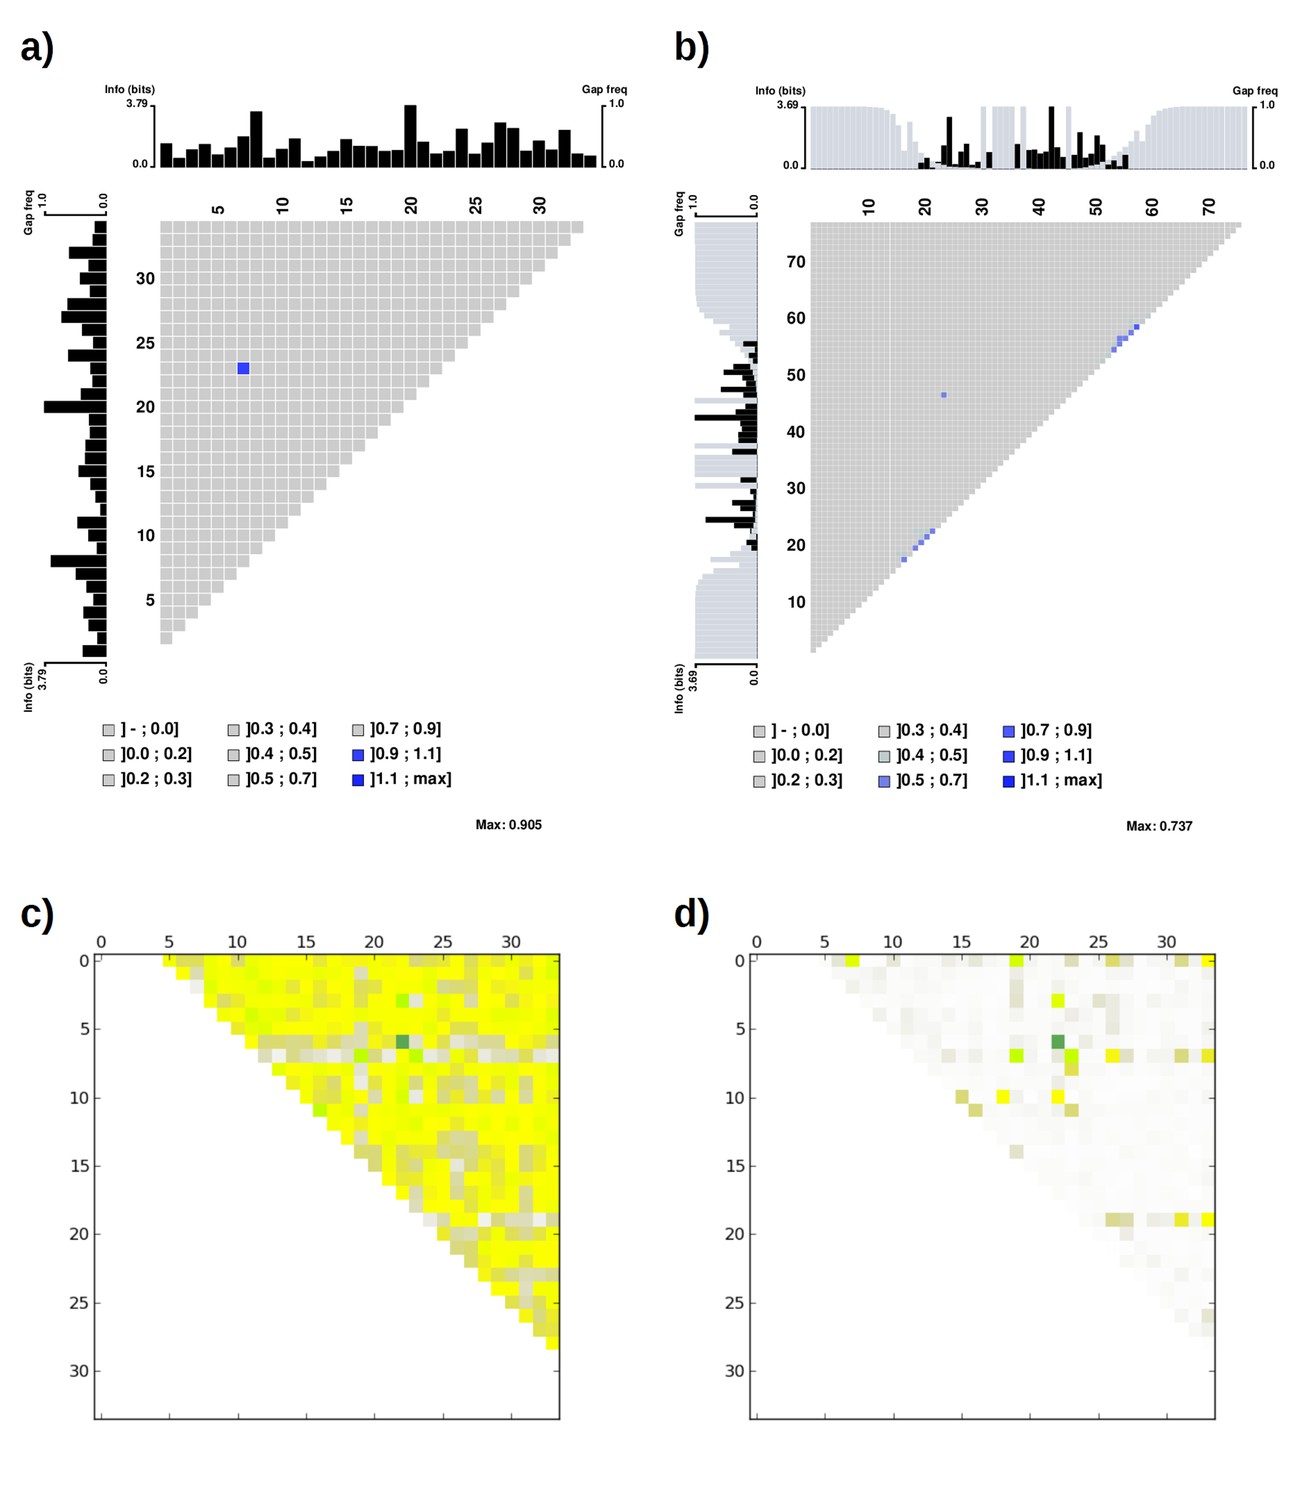
Mutual information plot (a and b) and direct coupling analysis plot (c and d) for TPR repeat sequences.
The subfigures (a) and (c) were generated using the seed alignment sequences from Pfam family TPR_1 (558 sequences. Sequence Q29585_PIG/28–61 was removed as it contains unknown residue X). The largest mutual information value is observed between position 7 and 23. The subfigures (b) and (d) were generated using the multiple alignment of representative proteomes rp75 sequences from Pfam family TPR_1 (9338 sequences). The largest non-local mutual information value was observed between position 24 and 47, corresponding to position 7 and 23 using TPR repeat numbering. Alignments were taken from Pfam 27.0. Subfigures (a) and (b) were generated using MatrixPlot. Subfigures (c) and (d) were generated using DCA Workbench (http://dca.rice.edu/portal/dca/workbench).
Figure 4—figure supplement 2
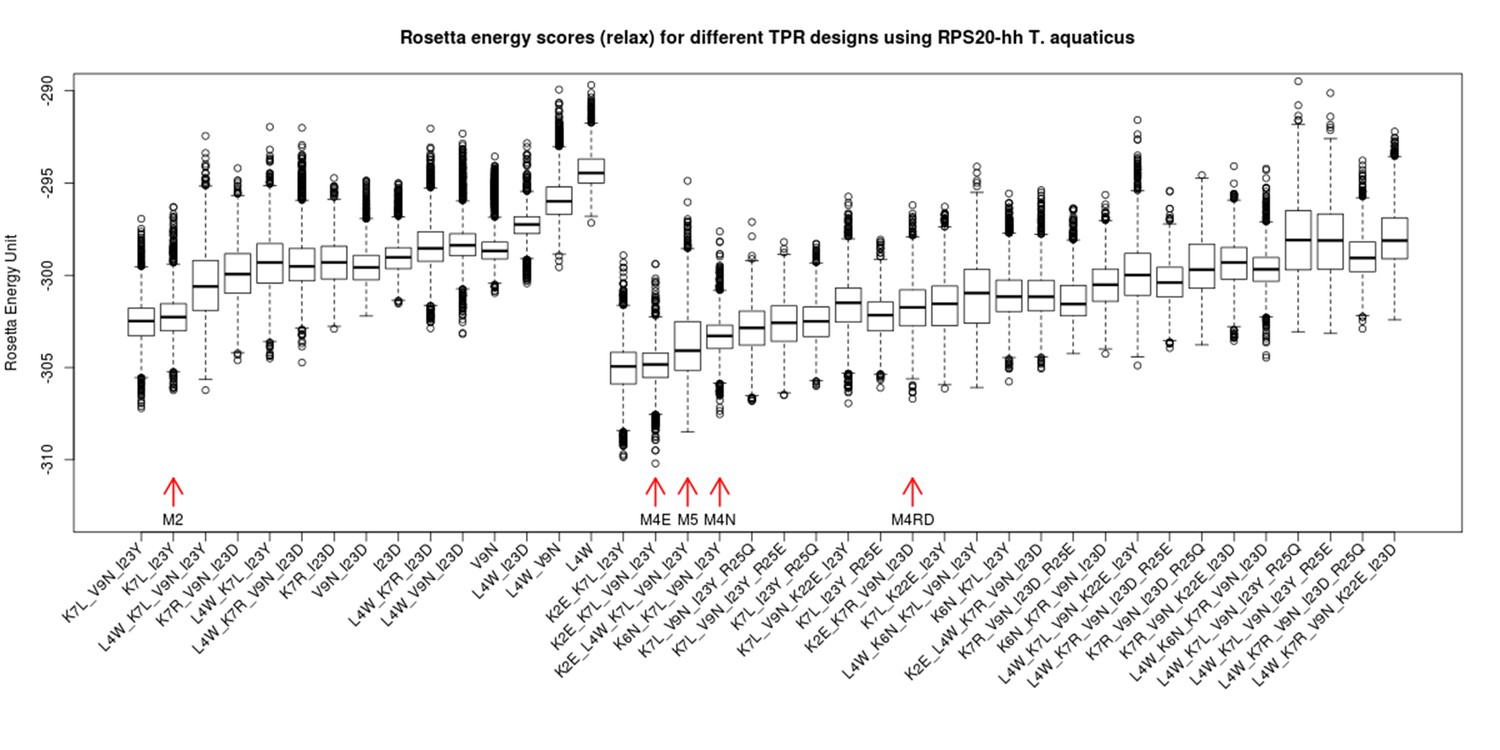
Rosetta energy scores (fixbb+relax) for TPR designs based on RPS20-hhta sequence and various sets of mutations.
The scores for the designs are shown in two groups: the group to the left are combinations involving only primary mutations (see Supplementary file 1E). The group to the right are designs involving both primary and secondary mutations (Supplementary file 1E). The design variants are sorted by the average of the lowest 10% scores. The designs tested in the lab are marked by red arrows (M2, M4E, M5, M4N, M4RD). The in silico simulation was performed using Rosetta 3.4.
Figure 4—figure supplement 3
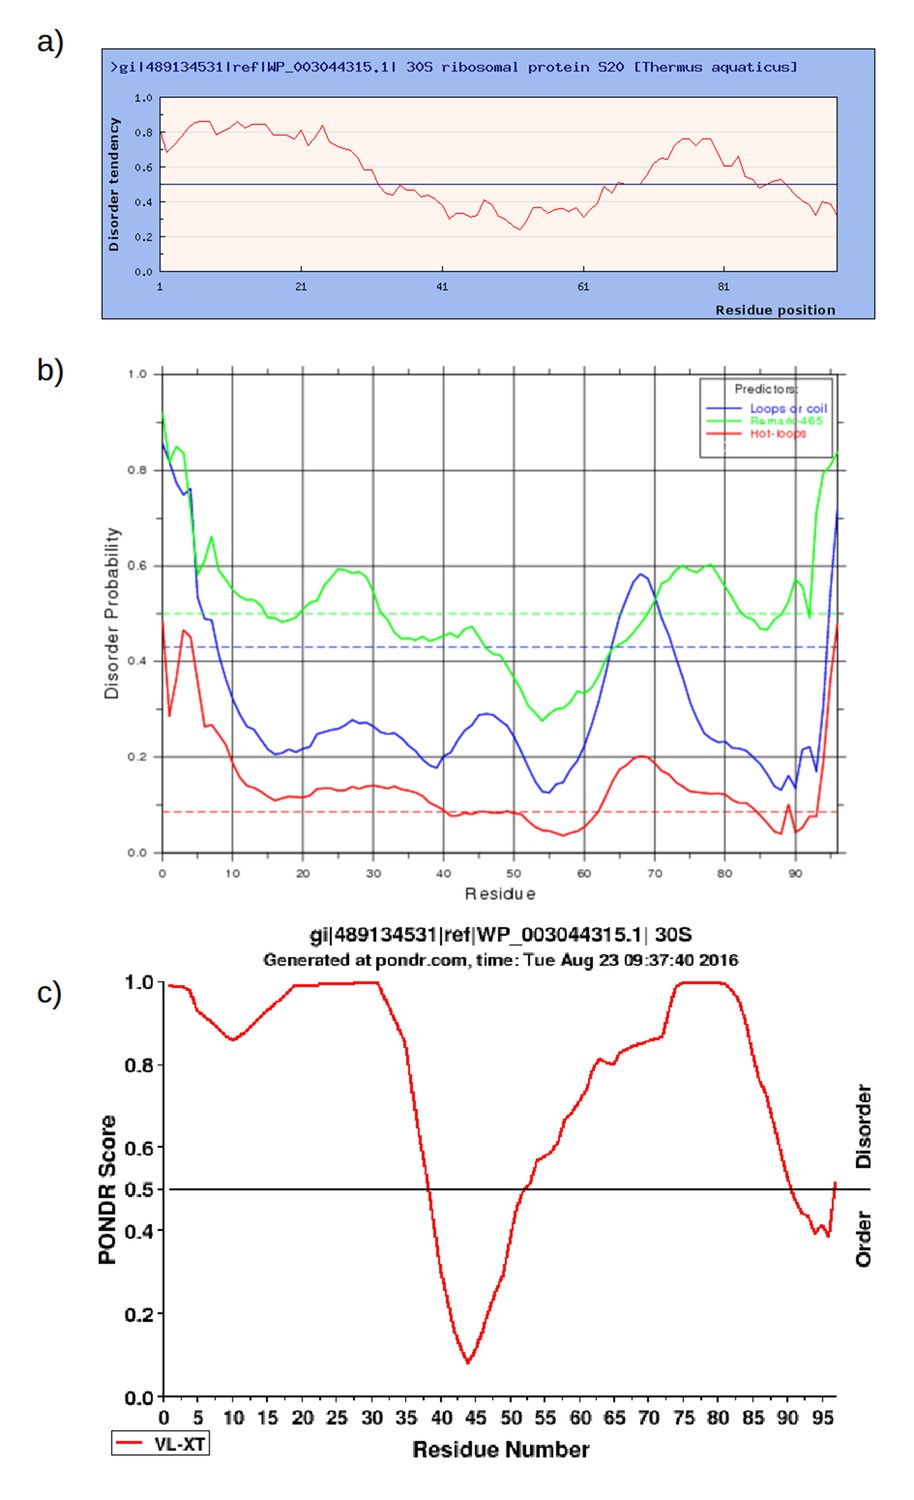
Prediction of intrinsically disordered regions in RPS20 of Thermus aquaticus (NCBI gi: 489134531, accession: WP_003044315.1) using a) IUPred (http://iupred.enzim.hu/); b) DisEMBL (http://dis.embl.de/) and c) PONDR (http://www.pondr.com/).
https://doi.org/10.7554/eLife.16761.012
Figure 5 with 3 supplements
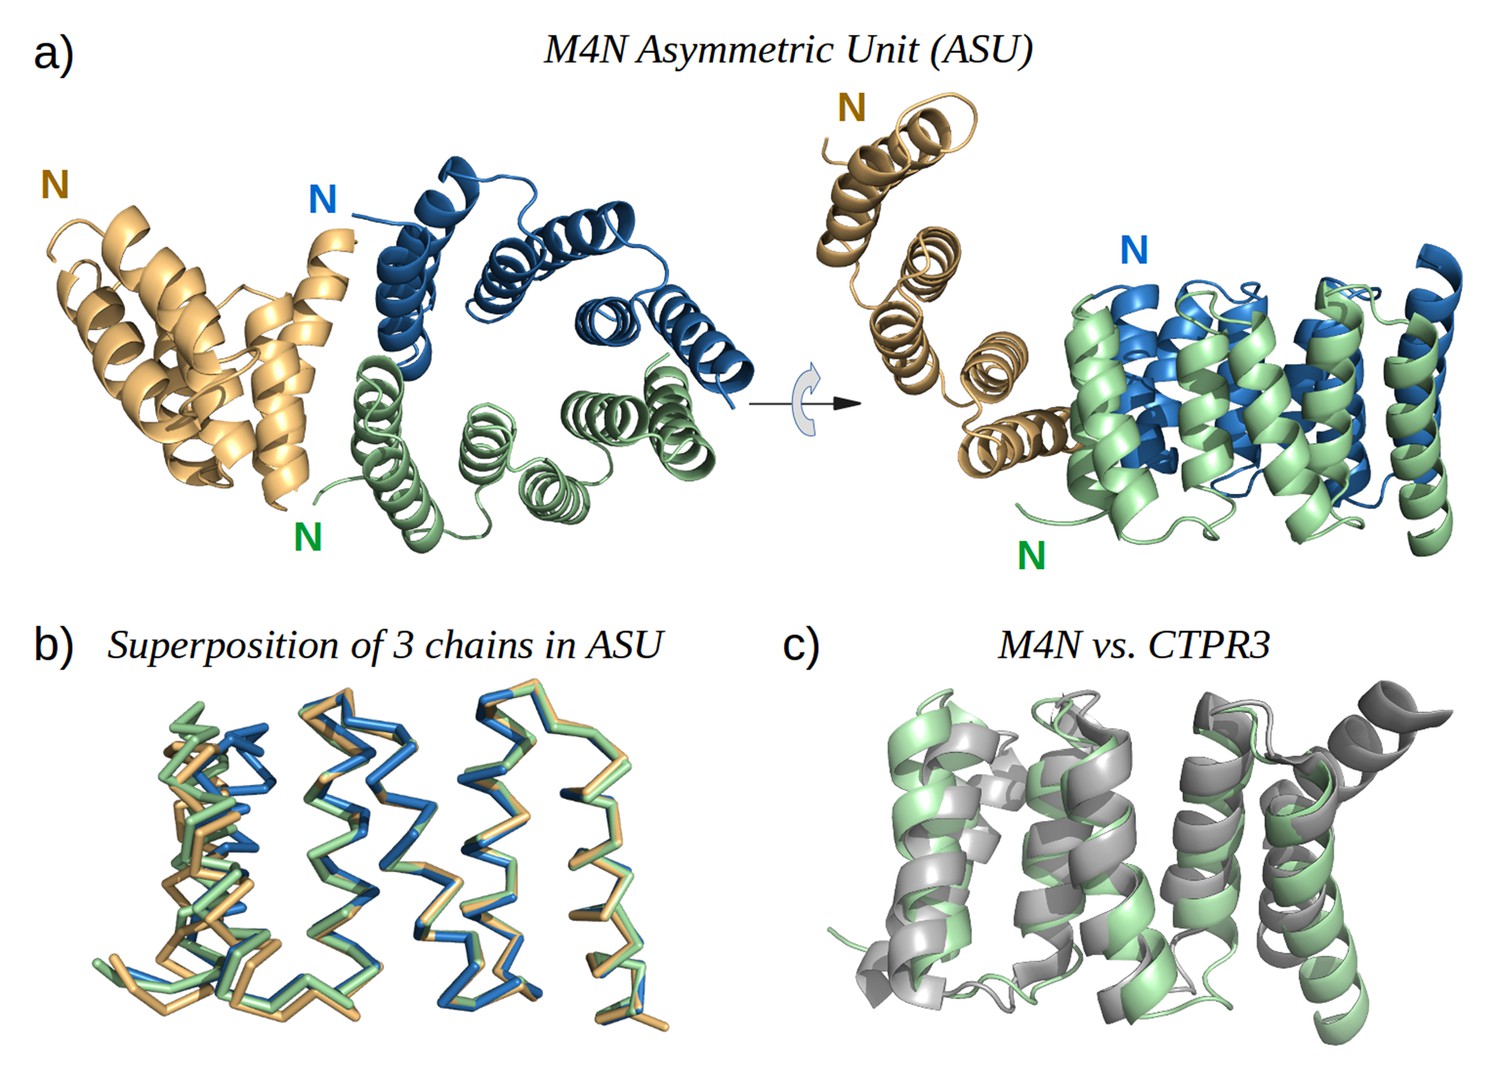
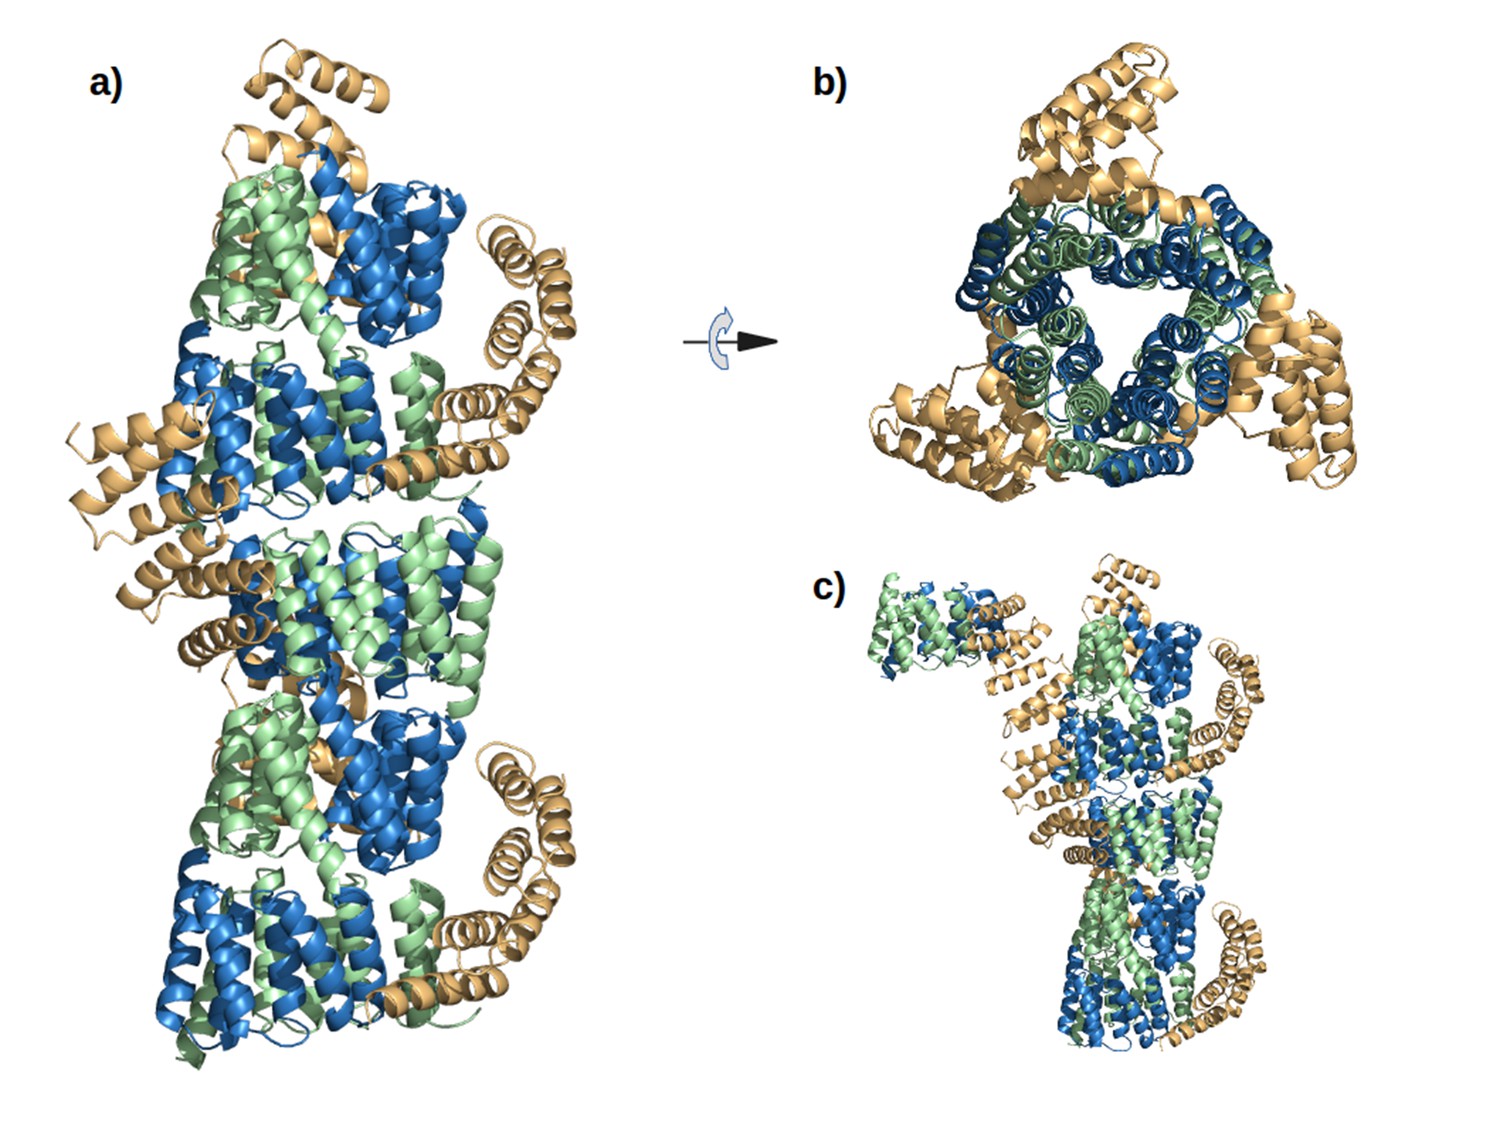
The X-ray structure of M4N.
(a) The three chains A, B and C in the asymmetric unit are colored green, blue and yellow, respectively. Chains A and B form a dimer. (b) Superposition of the three chains. Only Cα traces are shown for clarity. (c) Superposition of M4N (chain A, green) and the designed consensus TPR CTPR3 (PDB: 1na0, chain A, gray).
Figure 5—figure supplement 1
The interaction of M4N molecules in the crystal.
(a) Five adjacent ASUs are depicted. Chain A (green) and B (blue) form a dimer, while chain C (yellow) packs its C-terminus to the N-termini of chains A and B. (b) Top view. (c) An additional ASU (top-left) is shown to demonstrate the packing of N-termini of chains C.
Figure 5—figure supplement 2
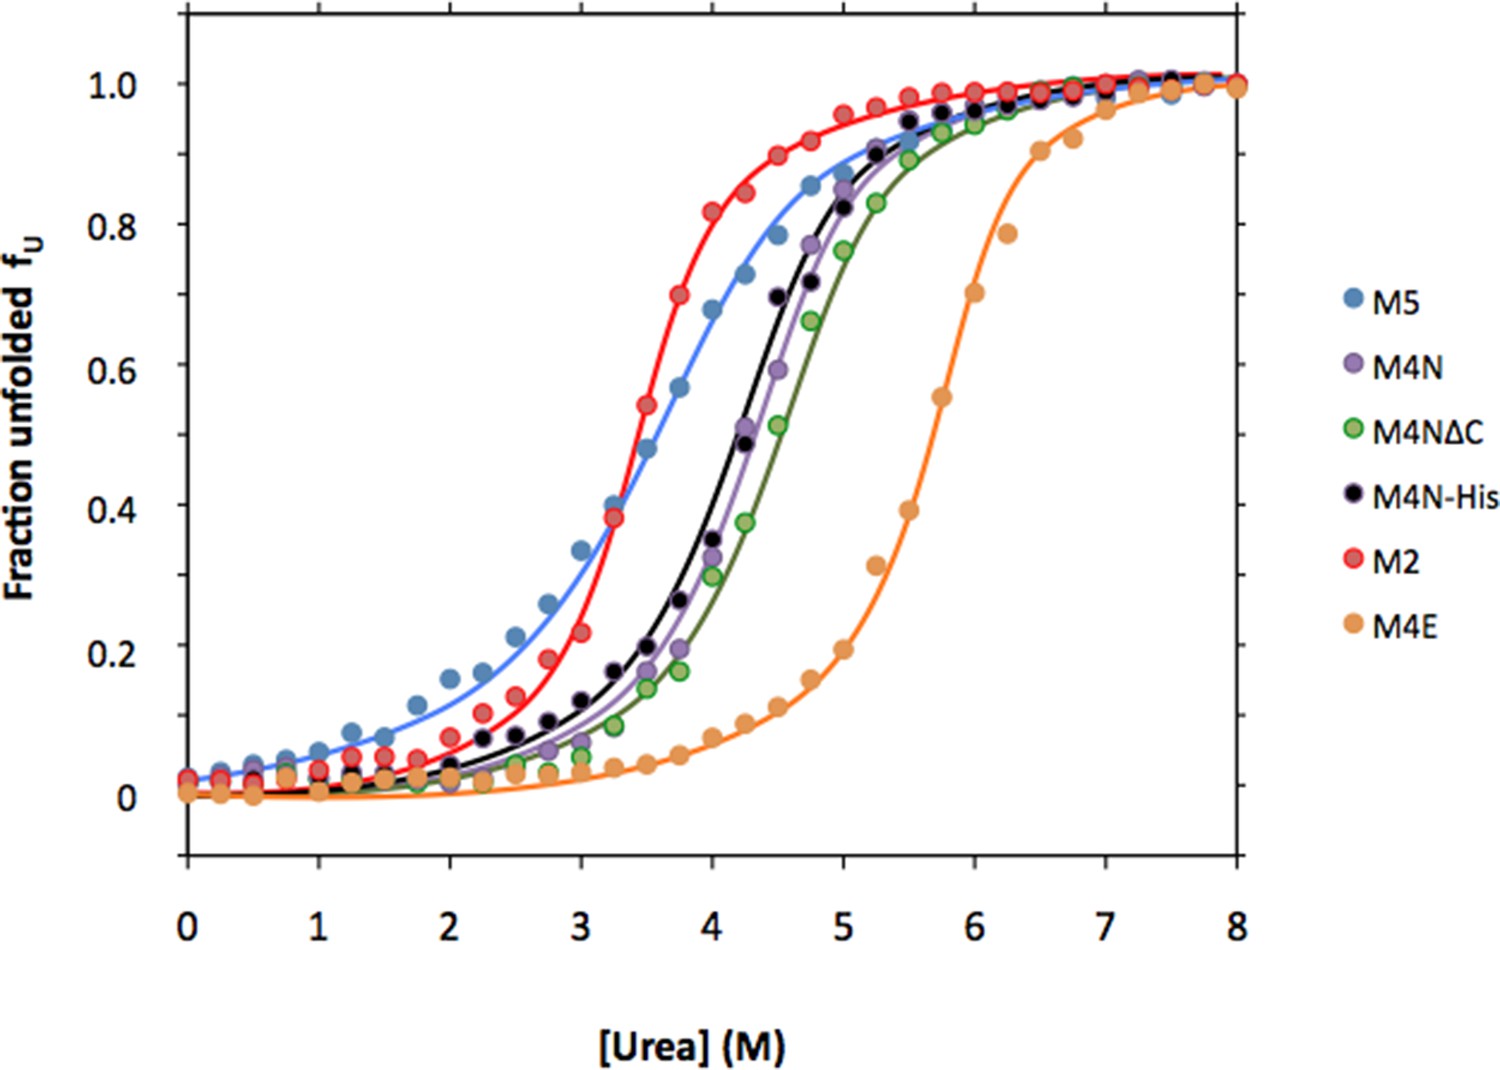
Urea denaturation of designed TPR repeats.
Urea-induced equilibrium unfolding at 23°C was monitored by circular dichroism at 222 nm. Data were converted to the fraction of unfolded protein fU and fitted to a two-state model. The protein concentration was 15 µM. See Supplement file 1F for obtained parameters.
Figure 5—figure supplement 3
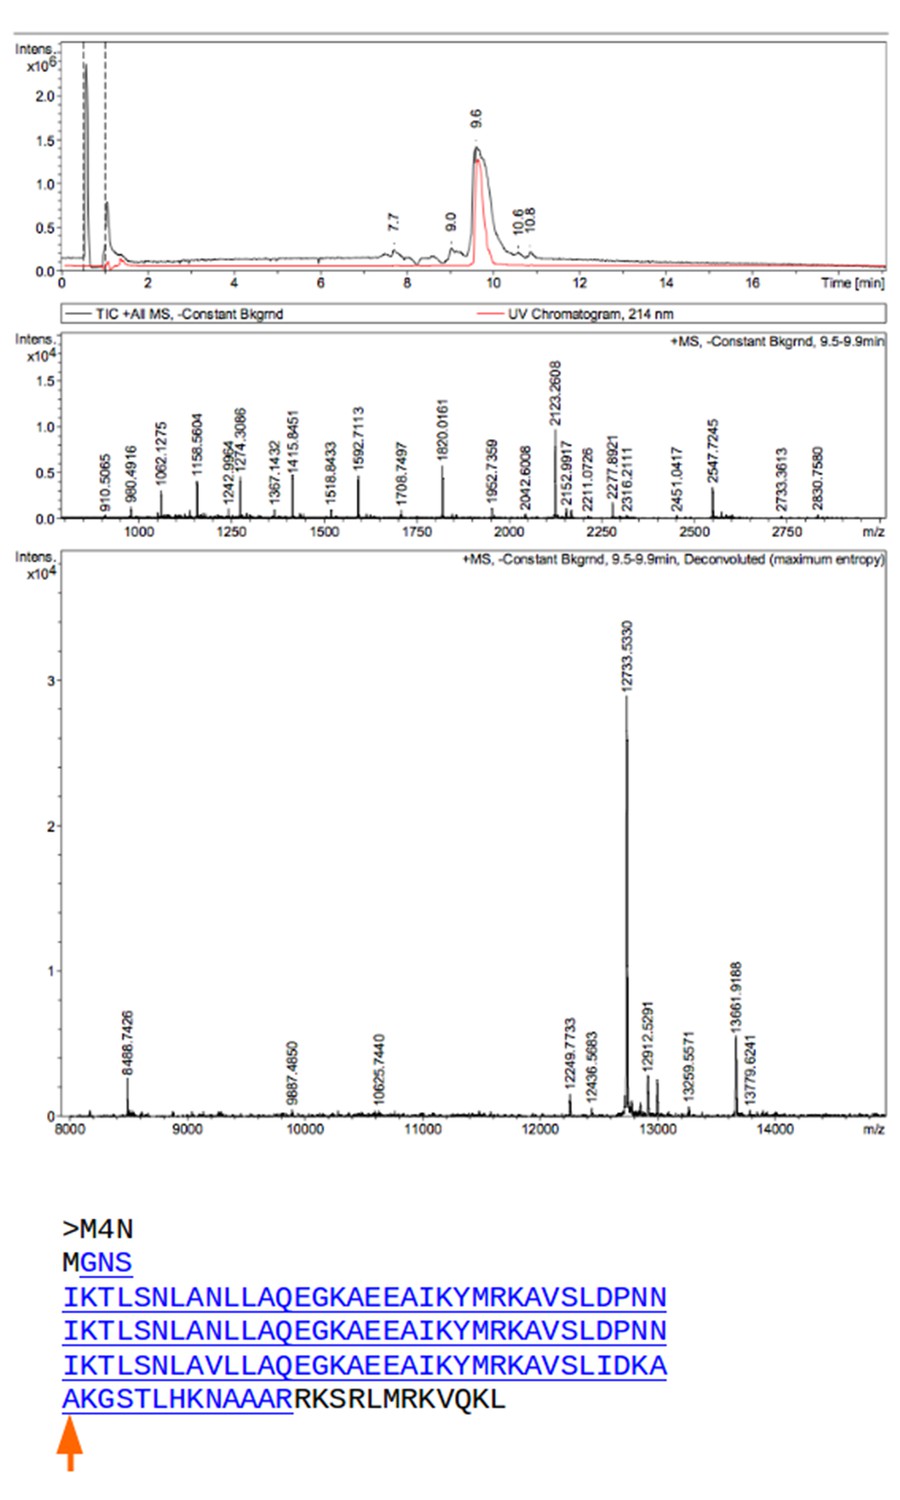
Mass spectrometry (MS) analysis of M4N.
The M4N fragment with a mass of 12733.533 Da in MS is underlined and highlighted in blue (theoretical mass 12733.77 Da). The C-terminus of M4N as observed in the crystal structure is marked by a red arrow.
Figure 6
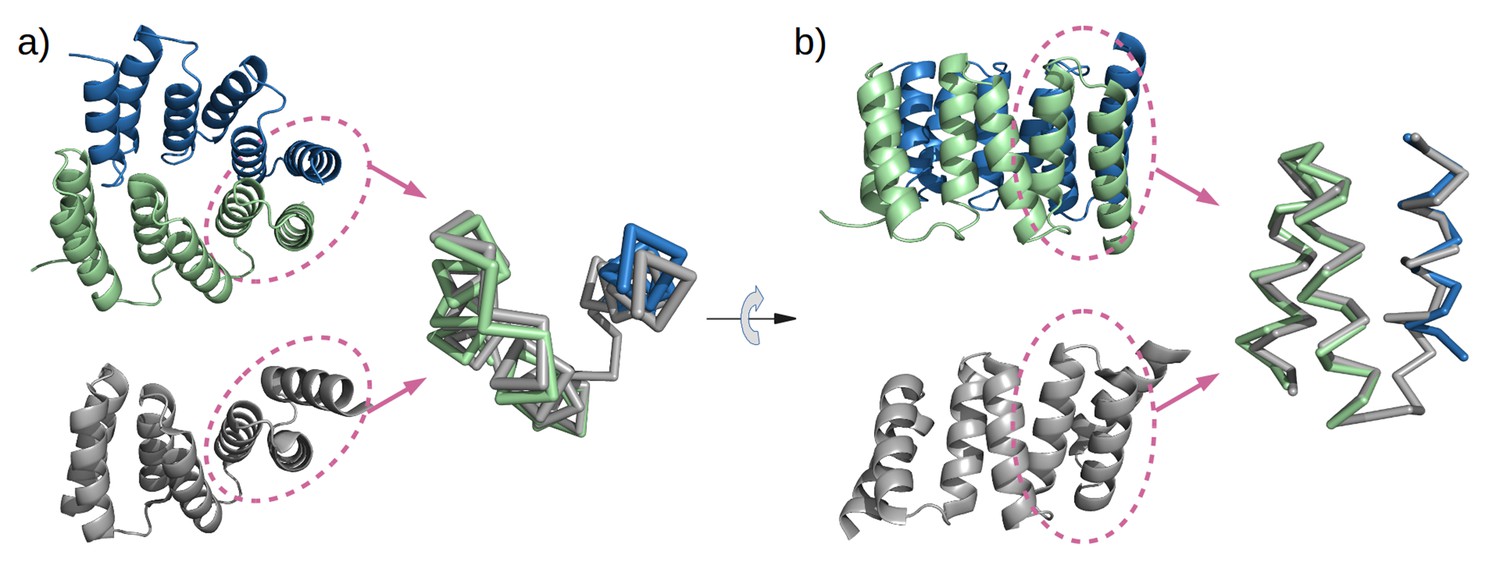
Mimicry of the stop helix in the M4N dimer.
The C-terminal TPR unit in chain A (green) and the C-terminal helix B3 in chain B (blue) are superposed to the last TPR unit plus the stop helix in CTPR3 (gray).
Figure 7
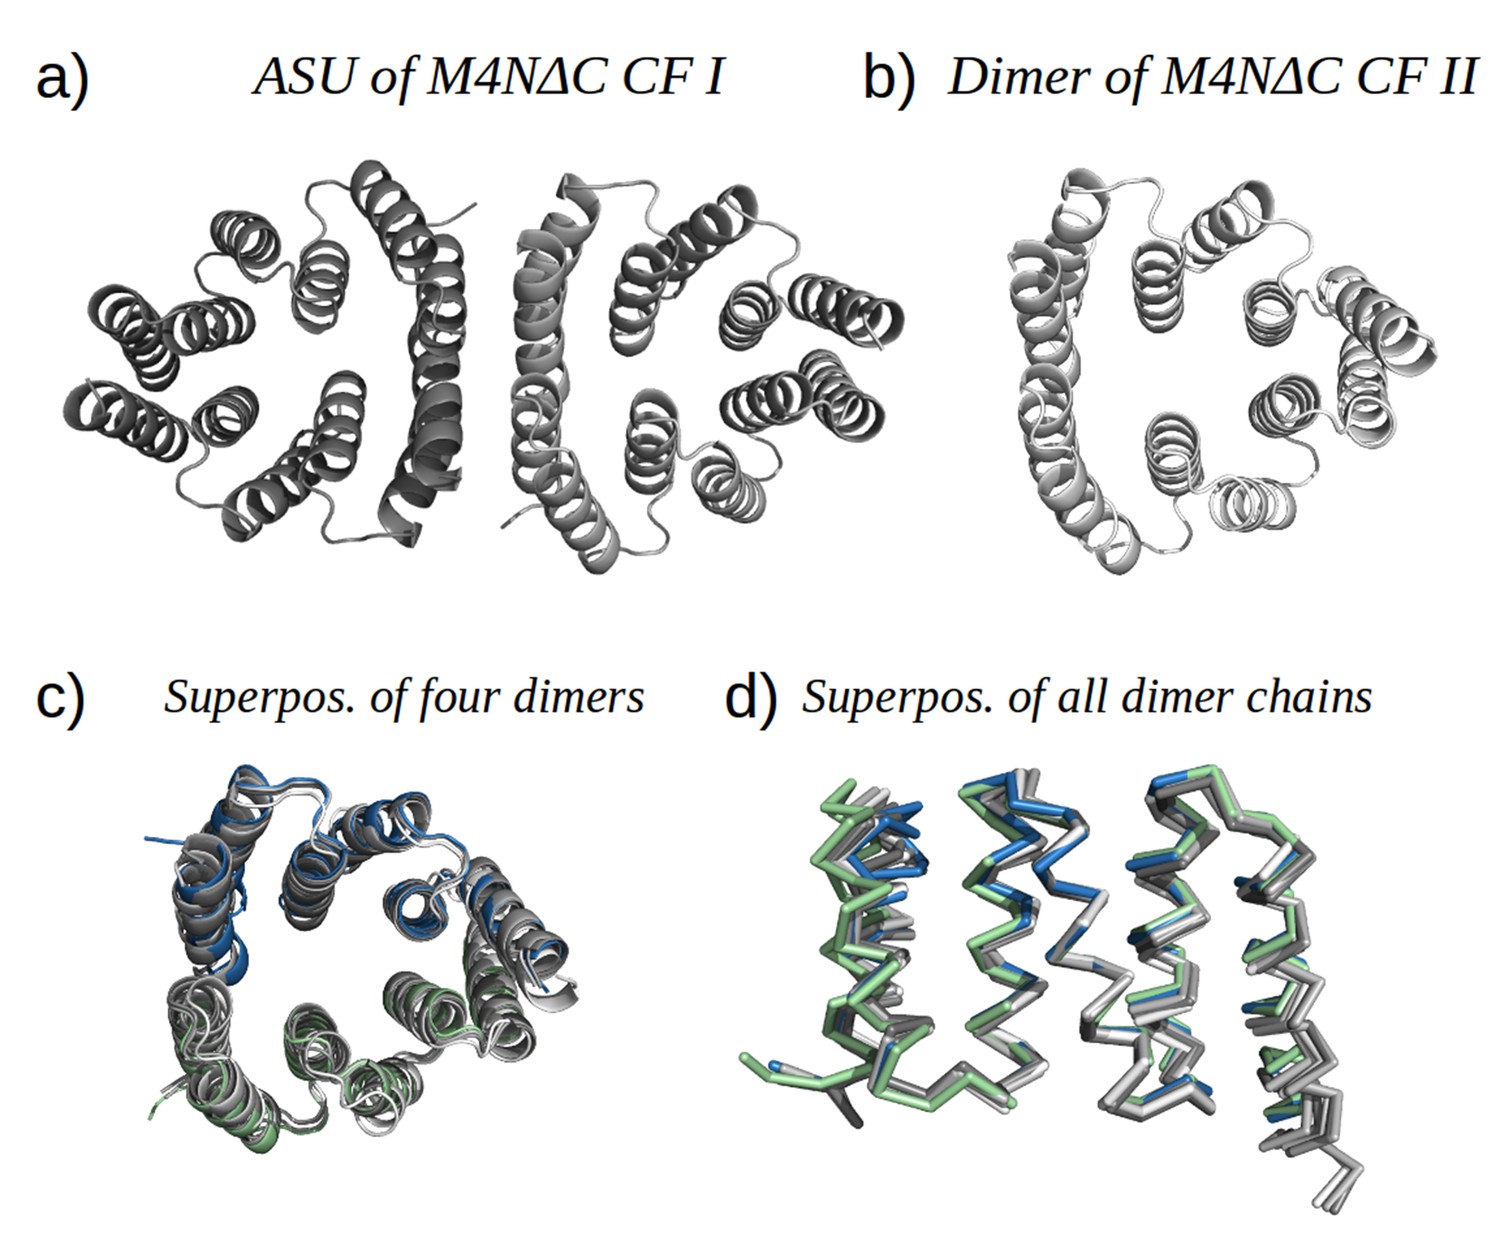
M4NΔC structures of two different crystal forms and their comparison to the M4N dimer.
(a) Two dimers in the ASU of M4NΔC CF I. (b) Dimer constructed by applying the crystallographic symmetry to the single chain in the ASU of M4NΔC CF II. (c) Superposition of all the four M4N and M4NΔC dimers. The M4N dimer is in green and blue. The three M4NΔC dimers are in different shades of gray as in (a) and (b). (d) Superposition of all the chains in the M4N and M4NΔC dimers (eight chains in total). Only Cα traces of proteins are shown for clarity.
Figure 8
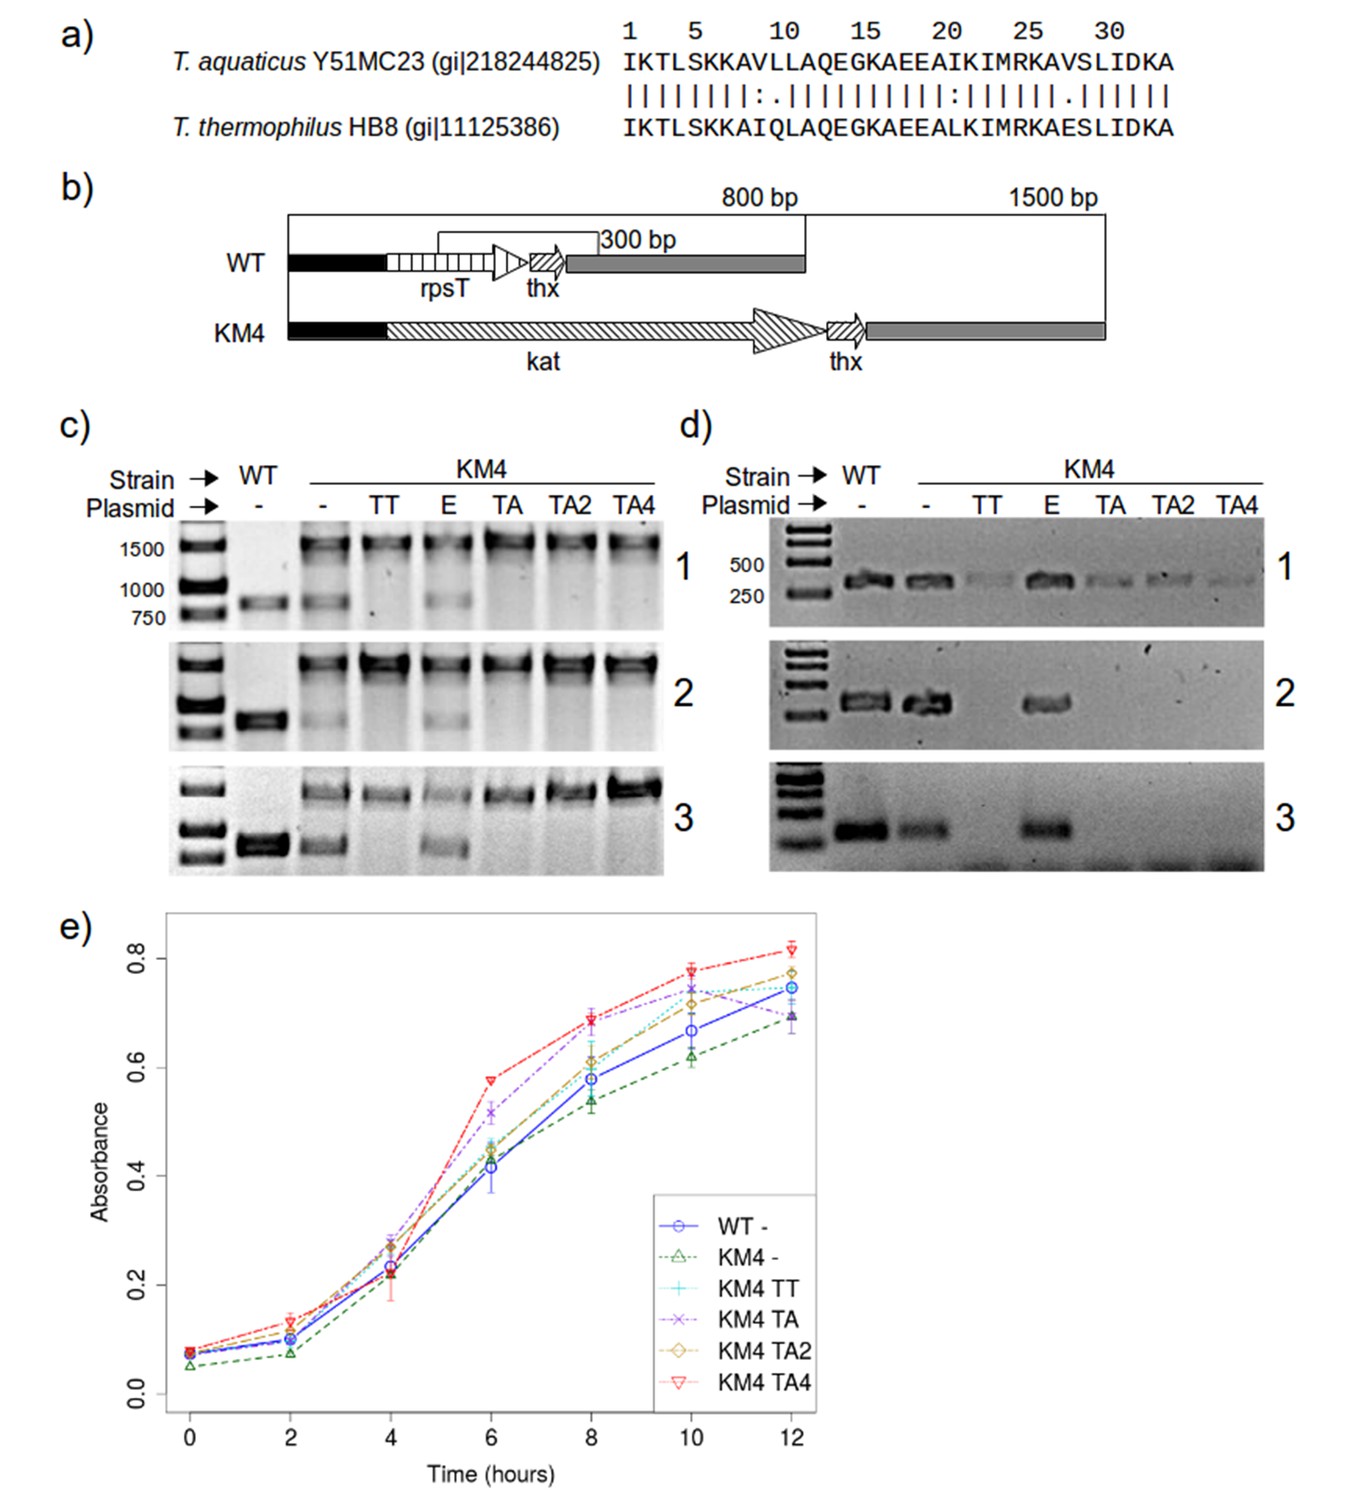
RPS20 variants M2 and M4N are functional proteins.
(a) The 34 amino-acid long RPS20-hh fragments in T. aquaticus and T. thermophilus differ only at four positions, including two conservative mutations (V9I and I21L). (b) Scheme of the rpsT region before (upper) and after (lower) substitution of rpsT with the kanamycin resistance cassette (kat). Base pair (bp) values indicate the PCR products that can be amplified. Regions depicted with the same pattern are identical. Regions in solid black and gray also contain genes which are not marked for clarity. (c) PCR to detect substitution of rps20 by the kat gene and (d) PCR to detect the presence of chromosomal rpsT in T. thermophilus strains (WT: T. thermophilus HB8; KM4:T. thermophilus KM4) carrying various plasmids (TT: pJJSpro-rpsTTt; E: pJJSpro; TA: pJJSpro-rpsTTa; TA2: pJJSpro-rpsTTaM2; TA4: pJJSpro-rpsTTaM4N; -: No plasmid) after sequential grow under different selective pressures (1: 30 µg/ml kanamycin; 2: 120 µg/ml kanamycin; 3: 0 µg/ml kanamycin). (e) Corresponding growth curves of the host bacteria with various substitutions and plasmids.
Tables
Table 1
The primary structures of the six designed proteins using RPS20-hhta tested in vitro. Point mutations introduced into RPS20-hhta are shown in bold and underlined. The C-terminal four residues in RPS20-hhta were replaced by the consensus loop sequence DPNN in TPRs (underlined). The sequence of the stop helix is italicized. M4NΔC is M4N without stop helix.
| Name | Mutations | Sequence |
|---|---|---|
| M0 | - | NS IKTLSKKAVLLAQEGKAEEAIKIMRKAVSLDPNN IKTLSKKAVLLAQEGKAEEAIKIMRKAVSLDPNN IKTLSKKAVLLAQEGKAEEAIKIMRKAVSLIDKA AKGSTLHKNAAARRKSRLMRKVQKL |
| M2 | K7L, I23Y | NS IKTLSKLAVLLAQEGKAEEAIKYMRKAVSLDPNN IKTLSKLAVLLAQEGKAEEAIKYMRKAVSLDPNN IKTLSKLAVLLAQEGKAEEAIKYMRKAVSLIDKA AKGSTLHKNAAARRKSRLMRKVQKL |
| M4E | K2E, K7L, V9N, I23Y | NS IETLSKLANLLAQEGKAEEAIKYMRKAVSLDPNN IETLSKLANLLAQEGKAEEAIKYMRKAVSLDPNN IETLSKLAVLLAQEGKAEEAIKYMRKAVSLIDKA AKGSTLHKNAAARRKSRLMRKVQKL |
| M4N | K6N, K7L, V9N, I23Y | NS IKTLSNLANLLAQEGKAEEAIKYMRKAVSLDPNN IKTLSNLANLLAQEGKAEEAIKYMRKAVSLDPNN IKTLSNLAVLLAQEGKAEEAIKYMRKAVSLIDKA AKGSTLHKNAAARRKSRLMRKVQKL |
| M4RD | K2E, K7R, V9N, I23D | NS IETLSKRANLLAQEGKAEEAIKDMRKAVSLDPNN IETLSKRANLLAQEGKAEEAIKDMRKAVSLDPNN IETLSKRAVLLAQEGKAEEAIKDMRKAVSLIDKA AKGSTLHKNAAARRKSRLMRKVQKL |
| M5 | K2E, L4W, K7L, V9N, I23Y | NS IETLSKLANLLAQEGKAEEAIKYMRKAVSLDPNN IETWSKLANLLAQEGKAEEAIKYMRKAVSLDPNN IETWSKLAVLLAQEGKAEEAIKYMRKAVSLIDKA AKGSTLHKNAAARRKSRLMRKVQKL |
| M4NΔC | K6N, K7L, V9N, I23Y | NS IKTLSNLANLLAQEGKAEEAIKYMRKAVSLDPNN IKTLSNLANLLAQEGKAEEAIKYMRKAVSLDPNN IKTLSNLAVLLAQEGKAEEAIKYMRKAVSLIDKA AK |
Additional files
-
Supplementary file 1
Further supporting computational and experimental results.
(A) Sequence variation in RPS20-hh at positions 6, 7, 9 and 23 (TPR unit numbering) observed in RPS20 sequences. (B) Most commonly observed amino acids in RPS20-hh. (C) List of putative TPR homologs identified in the PDB by sequence and structure analysis. (D) RPS20-hh sequences that resemble a TPR profile according to TPRpred. (E) Mutations tested in silico on RPS20-hh for TPR design. (F) Biophysical parameters of designed TPRs. (G) Primary structures of M4N molecules observed in the crystal structures. (H) Crystallization conditions, and data collection/refinement statistics. (I) Detailed structure comparison results of different chains in M4N structures, and of M4N to CTPR3. (J) SEG prediction of low-complexity regions in RPS20-hhta.
- https://doi.org/10.7554/eLife.16761.020
Download links
A two-part list of links to download the article, or parts of the article, in various formats.
Downloads (link to download the article as PDF)
Open citations (links to open the citations from this article in various online reference manager services)
Cite this article (links to download the citations from this article in formats compatible with various reference manager tools)
Origin of a folded repeat protein from an intrinsically disordered ancestor
eLife 5:e16761.
https://doi.org/10.7554/eLife.16761


