Norrin/Frizzled4 signalling in the preneoplastic niche blocks medulloblastoma initiation
- Ottawa Hospital Research Institute, Canada
- University of Ottawa, Canada
- University of Toronto, Canada
- University Health Network, Canada
- Arthur and Sonia Labatt Brain Tumor Research Centre, The Hospital for Sick Children, Canada
- The Hospital for Sick Children, Canada
- Krembil Research Institute, University Health Network, Canada
- Lexicon Pharmaceuticals Inc., United States
Figures
Figure 1
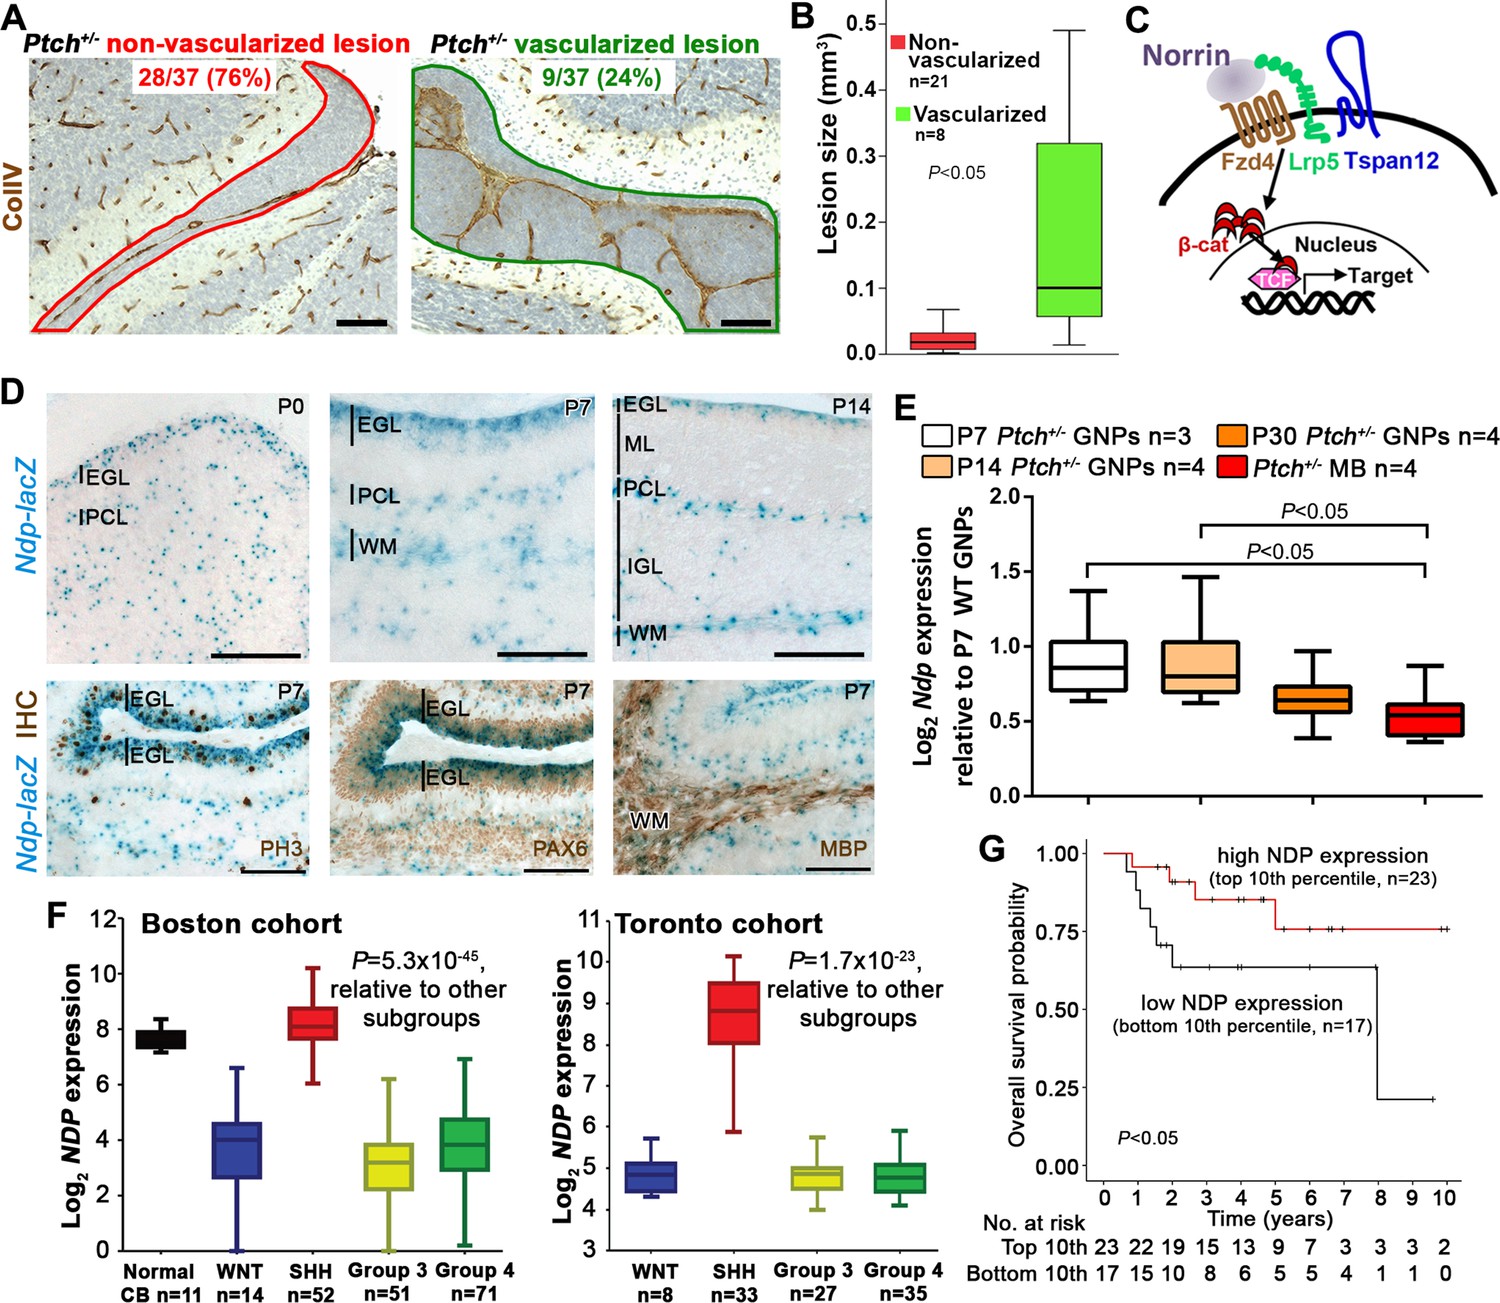
Ndp is expressed in Shh-MB precursors and mouse and human Shh-MB.
(A) Representative immunostains for Collagen IV (ColIV) counterstained with hematoxylin, to depict non-vascularized (red outline) and vascularized (green outline) lesions from 37 Ptch+/− mouse cerebellar lesions sampled by serial sections at P14. (B) Boxplot showing statistically larger volume in P14 Ptch+/− lesions assigned as vascularized versus those assigned as non-vascularized, based on immunostaining serial sections of each lesion for ColIV. (C) Schematic illustrating the machinery required for Norrin activation of β-catenin (β-cat)/T-cell factor (TCF)-dependent transcription via the Fzd4 receptor and Lrp5 and Tspan12 co-receptors. (D) X-gal staining (blue) of sagittally sectioned cerebella from male Ndp-/y mice carrying an Ndp-lacZ KO allele, at the ages indicated. Bottom row, combined X-gal staining and immunohistochemistry (IHC, brown) for phospho-histone H3 (PH3), Pax6, and myelin basic protein (MBP). (E) Box plot of qRT-PCR analysis of Ndp expression in mouse Ptch+/− purified GNPs and MB lysate from symptomatic animals ranging in age from 3 to 10 months. (F) Box plot of NDP expression obtained by array profiling of human cerebella and two different cohorts (Boston, left; Toronto, right) of human MB samples, categorized by molecular subgroup. (G) Kaplan-Meier survival curve illustrating overall survival of Shh-MB patients with high versus low NDP expression. EGL, external granule layer; GNP, granule neuron progenitor; PCL, Purkinje cell layer; ML, molecular layer; WM, white matter; IGL, internal granule layer; CB, cerebellum; MB, medulloblastoma. Scale bars, 100 µm.
Figure 2
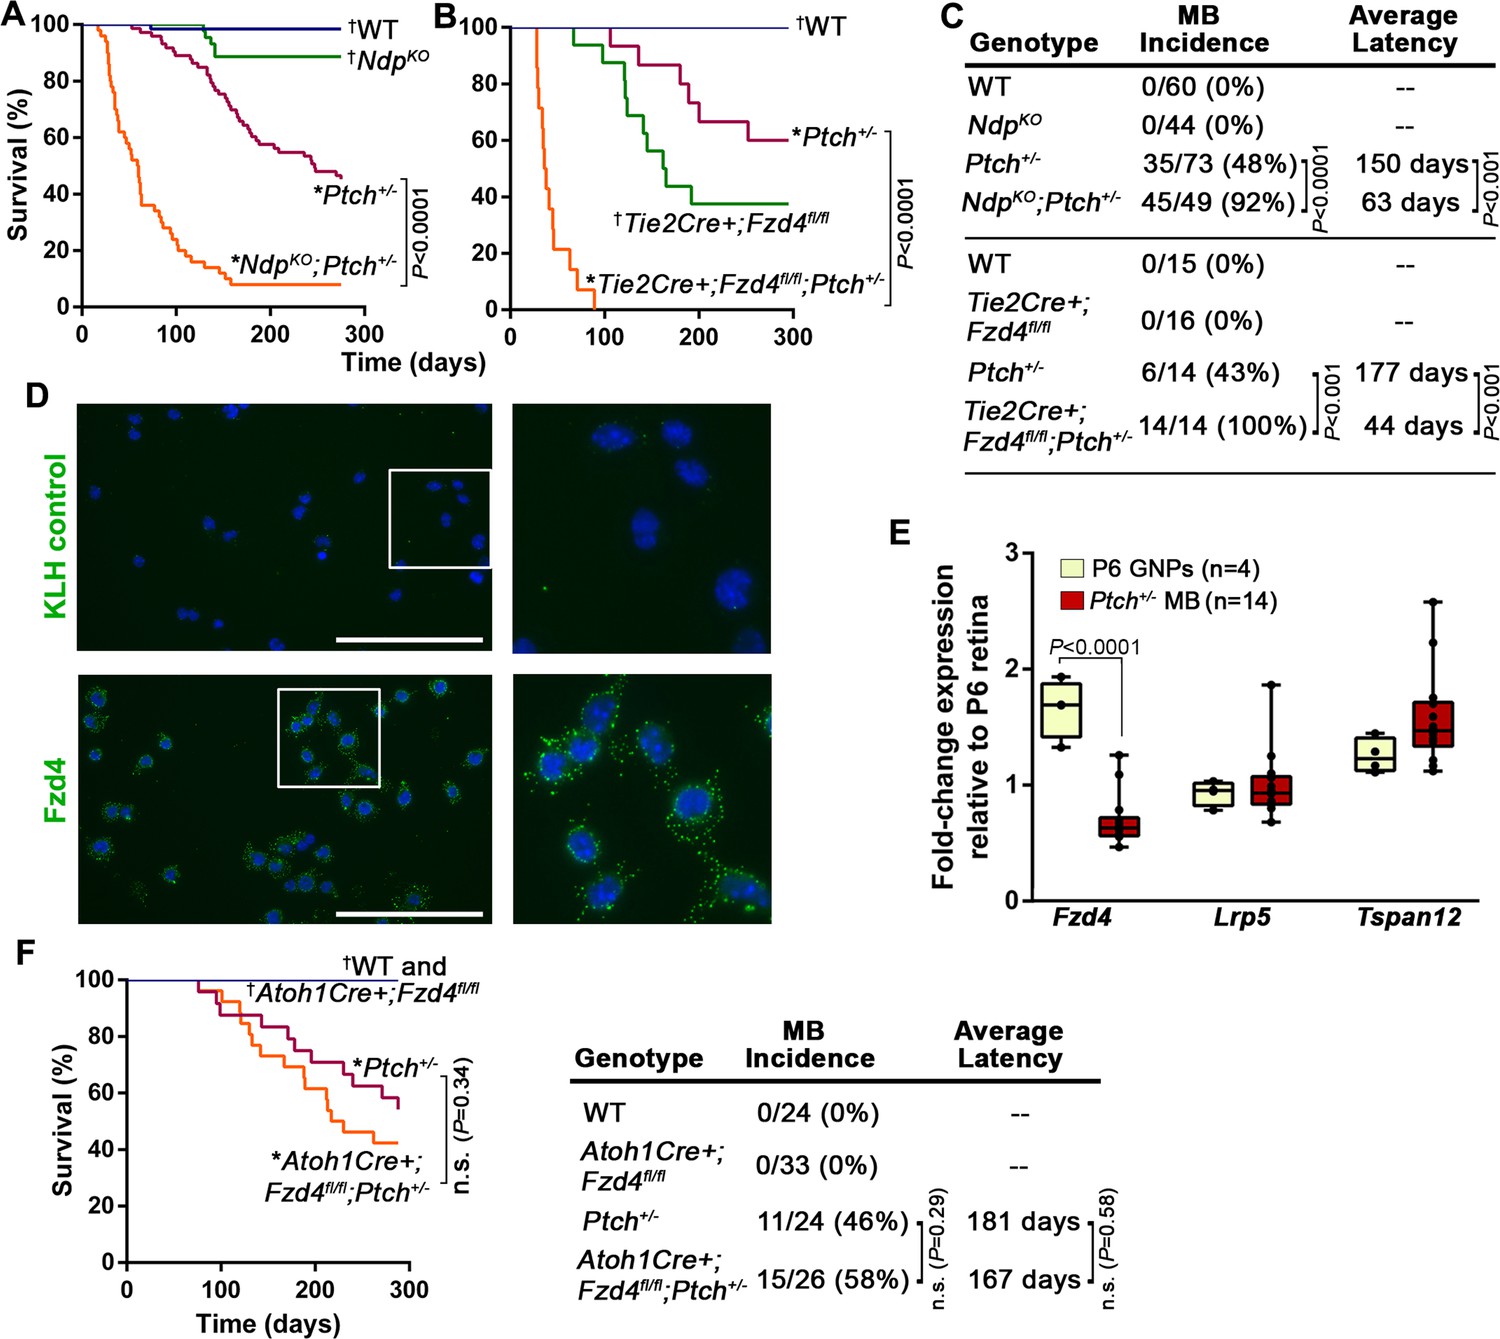
Norrin/Fzd4 signalling in endothelial cells has a potent tumor inhibitory role in Ptch+/− MB.
(A) Kaplan-Meier survival curve to assess the impact of Ndp deletion in Ptch+/− mice. NdpKO animals do not develop tumors but five of 44 animals were euthanized prematurely due to a skin condition. (B) Kaplan-Meier survival curve to assess the impact of endothelial cell-targeted (Tie2Cre-driven) Fzd4 deletion in Ptch+/− mice. Tie2Cre+;Fzd4fl/fl animals do not develop tumors but exhibit reduced survival as reported in Fzd4KO mice, which die with esophageal-related feeding defects and progressive auditory and cerebellar degeneration (Wang et al., 2001). (C) Summary of sample sizes, MB incidence and average latency in all animals from Kaplan-Meier survival curves in A and B. (D) Purified P10 GNPs immunostained for anti-FZD4 and anti-keyhole limpet hemocyanin (KLH) isotype-matched control (green), counterstained with Hoescht (blue). White boxes are magnified at right. (E) Box plots of qRT-PCR analysis of Norrin receptor components in isolated mouse GNPs and Ptch+/− MB. (F) Kaplan-Meier survival curve to assess the impact of GNP-targeted (Atoh1Cre-driven) Fzd4 deletion in Ptch+/− mice. (G) Summary of sample sizes, MB incidence and average latency in all animals from Kaplan-Meier survival curve in F *Died with confirmed MB; †Do not develop MB. WT, wild-type; n.s., not significant.
Figure 3 with 1 supplement
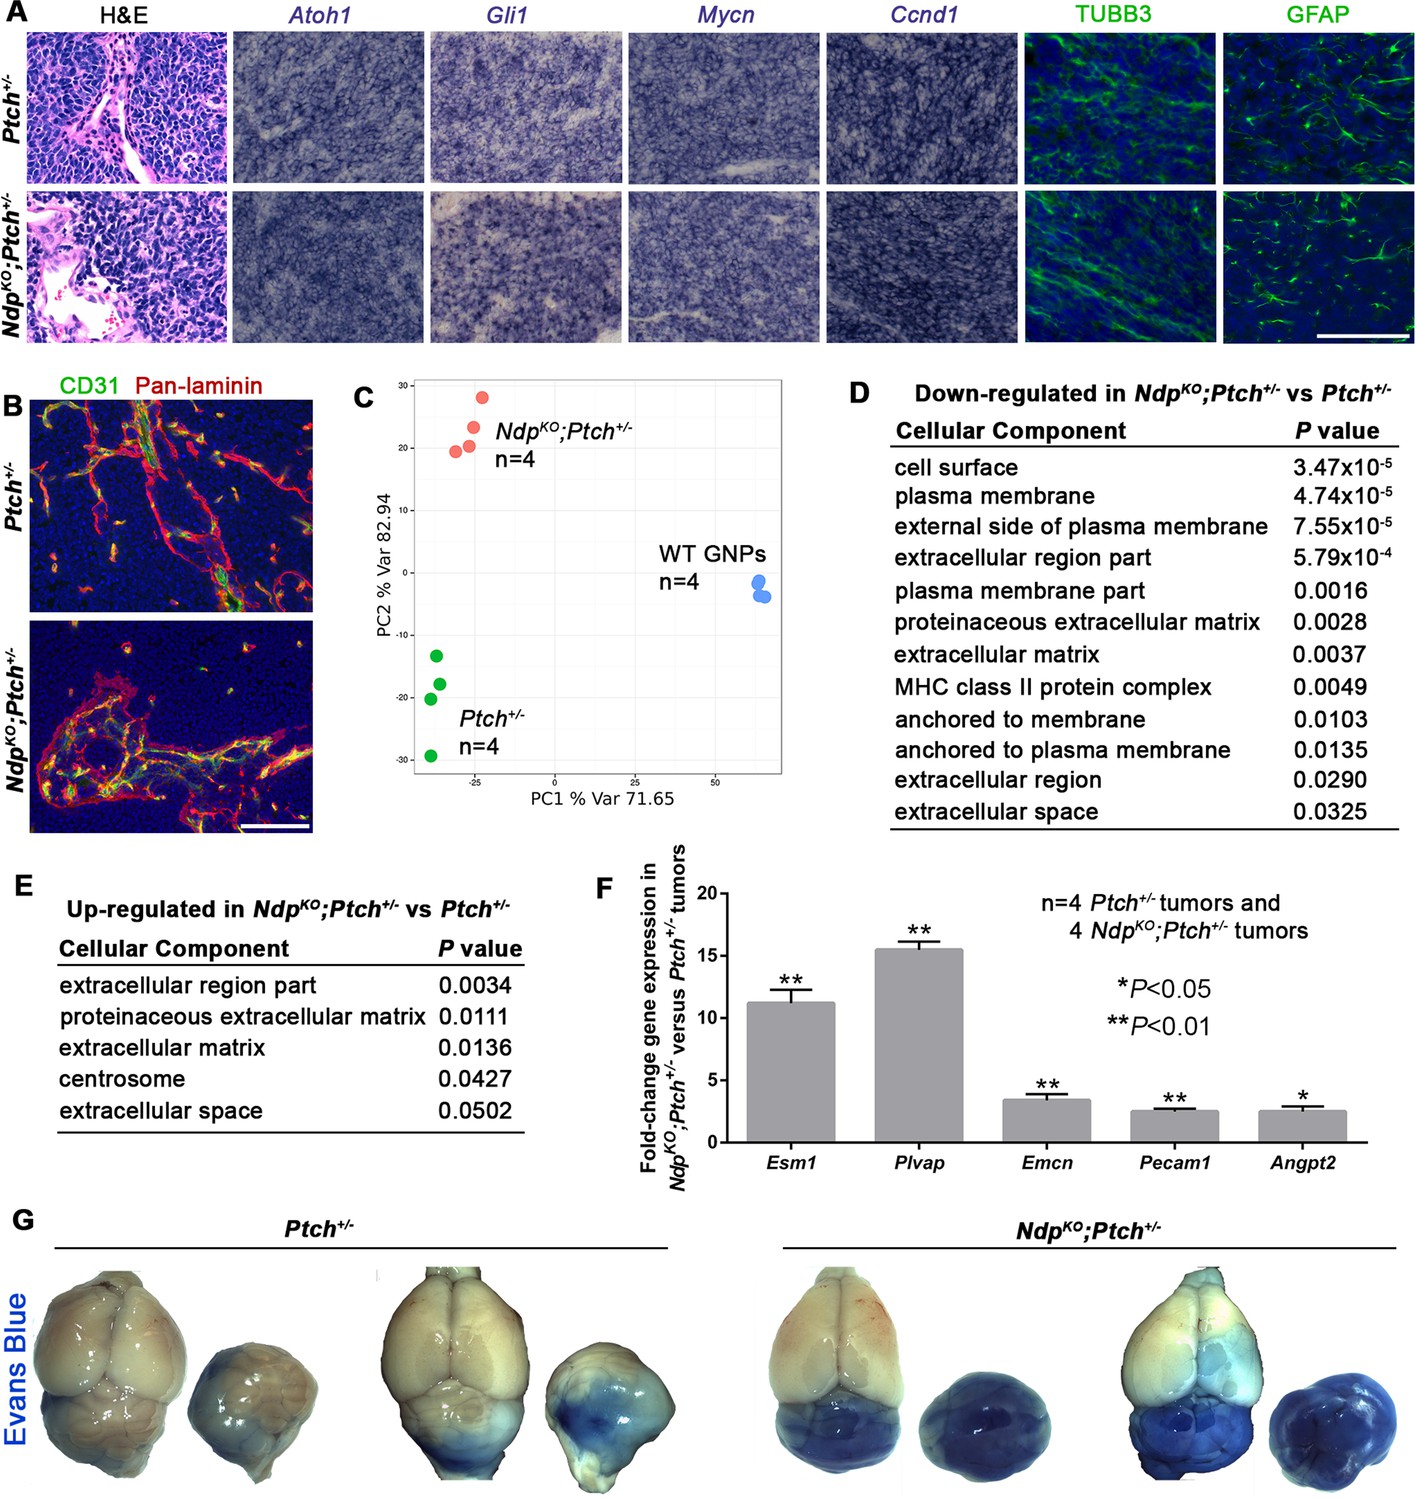
Ptch+/− and NdpKO;Ptch+/− MBs have separable gene expression signatures enriched for stromal gene changes.
(A) Sections of Ptch+/− and NdpKO;Ptch+/− established MBs stained by hematoxylin and eosin (H and E), in situ hybridization for Atoh1, Gli1, Mycn and Ccnd1 (purple), or immunostaining for class III β-tubulin (TUBB3) and glial fibrillary acidic protein (GFAP; green) counterstained with Hoescht (blue). n = 3 tumors of each genotype examined. (B) Sections of Ptch+/− and NdpKO;Ptch+/− established MBs co-immunostained for CD31 (green) and pan-laminin (red), counterstained with Hoescht (blue). n = 3 tumors of each genotype examined. (C) Whole genome expression profiles of Ptch+/− and NdpKO;Ptch+/− MBs and P6 WT (wild-type) GNPs were used for principal component analysis performed with the 1500 most variable probes across all samples. (D,E) Cellular component gene ontology (GO) analysis of differentially expressed genes between Ptch+/− and NdpKO;Ptch+/− MBs. (F) qRT-PCR analysis of vascular genes upregulated in NdpKO;Ptch+/− versus Ptch+/− MBs. (G) Wholemount views of Ptch+/− and NdpKO;Ptch+/− MBs in animals injected with Evans Blue dye prior to sacrifice. Scale bars, 100 µm. See also Figure 3—figure supplement 1.
Figure 3—figure supplement 1
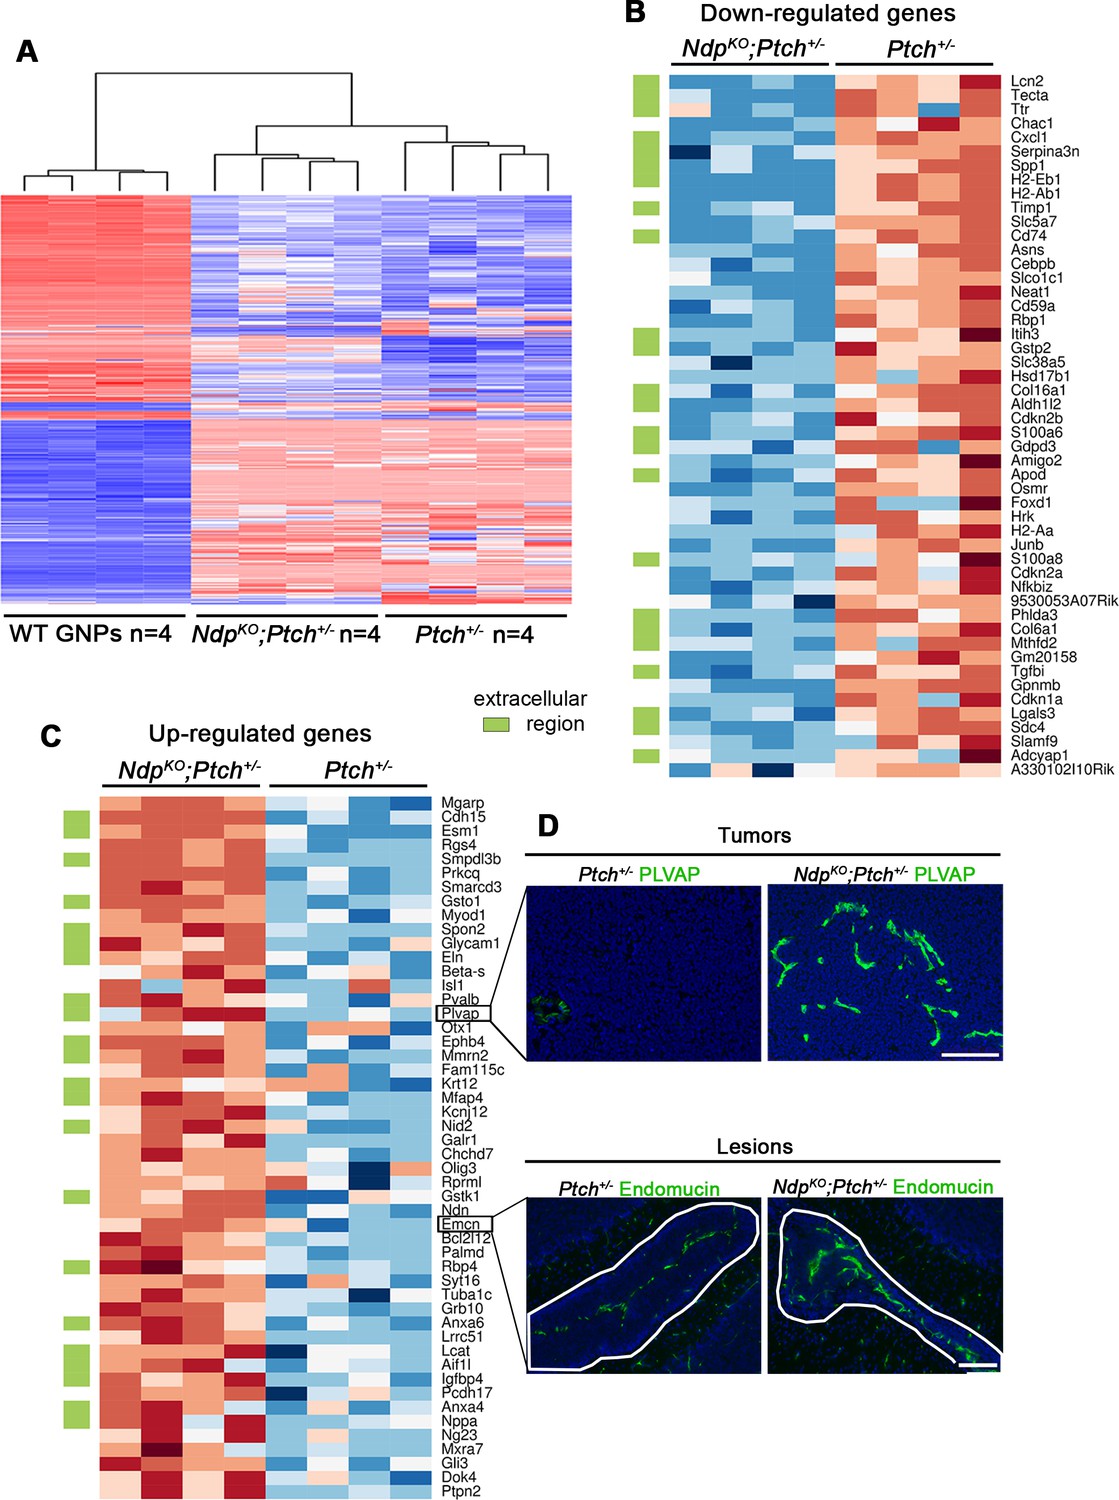
Differential stromal gene expression in Ptch+/− MB upon loss of Ndp.
(A) Hierarchical clustering calculated from the 1500 probes with the largest interquartile ranges across all samples following whole genome expression analyses of Ptch+/−- and NdpKO;Ptch+/− MBs and P6 WT (wild-type) GNPs. (B,C) A total of 1586 transcripts were detected, using limma (Smyth, 2004), as differentially expressed in Ptch+/− versus NdpKO;Ptch+/− MB with adjusted P values below 0.05. The heatmaps display the top 50 most up- and down-regulated genes between the two tumor types. Genes marked by a green rectangle fall into the extracellular region Gene Ontology (GO) class. (D) Immunostains of PLVAP and Endomucin (green) on NdpKO;Ptch+/− and Ptch+/− MBs (top) and lesions (bottom) demonstrates validation of up-regulated genes at the protein level. Scale bars, 100 µm.
Figure 4 with 1 supplement
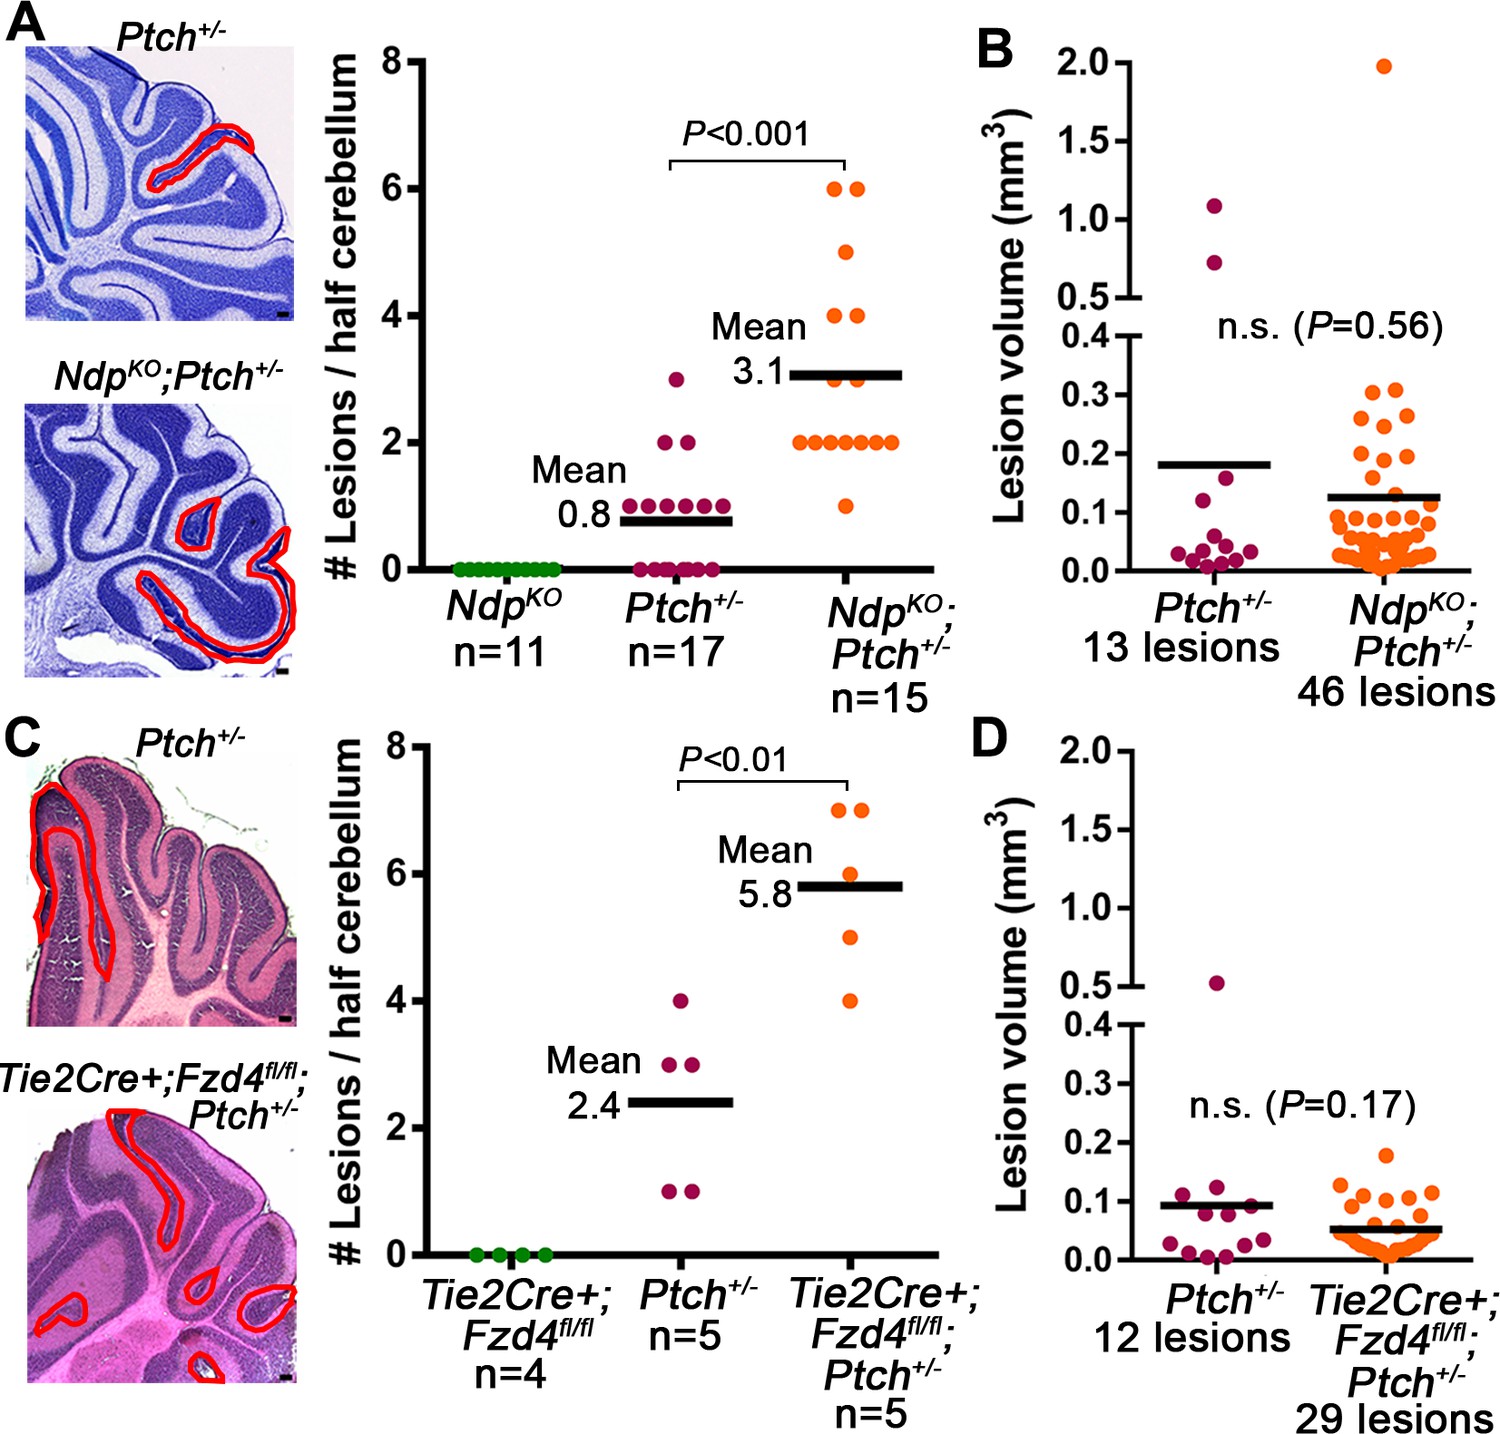
Loss of Norrin/Fzd4 signalling increases lesion formation in P14 Ptch+/− cerebella.
(A) Quantification of lesions from serial sections of cresyl violet stained P14 cerebella from NdpKO, Ptch+/− and NdpKO;Ptch+/− mice. Example lesions are outlined in red, and n indicates the number of mice examined. (B) Quantification of lesion volumes from the lesions in A. (C) Quantification of lesions from serial sections of hematoxylin and eosin (H and E) stained P14 cerebella from Tie2Cre+;Fzd4fl/fl, Ptch+/−, and Tie2Cre+;Fzd4fl/fl;Ptch+/− mice. Example lesions are outline in red, and n indicates number of mice examined. (D) Quantification of lesion volumes from the lesions in C. Means are denoted by black horizontal lines on graphs. Scale bars, 100 µm. See also Figure 4—figure supplement 1.
Figure 4—figure supplement 1
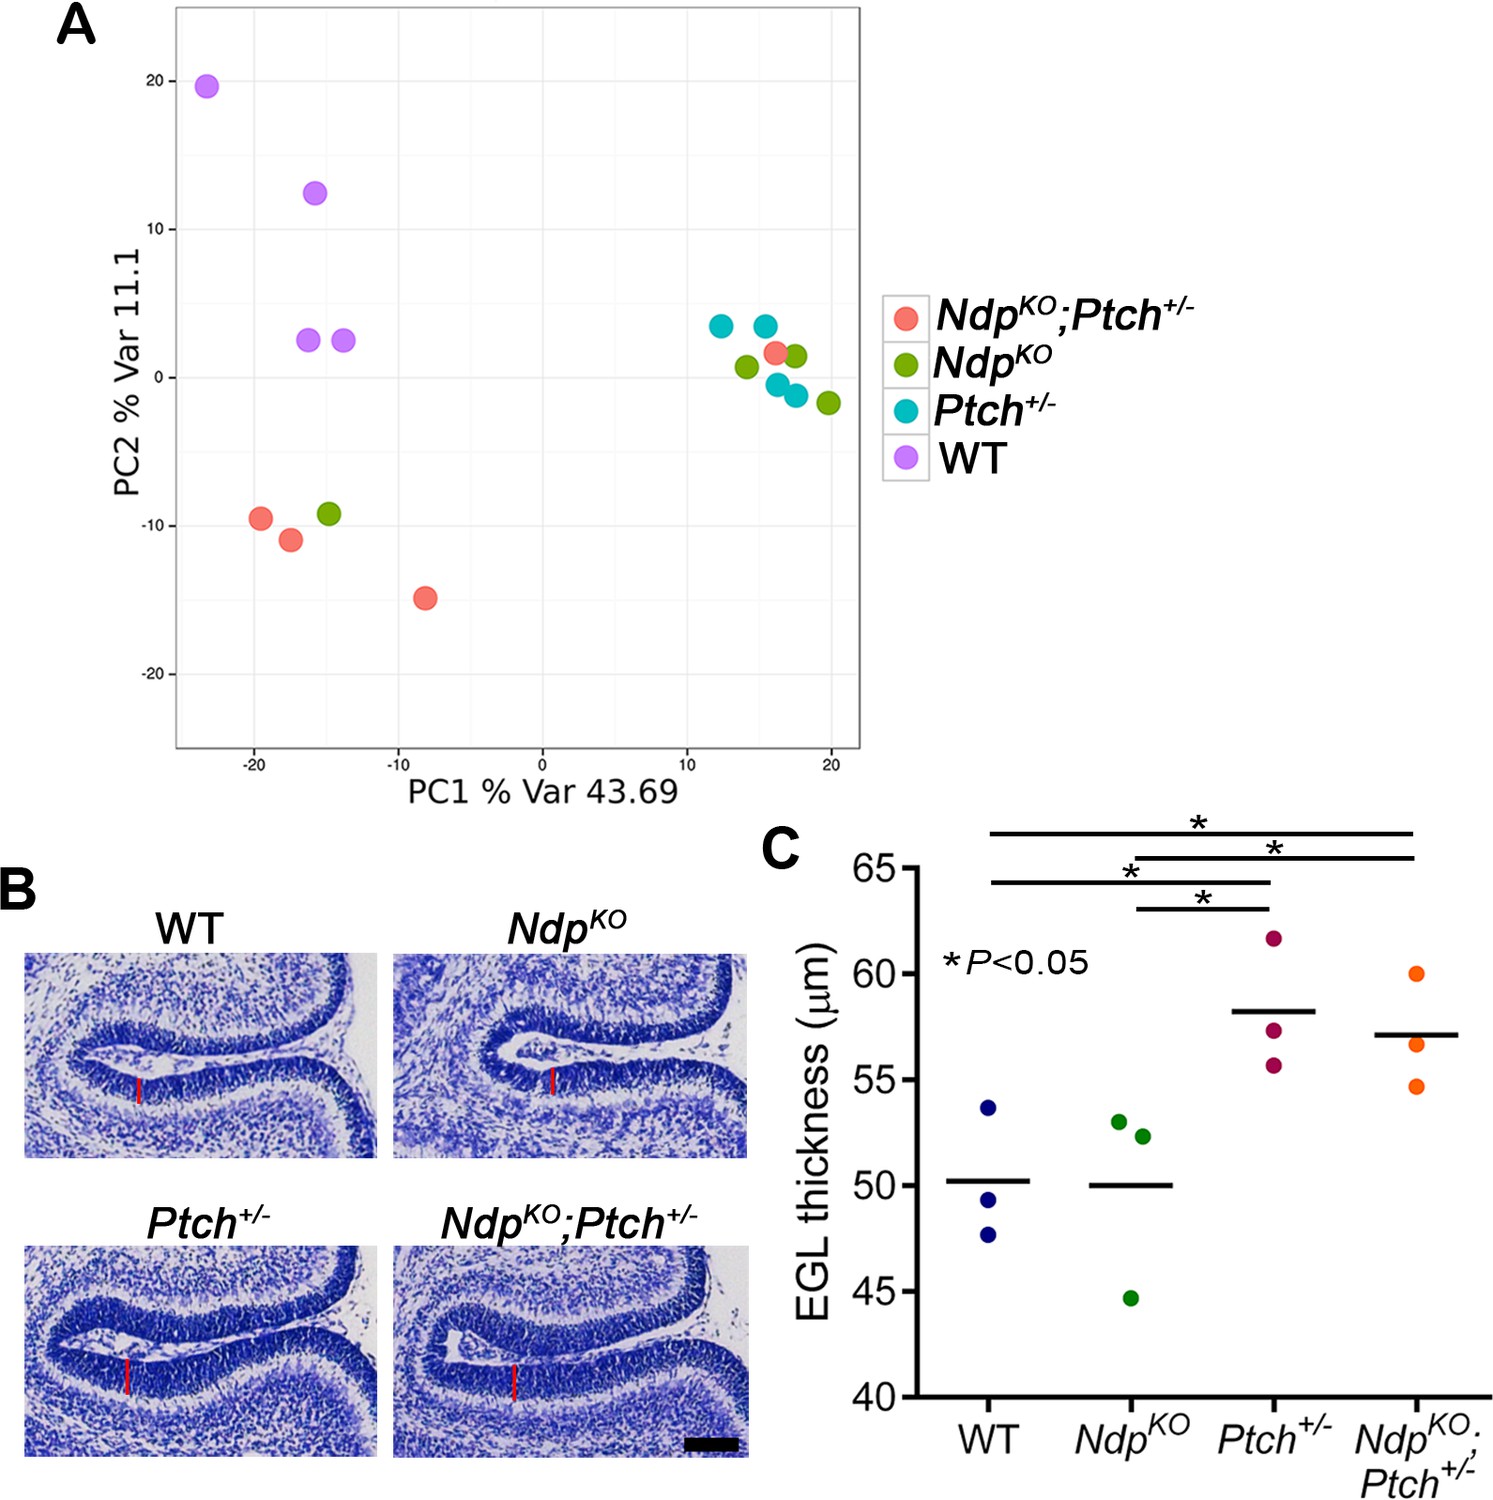
Loss of Norrin signalling in Ptch+/− mice does not promote general EGL overgrowth or significant changes in GNP gene expression profile .
(A) Principal component analysis following genome-wide expression array profiling of acutely isolated WT (wild-type), Ptch+/−, NdpKO and NdpKO;Ptch+/− GNPs (n = 4 animals per group) does not reveal clear separation of mutant GNPs. (B,C) Measurements from sections in equivalent cerebellar regions of P6 WT, Ptch+/−, NdpKO and NdpKO;Ptch+/− GNPs (n = 3 in each group) show that loss of Ndp does not increase EGL thickness in otherwise WT mice, or in Ptch+/− mice which exhibit an already thickened EGL. Vertical red lines in B denote EGL thickness. Means are denoted by black horizontal lines on the graph. Scale bar, 100 µm.
Figure 5 with 2 supplements
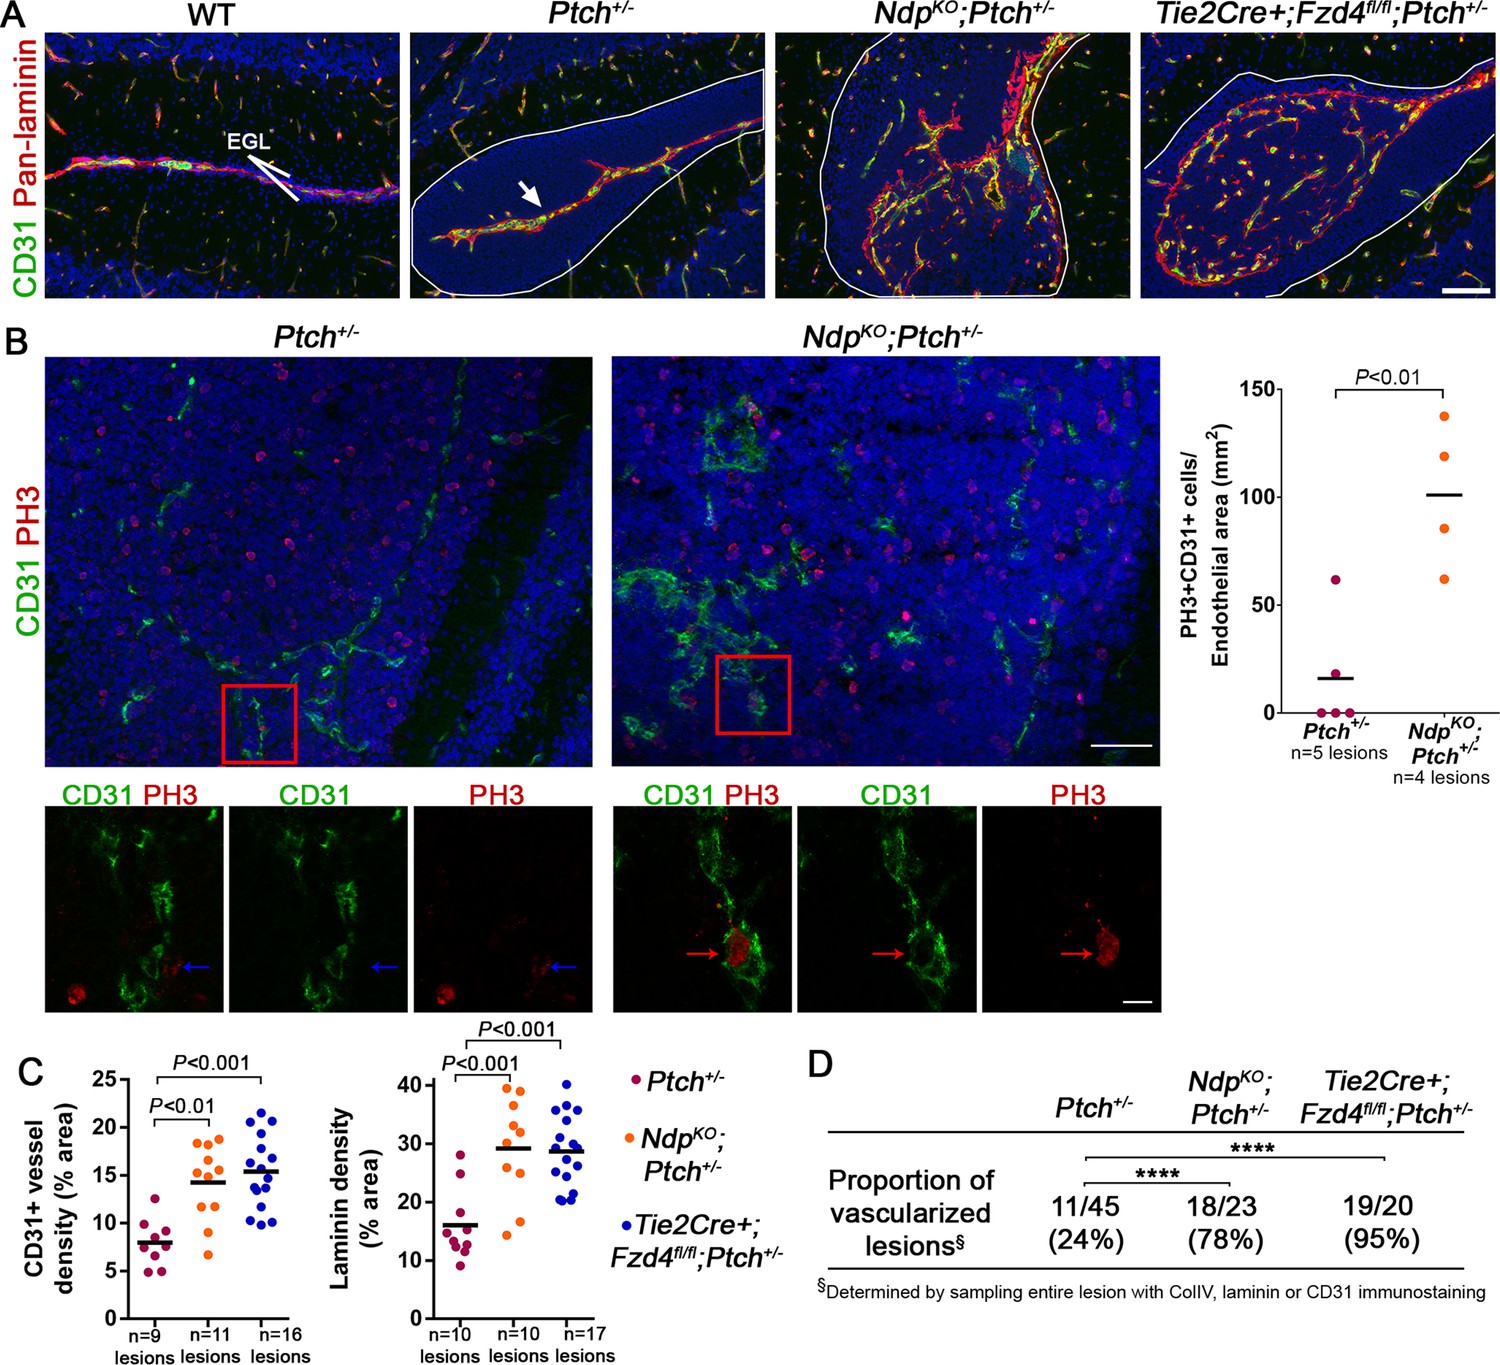
Loss of Norrin/Fzd4 signalling in endothelial cells promotes angiogenic remodeling.
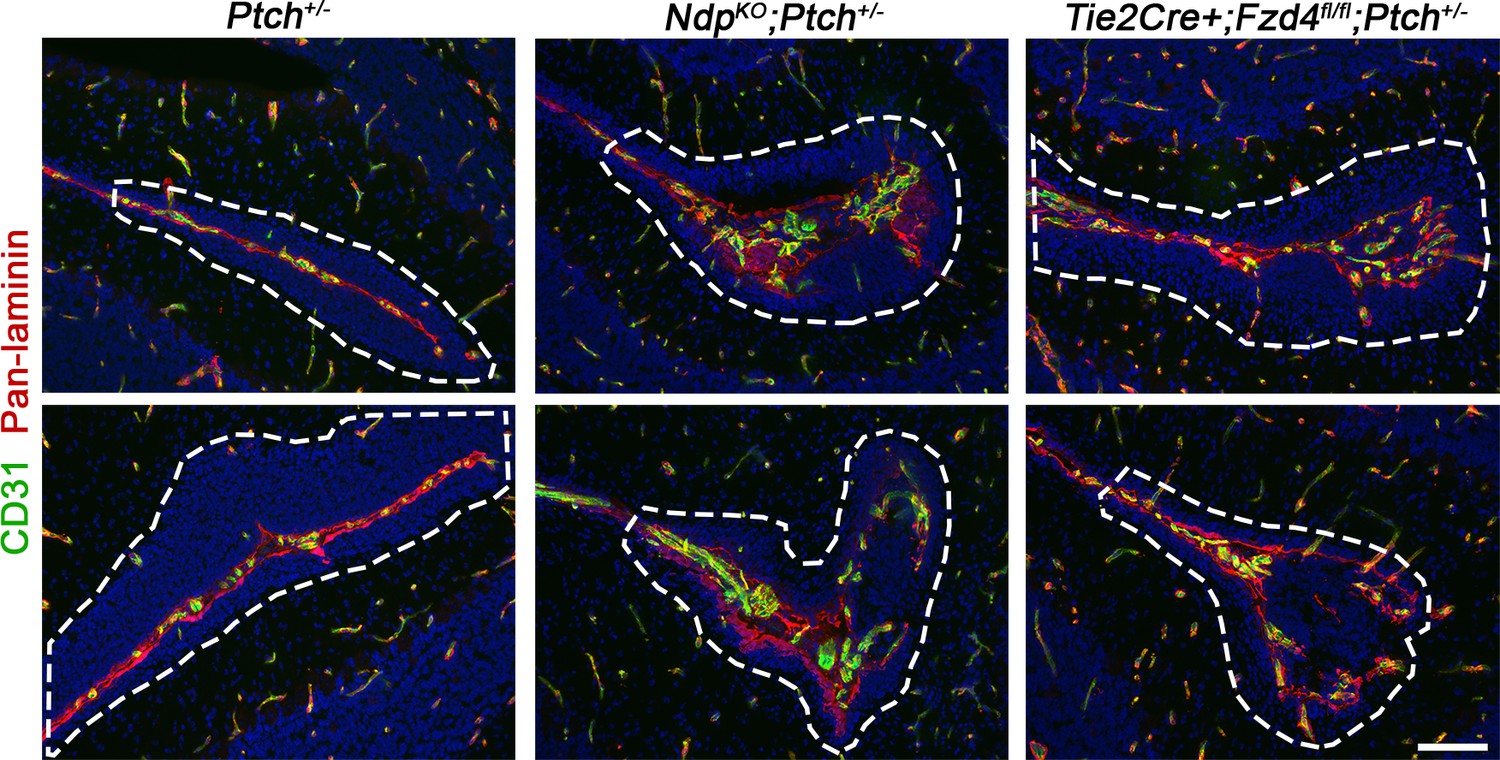
(A) Co-immunostaining for CD31 and pan-laminin, counterstained with Hoescht (blue), on sections of P14 cerebella from the genotypes indicated. Lesions are outlined in white. Arrow on Ptch+/− lesion denotes meningeal blood vessels. Scale bar, 100 µm. (B) Quantification of mitotic endothelial cells in Ptch+/− and NdpKO;Ptch+/− lesions. Top images show co-immunostaining for CD31 and PH3, counterstained with Hoescht (blue), on vascularized P14 lesion sections. Scale bar, 50 µm. Red squares denote areas shown by confocal scans below, where left image depicts the composite maximum intensity projection and the center and right images show individual z-stack slices. Scale bar, 10 µm. Blue arrows denote a PH3+ cell scored as negative for co-localization, whereas red arrows denote a positive co-localization. Graph on right summarizes quantification of double labelled PH3+CD31+ cells per endothelial area. (C) Quantification of CD31+ vessel density and laminin density in lesions of Ptch+/−, NdpKO;Ptch+/− and Tie2Cre+;Fzd4fl/fl;Ptch+/−. Number of lesions (n) examined is indicated on each graph in B and C, and means are denoted by black horizontal lines. (D) Summary of the proportion of vascularized lesions from each genotype. ****p<0.0001. See also Figure 5—figure supplement 1 and 2.
Figure 5—figure supplement 1
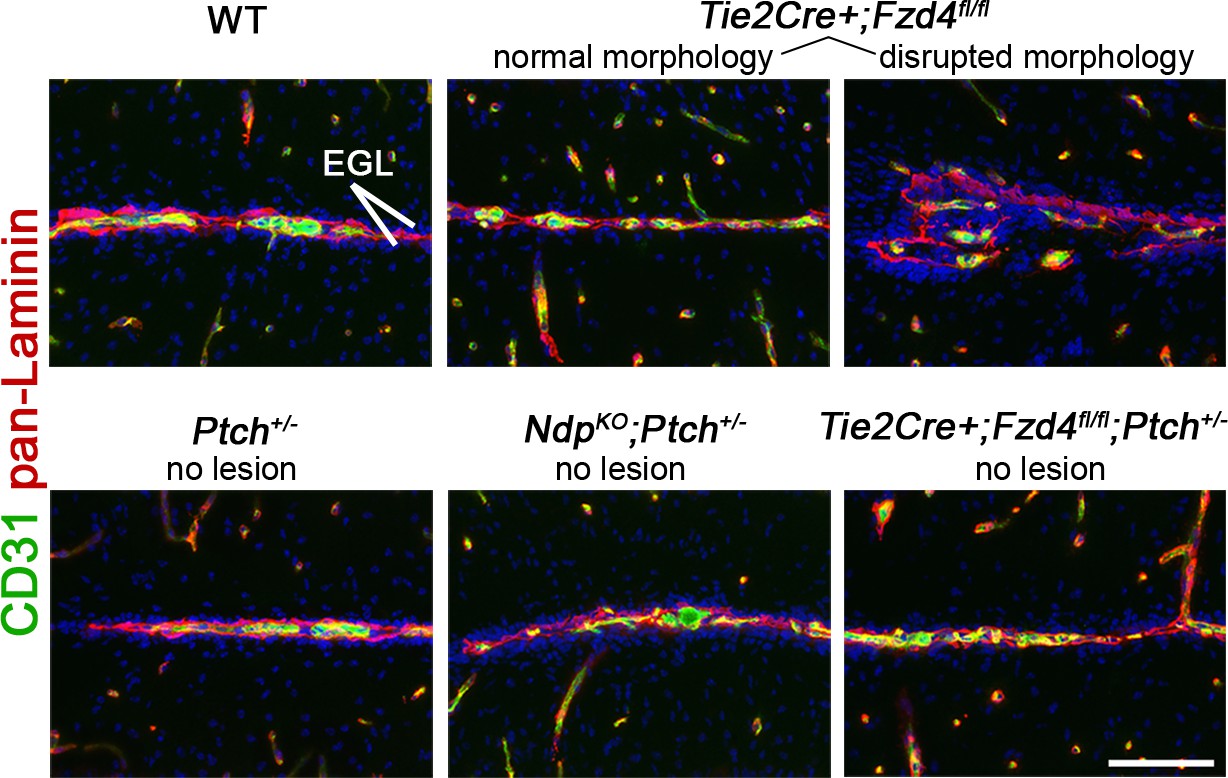
EGL-associated morphology in Norrin/Fzd4-deficient cerebella .
Co-immunostaining for CD31 and pan-Laminin from P14 animals of the genotypes indicated. Note that Tie2Cre+;Fzd4fl/fl cerebella do not develop preneoplastic lesions but exhibit rare foci of disrupted morphology associated with the EGL. 3 lesion-free regions from at least 3 cerebella per genotype were examined. EGL, external granule layer. Scale bars, 100 µm.
Figure 5—figure supplement 2
Lesion size is not correlated with vascular remodeling in NdpKO;Ptch+/− and Tie2Cre+;Fzd4fl/fl;Ptch+/− compound mutants.
Co-immunostaining for CD31 and pan-laminin on cerebellar lesion sections from P14 Ptch+/−, NdpKO;Ptch+/− and Tie2Cre+;Fzd4fl/fl;Ptch+/− mice (lesions outlined in white), to illustrate vascular remodeling in small (<0.02 mm3) compound mutant lesions. Scale bars, 100 µm.
Figure 6 with 2 supplements
Loss of Norrin/Fzd4 signalling in endothelial cells promotes vessel leakiness in Ptch+/− lesions.
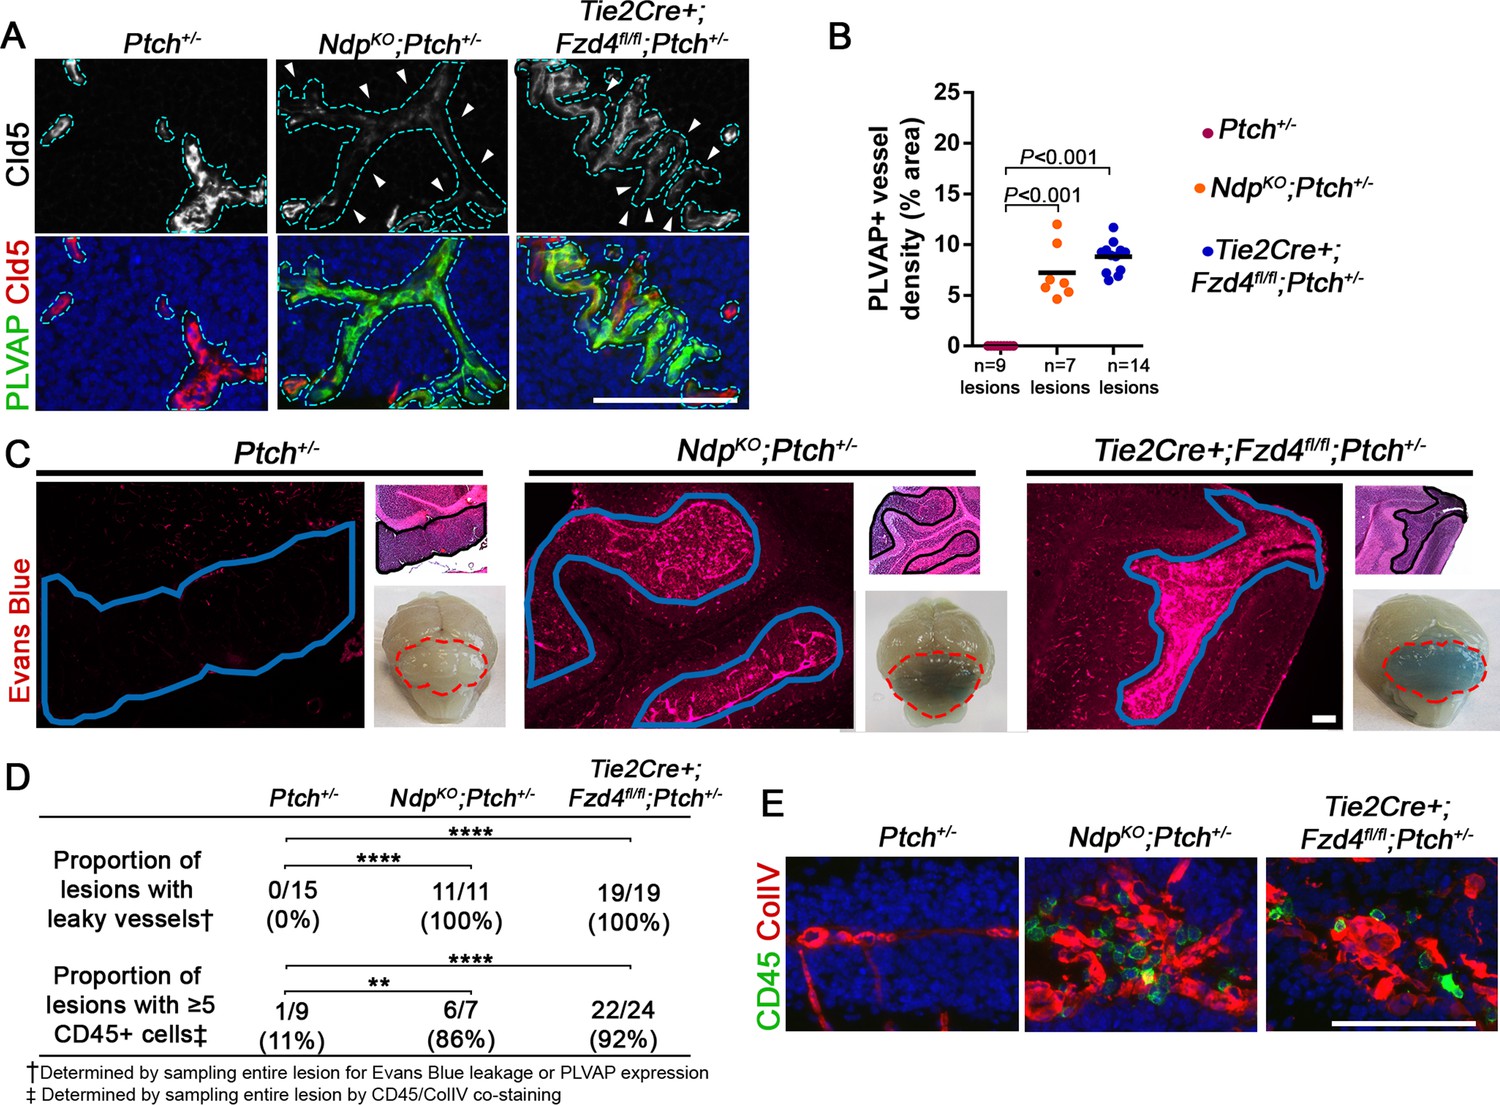
(A) Co-immunostaining for PLVAP and Claudin-5 (Cld5) counterstained with Hoescht (blue), on lesion sections of P14 cerebella from the genotypes indicated. Vessels outlined in turquoise. Top images show Cld5 channel only, to illustrate variable reduction in Cld5 expression (arrowheads). (B) Quantification of PLVAP+ vessel density in lesions of Ptch+/−, NdpKO;Ptch+/− and Tie2Cre+;Fzd4fl/fl;Ptch+/−. Number of lesions (n) examined is indicated on each graph, and means are denoted by black horizontal lines. (C) P14 Ptch+/−, NdpKO;Ptch+/− and Tie2Cre+;Fzd4fl/fl;Ptch+/− mice injected with Evans Blue dye prior to sacrifice. Sections containing lesions (outlined in blue) show Evans Blue as red fluorescence, followed by adjacent H and E-stained sections and whole brain images (cerebella outlined in red). (D) Summary of the proportion of lesions from each genotype containing leaky vessels or ≥5 CD45+ cells. ****p<0.0001; **p<0.01. (E) Co-immunostaining for CD45 and Collagen IV (ColIV) on lesion sections of P14 cerebella. Scale bars, 100 µm. See also Figure 6—figure supplement 1 and 2.
Figure 6—figure supplement 1
Norrin/Fzd4-mediated cerebellar vascular defects .
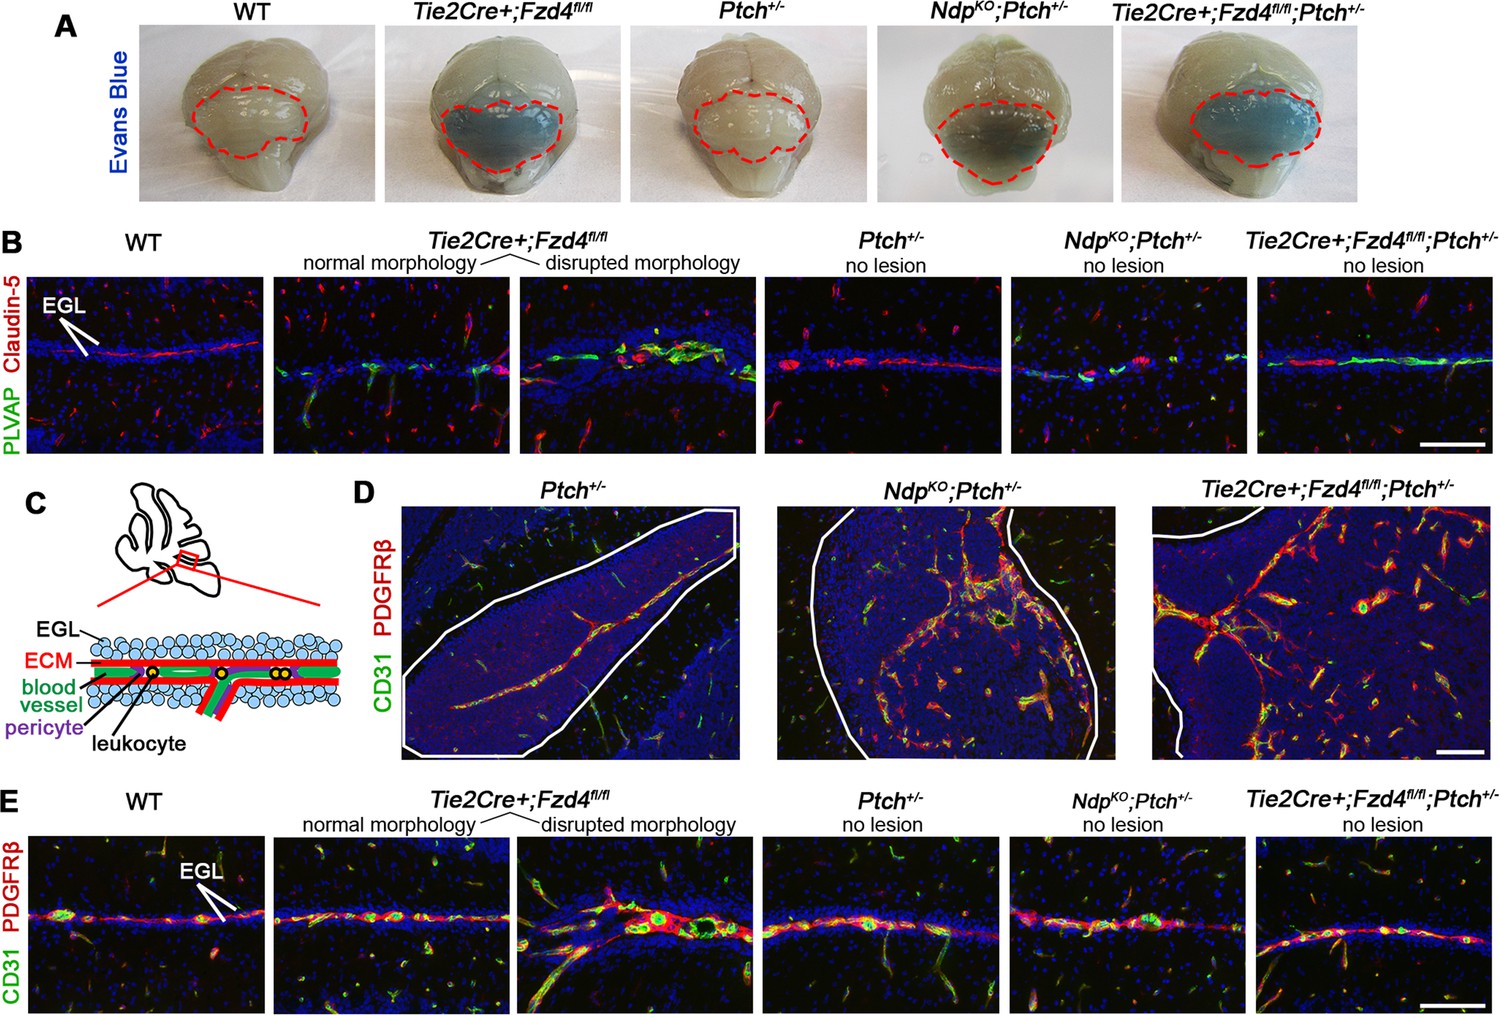
(A) Whole brain images of P14 mice injected with Evans Blue dye prior to sacrifice, to indicate blood brain barrier disruption in the cerebellum (outlined in red) upon loss of Fzd4 signalling irrespective of Ptch status, but intact barrier function in WT or single mutant Ptch+/− cerebella. (B) Co-immunostaining for plasmalemmal vesicle associated protein (PLVAP) and Claudin-5 from P14 animals of the genotypes indicated. Note presence of PLVAP+ vessels in all mutants with loss of Ndp/Fzd4. (C) Schematic of the relationship between the remaining EGL and surrounding stromal components at the surface of the P14 cerebellum. (D) Co-immunostaining for CD31 and the pericyte marker PDGFRβ on P14 cerebellar lesion sections (lesions outlined in white) from Ptch+/− (n = 8 lesions examined), NdpKO;Ptch+/− (n = 7 lesions examined) and Tie2Cre+;Fzd4fl/fl;Ptch+/− (n = 16 lesions examined). (E) Co-immunostaining for CD31 and PDGFRβ on P14 sections from the approximate cerebellar location depicted in C, from the genotypes indicated. Immunostains are counterstained with Hoescht (blue). In B and E, 3 lesion-free regions from at least 3 cerebella per genotype were examined. EGL, external granule layer; ECM, extracellular matrix. Scale bars, 100 µm.
Figure 6—figure supplement 2
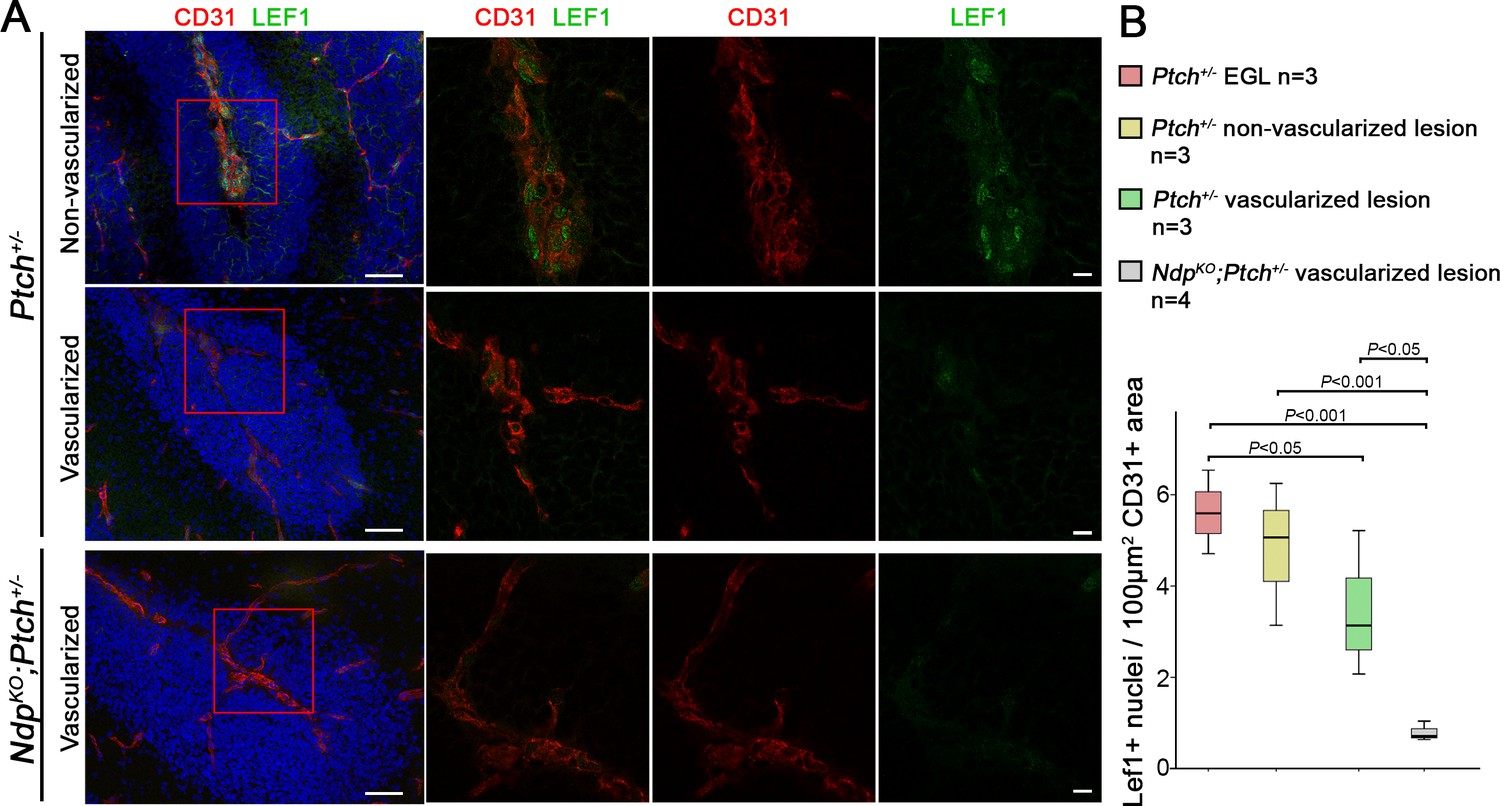
Vascularization of Ptch+/−and NdpKO;Ptch+/− lesions is associated with reduced expression of the Wnt target Lef1 in endothelial cells .
(A) Co-immunostaining for CD31 and Lef1, counterstained with Hoescht (blue), on sections of P14 Ptch+/− and NdpKO;Ptch+/− lesions. Scale bar, 50 µm. Red squares denote the area magnified on the right and shown by confocal images of single z-stack slices. Scale bar, 10 µm. (B) Quantification of double labelled Lef1+CD31+ cells per endothelial area in Ptch+/− lesions (vascularized and non-vascularized) and NdpKO;Ptch+/− lesions.
Figure 7 with 2 supplements
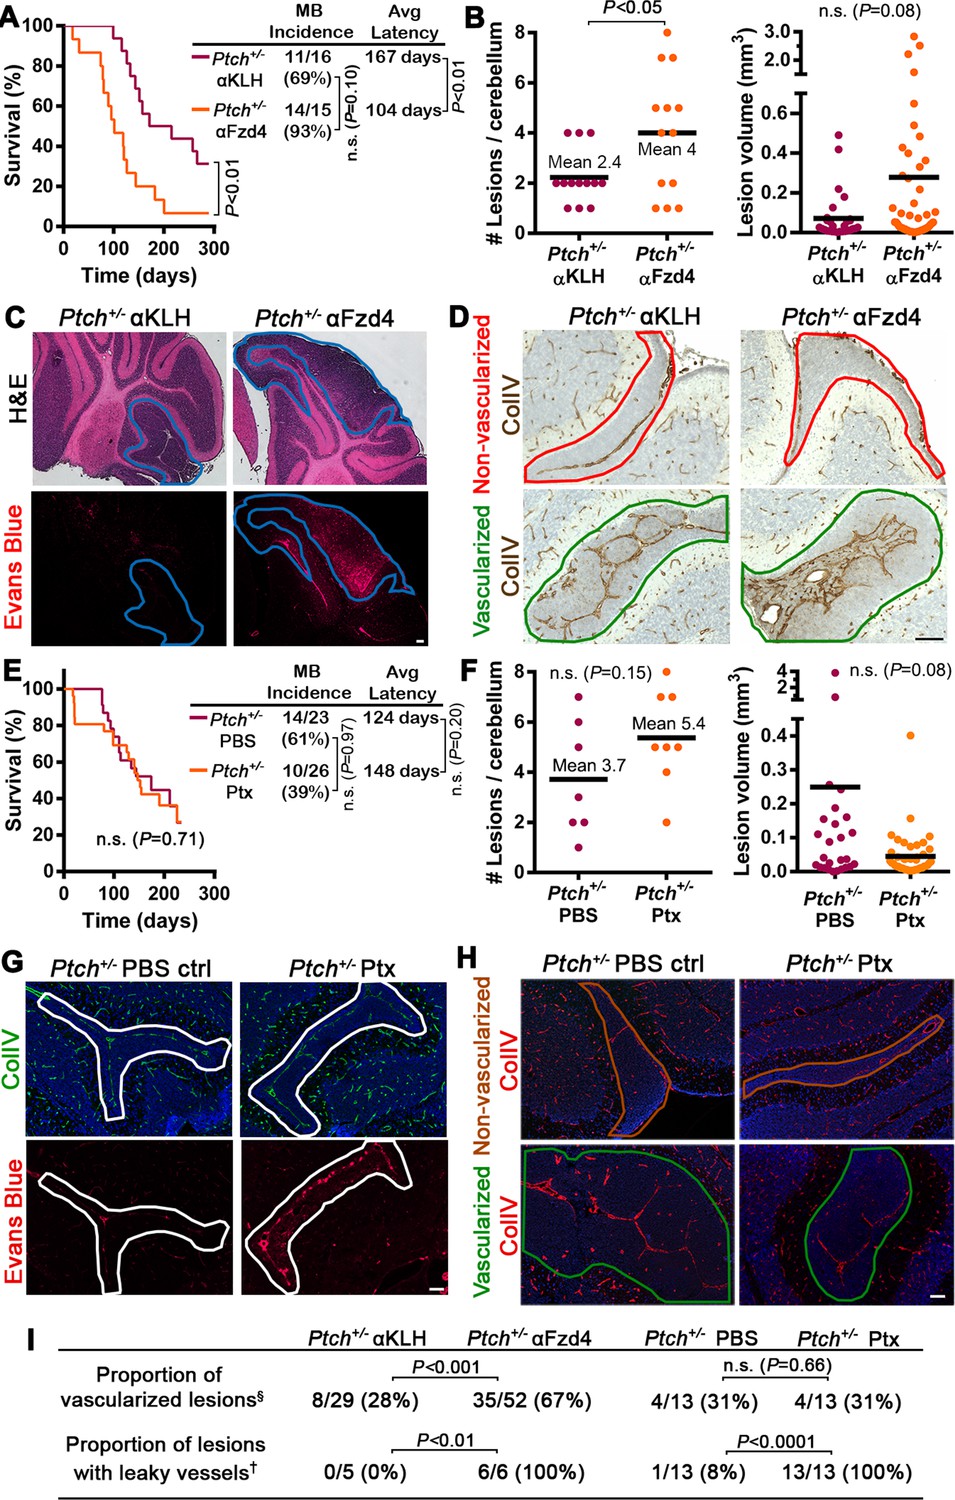
Acute disruption of Fzd4 promotes the conversion to a pro-tumor stroma .
(A) Kaplan-Meier survival curve comparing Ptch+/− mice treated with αFzd4 or αKLH isotype matched control antibodies at P7 and P16. All mice died with confirmed MB. Sample sizes, MB incidence and average latency are indicated at right. (B) Quantification of lesion number and volume from P14 cerebella of Ptch+/− mice treated at P7 with αFzd4 (n = 13 mice, 52 lesions total) or αKLH (n = 13 mice, 29 lesions total). Means are denoted by black horizontal lines on graphs. (C) Lesion images from Ptch+/− mice treated at P7 with αKLH (n = 5 lesions) or αFzd4 (n = 6 lesions). Mice were injected with Evans Blue dye prior to sacrifice and sampled by H and E staining followed by Evans Blue visualization as red fluorescence on adjacent sections. Lesions outlined in blue. (D) Lesion images from Ptch+/− mice treated at P7 with αKLH (n = 29 lesions) or αFzd4 (n = 52 lesions), immunostained for ColIV and counterstained with hematoxylin, to quantify the proportions of non-vascularized (outlined in red) and vascularized (outlined in green) lesions in each group. (E) Kaplan-Meier survival curve comparing Ptch+/− mice treated with Ptx or PBS vehicle control at P7, P9, P11 and P13. The sudden drop in Ptx-treated survival is a result of four animals dying from brain hemorrhages or seizures. Three other Ptx-treated animals were euthanized due to malocclusion or unknown causes, while all other mice in both groups died with confirmed MB. Sample sizes, MB incidence and average latency are indicated at the right. (F) Quantification of lesion number and volume from P14 cerebella of Ptch+/− mice treated as above with Ptx (n = 8 mice, 43 lesions total) or PBS (n = 7 mice, 26 lesions total). (G) Lesion images from Ptch+/− mice treated with Ptx (n = 13 lesions) or PBS (n = 13 lesions) as above. Mice were injected with Evans Blue dye prior to sacrifice and sampled by ColIV immunostaining followed by Evans Blue visualization as red fluorescence on adjacent sections. Lesions outlined in white. (H) Lesion images from Ptch+/− mice treated with Ptx (n = 13 lesions) or PBS (n = 13 lesions) as above, immunostained for ColIV to quantify the proportions of non-vascularized (outlined in brown) and vascularized (outlined in green) lesions in each group. (I) Summary of Ptch+/− lesion number and vessel parameters upon treatment with αFzd4 or Ptx. Scale bars, 100 µm. See also Figure 7—figure supplement 1 and 2.
Figure 7—figure supplement 1
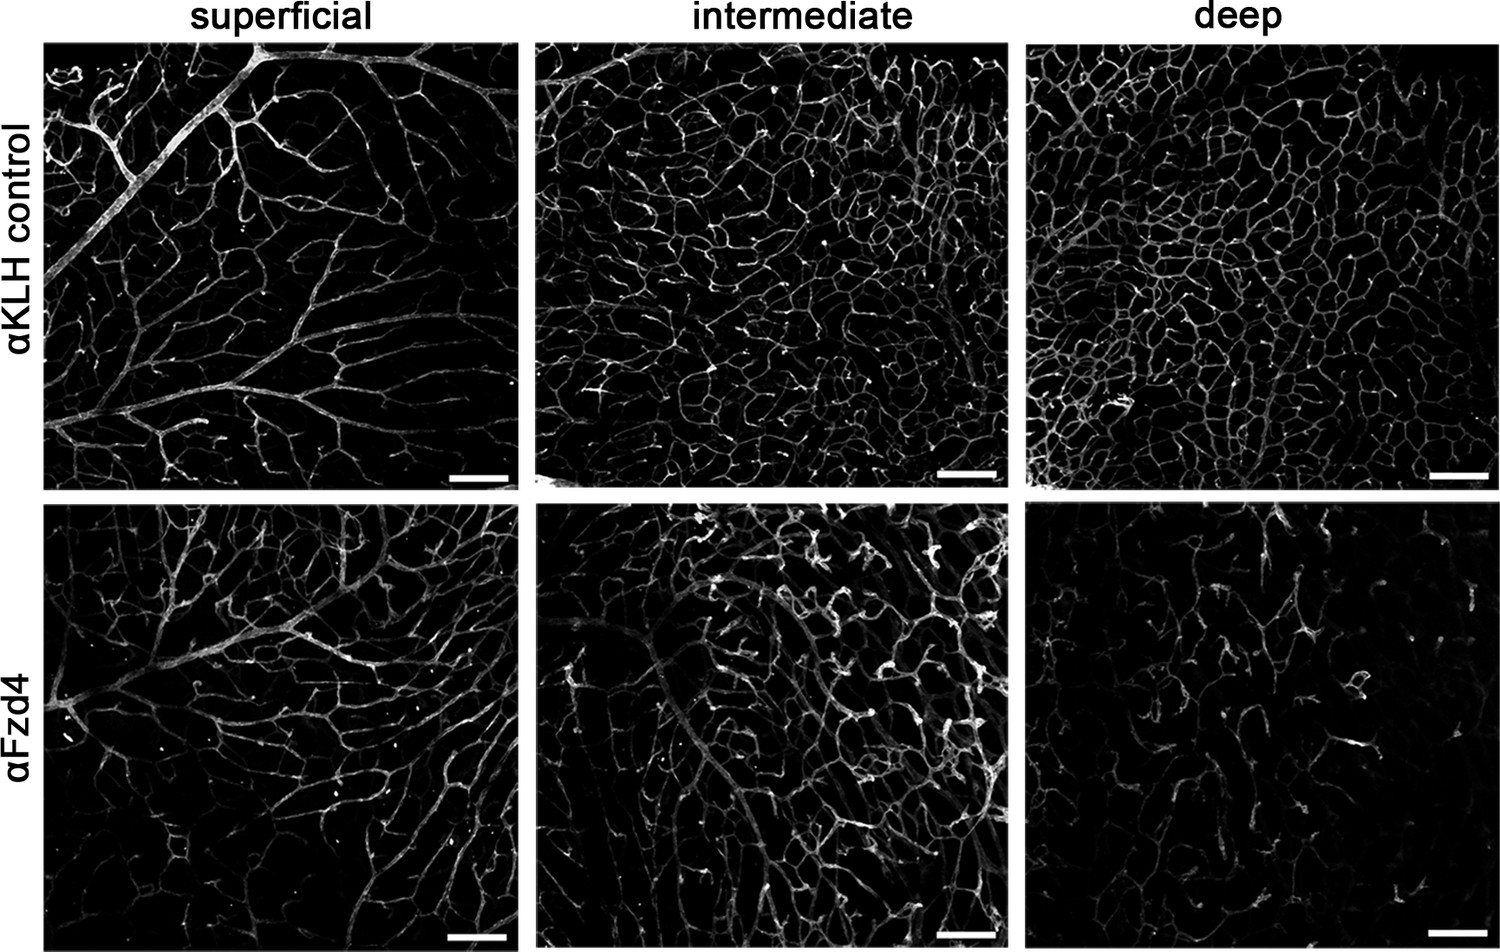
Functional in vivo validation of anti-Fzd4 blocking antibody .
Retina whole mount preparations of P14 wild-type mice injected at P7 with a single dose of anti-Fzd4 (αFzd4) blocking antibody (n = 3) or anti-KLH (αKLH) isotype matched control antibody (n = 3). Confocal images show slices from the lectin-stained peripheral retina to represent the superficial vascular plexus, and intermediate and deep capillary beds. Note the reduced vascular density and abnormal vascular morphology in the intermediate and deep capillary beds of αFzd4-treated mice, as previously reported (Paes et al., 2011). Scale bars, 100 µm
Figure 7—figure supplement 2
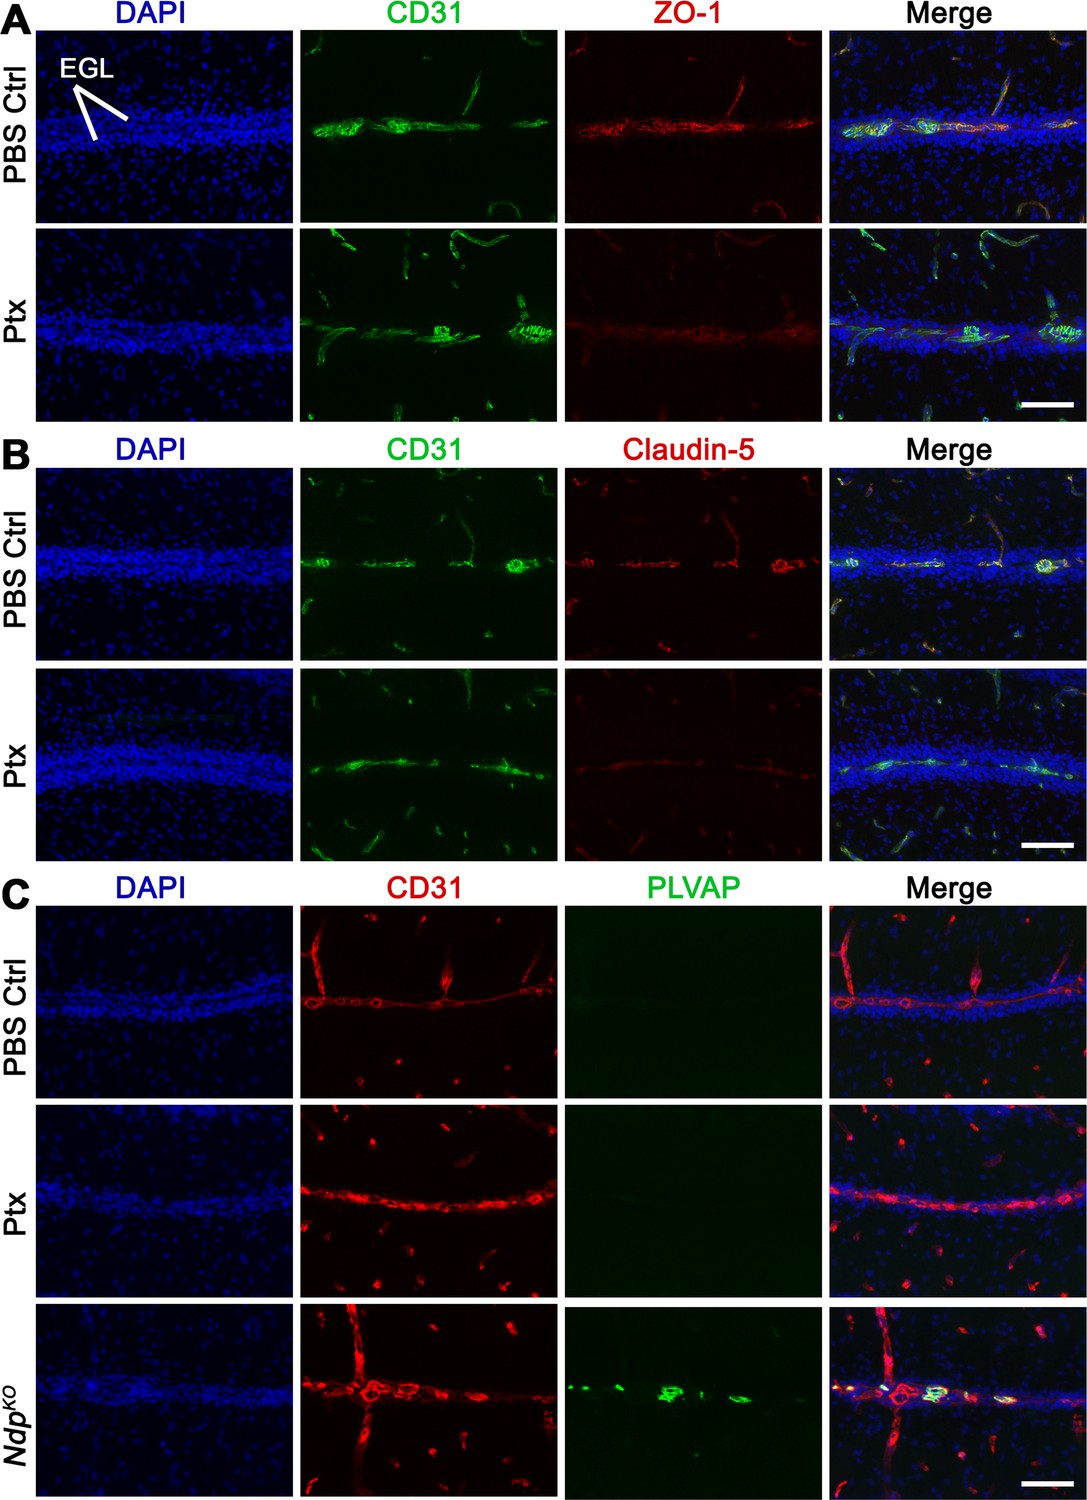
Disruption of cerebellar endothelial cell tight junctions upon treatment with pertussis toxin (Ptx) .
(A-C) Immunostaining on cerebellar sections from P14 wild-type mice treated with Ptx or PBS control at P7, 9, 11 and 13. At least 6 sections from n = 3 cerebella per treatment group were examined. (A) Double labelling with the blood vessel marker CD31 and the tight junction protein zona occludens -1 (ZO-1) reveals a reduction in ZO-1 expression in Ptx-treated animals. (B) Double labelling with CD31 and the tight junction protein claudin-5 shows a variable reduction in claudin-5 expression in Ptx-treated animals. (C) Double labelling with CD31 and the fenestrated endothelial cell marker plasmalemmal vesicle associated protein (PLVsAP) demonstrates that Ptx-induced blood brain barrier disruption is PLVAP-independent. Positive PLVAP immunostaining in an NdpKO cerebellum (bottom row) is shown as a control. Scale bars, 100 µm.
Figure 8 with 1 supplement
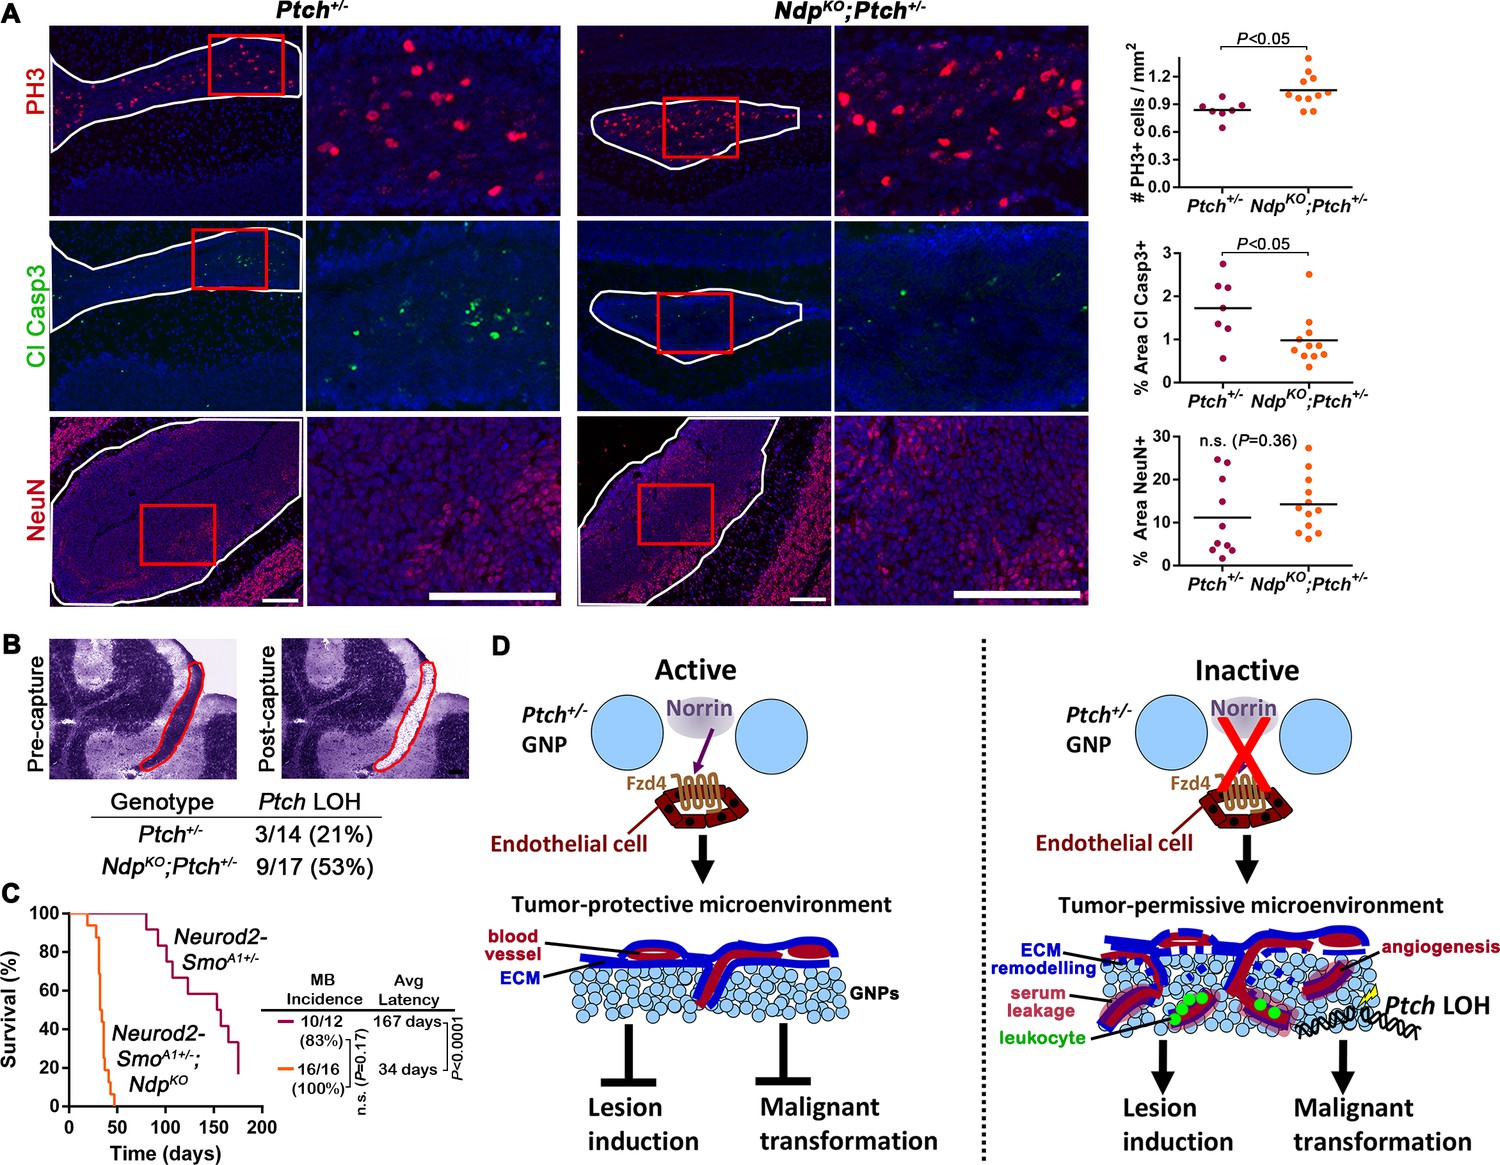
Loss of Norrin signalling accelerates the transition to malignancy in Ptch+/− lesions.
(A) Immunostaining and quantification of proliferation (PH3; n=7 Ptch+/− lesions and n=11 NdpKO;Ptch+/− lesions), apoptosis (cleaved caspase 3; n=7 Ptch+/− lesions and n=11 NdpKO;Ptch+/− lesions) and differentiation (neuronal nuclear protein NeuN; n=10 Ptch+/− lesions and n=12 NdpKO;Ptch+/− lesions) on P14 cerebellar lesions (outlined in white) counterstained with Hoescht (blue). Areas in red boxes are magnified at right. Means are denoted by black horizontal lines on graphs. (B) Frequency of Ptch loss of heterozygosity (LOH) in lesions of P14 Ptch+/− and NdpKO;Ptch+/− mice, determined by wild-type allele-specific detection of Ptch transcripts from microdissected lesions. Example images depict a toluidine blue-stained cerebellar section pre- and post-laser capture (lesion outlined in red). (C) Kaplan-Meier survival curve to assess the impact of Ndp deletion in the Neurod2-SmoA1+/− model of MB (D) Schematic to illustrate the effects of Norrin/Fzd4 signalling on Ptch+/− MB progression. n.s., not significant. ECM, extracellular matrix. Scale bars, 100 µm. See also Figure 8—figure supplement 1.
Figure 8—figure supplement 1
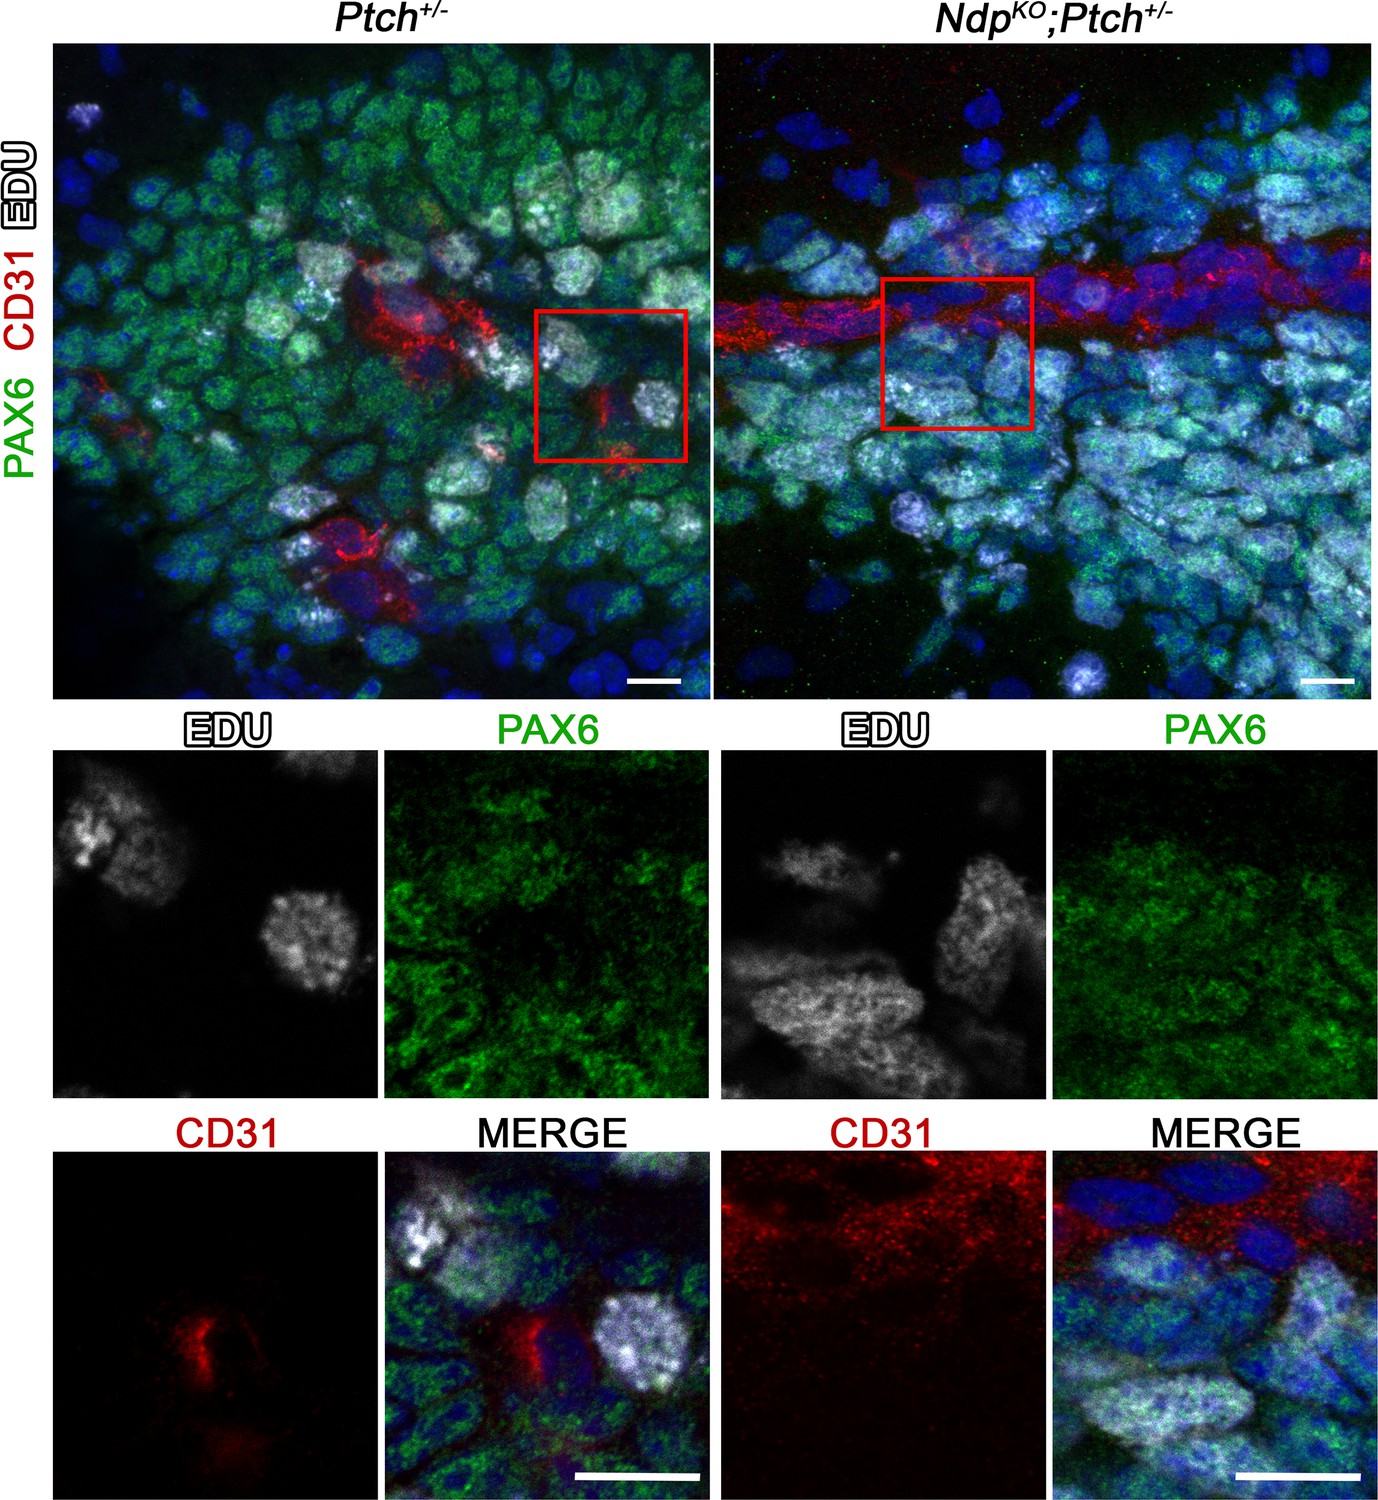
Proliferating GNPs are present in the vicinity of blood vessels in Ptch+/− and NdpKO;Ptch+/− lesions .
Confocal images of triple staining for Pax6, CD31 and EdU in lesions from P14 Ptch+/− (n = 2) and NdpKO;Ptch+/− (n = 3) mutants pulsed with EdU prior to sacrifice. Top row depicts composite maximum intensity projections, and boxed areas are shown below as individual z-stack slices. Scale bars, 10 µm.
Download links
A two-part list of links to download the article, or parts of the article, in various formats.
Downloads (link to download the article as PDF)
Open citations (links to open the citations from this article in various online reference manager services)
Cite this article (links to download the citations from this article in formats compatible with various reference manager tools)
Norrin/Frizzled4 signalling in the preneoplastic niche blocks medulloblastoma initiation
eLife 5:e16764.
https://doi.org/10.7554/eLife.16764


