Synaptic transmission parallels neuromodulation in a central food-intake circuit
- LIMES Institute, University of Bonn, Germany
- Janelia Research Campus, Howard Hughes Medical Institute, United States
Figures
Figure 1
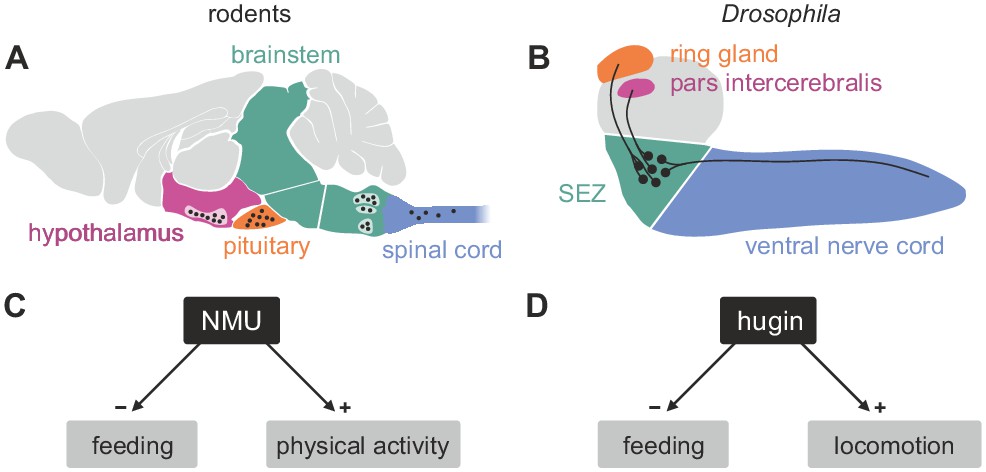
Comparison of mammalian neuromedinU and Drosophila hugin.
(A) NeuromedinU (NMU) is widely distributed in the rodent CNS. NMU peptide, NMU-expressing cells and NMU-positive fibers are found in several regions of the brain stem, hypothalamus, pituitary and spinal cord (black dots). The number of neurons and their morphology is unknown. (B) In Drosophila, distribution of the homologous neuropeptide hugin is less complex and well known: hugin is expressed by sets of neurons in the subesophageal zone (SEZ) that project into the pars intercerebralis, ring gland and ventral nerve cord. (C, D) Increased NMU and hugin signaling has similar effects: feeding behavior is decreased, whereas physical activity/locomotion is increased.
Figure 2 with 1 supplement
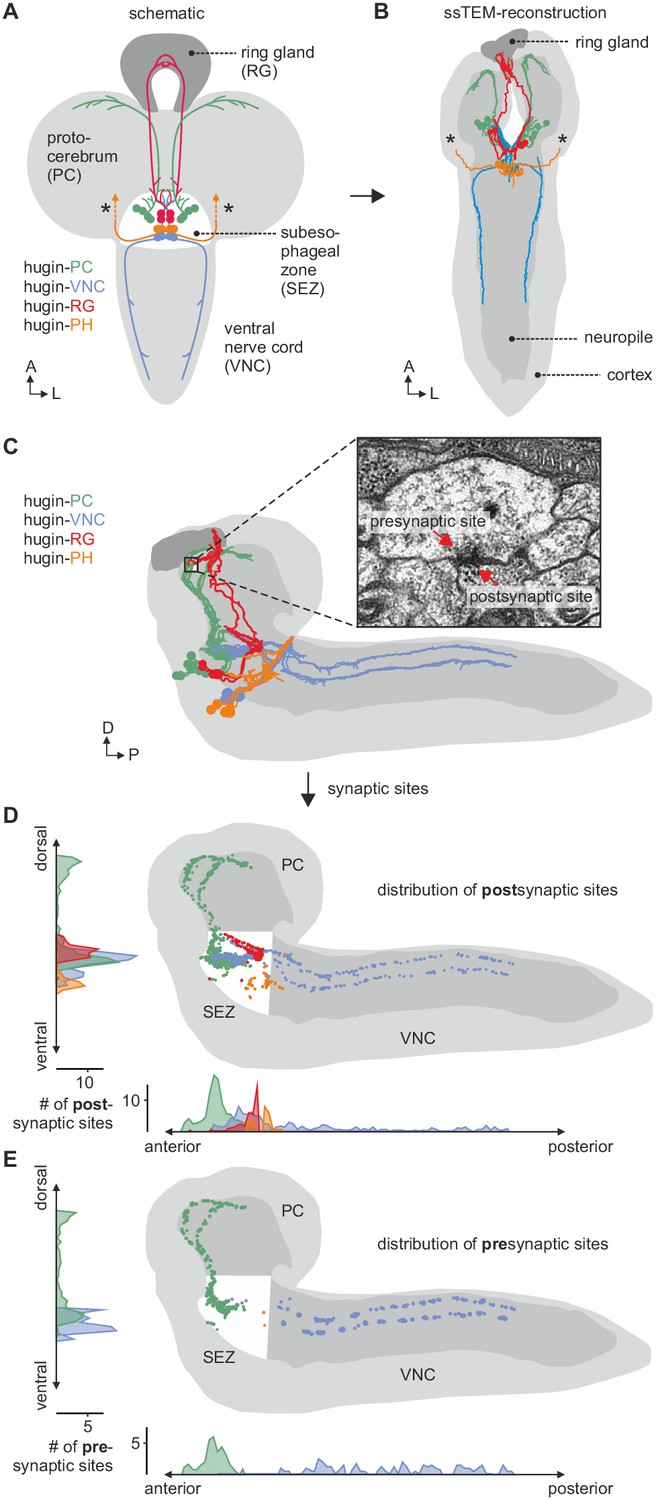
EM reconstruction of hugin neurons and their synaptic sites.
(A) Hugin neurons are known to form four morphologically distinct classes: hugin-PC (protocerebrum), hugin-VNC (ventral nerve cord), hugin-RG (ring gland) and hugin-PH (pharynx, asterisks mark nerve exit sites). (B) Reconstruction of all hugin neurons based on serial section electron microscopy (EM) of an entire larval brain. (C–E) Spatial distribution of synaptic sites for all hugin classes. Hugin interneurons (hugin-PC and hugin-VNC) show mixed input/output compartments, and presynaptic sites indicate the existence of a small molecule transmitter in addition to the hugin neuropeptide. In contrast, Hugin-RG and hugin-PH show almost exclusively postsynaptic sites within the CNS. Each dot in D and E represents a single synaptic site. Graphs show distribution along dorsal-ventral and anterior-posterior axis of the CNS. See also Video 1.
Figure 2—figure supplement 1
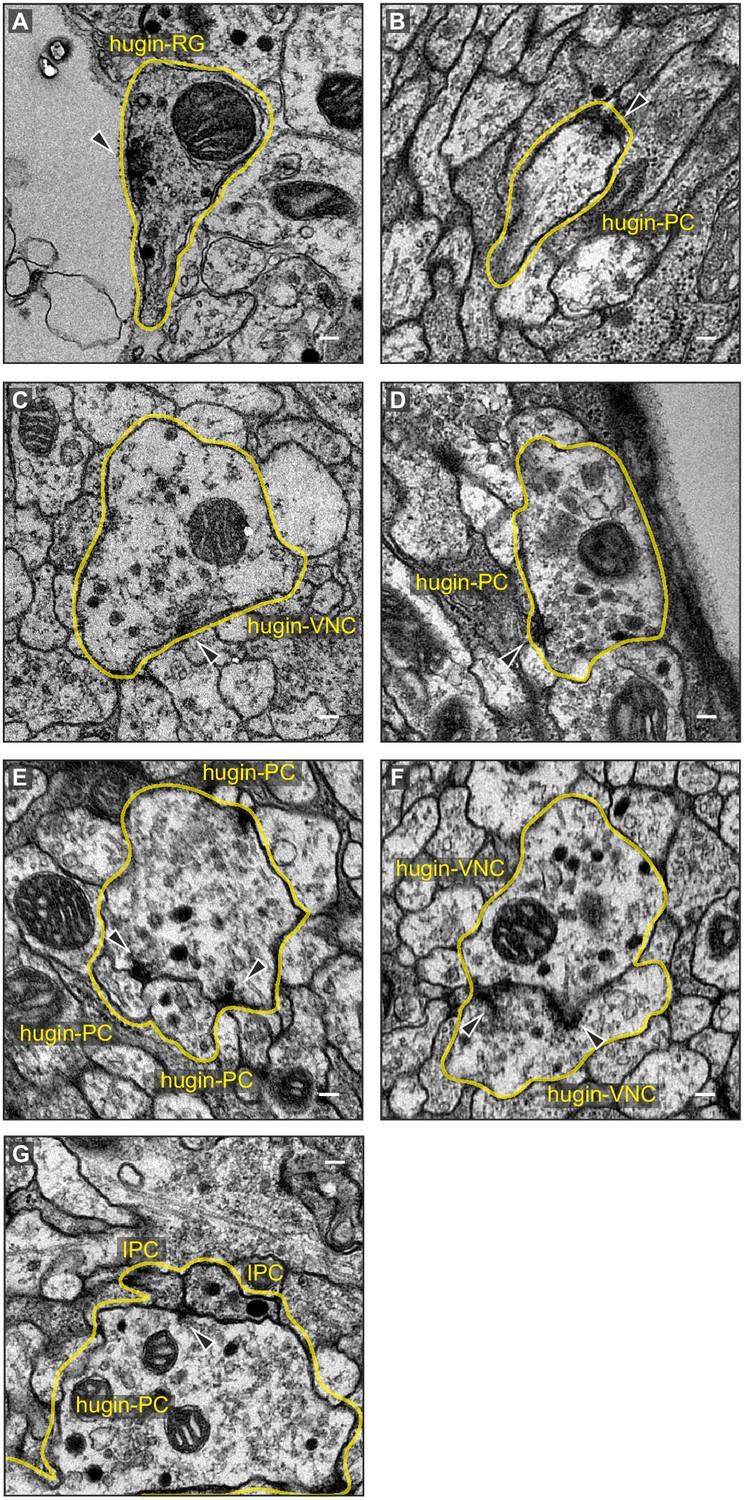
Exemplary synaptic sites in the ssTEM volume.
(A) Membrane specialization of a hugin-RG neuron bordering haemal space within the ring gland. (B,C) Examples of presynaptic sites with small clear core vesicles for a hugin-PC and hugin-VNC neuron. (D) Example of a presynaptic site with close-by dense core vesicles. (E), (F) Examples of synaptic connections between hugin neurons. (G) Examples of synaptic connections from hugin-PC neurons onto insulin-producing cells (IPCs). Arrowheads indicate synaptic sites. Scale bars represent 100 nm.
Figure 3
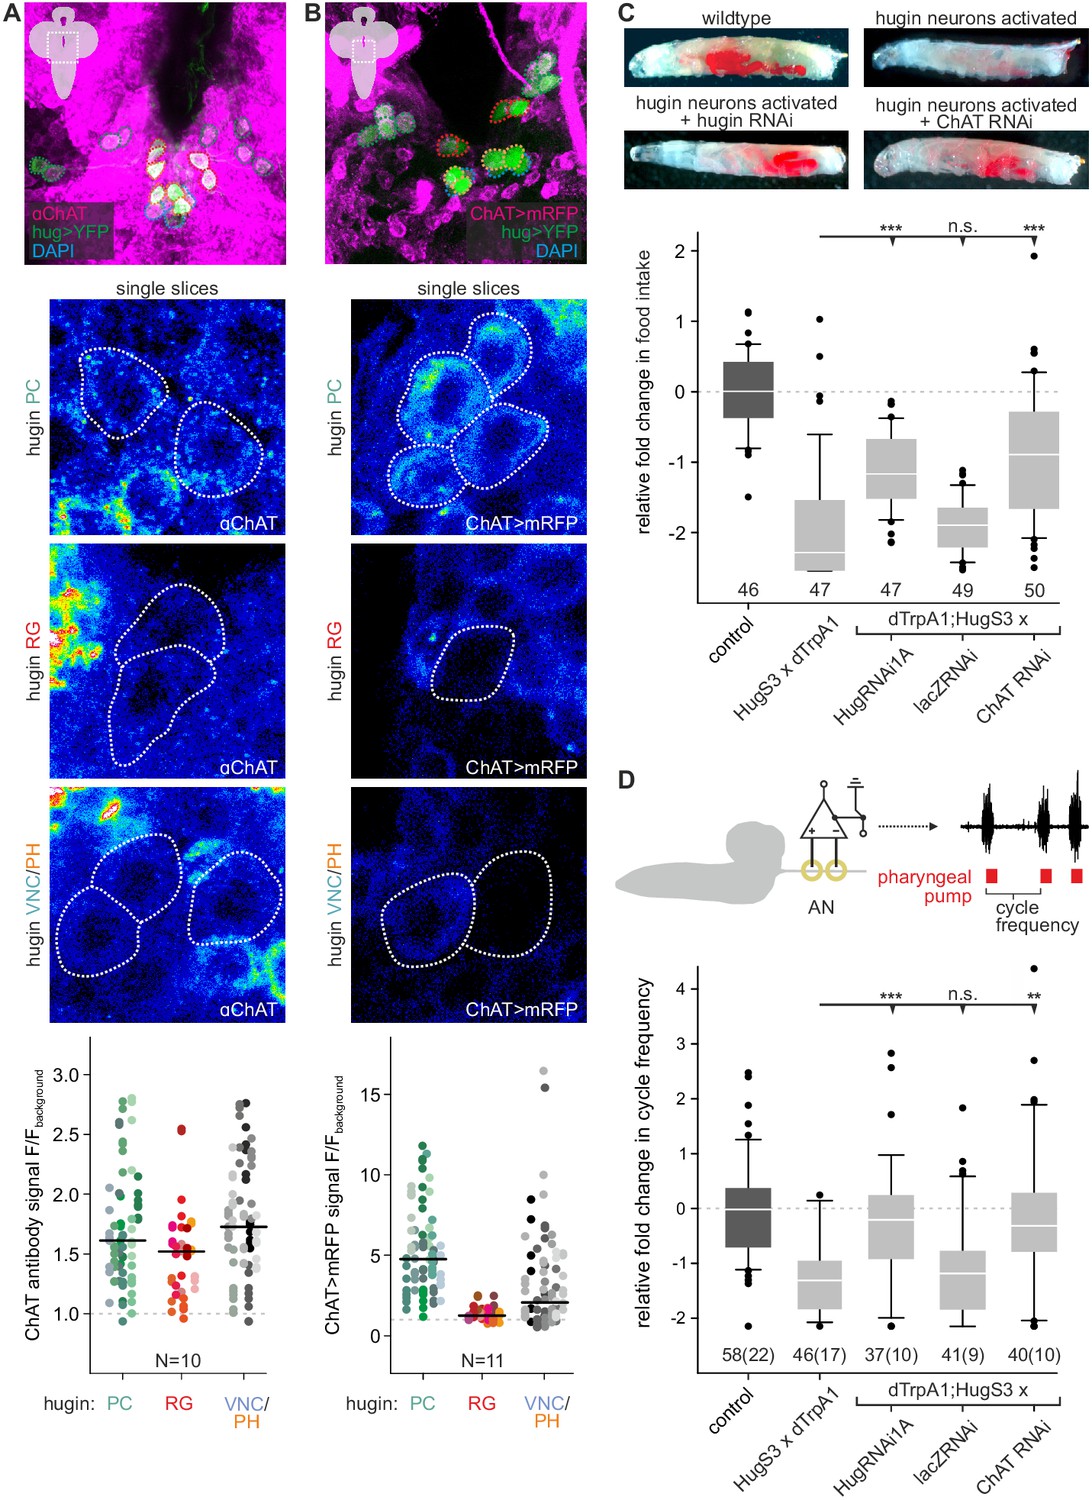
Acetylcholine (ACh) is a neurotransmitter of hugin neurons.
(A,B) Co-localization of the biosynthetic enzyme for ACh, choline acetyltransferase (ChAT), in hugin neurons using a ChAT antibody (A) or a ChAT promoter-GAL4 driving a fluorescent reporter (B). ChAT immunoreactivity was variable but strongest signals were found in hugin-PC and hugin-VNC/PH neurons. Similarly, ChAT-GAL4 consistently drove expression in hugin-PC and subsets of hugin-VNC/PH. Shown are exemplary scans and quantification of ChAT co-localization in the different hugin classes. Note that while hugin-PC and hugin-RG neurons are easily identifiable, hugin-PH and hugin-VNC neurons were usually too close to be unambiguously discriminated and were thus treated as a single mixed group. Each data point in the dot plots represents a single hugin neuron. Horizontal lines mark median. (C,D) ACh is necessary for the effect of hugin neurons’ activation on food intake (C) and pharyngeal pumping (D). Food intake was measured in intact larvae. Pharyngeal pumping was monitored by extracellular recordings of the antennal nerve (AN) and analyzed with respect to the cycle frequency of the motor patterns. Activation of hugin neurons using the thermosensitive cation channel dTrpA1 (HugS3-GAL4 x UAS-dTrpA1) led to a decrease in food intake and pharyngeal pump activity compared to the control (OrgR, OrgR x UAS-dTrpA1). Knockdown of either the hugin neuropeptide or ChAT but not LacZ control (UAS-dTrpA1;HugS3-GAL4 x UAS-RNAi) rescued the effect of hugin neuron activation on food intake as well as on pharyngeal pumping. For details see Materials and methods, and Schoofs et al., (2014). Numbers below box plots give N [C: # larvae; D: # trials (# larvae)]. Mann-Whitney Rank Sum Test (*** = p<0.001; **=p < 0.01).
Figure 4

Hugin neurons synapse reciprocally within-class but not across-class.
(A) Connectivity matrix of hugin to hugin connections. Each row indicates number of synaptic connections of given hugin neuron to other hugin neurons. Connections that could not be recapitulated for both hemisegments are grayed out. Numbers in colored boxes give % of incoming (x-axis) and outgoing (y-axis) synaptic connections of the respective hugin neuron. Hugin to hugin contacts are made between hugin interneurons of the same class, not between classes (see schematic). Note that efferent hugin neurons, hugin-RG and hugin-PH, do not have presynaptic sites. (B) Distribution of hugin-hugin synapses. Synaptic contacts between hugin-PC or hugin-VNC neurons are made along their main neurites. Only neurons of one hemisegment are shown.
Figure 5 with 1 supplement
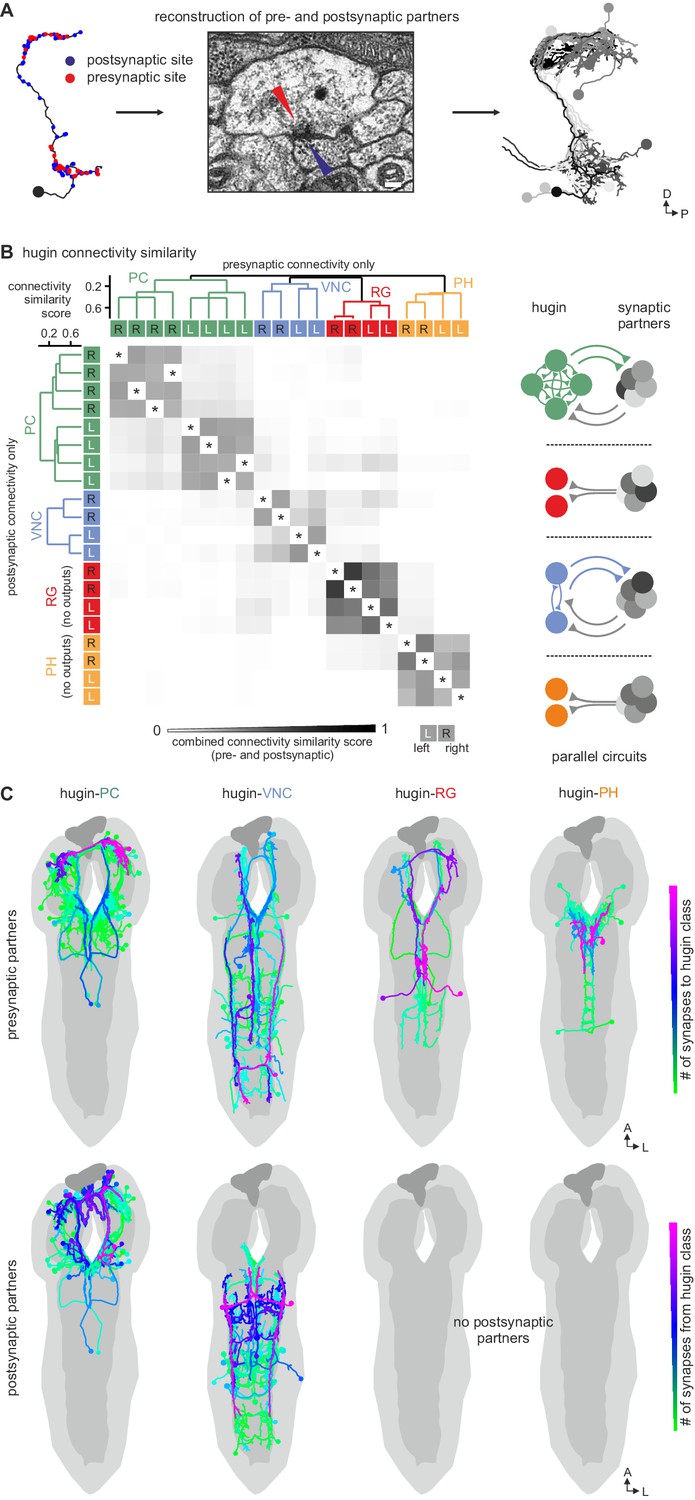
Each hugin class is part of a distinct microcircuit, weakly or not at all connected to those of the other classes.
(A) Synaptic partners of hugin neurons were reconstructed. Pre- and postsynaptic partners of a single hugin-PC neuron are shown as example. (B) Comparison of hugin neurons’ connectivity as measured by connectivity similarity score. High similarity score indicates a large fraction of shared synaptic partners connected by similar numbers of synapses. Neurons are ordered by dendrogram of similarity score of pre- (x-axis) and postsynaptic (y-axis) partners. Matrix shows combined pre- and postsynaptic similarity score. Self-self comparisons were omitted (asterisks). Hugin classes connect to unique sets of pre- and postsynaptic partners. Neurons of each hugin class have the same synaptic partners, and there is little to no overlap with other classes (see schematic). (C) Reconstructed pre- and postsynaptic partners by hugin class. Neurons are color-coded based on total number of synapses to given hugin class [minimum = 1; maximum (pre-/postsynaptic): hugin-PC = 53/16, hugin-VNC = 21/18, hugin-RG = 39/none, hugin-PH = 23/none]. Hugin-RG and hugin-PH neurons do not have postsynaptic partners within the CNS. See also Video 2 and supplemental neuron atlas.
Figure 5—figure supplement 1
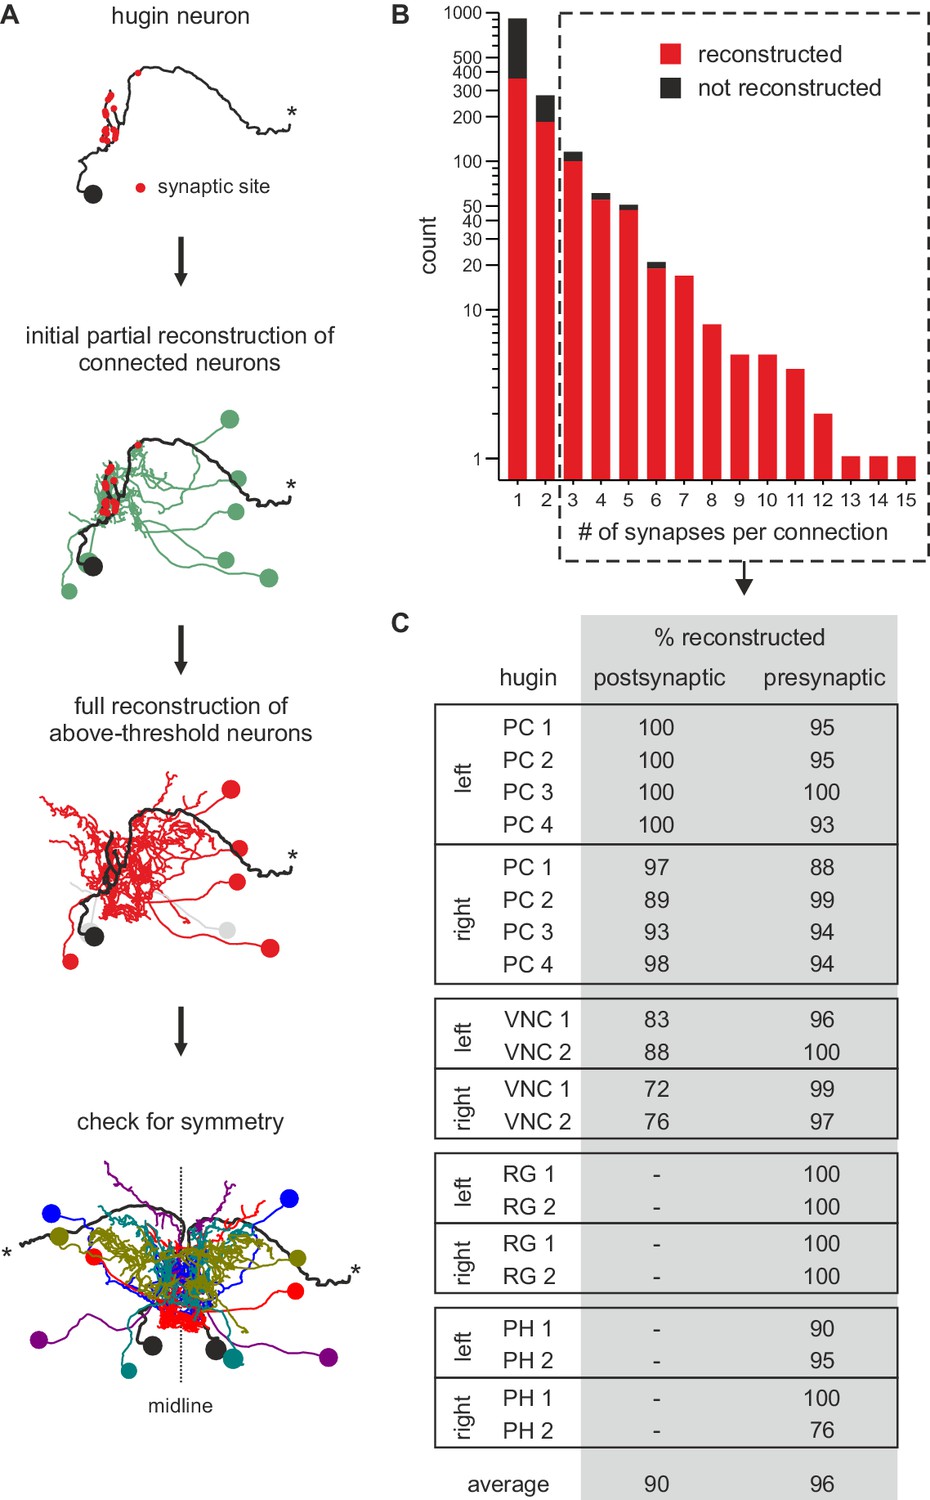
Neurons connected by more than two synapses to hugin neurons were reliably reconstructed.
(A) Reconstruction strategy for hugin connectome. Neurites synaptically connected to hugin neurons were partially reconstructed to a point of convergence: soma for central neurons or nerve entry site for sensory neurons. Synaptic partners with at least a single more-than-three synapse connection to/from hugin neurons were then fully reconstructed and checked for symmetry. (B) Distribution of synaptic connections to/from hugin neurons. x-axis gives number of synapse per connection and y-axis occurrence. Reconstruction of the pre- or postsynaptic neuron was attempted for every hugin synapse. Red fraction was completely reconstructed; black fraction was not successfully reconstructed due to either errors/ambiguity in the ssTEM data set (e.g. missing sections) or failure to find a matching pair of neurons in both hemisegments. The fraction of unaccounted synapses strongly decreases from 2 to 3 synapses per connection. We therefore applied a threshold of at least a single more-than-two-synapses connection for subsequent analyses (did not apply to sensory neurons). (C) Completeness of reconstruction of pre- and postsynaptic partners for each hugin neuron. Values in the table give the percentages of pre- and postsynaptic sites that connect to an above-threshold partner of hugin neurons which was successfully reconstructed.
Figure 6 with 1 supplement
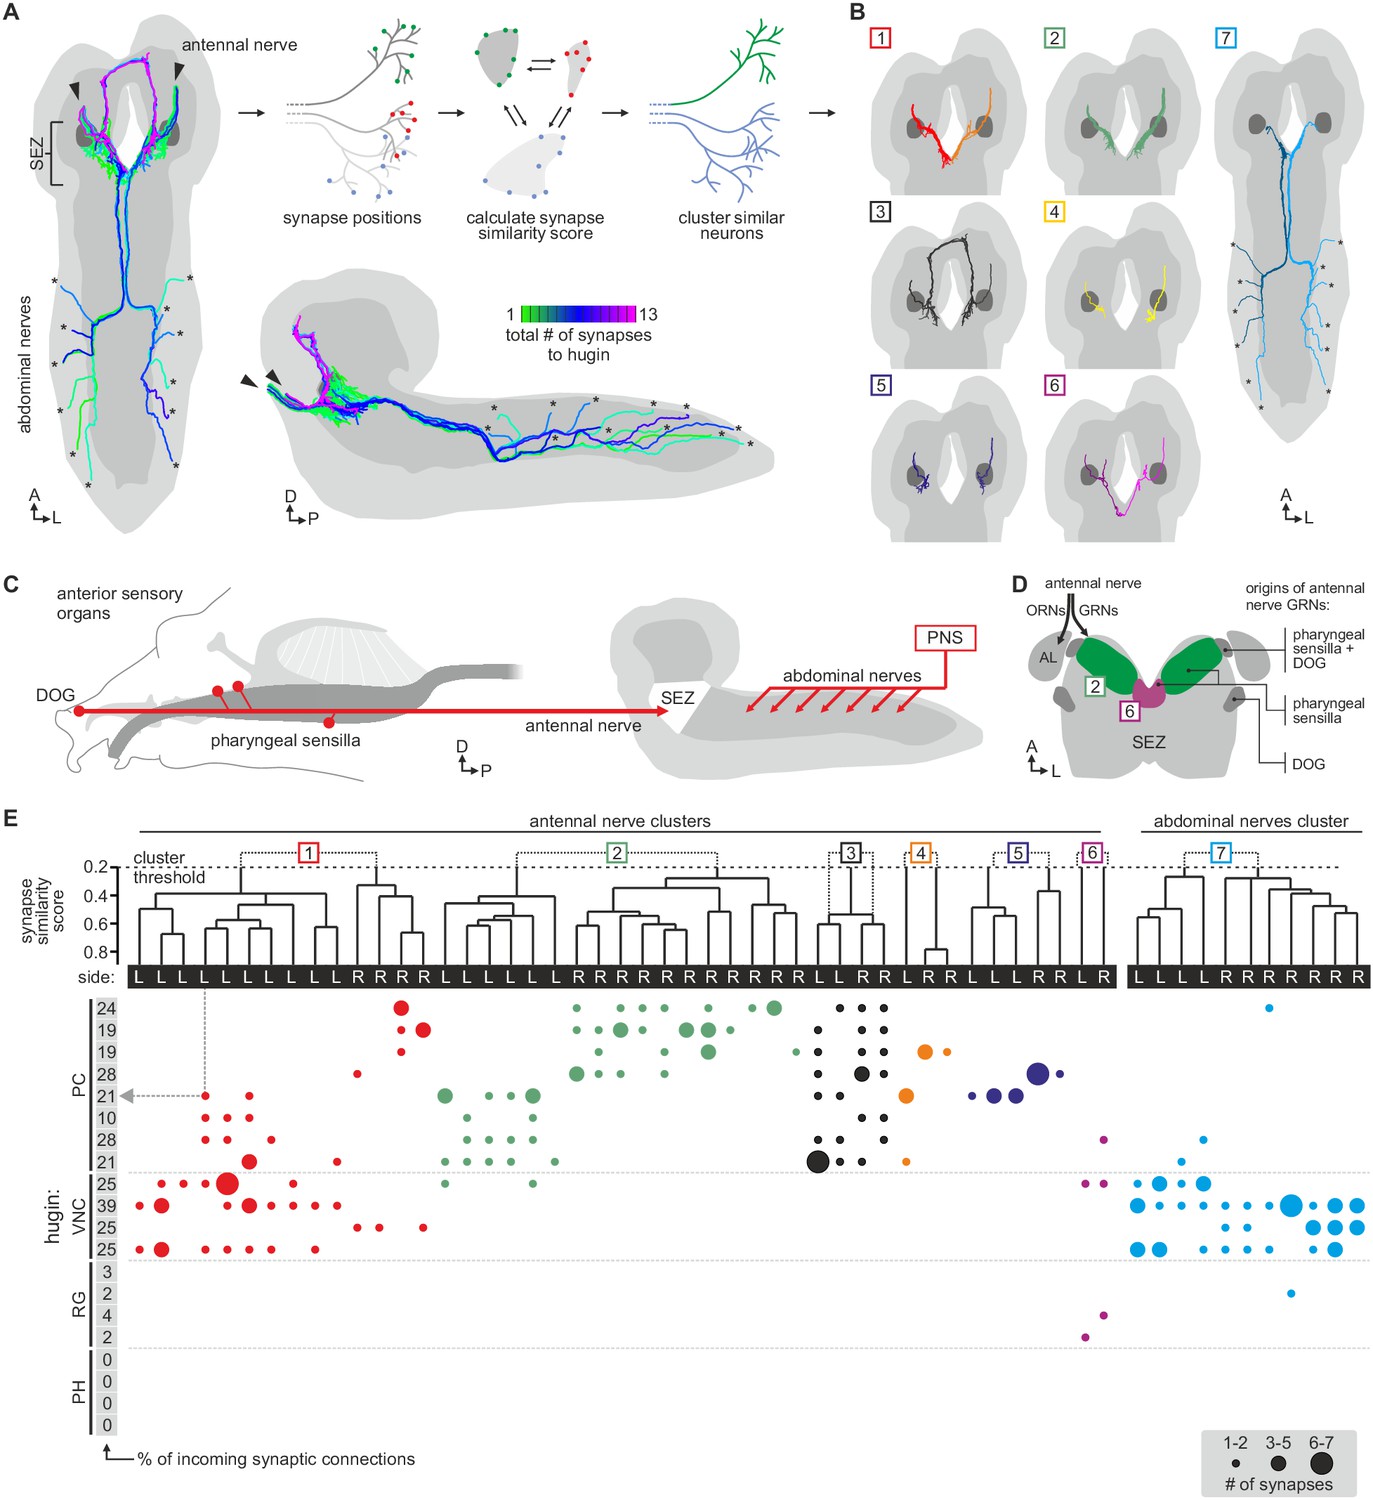
Each class of hugin neurons receives inputs from distinct subsets of sensory neurons.
(A) Sensory inputs to hugin neurons enter the CNS via the antennal nerve (arrowheads) and abdominal nerves (asterisks). Neurons are color-coded based on total number of synapses to hugin neurons. (B) Sensory neurons clustered based on synapse similarity score. This score is computed from the spatial overlap of synaptic sites between two neurons. See also Video 3. (C) Potential origins of sensory inputs onto hugin neurons. The antennal nerve collects sensory axons from the dorsal organ ganglion (DOG) and pharyngeal sensilla. Abdominal nerves carry afferents from abdominal segments of the peripheral nervous system (PNS). (D) Target areas of antennal nerve chemosensory organs in the subesophageal zone (SEZ). Olfactory receptor neurons (ORNs) terminate in the antennal lobes (AL). Gustatory receptor neurons (GRNs) from different sensory organs cover distinct parts of the SEZ (based on (Colomb et al., 2007). (E) Connectivity matrix of sensory neurons onto hugin. Sensory neurons are ordered by dendrogram of synapse similarity score and rearranged to pair corresponding cluster of left (L) and right (R) hemisegment. Each row of the matrix shows the number of synaptic connections onto a single hugin neuron. Numbers in gray boxes along y-axis give percentage of synaptic input onto each hugin neuron represented as one neuron per row. A threshold of two synapse minimum was applied. See text for further details.
Figure 6—figure supplement 1
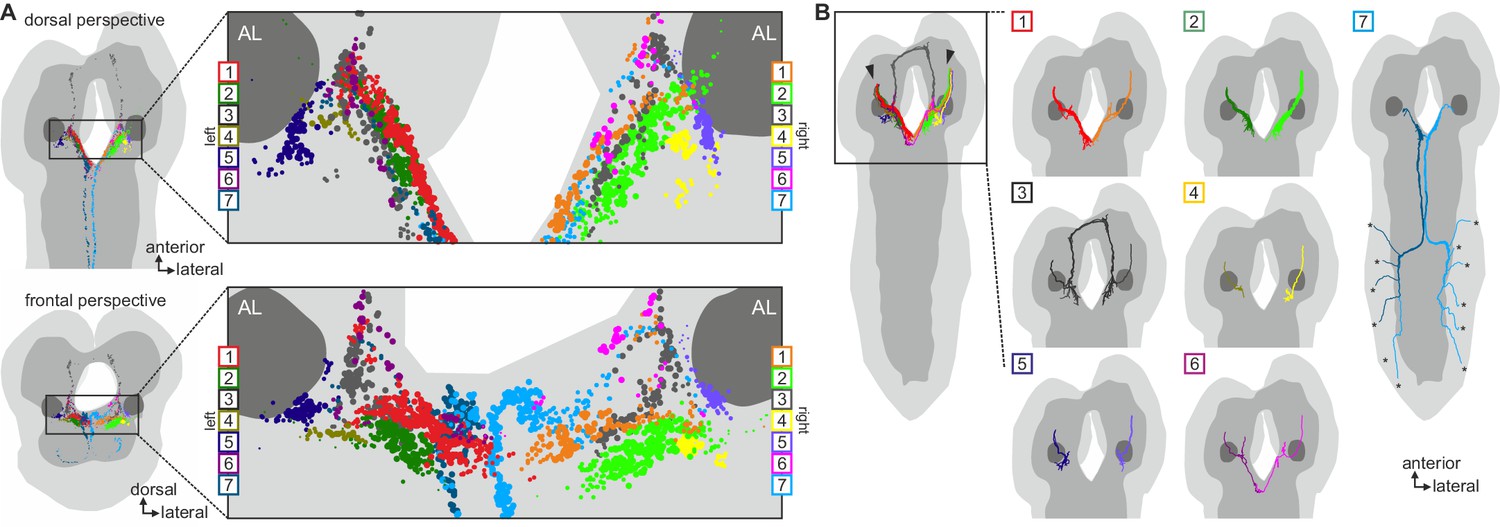
Clustered synapses of sensory inputs to hugin neurons cover discrete parts of the subesophageal zone.
Distribution of synaptic sites of afferent neurons as clustered in Figure 6. Each dot represents a synaptic site and dot size decreases with distance to its cluster's center. Note that sensory neurons presynaptic to hugin neurons innervate areas medial and ventral to the antennal lobes. See also Video 3.
Figure 7
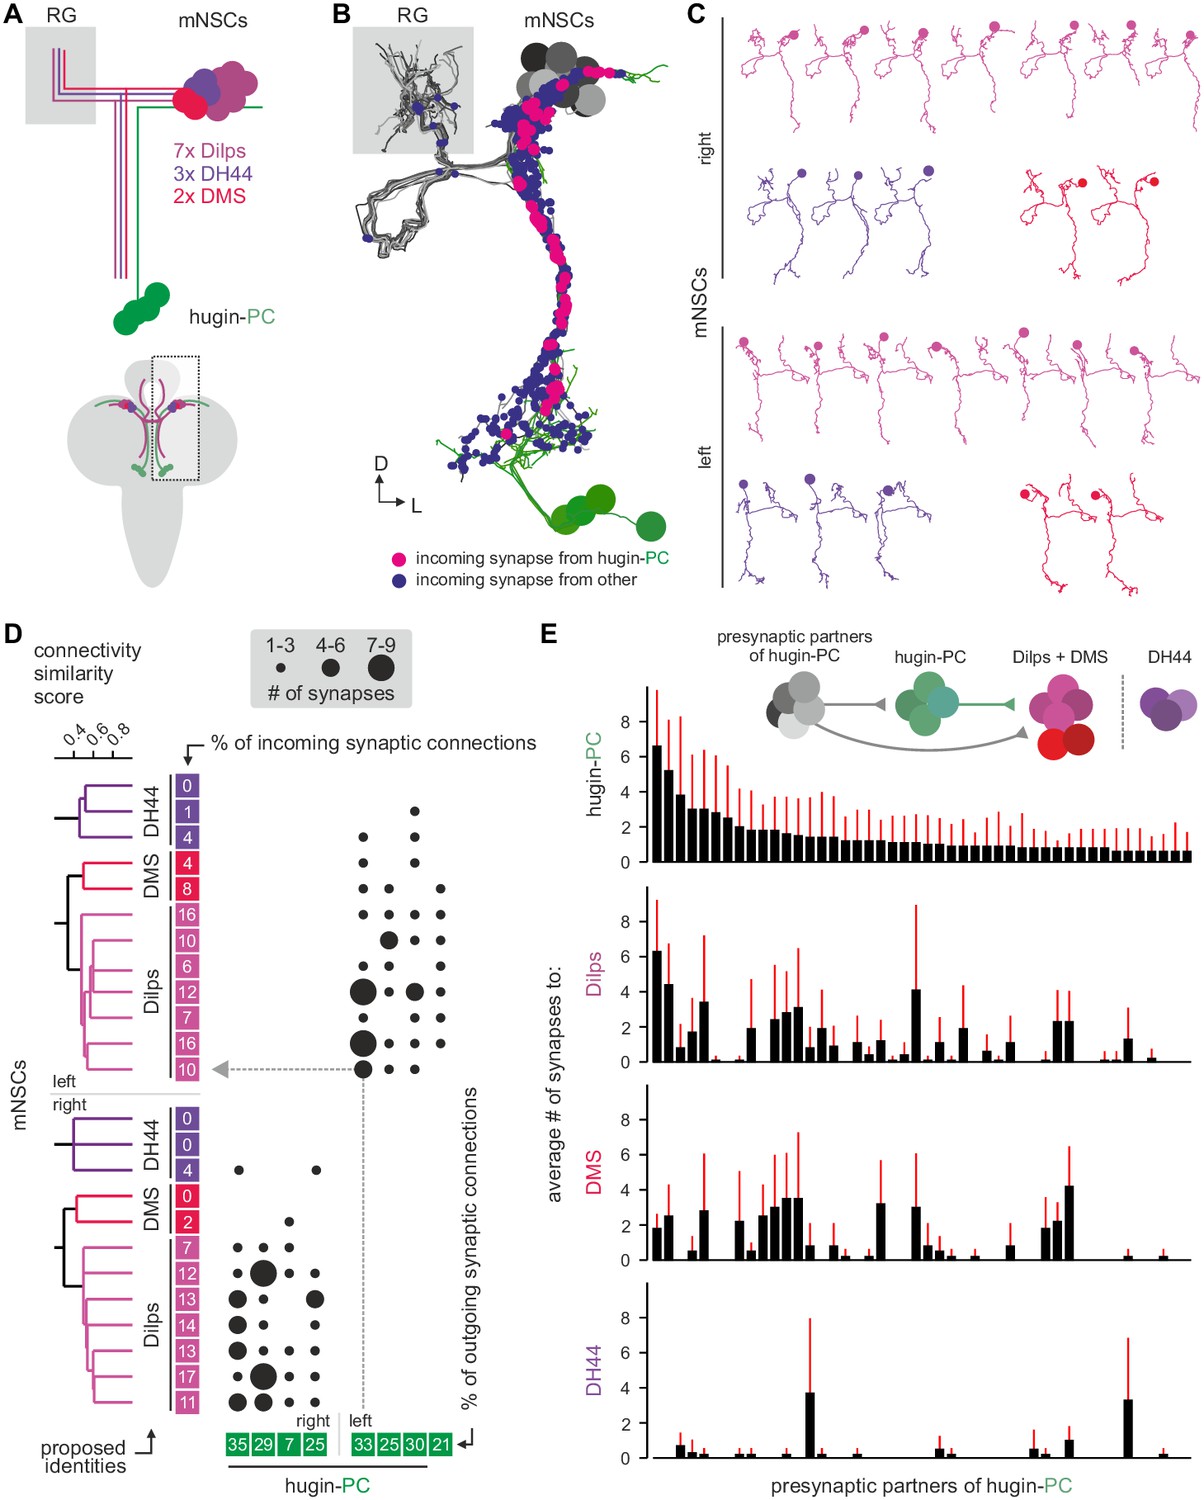
Hugin-PC neurons are presynaptic to all insulin-producing neurosecretory neurons.
(A) Schematic of median neurosecretory cells (mNSCs) of the pars intercerebralis. mNSCs produce Drosophila insulin-like peptides (Dilps), diuretic hormone 44 (DH44) and Dromyosuppressin (DMS) in a non-overlapping manner. (B) EM reconstruction of all mNSCs and their synaptic contacts with hugin-PC neurons. (C) Ipsilateral mNSCs present similar arborizations, making morphological identification impossible. Instead mNSCs were categorized by connectivity (see D). (D) Synaptic partners of mNSCs were reconstructed and mNSCs were clustered based on connectivity similarity. This revealed three clusters consistently across both hemispheres that matched groups of 3 DH44-, 2 DMS- and 7 Dilps-producing cells (see text for details). Connectivity matrix shows that hugin-PC neurons primarily target Dilps-producing cells (also called insulin-producing cells, IPCs) and less so DMS-producing cells. (E) Connectivity between presynaptic partners of hugin-PC neurons and mNSCs. Hugin-PC neurons share inputs with Dilps- and DMS-producing neurons but not with DH44-producing neurons. Each column across all four graphs represents a presynaptic partner of hugin-PC. Whiskers represent standard deviation.
Figure 8 with 2 supplements
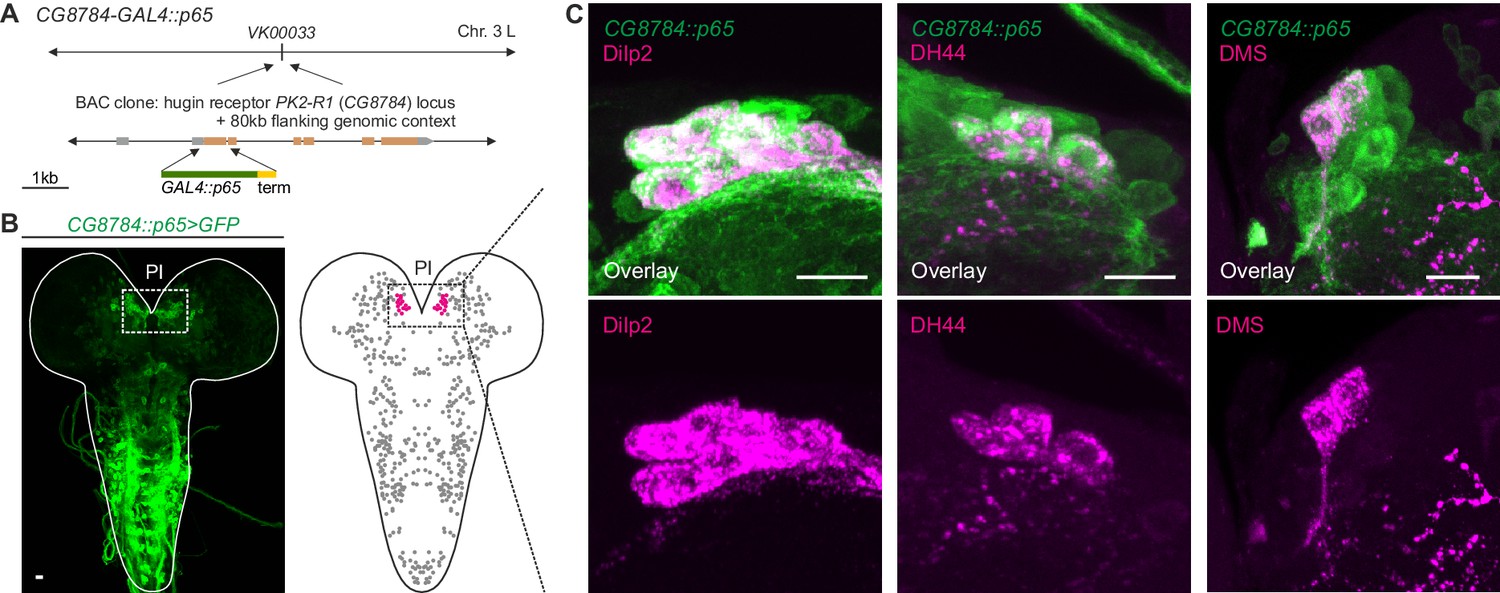
GPCR-mediated neuromodulatory transmission is used in addition to synaptic connections.
(A) Generation and expression pattern of a hugin receptor GAL4 line, CG8784-GAL4::p65. Promoter-based driver line for hugin G-proteincoupled receptor PK2-R1 was generated by replacing the first coding exon of the CG8784 loci with GAL4 in a BAC clone containing ~80 kb flanking genomic context and integrating the final BAC into attP site VK00033. (B) CG8784-GAL4::p65 drives expression in cells of the pars intercerebralis (PI). (C) Co-staining against Drosophila insulin-like peptide 2 (Dilp2), diuretic hormone 44 (DH44) and Dromyosuppressin (DMS) shows that hugin receptor PK2-R1 is expressed in all median neurosecretory cells (mNSCs). Scale bars represent 10 µm.
Figure 8—figure supplement 1
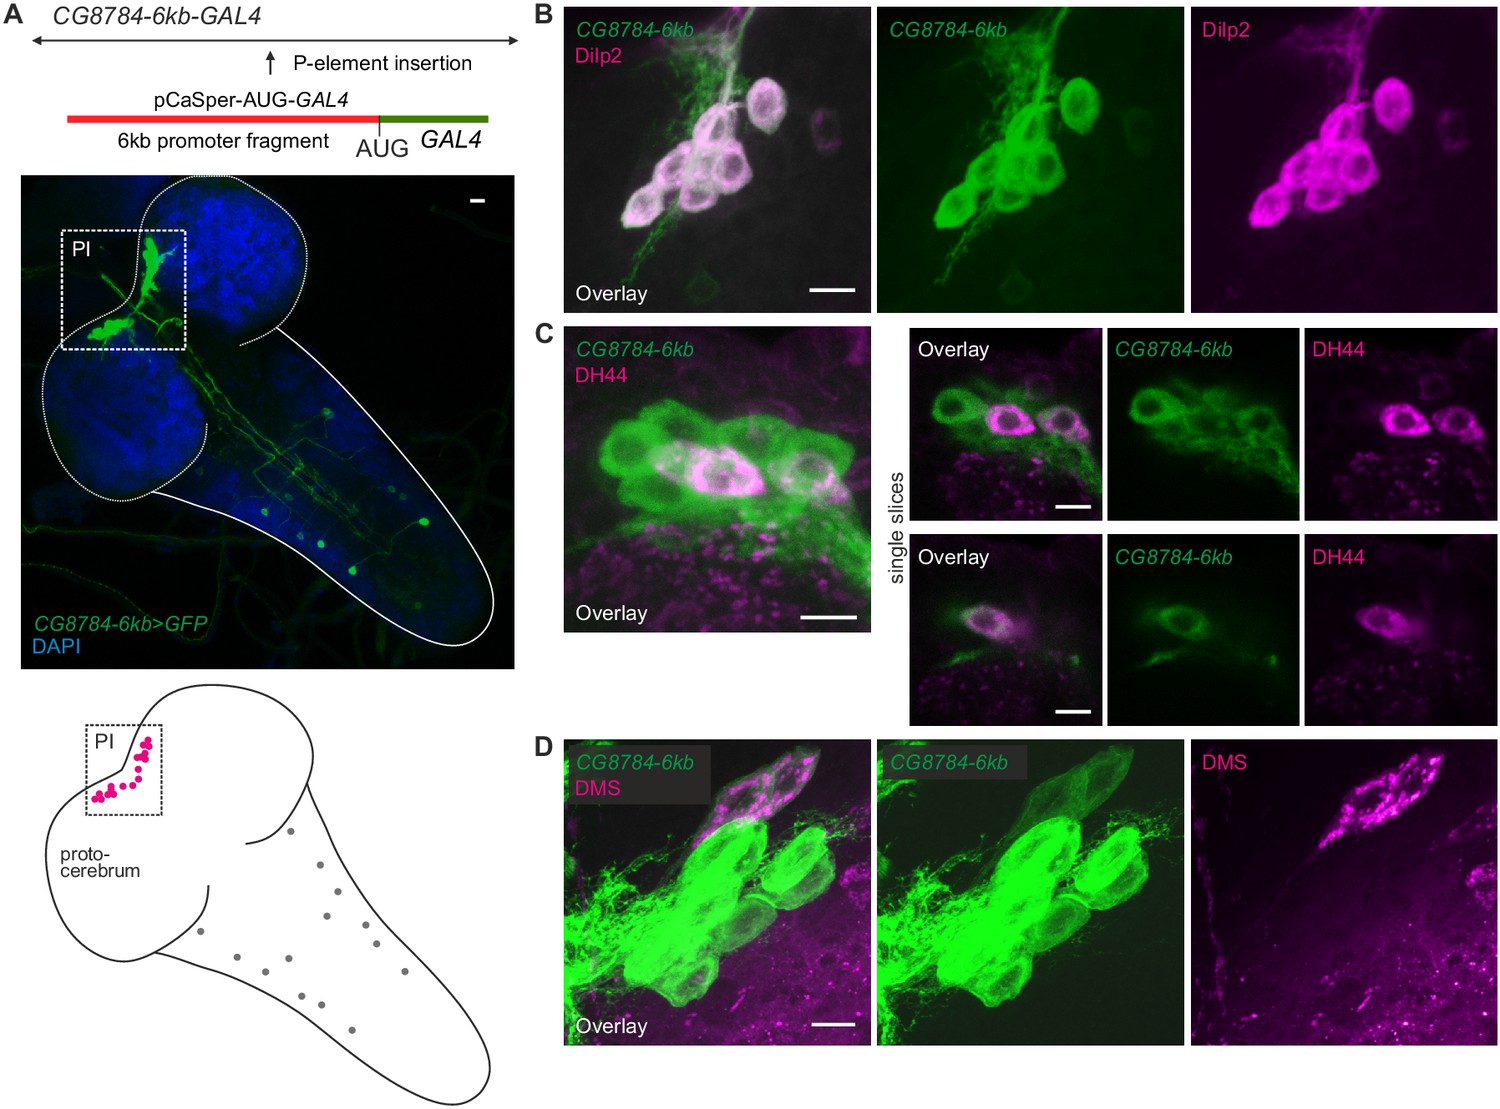
Second hugin receptor line, CG8784-6kb-GAL4, drives expression in median neurosecretory cells (mNSCs) of the pars intercerebralis (PI) similar to CG8784-GAL4:p65.
(A) Generation and expression pattern of a second hugin receptor GAL4 line, CG8784-6kb-GAL4. In comparison with the CG8784-GAL4:p65 BAC line (Figure 8), this line shows a more restricted expression. However, the same prominent cluster of neurons (magenta) of the PI is labeled but only few additional cells in the ventral nerve cord (grey circles). (B–D) Double staining of CG8784-6kb-GAL4 driving GFP expression suggests expression of CG8784 in (B) Drosophila insulin-like peptide- (Dilp2), (C) diuretic hormone 44- (DH44) and (D) Dromyosuppressin-producing (DMS) mNSCs of the PI. Scale bars represent 10 µm (A) and 5 µm (B–D).
Figure 8—figure supplement 2
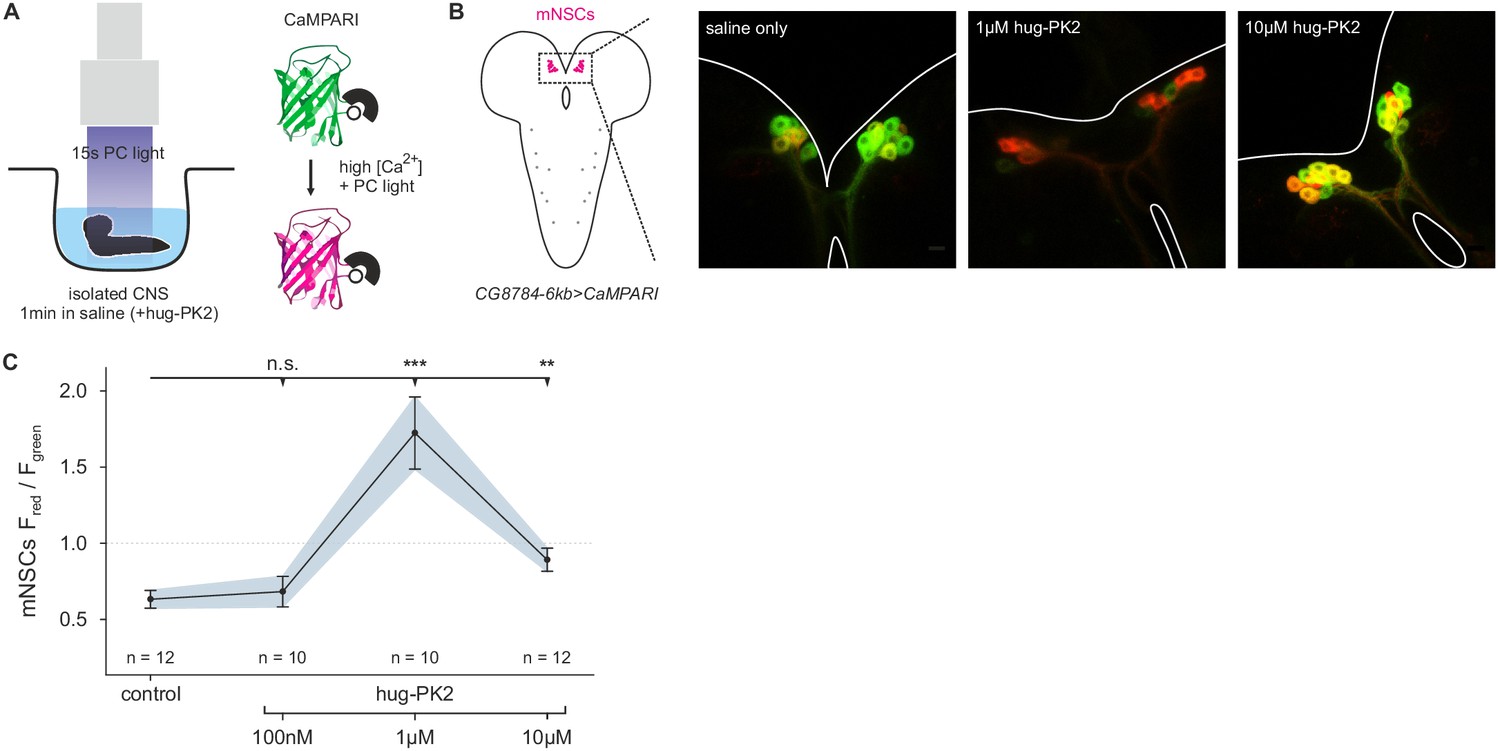
Hugin neuropeptide increases calcium (Ca2+) activity in median neurosecretory cells (mNSCs).
(A), Isolated central nervous systems (CNS) expressing the calcium (Ca2+) integrator CaMPARI in mNSCs were dissected and placed in saline solution or saline solution + hug-PK2 (hugin-derived pyrokinin2). After 1 min incubation 405 nm photoconversion (PC) light was applied for 15s. Afterwards brains were scanned and ratio of converted (red) to unconverted (green) CaMPARI was analyzed. (B), Exemplary scans of mNSCs after incubation and photoconversion in saline control or saline + hug-PK2. (C), Quantification of Ca2+ activity in mNSCs after incubation with hug-PK2 as measured by ratio of red to green fluorescence (Fred/Fgreen). Incubation with 1 µM or 10 µM hug-PK2 significantly increases calcium activity.
Figure 9
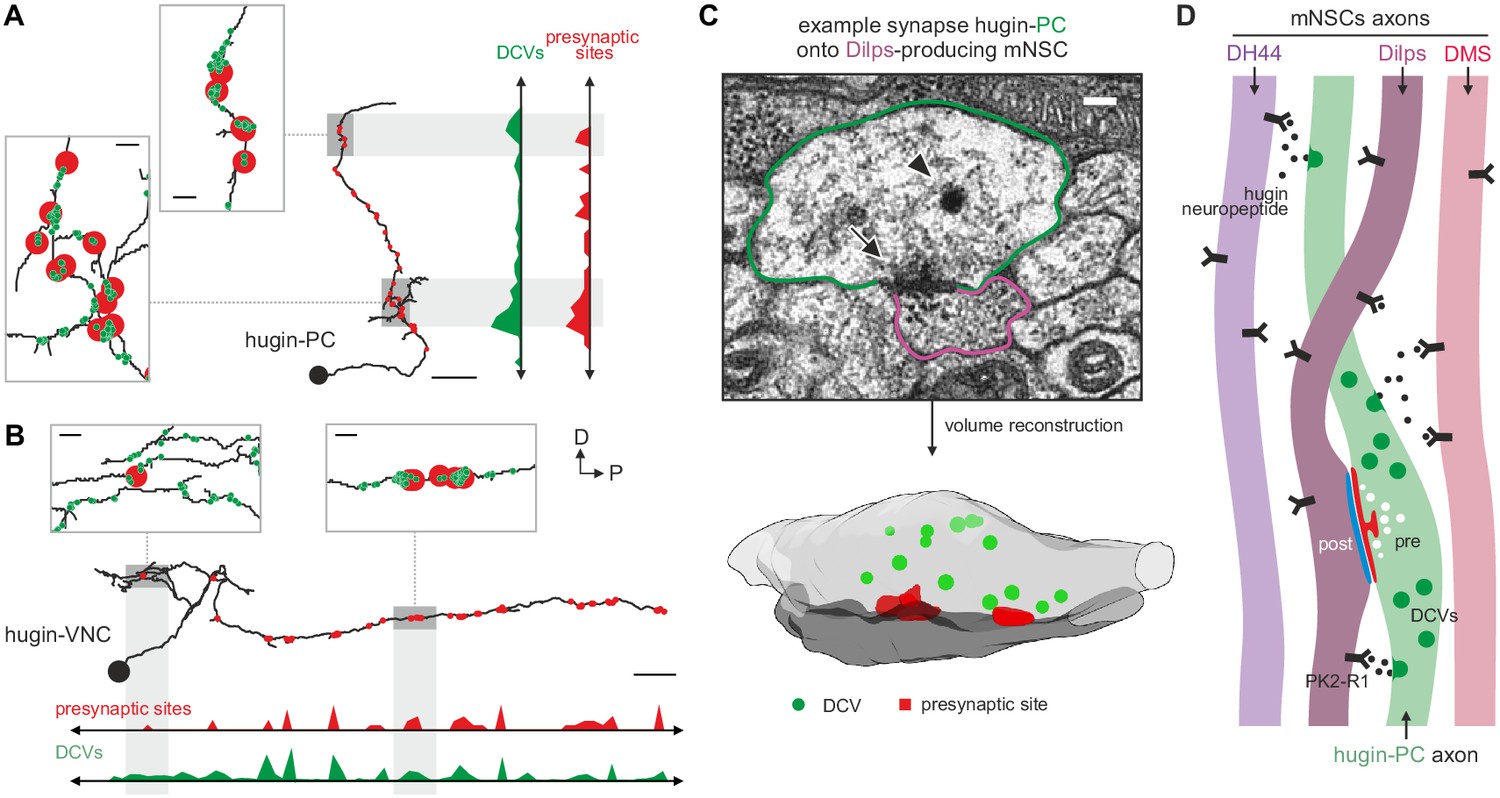
Dense core vesicles localize close to but not directly at presynaptic sites.
(A,B), Overlay of presynaptic sites and dense core vesicles (DCVs) for exemplary hugin-PC (A) and hugin-VNC (B) neuron. DCVs are found close to but not exclusively at presynaptic sites (see inlets). Scale bars represent 10 µm (overview) and 1 µm (inlets). (C) Volume reconstruction of representative synapse between hugin-PC neuron and median neurosecretory cells (mNSCs) producing Drosophila insulin-like peptides (Dilps) shows DCVs (arrowhead) in the vicinity of presynaptic densities (arrow). Scale bar represents 100 µm. (D) Summarizing schematic and model. Hugin-PC neurons make classical chemical synapses almost exclusively onto Dilps-producing mNSCs. Additionally, all mNSCs express hugin receptor PK2-R1 (CG8784) and are often in close vicinity to hugin neurites, allowing para- or non-synaptically released hugin neuropeptide to bind.
Figure 10
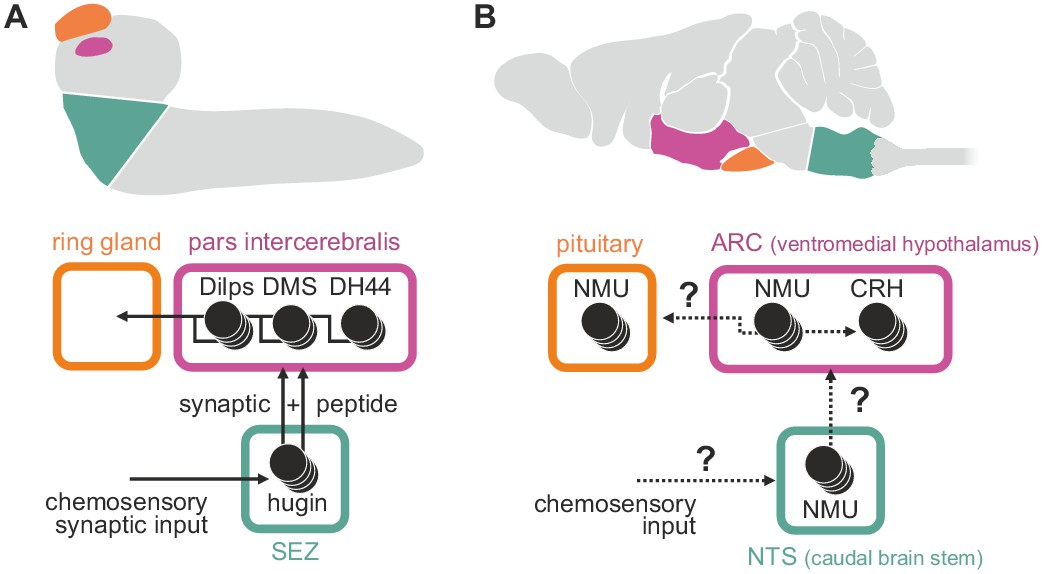
Summary of hugin connectivity and hypothetical implications for neuromedinU in mammals.
(A) Hugin neurons link chemosensory neurons that enter the subesophageal zone (SEZ) and neuroendocrine cells of the pars intercerebralis by synaptic as well as peptide-receptor connections. (B) Distribution of NMU-positive neurons in mammals is much more complex. The effect of neuromedinU (NMU) on feeding and physical activity originates in the arcuate nucleus (ARC) of the hypothalamus where it causes release of corticotropin-releasing hormone (CRH) which itself is a homolog of diuretic hormone 44 (DH44) in Drosophila. NMU-positive neurons have also been found in the nucleus of the solitary tract (NTS) a chemosensory center in the caudal brain stem. It remains to be seen if, similar to hugin neurons, NMU neurons serve as a link between chemosensory and neuroendocrine system.
Videos
Video 1
Morphology of hugin-producing neurons.
Video shows morphology of hugin-producing neurons as well as distribution of their presynaptic and postsynaptic sites. Hugin interneurons (PC and VNC) have mixed input-output compartments, whereas efferent hugin neurons (PH and RG) show almost exclusively postsynaptic sites within the CNS. Outlines of the CNS including the ring gland are shown in white.
Video 2
Each class of hugin neurons connects to unique sets of synaptic partners.
Video shows all reconstructed presynaptic and postsynaptic partners of hugin neurons (see Figure 5C). Neurons are colored by total number of synapses to/from given hugin class. Each hugin class forms distinct microcircuits with little to no overlap with those of other classes.
Video 3
Clusters of chemosensory neurons cover distinct areas of the subesophageal zone (SEZ).
Video shows morphology and presynaptic sites of sensory inputs to hugin neurons. Neurons are clustered based on a synapse similarity score (see Figure 6). Each sphere represents a presynaptic site. Sphere size increases with the number of postsynaptically connected neuronal profiles for that synapse.
Tables
Table 1
Summary of known effects of hugin classes and their connectivity.
|
hugin class |
known effects |
connectivity |
|---|---|---|
|
PC |
decrease food intake*; decelerate AN motor pattern (for pharyngeal pumping)*; necessary for bitter avoidance* |
chemosensory input via AN; output onto neuroendocrine system; unidentified interneuron inputs and outputs in SEZ and higher brain centers |
|
VNC |
accelerate M6 motor patterns (for locomotion)† |
chemosensory input via AN; unknown sensory input from abdominal nerves; unidentified interneuron inputs in SEZ; outputs in VNC |
|
RG |
unknown |
weak chemosensory input via AN; inputs from unidentified interneurons in SEZ; no synaptic outputs in CNS |
|
PH |
unknown |
inputs from unidentified interneurons in SEZ; no synaptic outputs in CNS |
-
Known effects based on *Hückesfeld et al. (2016) and † Schoofs et al. (2014). AN, antennal nerve; SEZ, subesophageal zone; VNC, ventral nerve cord.
Additional files
-
Supplementary file 1
PDF Neuron Atlas - Morphology and connectivity of reconstructed neurons.
Reconstructions of (A) hugin-PC, (B) hugin-VNC, (C) hugin-RG, (D) hugin-PH neurons, (E) insulin-producing cells (IPCs), (F) DH44-producing cells, (G) DMS-producing cells, (H) antennal nerve (AN) sensory neurons as clustered in Figure 6, (I) abdominal nerve sensory neurons, (J) paired interneurons and (K) unpaired medial interneurons. A dorsal view of each cell is shown on the left, and a frontal view on the right. Neuron ids (e.g. #123456) are provided to allow comparison between PDF and Blender atlas. Outline of the nervous system and the ring gland are shown in grey and dark grey, respectively. Table shows number of synapses of given neurons onto (left) and from (right) the hugin neuron represented in that row. Neurons are displayed as corresponding pairs of the left/right hemisegment with the exception of sensory neurons and unpaired medial interneurons.
- https://doi.org/10.7554/eLife.16799.021
-
Supplementary file 2
Blender 3D Neuron Atlas – Morphology of reconstructed neurons as Blender file.
To view, please download Blender (www.blender.org). Reconstructed neurons are sorted into layers: hugin neurons (1), mNSCs (2), sensory neurons (3), interneurons (4) and mesh of the larval brain (5, hidden by default). Neuron names contain id (e.g. #123456) to allow comparison between Blender and PDF atlas. Neurons have been resampled by a factor of four to reduce vertex count. 1 nm = 0.0001 Blender units.
- https://doi.org/10.7554/eLife.16799.022
Download links
A two-part list of links to download the article, or parts of the article, in various formats.
Downloads (link to download the article as PDF)
Open citations (links to open the citations from this article in various online reference manager services)
Cite this article (links to download the citations from this article in formats compatible with various reference manager tools)
Synaptic transmission parallels neuromodulation in a central food-intake circuit
eLife 5:e16799.
https://doi.org/10.7554/eLife.16799


