A model for regulation by SynGAP-α1 of binding of synaptic proteins to PDZ-domain 'Slots' in the postsynaptic density
- California Institute of Technology, United States
Figures
Figure 1

Competition among synaptic proteins for binding to PDZ domains of PSD-95.
Each of the three PDZ domains of PSD-95 binds only one protein at a time. The composition of the PSD-95 complex is determined by a dynamic equilibrium that depends on the relative affinities of the proteins that bind to it and their relative concentrations. The figure illustrates competition among three prominent membrane proteins (TARP, LRRTM, and neuroligin) and cytosolic synGAP-α1. Note that LRRTMs and neuroligin also bind across the cleft to presynaptic neurexins. Other PSD proteins that bind to PDZ1 and PDZ2 include the GluN2A and GluN2B subunits of the NMDARs, plasma membrane Ca2+ pumps (PMCA2B and 4B), the ErbB4 receptor (Lim et al., 2002), and BRAG1 (an ArfGEF; Sakagami et al., 2008; Myers et al., 2012). PDZ3 binds a smaller group of additional proteins, including β1-adrenergic receptors, and CRIPT (Lim et al., 2002).
Figure 2

Domain diagrams of synGAP-α1 and PSD-95.
(A) SynGAP-α1. The N-terminus of r-synGAP-α1 is indicated, as are the locations of the major sites phosphorylated by CaMKII (black), CDK5 (green) (Walkup et al., 2015), and PLK2 (blue) (Walkup IV et al.; Lee et al., 2011), most of which are in the 'disordered domain.' 'MPD' indicates a region in which several nearby serines (808, 810, 821, 825, and 827)are phosphorylated by both CaMKII and PLK2. Numbering is based on rat isoform synGAP A1-α1. For comparison, phosphorylation sites identified in Lee et al., (2011) were numbered according to the B isoform and can be compared to ours by subtracting 44 residues from our numbering. Phosphorylation sites identified in Araki et al., (2015) were numbered according to the A isoform and can be compared to ours by adding 15 residues to our numbering. The 5 residue PDZ ligand is located at the C-terminus. (B) PSD-95. The five major domains of PSD-95, including the approximate relationships of its three N-terminal PDZ domains are indicated (Cho et al., 1992).
Figure 3 with 1 supplement
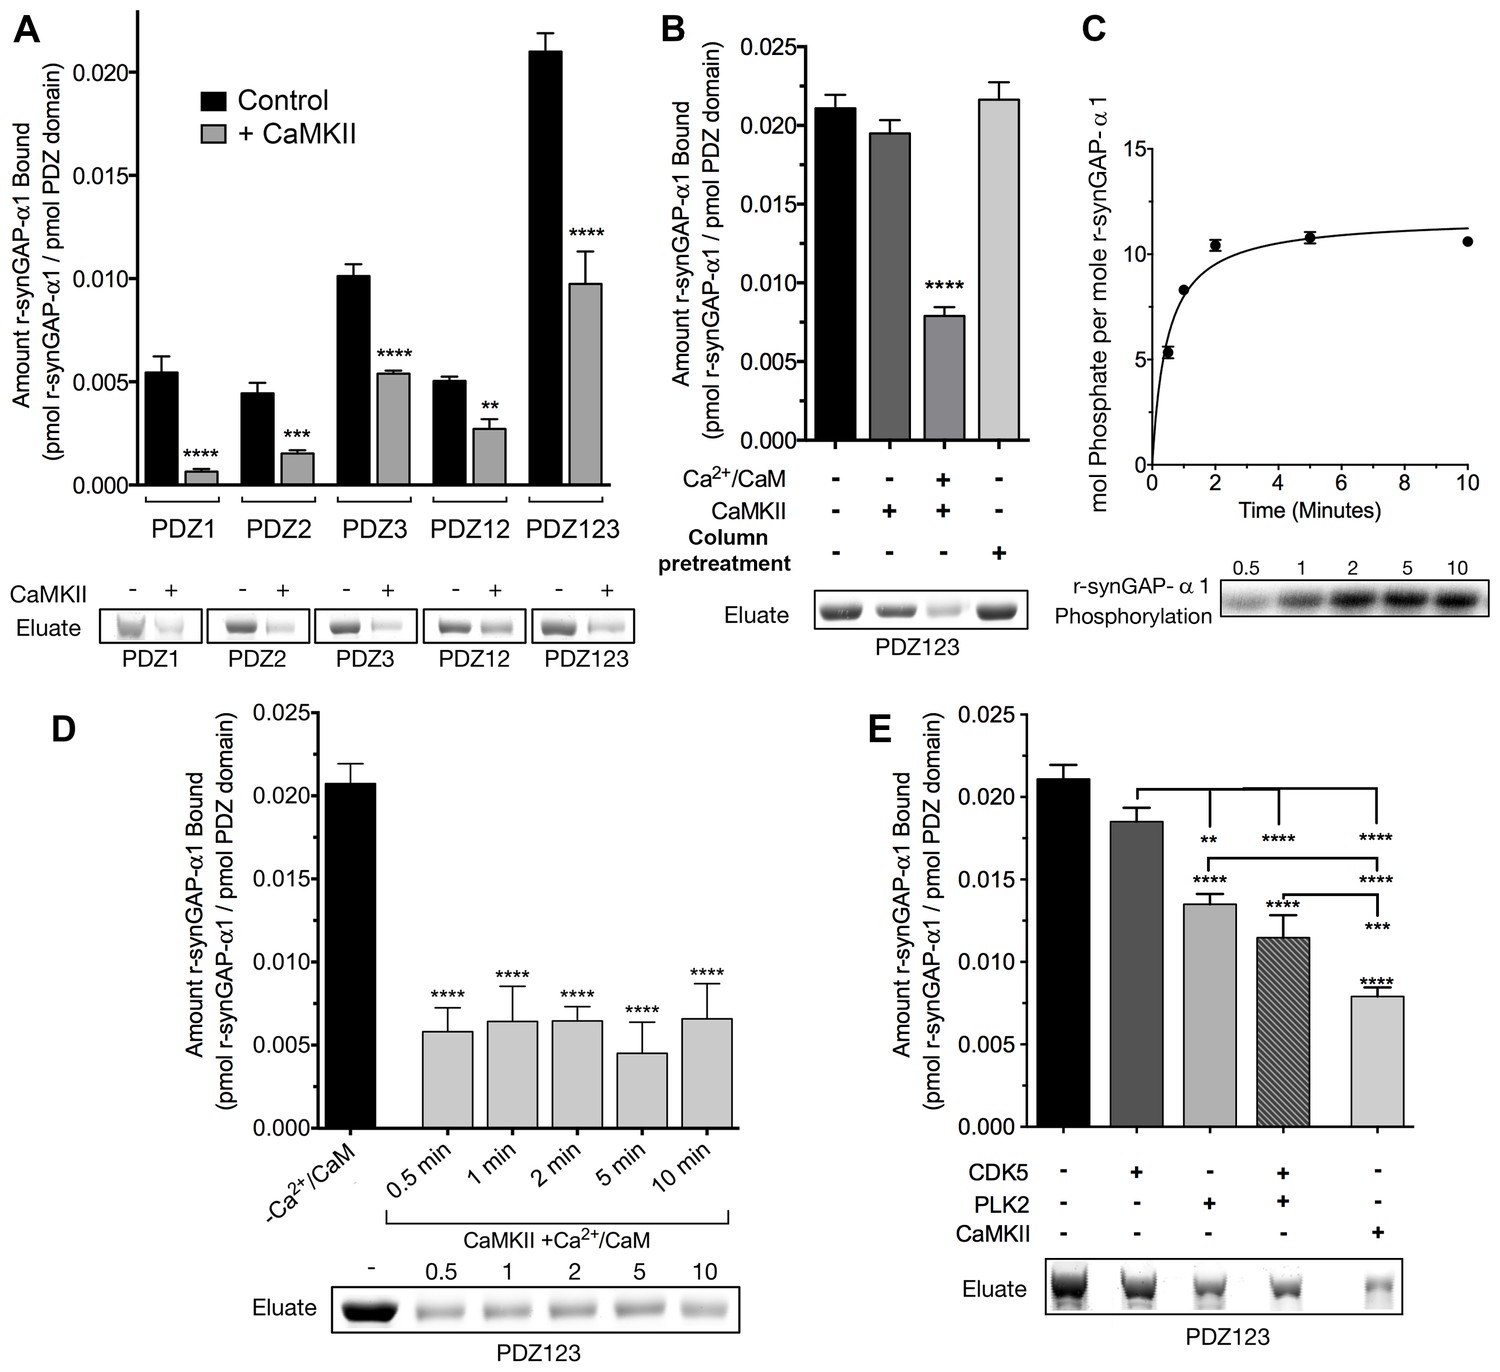
Phosphorylation by CaMKII regulates association of r-synGAP-α1 with PDZ domains of PSD-95.
(A) Association of r-synGAP-α1 with PDZ domains of PSD-95 before and after phosphorylation by CaMKII. R-synGAP-α1 was incubated in a phosphorylation mix for 10 min with either 0 CaMKII and 0 Ca2+/CaM (control) or 10 nM CaMKII and 0.7 mM CaCl2 /3.4 μM CaM (+ CaMKII) before binding to PDZ domain resins for 60 min at 25°C, as described under 'Materials and methods.' There is no detectable binding of synGAP to unsubstituted resin, and no detectable non-specific binding of proteins to the PDZ resins under these conditions (Walkup and Kennedy, 2014). (B) Both Ca2+/CaM and CaMKII are required in the phosphorylation reaction to reduce binding of r-synGAP-α1 to PDZ123 resin. R-synGAP-α1 was incubated in the phosphorylation reaction without either Ca2+/CaM or CaMKII or with both before binding to PDZ resin. The final bar shows that phosphorylation of the PDZ123 domain resin itself doesn’t alter binding of r-synGAP-α1. PDZ123 domain affinity resin was phosphorylated for 60 min in the presence of CaMKII and 0.7 mM CaCl2/3.4 μM CaM before incubation with control r-synGAP (500 nM) for 60 min at 25°C. (C) Stoichiometry of phosphorylation of r-synGAP-α1 by CaMKII. R-synGAP-α1 (725 nM) was phosphorylated in the presence of CaMKII (10 nM), as described under 'Materials and methods.' At the indicated times, reactions were quenched by addition of 3x Laemmli sample buffer. Radiolabeled r-synGAP-α1 was isolated by SDS-PAGE and quantified as described under 'Materials and methods.' (D) Change in affinity of r-synGAP-α1 for PDZ123 after phosphorylation by CaMKII for times corresponding to those measured in C. R-synGAP-α1 was phosphorylated for 0.5 to 10 min as described in C before incubation with PDZ123 domain affinity resin for 60 min as described under 'Materials and methods.' Control (-CaMKII, -Ca2+/CaM) is r-synGAP-α1 incubated in the phosphorylation reaction in the absence of CaMKII and Ca2+/CaM. (E) Change in affinity of r-synGAP-α1 for PDZ123 after phosphorylation for 10 min by CDK5 or PLK2. or by a combination of the two, as described in 'Materials and methods.' The reduction in binding after phosphorylation for 10 min by CaMKII is shown for comparison. Data shown in A-E are plotted as mean ± S.E. (n = 4). For A, B, D, and E, the statistical significance of differences in binding to PDZ domain resin relative to unphosphorylated r-synGAP-α1 control (-Ca2+/CaM) was determined by ordinary one way ANOVA (uncorrected Fisher’s LSD). **p<0.01; ***p<0.001; ****p<0.0001.
-
Figure 3—source data 1
Source data for Figure 3A.
- https://doi.org/10.7554/eLife.16813.006
Figure 3—figure supplement 1
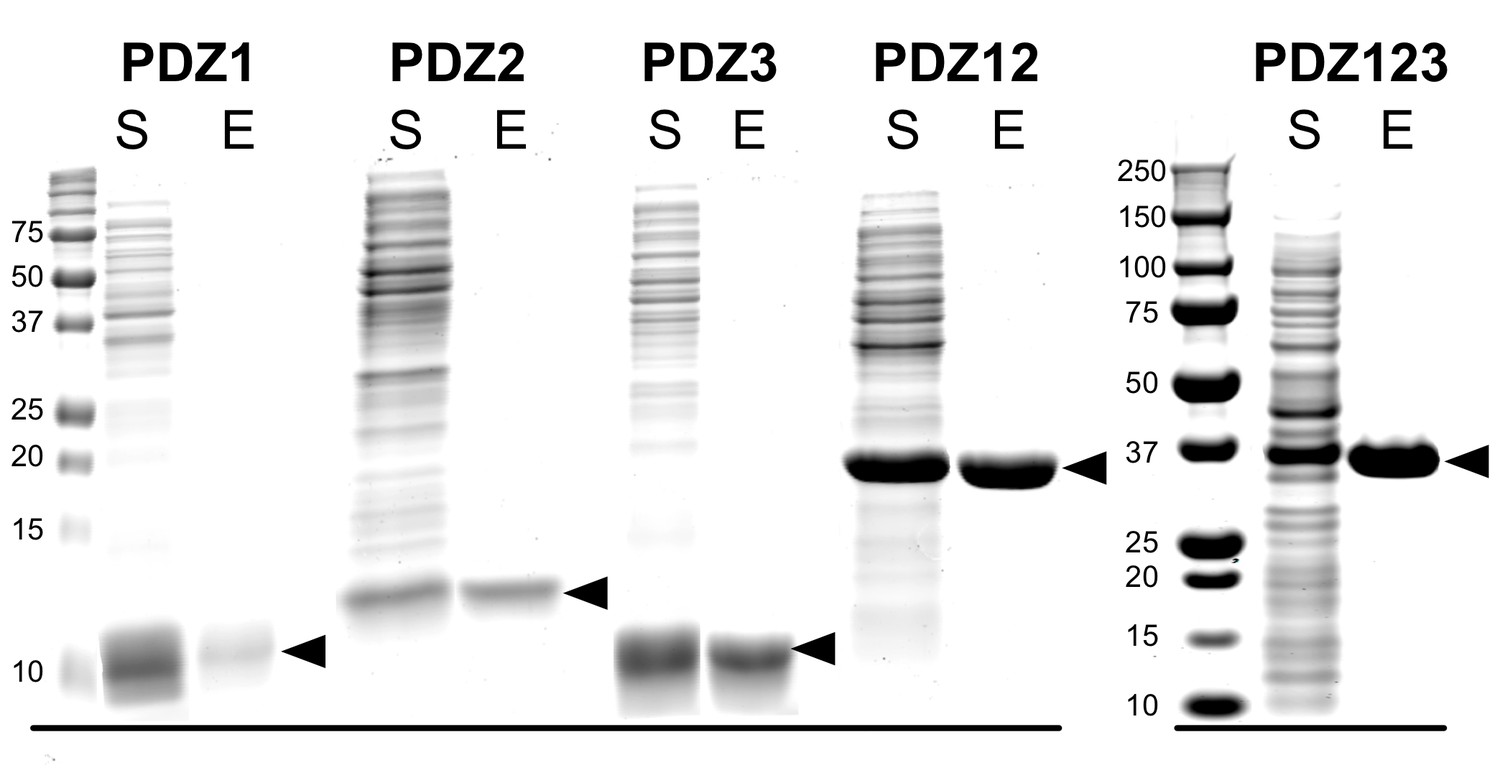
Purification of recombinant PDZ domains of PSD-95.
PDZ domains of PSD-95 were expressed in E. coli individually or combined in a single peptide, as indicated, and purified as described under 'Materials and methods.' Proteins in the starting soluble fraction (S) and eluted from PDZ ligand affinity columns (E) were fractionated on 12% (PDZ1, PDZ2, PDZ3, PDZ12) or 4–12% gradient (PDZ123) SDS-polyacrylamide gels and stained as described under 'Materials and methods.'
Figure 4
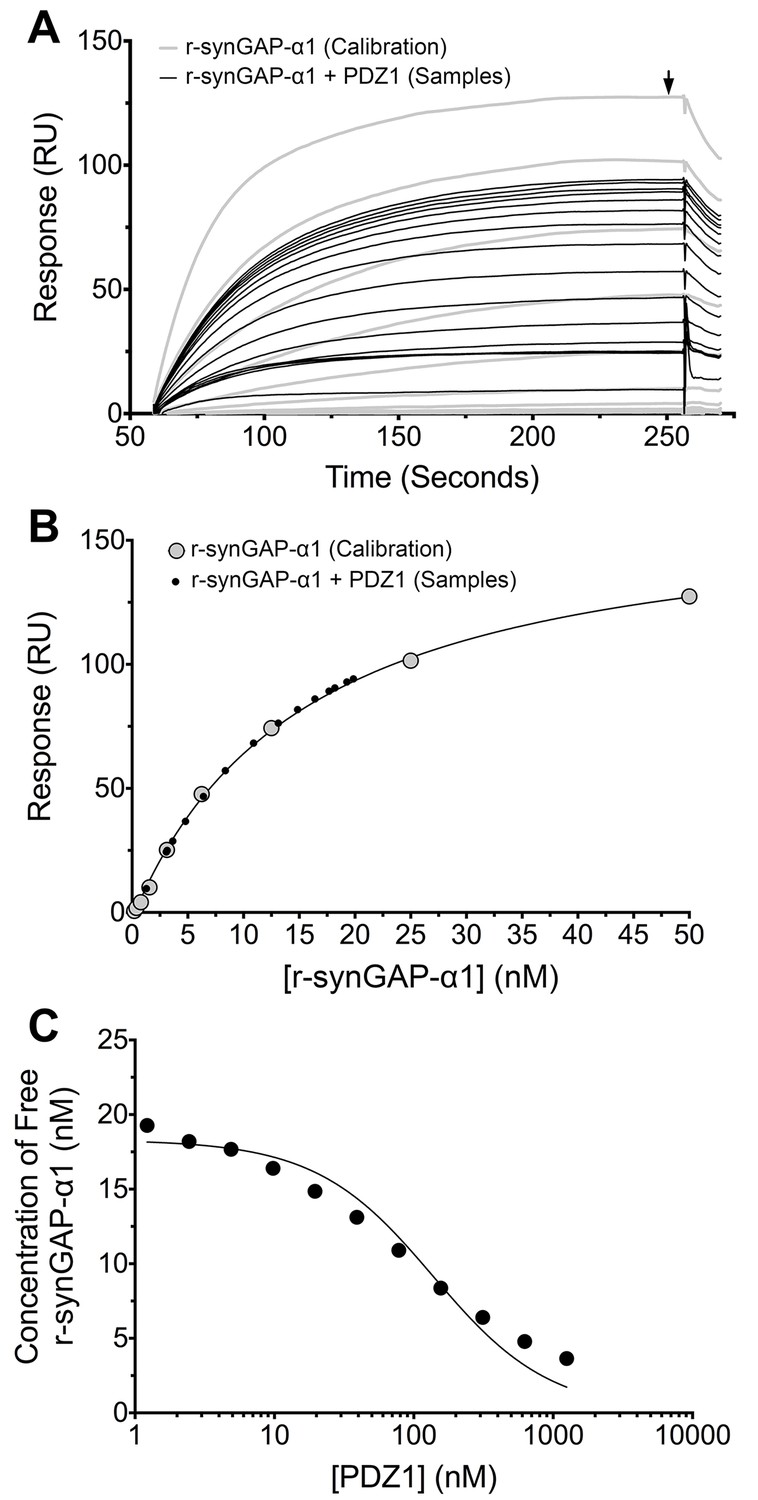
Measurement of affinity of r-synGAP-α1 for PDZ1 of PSD-95 by the 'competition in solution' method.
(A) Biacore sensorgrams showing the calibration curves (grey lines) for binding of 0–50 nM r-synGAP-α1 and the measurement of free r-synGAP-α1 (samples; black lines) in mixtures containing 25 nM r-synGAP-α1 and 0–10 μM PDZ1 domain. Free r-synGAP-α1 was detected by binding to PDZ1 domains immobilized on a Biacore chip as described under 'Materials and methods.' (B) A standard calibration curve was constructed by plotting the maximum calibrated resonance responses (marked by arrow in A) against the corresponding concentrations of r-synGAP-α1 (large grey dots). The maximum resonance responses for each sample mixture were plotted on the standard curve to determine the free r-synGAP-α1 concentrations in each mixture (black dots). (C) Plot of free r-synGAP-α1 concentrations determined in B against the log of PDZ domain concentrations (black circles). The data were fit to the binding equation shown in 'Materials and methods' with the use of Biacore software. A KD value (Table 1) was calculated from the equation as described under 'Materials and methods.'
Figure 5
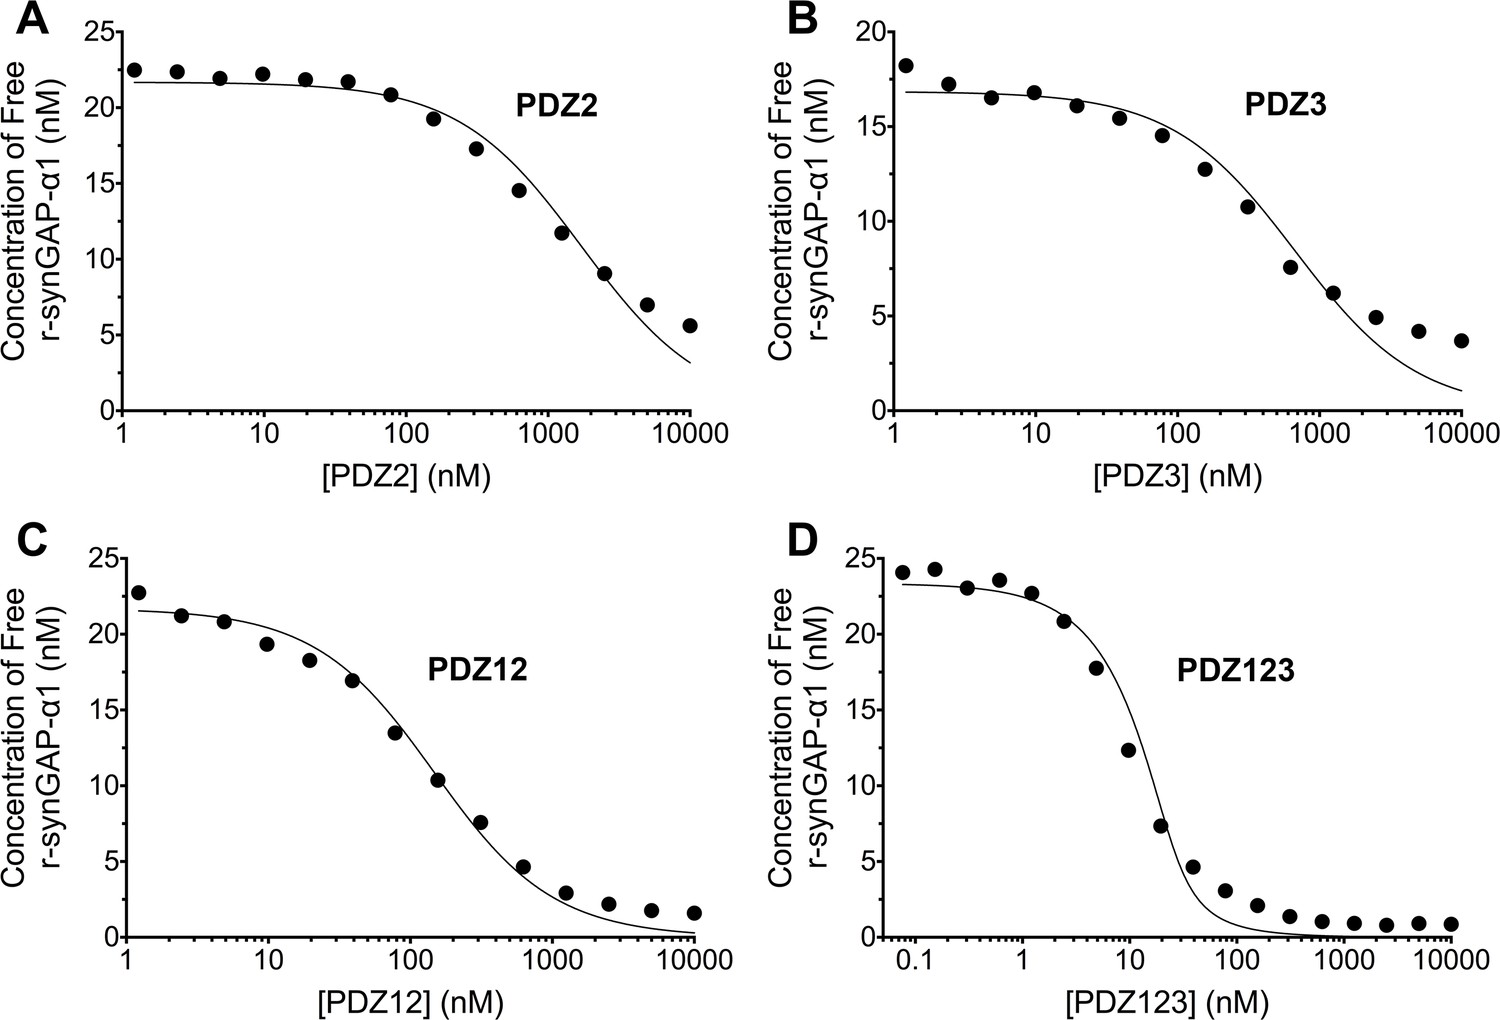
Affinities and apparent affinities of r-synGAP for PDZ2, PDZ3, PDZ12 and PDZ123 domains of PSD-95 determined by the 'competition in solution' method.
The concentrations of free r-synGAP-α1 in sample mixtures containing each of the indicated PDZ domains were measured as described in Figure 4A and B, and under 'Materials and methods.' The values (black dots) were plotted against the log of the PDZ domain concentration and fit to a binding curve as described in Figure 4C. Representative experiment for A, PDZ2; B, PDZ3; C, PDZ12; and D, PDZ123. The calculated KD and KDapp values from all experiments are listed in Table 1.
Figure 6
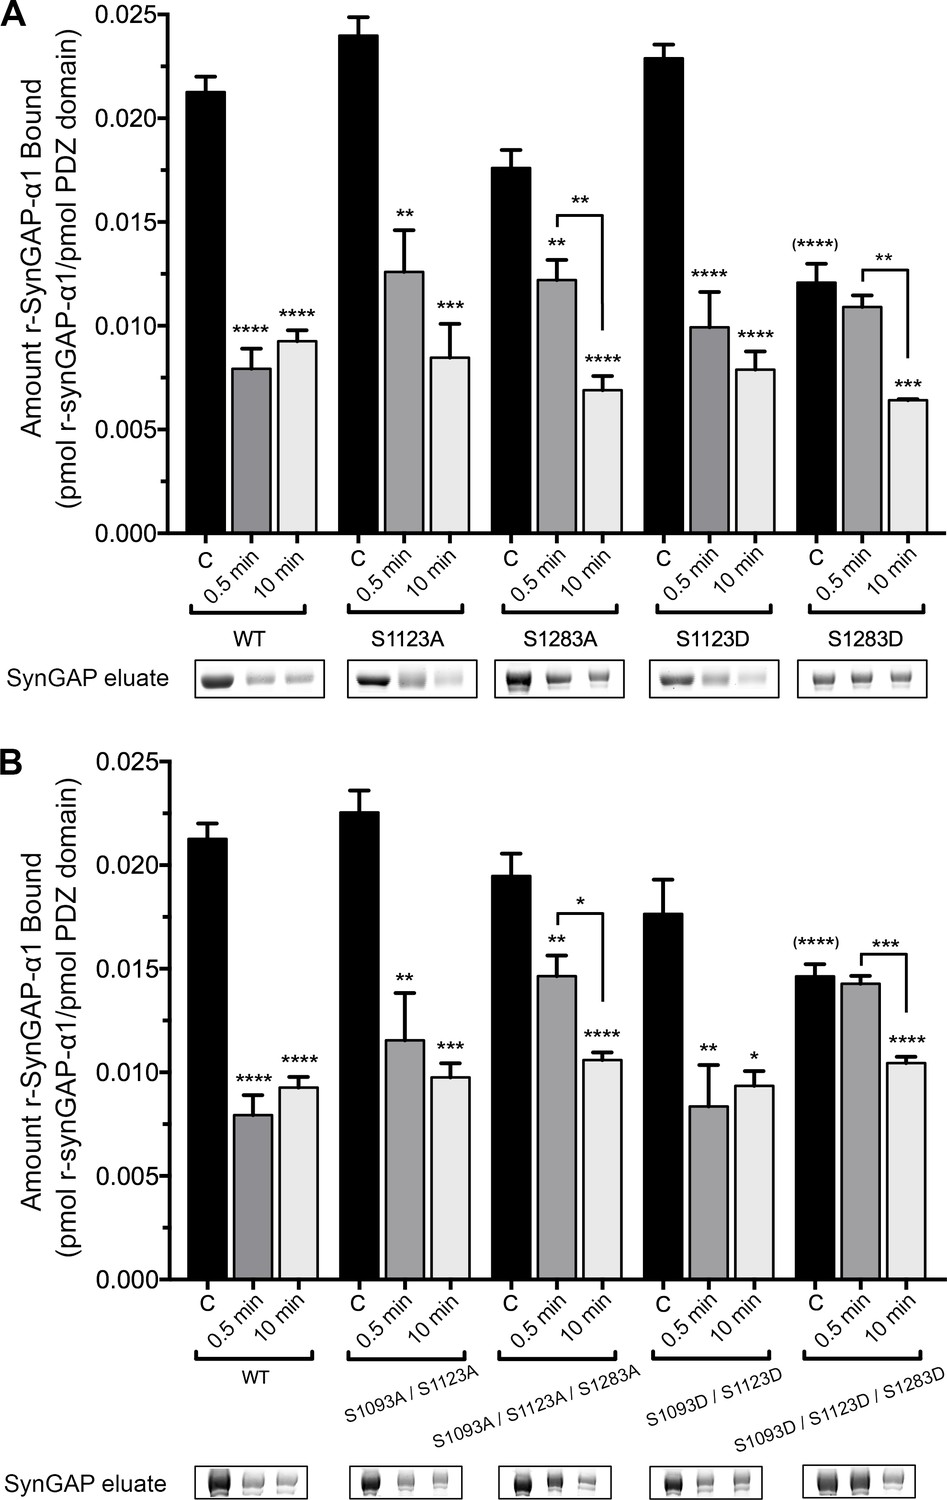
Effect of phosphorylation by CaMKII on association of PDZ123 domains with phospho-deficient and phospho-mimetic mutants of r-synGAP-α1.
Wild-type and mutant r-synGAP-α1 were incubated with phosphorylation mixtures for 10 min without (Control), or for 0.5 or 10 min with 10 nM CaMKII, 0.7 mM CaCl2/3.4 μM CaM(CaMKII), then incubated with PDZ123 affinity resin for 60 min at 25°C, as described under 'Materials and methods.' (A) Binding to PDZ123 of r-synGAP-α1 and single mutations at S1123 and S1283. Sites S1123 or S1283 were mutated either to alanine (S1123A, S1283A) or to the phosphomimetic aspartate (S1123D, S1283D). (B) Binding to PDZ123 of r-synGAP-α1 and double or triple mutations at S1093, S1123, and S1283, as indicated. Data are mean ± S.E. (n = 4). The statistical significances of differences between wild type and the various mutants in binding to PDZ123 before phosphorylation were determined by ordinary one way ANOVA (Tukey correction for multiple comparisons). Only mutations including S1283D were significantly different from wild type (indicated by (****)). Differences between unphosphorylated and phosphorylated individual mutants were compared individually by ordinary one way ANOVA (uncorrected Fisher’s LSD). *pp<0.05; **p<0.01; ***p<0.005; ****p<0.0001. See the text for additional statistical comparisons.
Figure 7
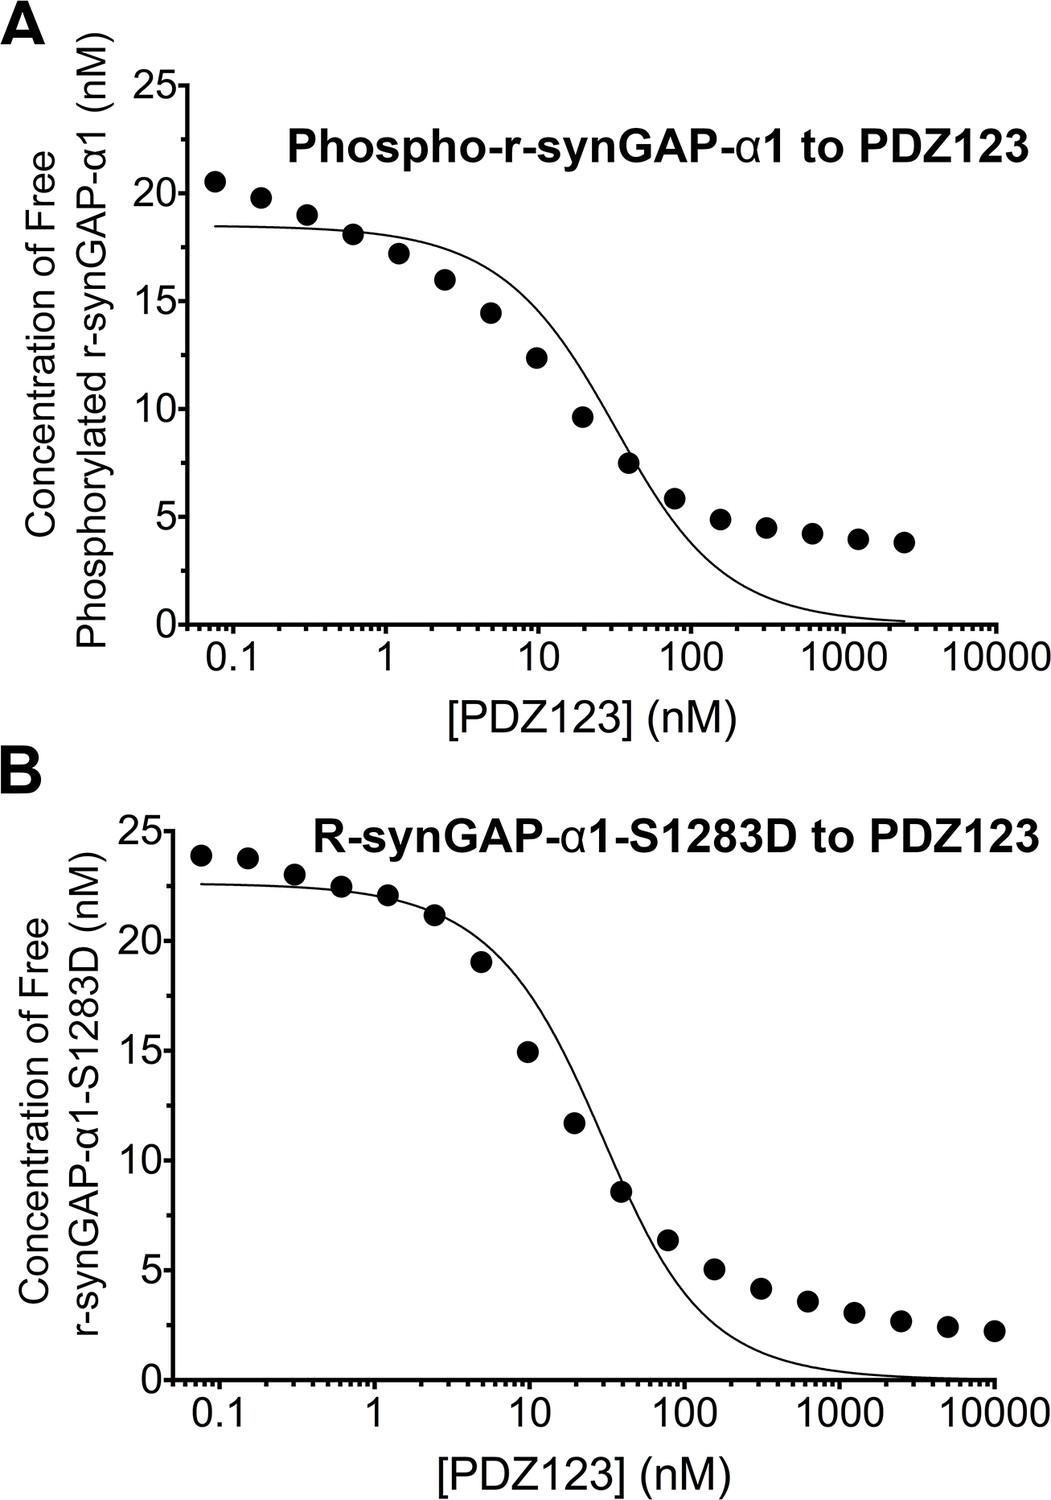
Apparent affinities of phosphorylated r-synGAP-α1 and r-synGAP-α1-S1283D for PDZ123 determined by the 'competition in solution' method.
Representative plots of the concentrations of (A) free phospho-r-synGAP-α1 phosphorylated as described for PDZ Binding Assays under 'Materials and methods,' and (B) r-synGAP-α1-S1283D, measured in sample mixtures containing PDZ123 as described in Figure 4A and B, and under 'Materials and methods.' The values (black dots) were plotted against the log of the PDZ123 concentration in the mixture and fit to a binding curve as described in Figure 4C. The calculated values of KDapp are listed in Table 1.
Figure 8 with 2 supplements
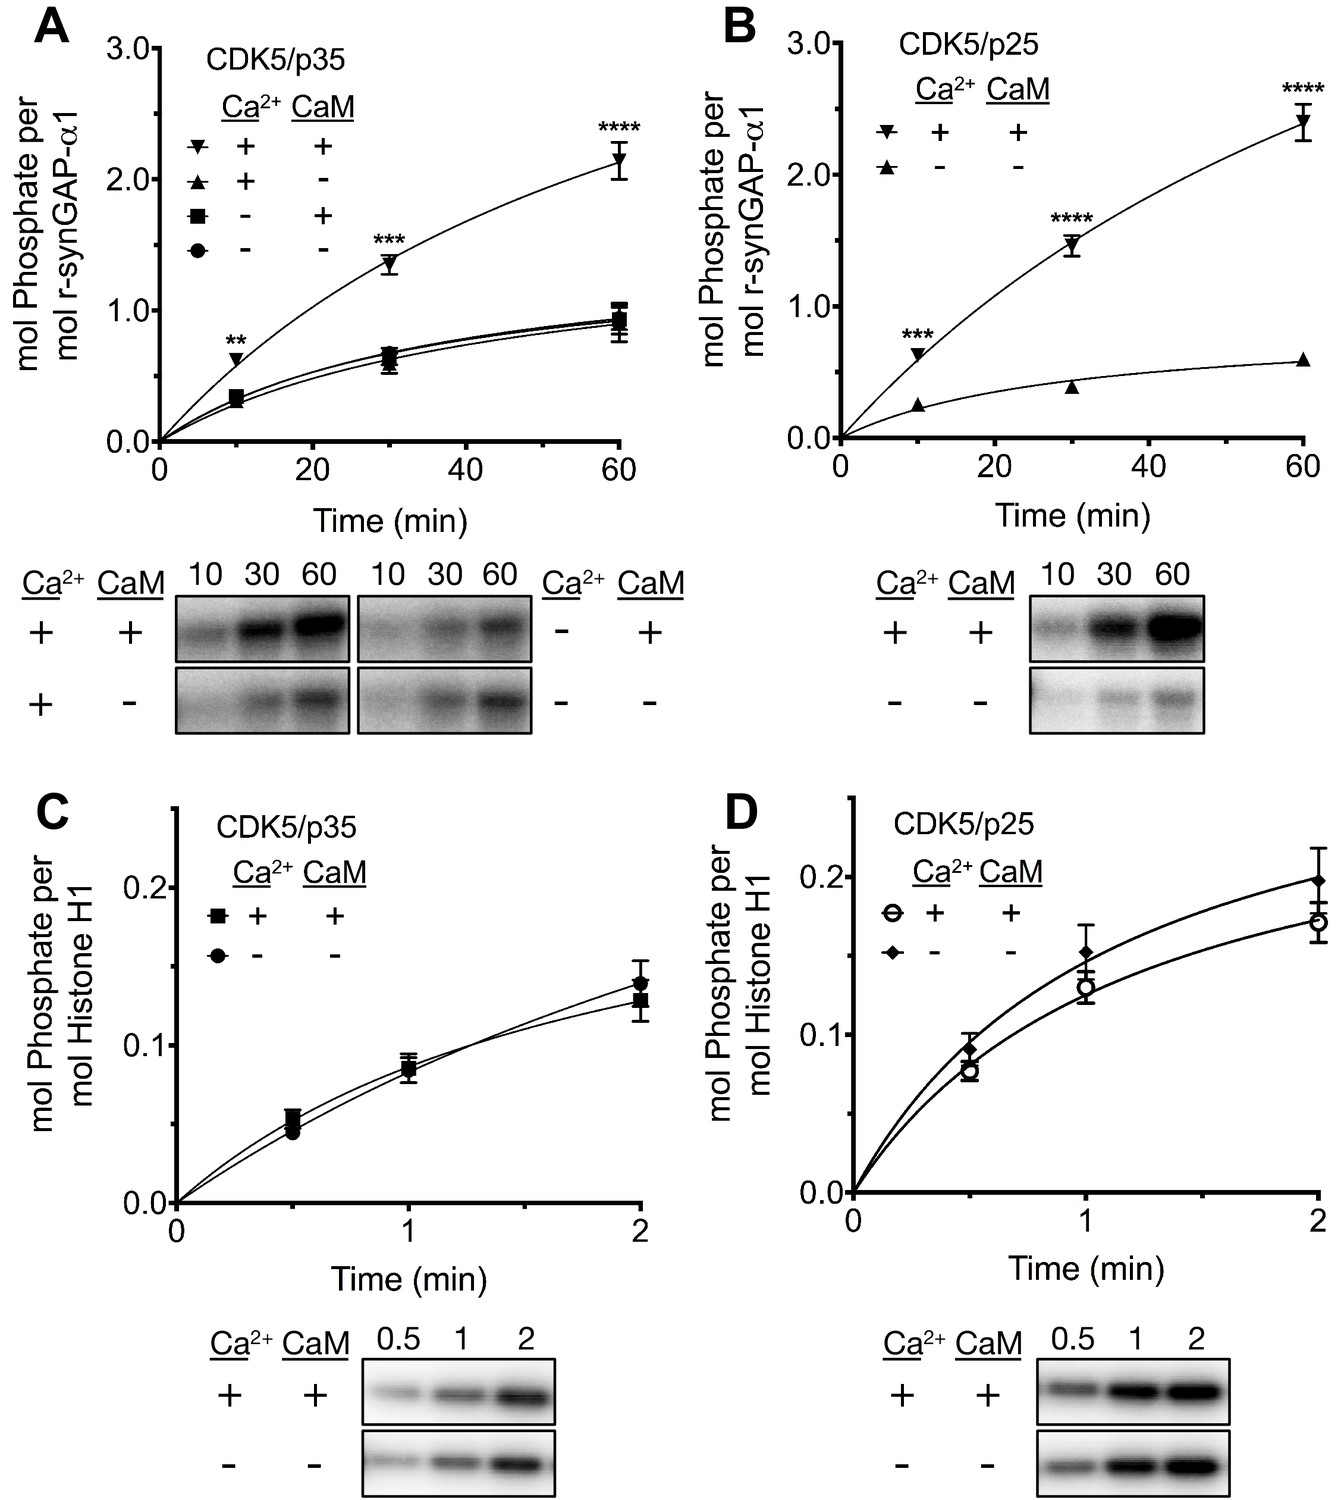
Effect of Ca2+/CaM on stoichiometry of phosphorylation of r-synGAP-α1 and histone H1 by CDK5.
Stoichiometry of phosphorylation of r-synGAP-α1 (A and B) and histone H1 (C and D) by CDK5/p35 or CDK5/p25. R-synGAP-α1 (286 nM) or histone H1 (4.3 μM) were incubated with CDK5/p35 or CDK5/p25 as described under 'Materials and methods' in the presence or absence of 0.7 mM CaCl2 or 3.4 μM CaM, as indicated in each panel. Reactions were quenched at the indicated times by addition of 3x Laemmli sample buffer and radiolabeled r-synGAP-α1 and histone H1 were quantified as described under 'Materials and methods.' Data are plotted as mean ± S.E. (n = 4–7). The statistical significance of differences in phosphorylation in the presence of Ca2+ and CaM were determined by ordinary one way ANOVA (uncorrected Fisher’s LSD). **p<0.01; ***p<0.001; ****p<0.0001.
Figure 8—figure supplement 1

R-synGAP-α1 binds to CaM affinity resin.
Clarified E. coli lysate (Load) containing r-synGAP-α1 was incubated with CaM-Sepharose 4B or control Sepharose 4B resin in the presence of 0 or 5 mM CaCl2 and 0 or 10 mM EGTA, as described under 'Materials and methods.' After washing, bound protein was eluted from the resin with 100 mM EGTA (Eluate), fractionated by SDS-PAGE, and visualized by staining with Gel Code Blue(Total Protein) or transferred to a PVDF membrane. R-synGAP-α1 was detected on the immunoblots with anti-synGAP or anti-TetraHis antibodies, as described under 'Materials and methods.' In the absence of exogenous calcium, r-synGAP-α1 bound weakly to the CaM-Sepharose, but not to control Sepharose beads. When 5 mM Ca2+ was included in the binding and wash buffers its binding to CaM-Sepharose increased, while addition of 10 mM EGTA to the buffers nearly abolished binding. CaM-Sepharose eluate was quantified by scanning the stained blots and gel on a Li-Cor Imager as described under 'Materials and methods.'
Figure 8—figure supplement 2
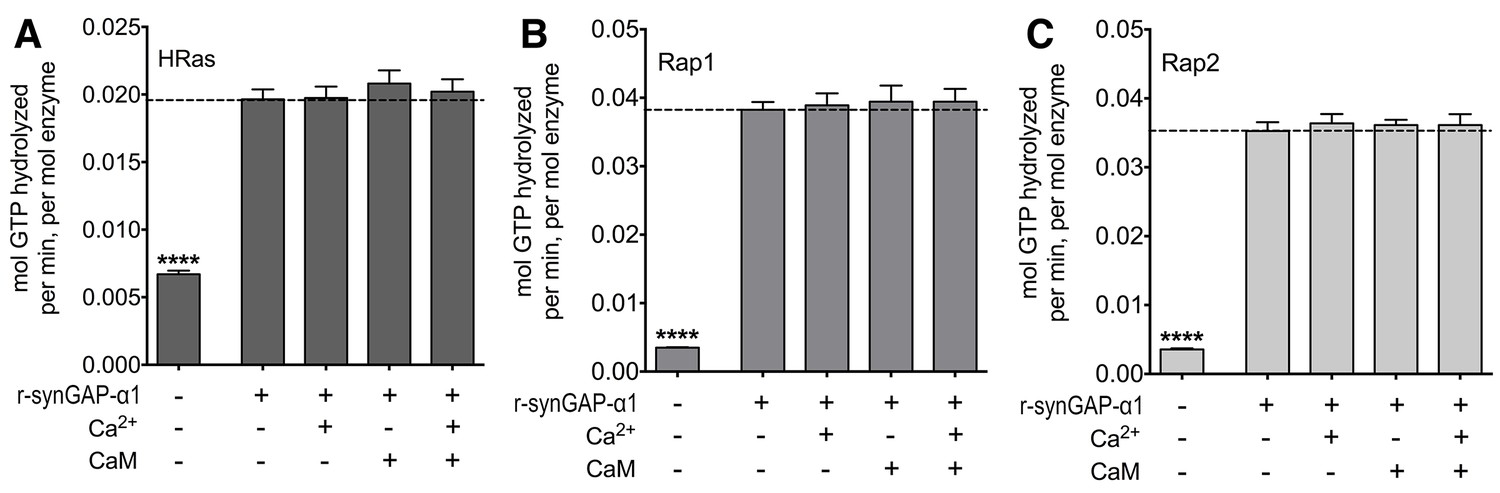
Effect of Ca2+/CaM on GAP activity of r-synGAP-α1.
The GAP activity of r-synGAP-α1 (250 nM) for the indicated GTP-binding protein was assayed as described in Walkup et al. (2015) except that 1 mM Ca2+, 3.4 µM CaM, or both were added to the GAP assay. A, HRas GAP activity; B, Rap1 GAP activity; and C, Rap2 GAP activity. Data are mean ± S.E. The statistical difference of the GTPase activity of each GTP-binding protein in the absence of synGAP from all of the other conditions was determined by ordinary one way ANOVA (uncorrected Fisher’s LSD). ****p<0.0001.
Figure 9

Affinity of r-synGAP-α1 and sr-synGAP for Ca2+/CaM determined by equilibrium analysis.
(A and B) The affinity of r-synGAP-α1 for Ca2+/CaM was measured by SPR with CaM immobilized on the chip and r-synGAP-α1 injected at 0–75 nM onto the chip surface as described under 'Materials and methods.' (A) Sensorgrams with the blank and reference flow cell readings subtracted show the response upon injection of r-synGAP-α1 onto the chip surface (0–75 s) and its dissociation from the chip surface (75–150 s). (B) RUs at equilibrium (marked by arrow in A) were plotted against the corresponding concentrations of r-synGAP-α1 and fitted to a hyperbolic curve. A KD of 9 ± 1 nM was calculated as described under 'Materials and methods.' (C and D) The affinities of r-synGAP-α1 (C) and sr-synGAP (D), (0–500 nM) for Ca2+/CaM were measured by incubation with CaM-Sepharose resin as described under 'Materials and methods.' Integrated intensities of bound r-synGAP-α1 and sr-synGAP were measured from immunoblots as described under 'Materials and methods' and plotted versus the corresponding concentrations incubated with resin. Integrated intensities from Western blots were linear over the range of r-synGAP-α1 and sr-synGAP concentrations used in the assays. Data in C and D are plotted as mean ± S.E. (n = 3).
Figure 10
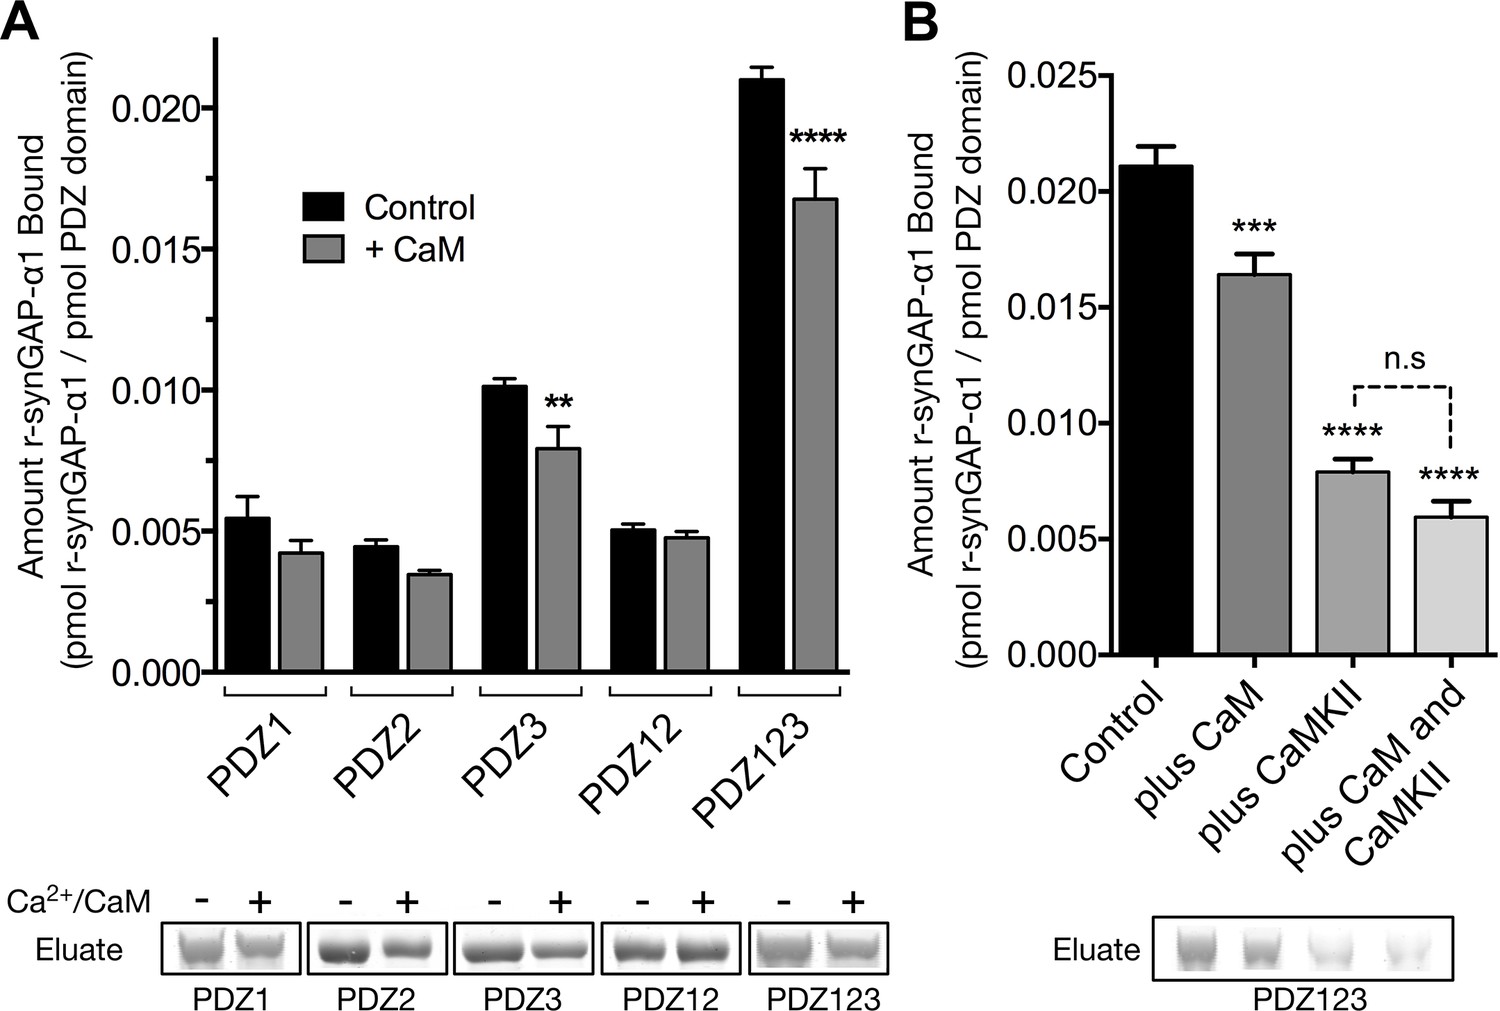
Effect of Ca2+/CaM binding on association of r-synGAP-α1 with PDZ domains of PSD-95.
(A) Association of control and Ca2+/CaM bound r-synGAP-α1 with PDZ domains of PSD-95. R-synGAP-α1 (500 nM) without (Control) or with (+ CaM) 0.7 mM CaCl2/3.4 μM CaM was incubated with PDZ domain resins (PDZ1, PDZ2, PDZ3, PDZ12, and PDZ123) for 60 min at 25°C and bound r-synGAP-α1 was measured as described under 'Materials and methods.' (B) Effects of bound Ca2+/CaM and phosphorylation by CaMKII on association of r-synGAP-α1 with PDZ123 domain are not additive. The association with PDZ123 domain resin of Control, Ca2+/CaM bound (plus CaM), phosphorylated r-synGAP-α1 (plus CaMKII) and phosphorylated r-synGAP-α1 bound to Ca2+/CaM (plus CaM and CaMKII) was measured as described in A. Data are plotted as mean ± S.E. (n = 4). The statistical significance of differences in PDZ domain binding relative to Control was determined by ordinary one way ANOVA (uncorrected Fisher’s LSD). **p<0.01; ****p<0.0001.
-
Figure 10—source data 1
Source data for Figure 10A.
- https://doi.org/10.7554/eLife.16813.018
Figure 11
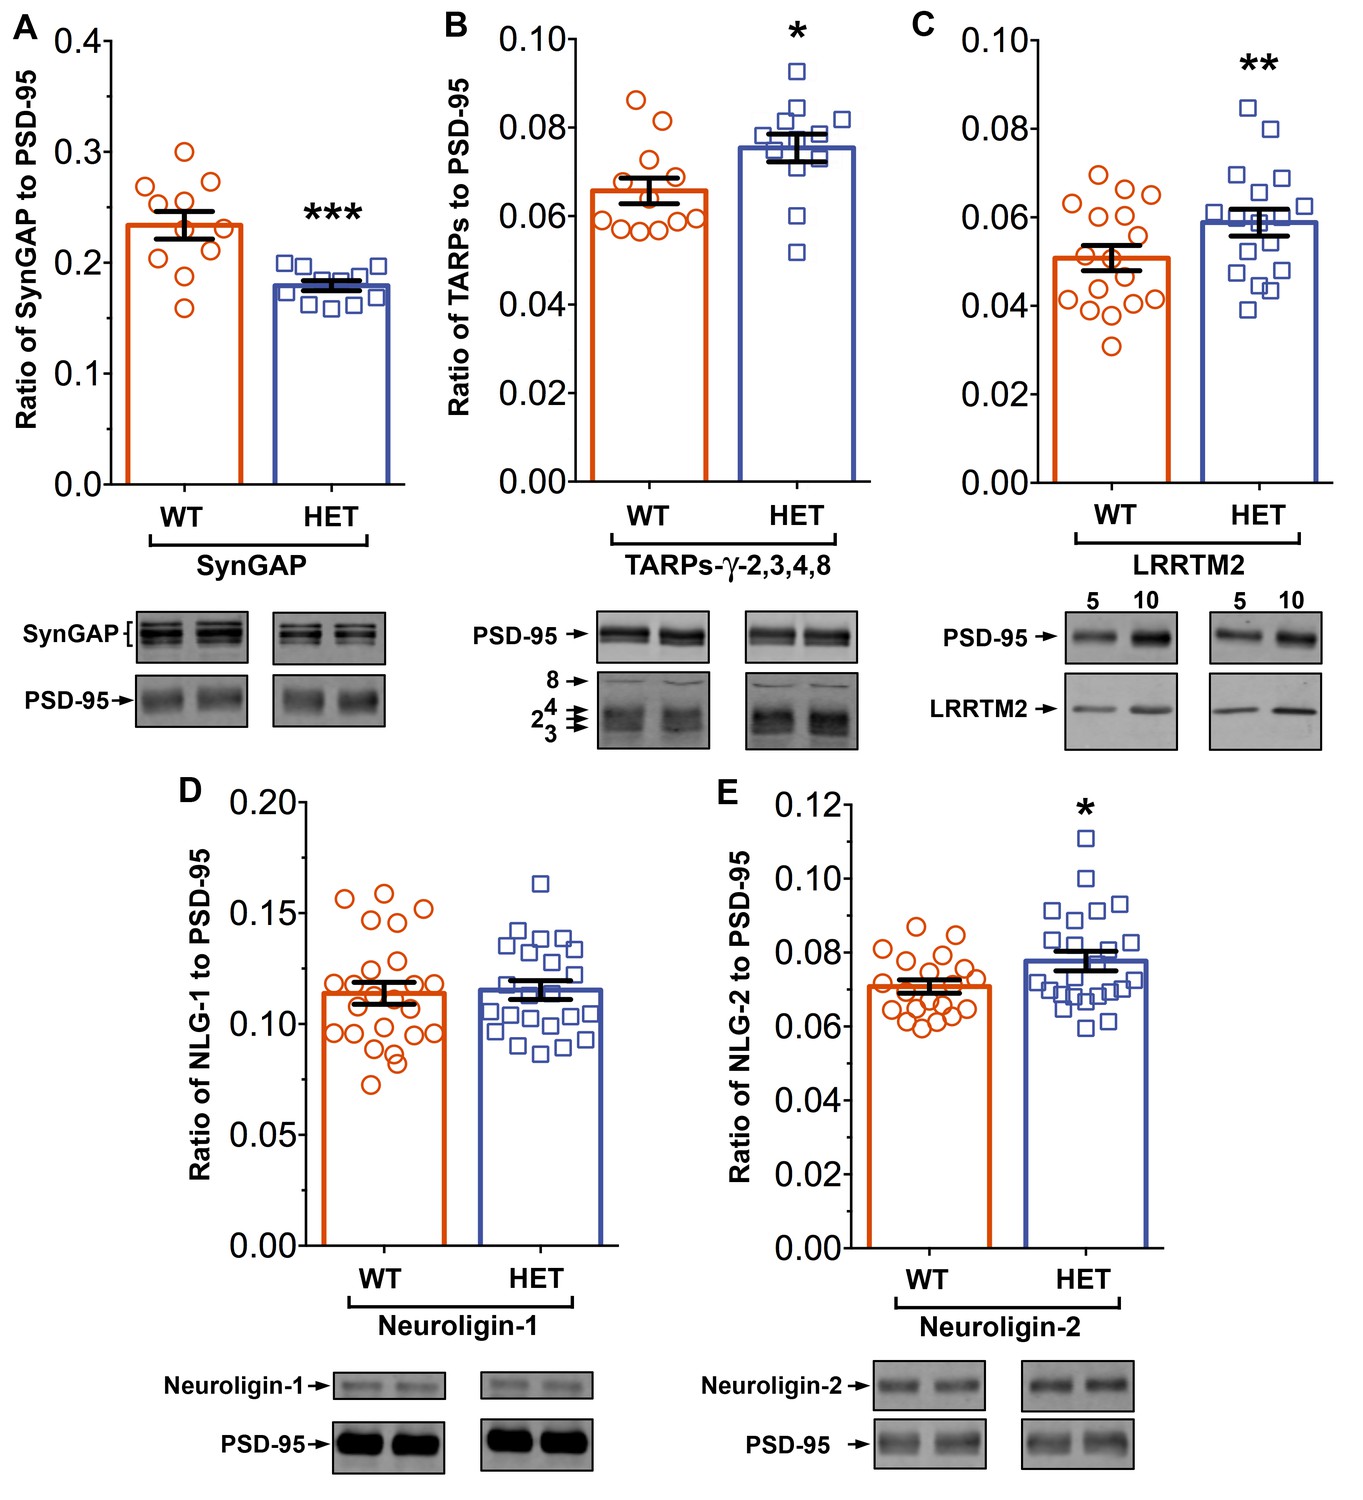
Altered composition of the PSD in mice with heterozygous deletion of synGAP.
Ratios of amounts of the indicated proteins to PSD-95 in each lane were measured as described in 'Materials and methods' and are reported as mean ± S.E. For all blots except those for neuroligin-1, PSD-95 was detected with a secondary Ab labeled with AlexaFluor680 and the binding protein was detected with secondary Ab labeled with IRDye 800. On the neuroligin-1 blot, both PSD-95 and neuroligin-1 were detected with AlexaFluor680; the two bands were well-separated in each lane. Representative sets of visualized bands for WT and HET from the same blot are shown below the graphs. Individual points represent the ratio of the indicated protein to PSD-95 in a single lane (n refers to these technical replicates). The WT and HET PSD preparations were each made from six animals; thus, each of the two preparations represents six biological replicates. (A) SynGAP to PSD-95 ratio. Data were collected for 22 lanes from two blots containing 5 µg total PSD fraction per lane. One blot contained six lanes WT and six lanes HET samples, the other contained five lanes of each. The mean ratio of synGAP to PSD-95 was 0.234 ± 0.012 for WT (n = 11) and 0.179 ± 0.005 (n = 11) for HET (−24%). Means were compared by unpaired, one-tailed t-test with Welch correction, p = 0.0007. Effect size, d = 1.75. (B) TARP ɣ -2,3,4,8 to PSD-95 ratio. Data were collected for 24 lanes from two blots containing 10 µg total PSD fraction per lane. Each blot contained six lanes WT and six lanes HET samples. Densities of all four TARPs were pooled. The mean ratio of TARPs to PSD-95 was 0.066 ± 0.003 (n = 12) for WT and 0.075 ± 0.003 (n = 12) for HET (+12%). Means were compared by unpaired, one-tailed t-test with equal variance, p = 0.017. Effect size, d = 0.93. (C) LRRTM2 to PSD-95 ratio. Data were collected for 36 lanes from three blots containing six WT and six HET samples, alternating 5 and 10 µg (3 each). The mean ratio of LRRTM2 to PSD-95 was 0.051 ± 0.003 (n = 17) for WT and 0.059 ± 0.003 (n = 17) for HET (+14%). Means were compared by paired, one-tailed t-test, p=0.0035. Effect size, d = 0.66. (D) Neuroligin-1 to PSD-95 ratio. Data were collected for 47 lanes from four blots two of which contained 5 µg and two 10 µg total PSD fraction per sample. Each blot contained 6 lanes WT and 6 lanes HET samples. The mean ratio of neuroligin-1 to PSD-95 was 0.114 ± 0.005 (n = 24) for WT and 0.115 ± 0.004 (n = 23) for HET (no difference). Means were compared by unpaired one-tailed t-test, p = 0.413. Effect size, d = 0.07. (E) Neuroligin-2 to PSD-95 ratio. Data were collected for 44 lanes from four blots containing 10 µg total PSD fraction per lane. Each blot contained six lanes WT and six lanes HET samples. The mean ratio of neuroligin-2 to PSD-95 was 0.071 ± 0.002 (n = 20) for WT and 0.078 ± 0.003 (n = 24) for HET (+9%). Means were compared by unpaired, one-tailed t-test with Welch correction, p=0.019. Effect size, d = 0.64. *p<0.005; **p<0.01; ***p<0.001
-
Figure 11—source data 1
Source data for ratios determined in Figure 11 A through E.
- https://doi.org/10.7554/eLife.16813.020
Figure 12
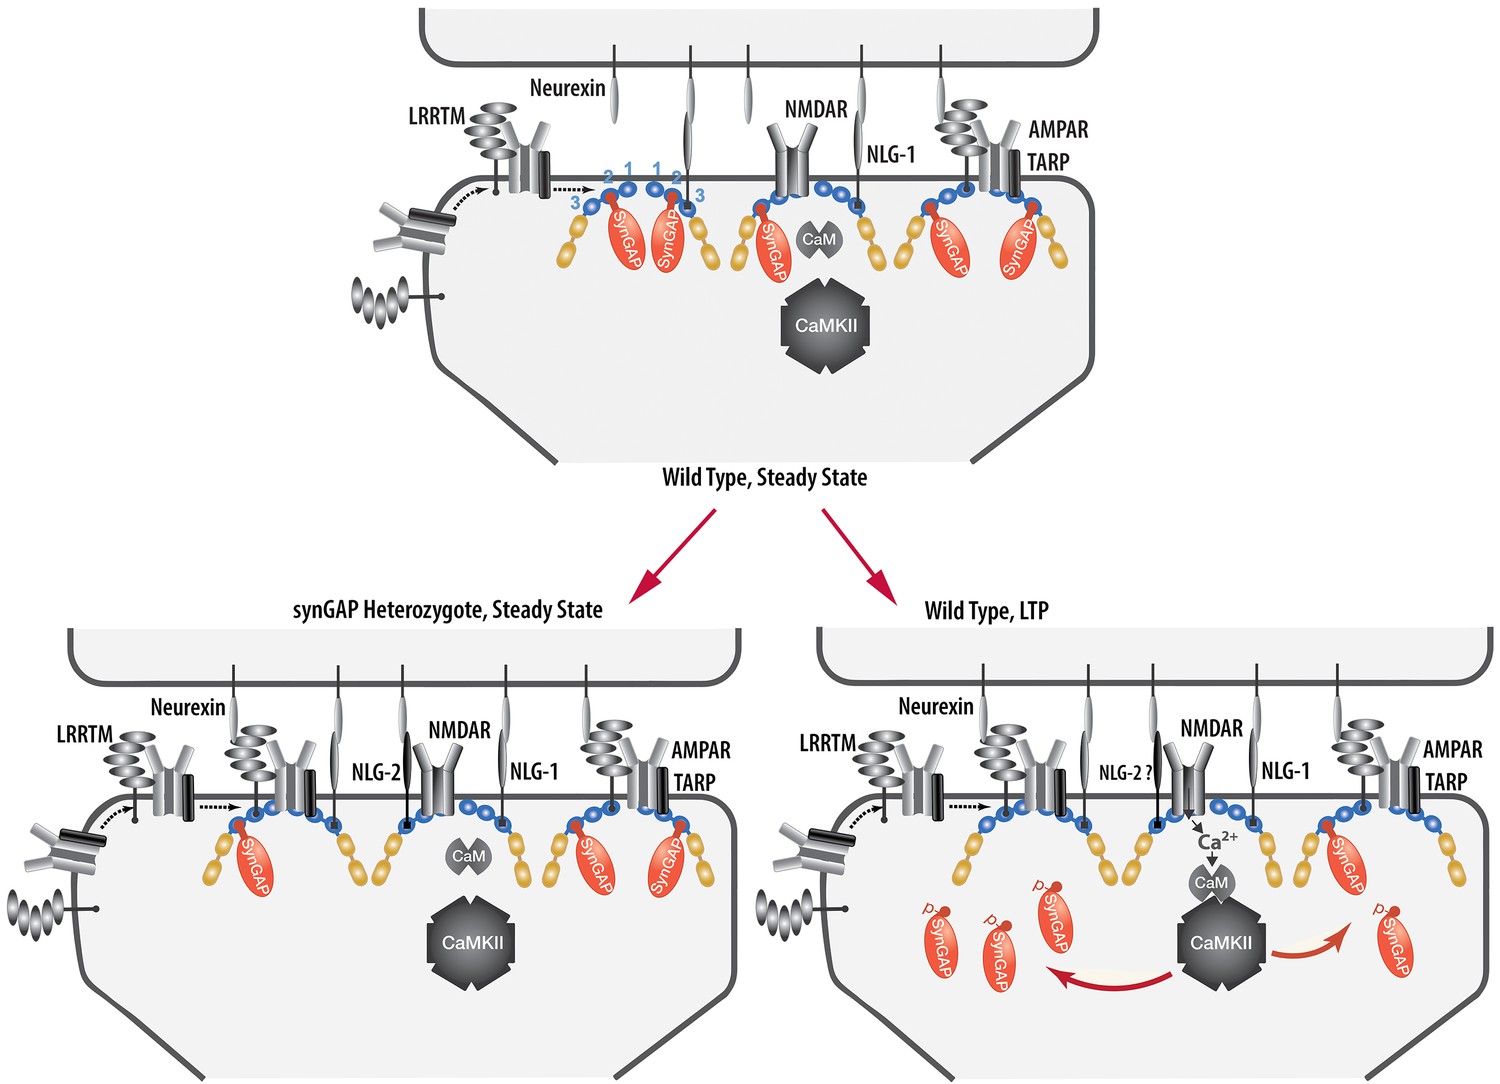
Cartoon model of rearrangement of PSD caused by synGAP haploinsufficiency or by phosphorylation of synGAP-α1 by CaMKII.
Unphosphorylated synGAP-α1 (Top) binds to PDZ1, PDZ2 or PDZ3 of PSD-95, occupying as many as ~15% of its PDZ domains. The PDZ domains of PSD-95 are shown in blue and their numbers are indicated on the left pair of PSD-95 molecules. AMPARs that have been inserted into the extrasynaptic membrane by exocytosis associate with TARPs and with LRRTMs, both of which can bind to PDZ1 and PDZ2 of PSD-95. Neuroligin-1 (NLG-1) binds to PDZ3 of PSD-95. LRRTMs and NLG-1 also bind across the synaptic cleft to presynaptic neurexins. Induction of LTP (Lower Right) causes flux of calcium through NMDARs that activates CaMKII leading to phosphorylation of synGAP-α1 on sites in the regulatory domain. The affinity of synGAP-α1 for the PDZ domains decreases, allowing TARPs, LRRTMs, and perhaps NLG-2 to displace synGAP-α1 by binding to the PDZ domains. The shift in affinity of synGAP-α1 creates 'slots' that can be occupied by TARPs and LRRTMs bound to AMPARs, and by NLG-2, leading to strengthening of the synapse. SynGAP haploinsufficiency (Lower Left) results in a reduced amount of synGAP-α1 in the PSD. Similar to the model for LTP, this leaves more PDZ domains available to bind TARPs, LRRTMs, and NLG-2.
Tables
Table 1
Affinities of R-synGAP-α1 for PDZ Domains of PSD-95. Dissociation constants (KD) and apparent dissociation constants (KDapp) for the interactions of r-synGAP-α1 with the PDZ domains of PSD-95 were determined by the Biacore/SPR 'competition in solution' method as described under 'Materials and methods.' In one experiment, the KD for PDZ3 was determined by conventional SPR as described under 'Materials and methods.' Goodness of Fit refers to the fit of data shown in Figures 4, 5, and 7 to the equation relating synGAPfree to PDZ domain concentration, assuming a single binding site, as described under 'Materials and methods.' Because PDZ12, and PDZ123 contain more than one binding site for r-synGAP-α1, the affinities are given as apparent dissociation constants. Data are expressed as mean ± S.E.
| PDZ Domain from PSD-95 | No. of Experiments | Dissociation Constant (KD) for Binding to R-synGAP (nM) | Goodness of Fit (R2) |
|---|---|---|---|
| PDZ1 | 3 | 220 ± 30 | 0.908 - 0.947 |
| PDZ2 | 2 | 1500 ± 100 | 0.967, 0.969 |
| PDZ3 | 2 | 620 ± 70 | 0.951, 0.962 |
| PDZ3 | 1 | 730 ± 50 (by conventional SPR) | N.A. |
| Apparent Dissociation Constant (KDapp) for Binding to R-synGAP (nM) | |||
| PDZ12 | 4 | 350 ± 40 | 0.931 - 0.987 |
| PDZ123 | 7 | 4.7 ± 0.6 | 0.957 - 0.987 |
| PDZ123 | 3 | (r-synGAP Phosphorylated by CaMKII) 46 ± 10 | 0.810 - 0.880 |
| PDZ123 | 2 | (r-synGAP S1283D) 16 ± 3 | 0.953, 0.954 |
Download links
A two-part list of links to download the article, or parts of the article, in various formats.
Downloads (link to download the article as PDF)
Open citations (links to open the citations from this article in various online reference manager services)
Cite this article (links to download the citations from this article in formats compatible with various reference manager tools)
A model for regulation by SynGAP-α1 of binding of synaptic proteins to PDZ-domain 'Slots' in the postsynaptic density
eLife 5:e16813.
https://doi.org/10.7554/eLife.16813


