Modelling TFE renal cell carcinoma in mice reveals a critical role of WNT signaling
- Telethon Institute of Genetics and Medicine, TIGEM, Italy
- Academical Medical Center, The Netherlands
- Leiden University Medical Center, The Netherlands
- Leiden University Medical Center, Netherlands
- European Institute of Oncology, Italy
- IFOM, The FIRC Institute for Molecular Oncology Foundation, Italy
- University of Milan, Italy
- Baylor College of Medicine, United States
- Texas Children Hospital, United States
- Federico II University, Italy
- University Paris 6, France
- IRCCS-SDN, Italy
Figures
Figure 1 with 3 supplements

Tfeb overexpressing mice display cystic kidneys.
Morphological analyses were performed on Cdh16Cre and Cdh16Cre::Tfebfs, and on tam-treated Cdh16CreErt2 and Cdh16CreErt2::Tfebfs mice. (A) Representative images of the abdominal cavity at P90. (B) Kidney size at different stages (p=days post-natal). (C) Relative ratio of kidney-to-body weight (KW/BW). Data from males (M) and females (F) are shown separately as means of Cdh16Cre::Tfebfs to Cdh16Cre KW/BW ratio. Three-way Anova was applied (factors: gender, time, genotype). (D) Evaluation of the survival of Cdh16Cre::Tfebfs and tam-treated Cdh16CreErt2::Tfebfs mice. Mantel-Cox test was applied (Cdh16CreErt2::Tfebfs tam P12/tam P14 p-value 0.02; Cdh16CreErt2::Tfebfs tam P12/P30 p-value<0.0001). (E) Haematoxylin and Eosin (HE) staining of kidneys. Enlarged panels show cyst growth over time. (F) Number (left graph) and area (right graph) of kidney cysts in Cdh16Cre::Tfebfs, and Cdh16CreErt2::Tfebfs mice. Number of cysts is shown as an average (± SEM) with bars sub-divided according to the dimension of the cysts. Cyst areas are presented as independent values (dots) with lines representing the means. Three-way (cyst number) and two-way (cyst area) Anova was applied. Cor, cortex; oMed, outer medulla; iMed, inner medulla. (G) Cadherin16 (CDH16) staining of kidneys from P30 mice. (H) Megalin, THP and AQP2 stainings in P90 Cdh16CreErt2::Tfebfs mice. (I) PAS and Sirius Red staining. PAS staining shows the presence of single-layered or multi-layered cysts, and the presence of Clear Cells (CCs). SR staining shows areas of interstitial fibrosis, multi-layered basement membrane and protein casts. Asterisks, protein casts; sCy, simple Cysts; mCy, multilayered Cy; IF, Interstitial Fibrosis; mBM, multi-layered Basement Membrane. (*p<0.05, **p<0.01, ***p<0.001).
Figure 1—figure supplement 1
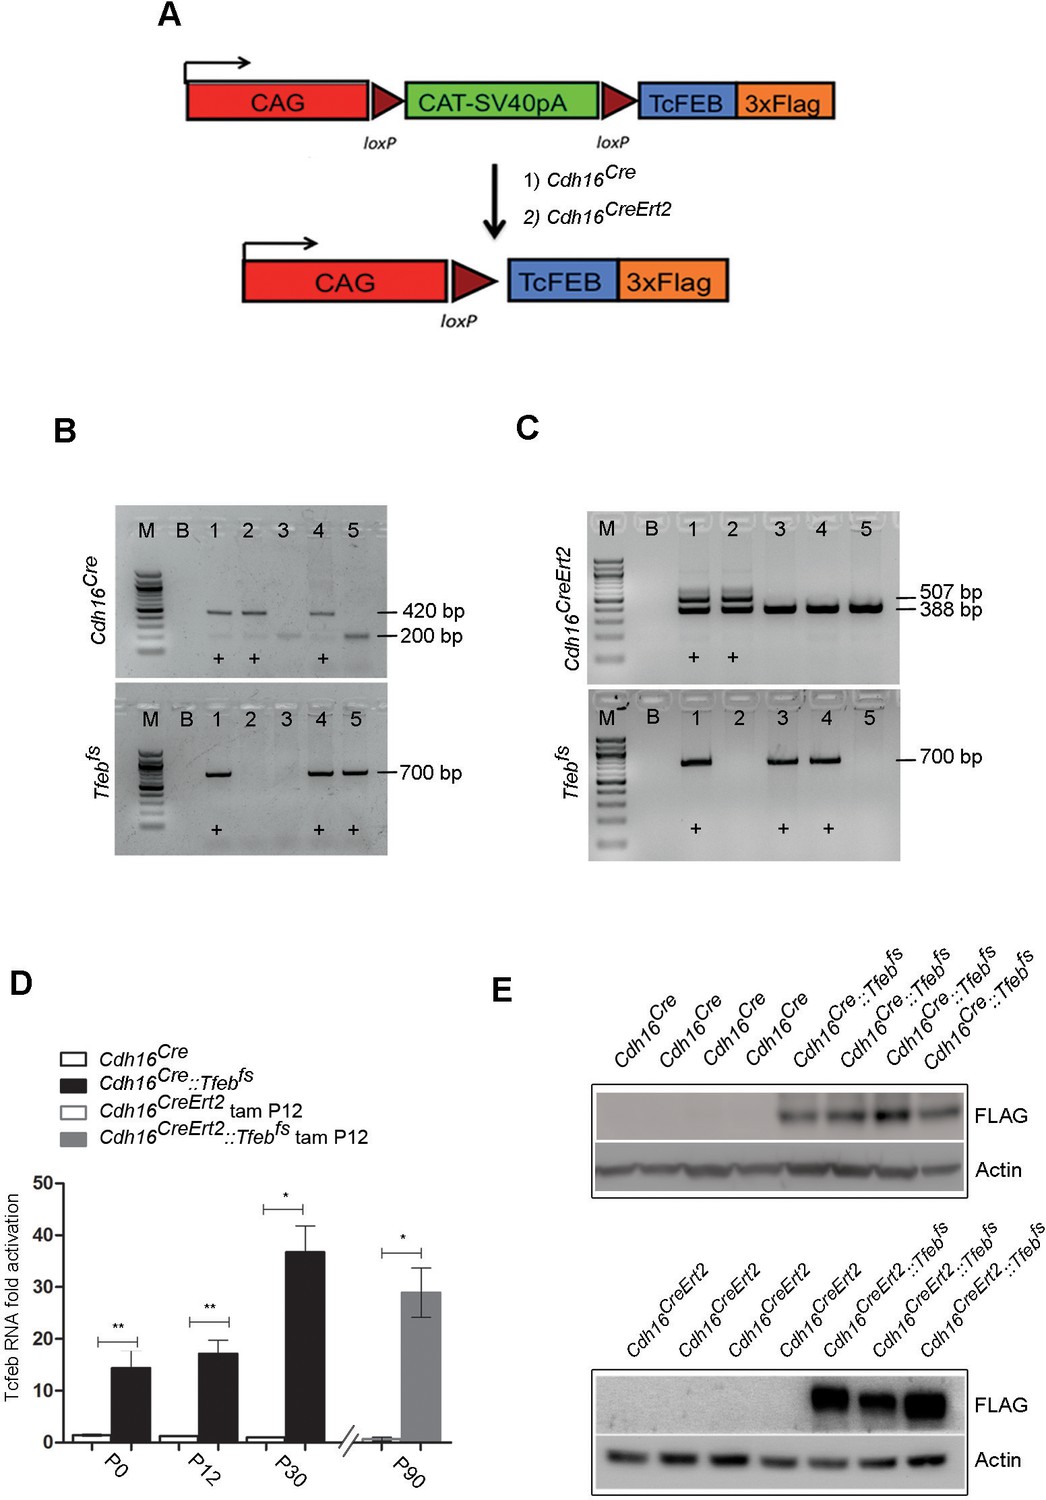
Generation of transgenic mouse lines with kidney-specific Tfeb overexpression.
(A) Map of the transgene: Tfeb-3xFLAG was inserted after the chicken actin promoter (CAG) and the chloramphenicol acetyltransferase (CAT)-SV40pA flanked by loxP sites. The latter can be removed by CRE recombinase, resulting in the overexpression of the Tfeb gene under the control of the strong CAG promoter. Two different CRE lines were used: (1) a constitutive kidney-specific Cdh16Cre (Cadherin 16) and (2) a tamoxifen-inducible Cdh16CreErt2. (B, C) Representative genotypes of littermates. (B) Lanes 1 and 4 indicate double heterozygous Cdh16Cre::Tfebfs mice as they carry both the Cdh16Cre (420 bp CRE band, 200 bp wt band) and the Tfebfs transgenes (700 bp) (M, marker; B, Blank). (C) Lane 1 indicates a double heterozygous Cdh16CreErt2::Tfebfs mouse as it carries both the Cdh16CreErt2 (507 bp Cre band, 388 bp wt band) and the Tfebfs transgenes (700 bp). (D) Real-time PCR analysis of Tfeb-3xFLAG mRNA levels performed on Cdh16Cre and Cdh16Cre::Tfebfs mice at different stages (P0, P12, P30) and on Cdh16CreErt2 and Cdh16CreErt2::Tfebfs mice induced with tamoxifen at P12 and sacrificed at P90. Values are shown as the average (± SEM) of at least three animals per time point and genotype (*p<0. 05, **p<0.01, two-sided, Student’s t test). (E) Immunoblot analysis using an anti-Flag antibody to determine the expression of Tfeb-3xFLAG protein in Cdh16Cre::Tfebfs and tam-treated Cdh16CreErt2::Tfebfs mice. Each replicate is a different biological sample.
Figure 1—figure supplement 2
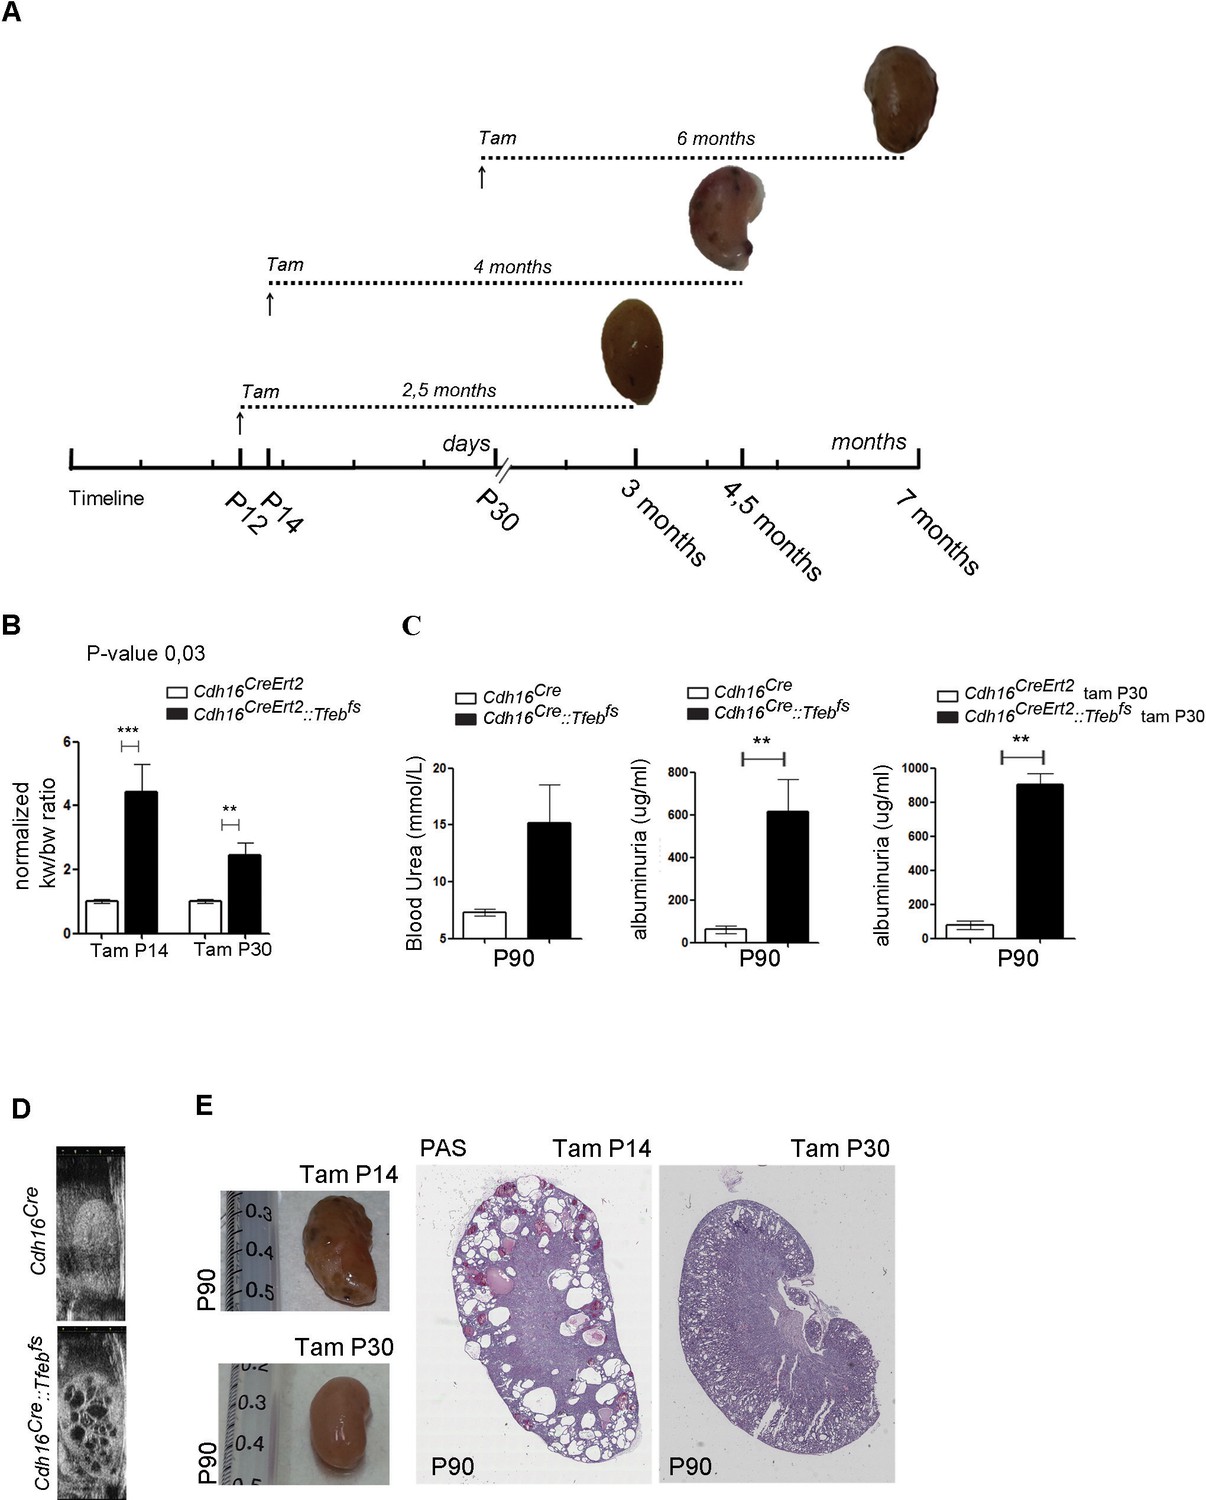
Renal-specific Tfeb overexpression results in kidney enlargement and failure.
(A) Tamoxifen injection of Cdh16CreErt2::Tfebfs mice at P12, P14 and P30 with representative images at the time of sacrifice (tam, tamoxifen). (B) Relative ratio of kidney to body weight (KW/BW) evaluated in tam-treated Cdh16CreErt2::Tfebfs mice at P90. Two-way Anova was applied (factors: treatment, genotype). (C) Blood urea and albuminuria levels in Cdh16Cre::Tfebfs and Cdh16CreErt2::Tfebfs mice. Values are shown as means (± SEM) of at least three Cdh16Cre::Tfebfs and Cdh16CreErt2::Tfebfs mice and are normalized versus the control animals (Cdh16Cre and Cdh16CreErt2). (D) High-frequency ultrasound (HFUS) images of kidneys from P30 Cdh16Cre::Tfebfs mice. (E) Images and PAS staining from tam-treated Cdh16CreErt2::Tfebfs mice at P90.
Figure 1—figure supplement 3
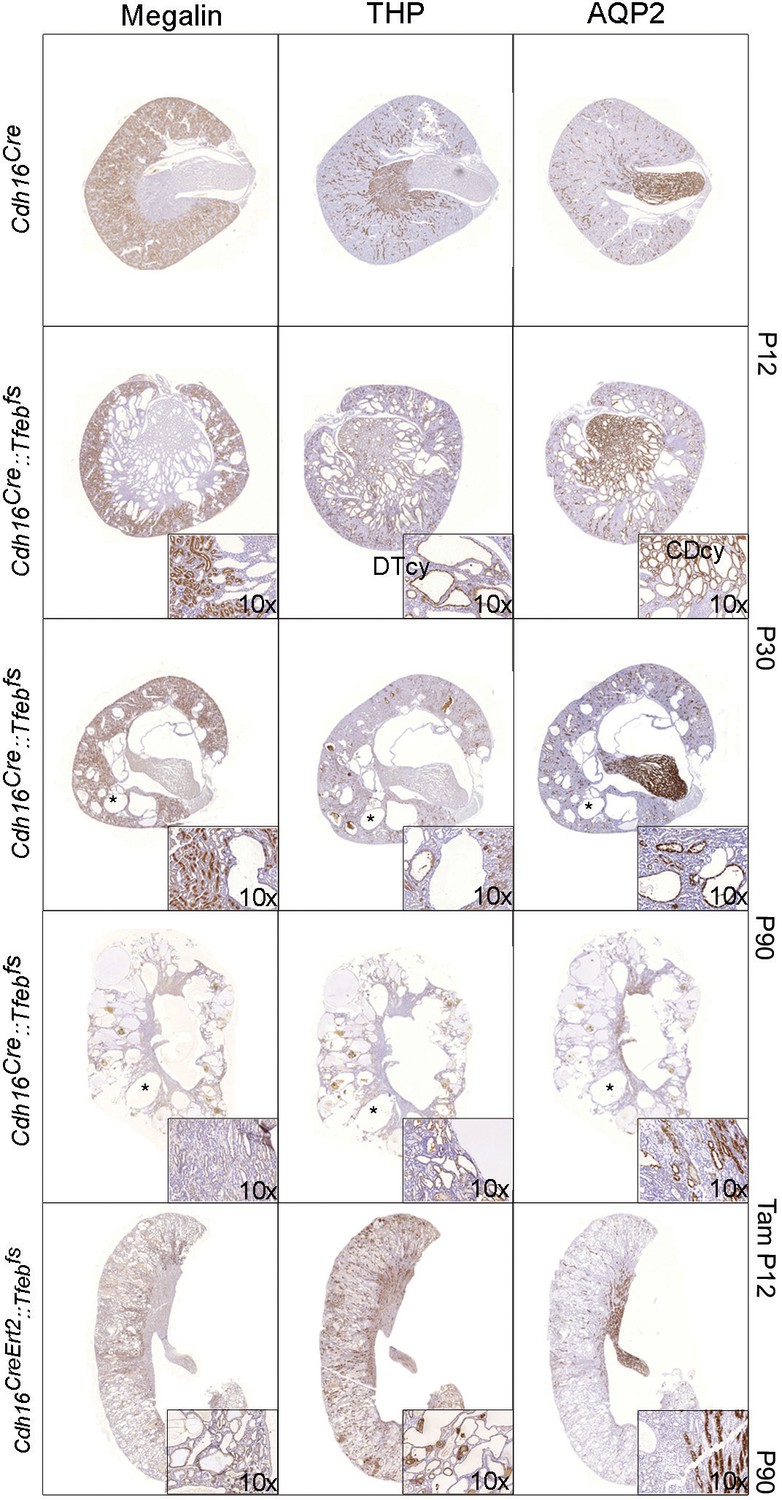
Characterization of cyst origin in Cdh16Cre::Tfebfs and Cdh16CreErt2::Tfebfs mice.
IHC staining of megalin, THP and AQP2 at different time points. Insets are enlargements of representative areas of interest. Larger cysts (denoted by an asterisk) are negative for all the markers tested. DTcy = Distal Tubules cysts; CDcy = Collecting Ducts cysts.
Figure 2
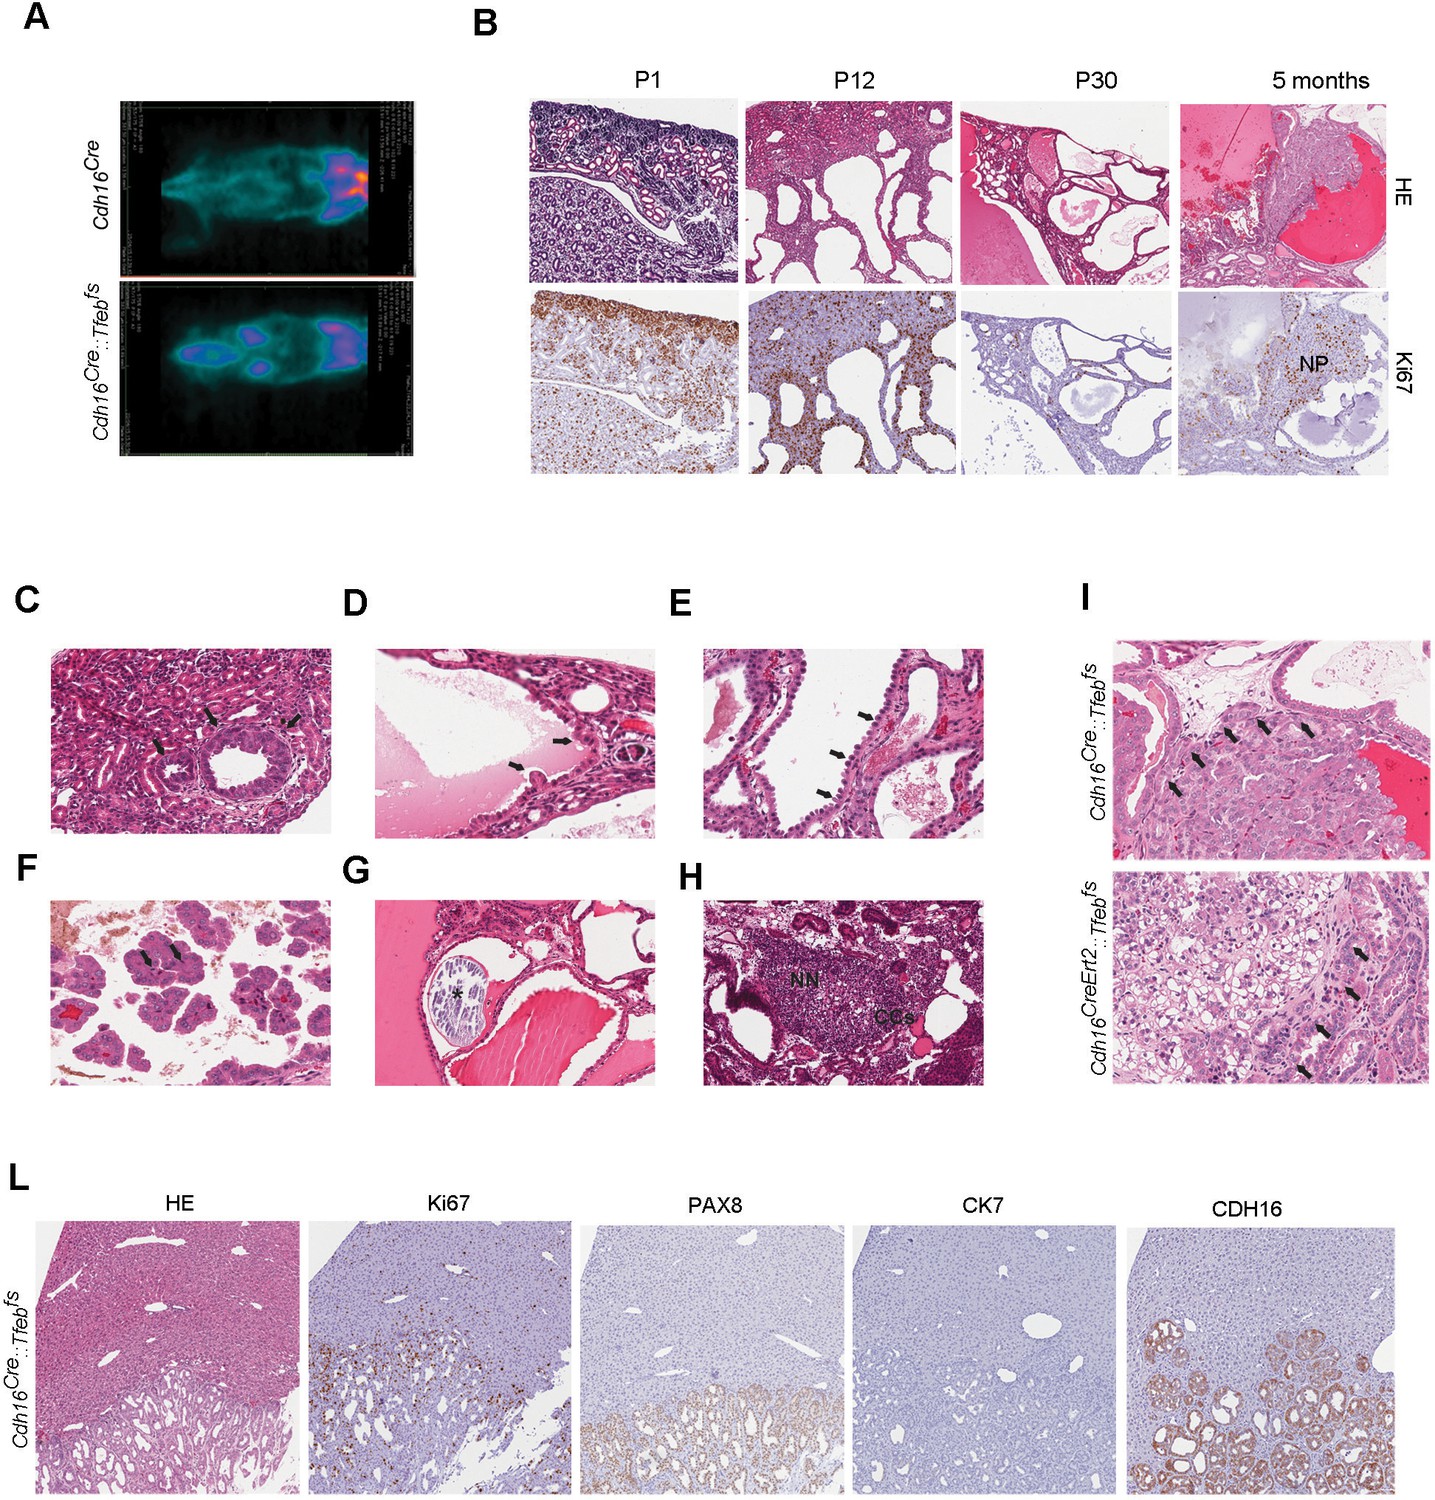
Kidney-specific Tfeb overexpression is associated with cancer development in Cdh16Cre::Tfebfs and Cdh16CreErt2::Tfebfs mice.
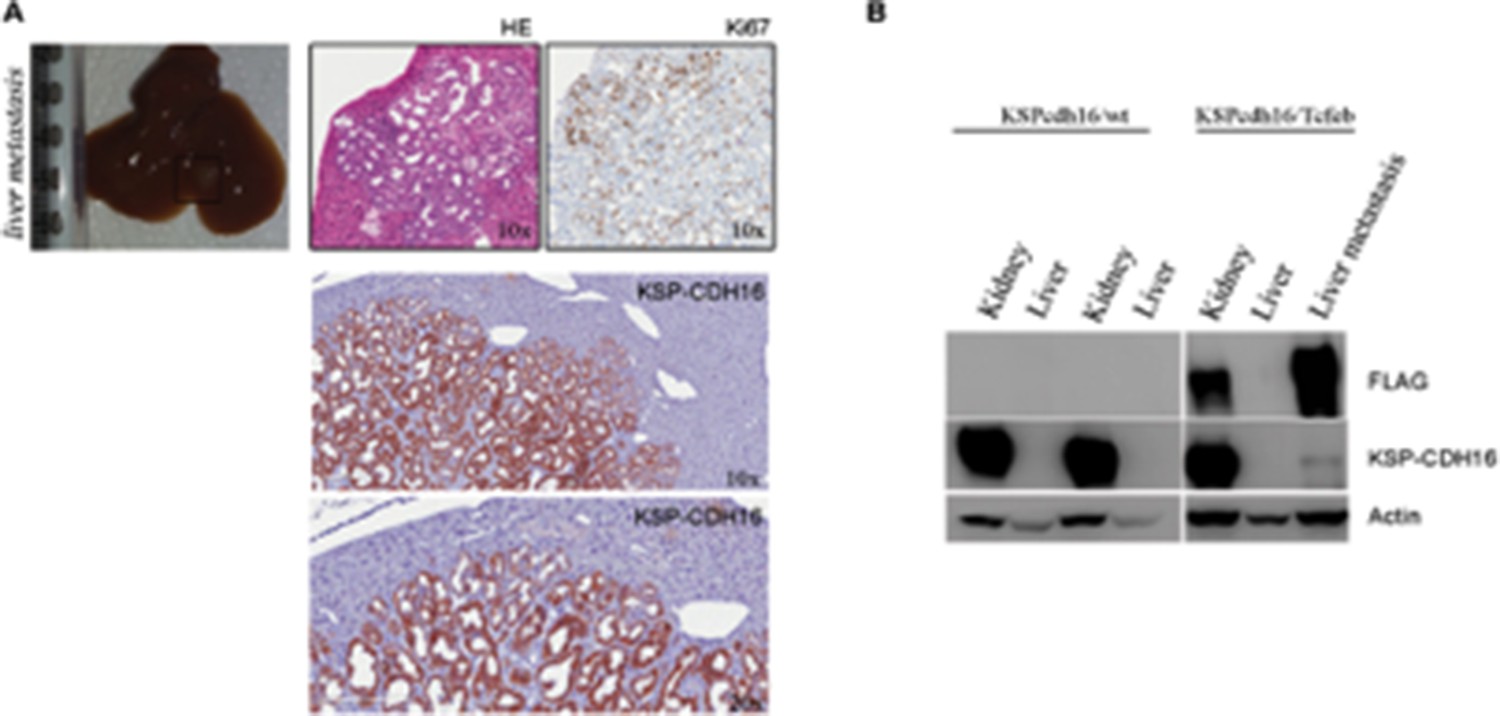
(A) 18F-FDG PET/CT scan on P30 Cdh16Cre::Tfebfs mice. (B) HE and Ki67 staining performed on Cdh16Cre::Tfebfs mice at P1, P12, P30 and 5 months. Beginning at P12 the increase in cyst size is associated with an increase in papillary proliferation that becomes completely neoplastic by 5 months. NP, Neoplastic Papillae. (C–H) Representative images of neoplastic lesions at different stages: (C) neoplastic nodules (arrows) in P12 Cdh16Cre::Tfebfs mice; (D) micropapillae (arrows) and (E) hobnail-like cells (arrows) in P30 Cdh16Cre::Tfebfs mice; (F) mitotic spindles (arrows) in 5-month-old Cdh16Cre::Tfebfs mice; (G) microcalcifications (asterisk) in tam-treated Cdh16CreErt2::Tfebfs mice induced at P14 and sacrificed at 5 months; (H) neoplastic nests (NN) and clear cells (CCs) in tam-treated Cdh16CreErt2::Tfebfs mice induced at P12 and sacrificed at P90. (I) HE staining of neoplastic lesions invading the surrounding stroma (arrows) in Cdh16Cre::Tfebfs and in tam-treated Cdh16CreErt2::Tfebfs mice. (L) Liver metastases in 5 month-old Cdh16Cre::Tfebfs mice stained for HE, Ki67, PAX8 and CK7.
Figure 3 with 2 supplements
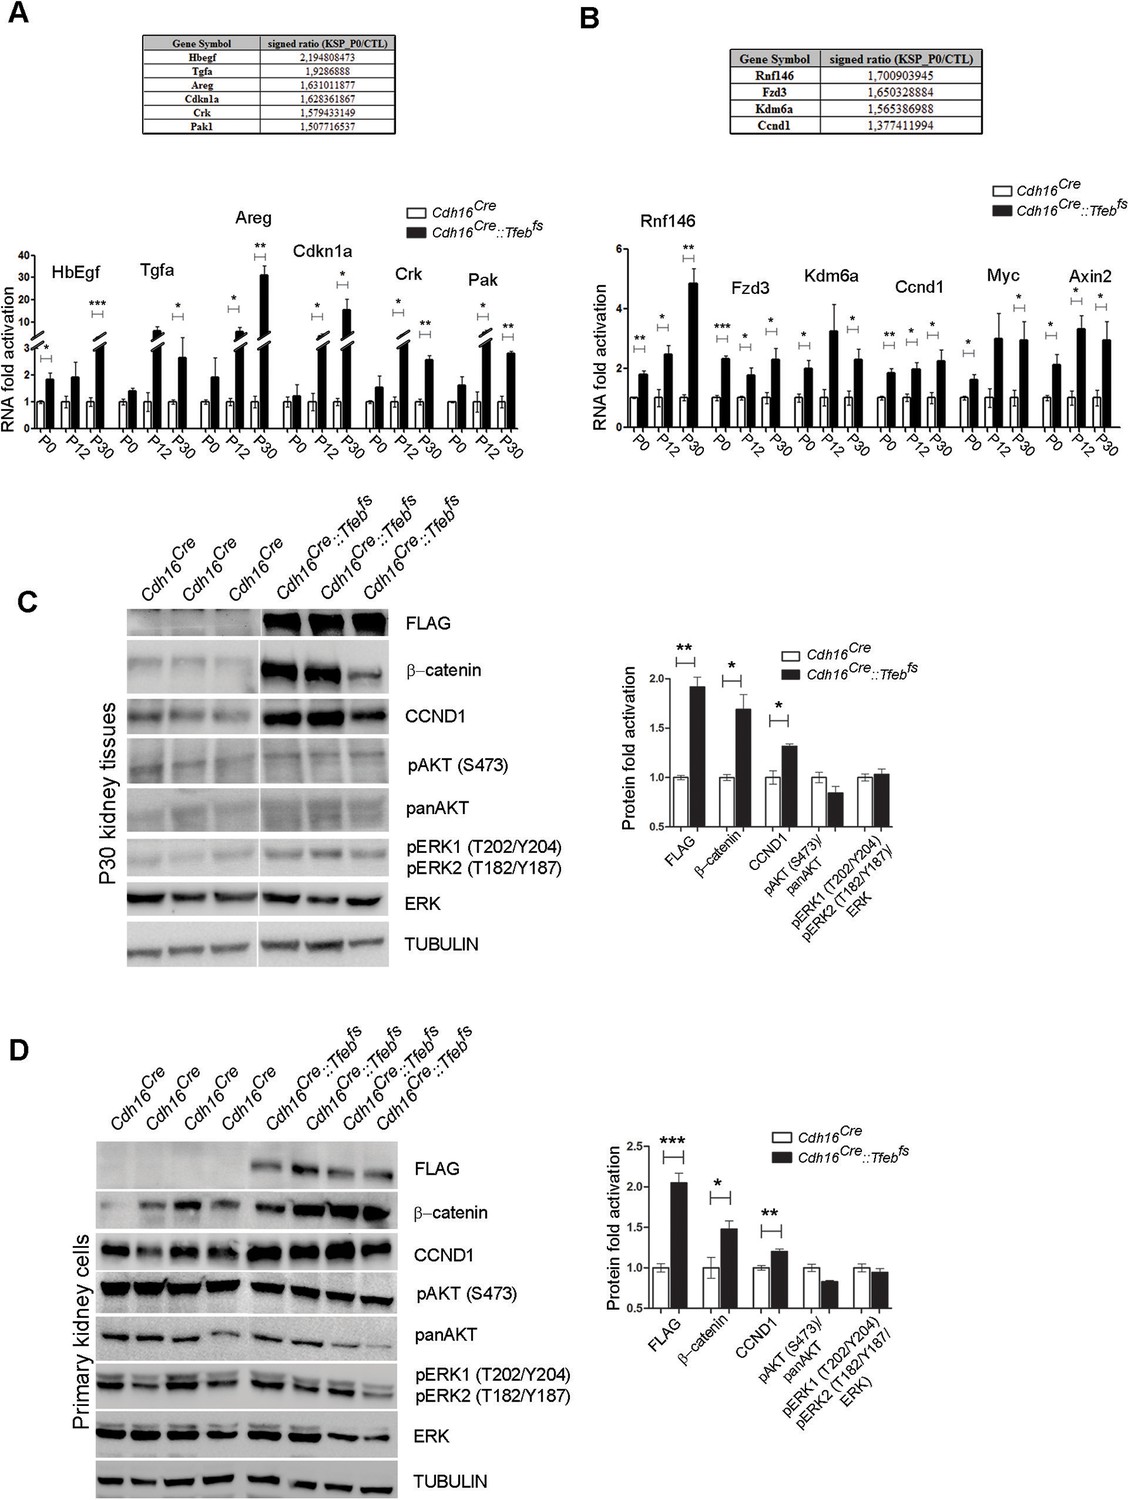
Activation of ErbB and WNT signaling pathways in kidneys from Cdh16Cre::Tfebfs mice.
Transcriptional and biochemical analyses were performed on Cdh16Cre and Cdh16Cre::Tfebfs mice. (A,B) Tables show the relative increase of genes related to the ErbB (A) and WNT (B) pathways in the microarray analyses performed on kidneys from P0 Cdh16Cre::Tfebfs mice. Graphs show real-time PCR validations performed on kidneys from Cdh16Cre::Tfebfs mice at different stages (P0, P12, P30). Data are shown as the average (± SEM) of at least three Cdh16Cre::Tfebfs mice normalized versus wild-type mice. (C,D) Immunoblot analyses performed on (C) P30 kidney tissues and (D) primary kidney cells isolated from Cdh16Cre::Tfebfs mice to evaluate ErbB and WNT activation status. Each replicate is a distinct biological sample. ErbB signaling was assessed by looking at phosphoAKT (Ser473) to total AKT ratio, and phosphoERK1 (T202/Y204)/ERK2(T185/Y187) to total ERK ratio; WNT signaling was assessed by quantifying β-catenin and CCND1 (Cyclin D1) protein levels. Graphs represent the densitometry quantification of Western blot bands. Values are normalized to actin when not specified and are shown as an average (± SEM) (*p<0.05, **p<0.01, ***p<0.001, two-sided, Student’s t test).
-
Figure 3—source data 1
Complete list of 294 genes (represented by 361 probesets) significantly induced (FDR≤0.05) in the KSP_P0 microarray dataset (GSE62977).
The genes are ranked by decreasing signed ratio (KSP_P0/CTL).
- https://doi.org/10.7554/eLife.17047.008
-
Figure 3—source data 2
Complete list of 628 genes (represented by 729 probesets) significantly induced (FDR≤0.05) in the KSP_P14 microarray dataset (GSE63376).
The genes are ranked by decreasing signed ratio (KSP_P14/CTL).
- https://doi.org/10.7554/eLife.17047.009
Figure 3—figure supplement 1

ErbB and WNT transcriptional profiles in Cdh16CreErt2::Tfebfs mice.
Transcriptional analyses performed on Cdh16CreErt2::Tfebfs mice. (A,B) mRNA levels of previously validated genes belonging to the WNT (left graphs) and ErbB (right graphs) signaling pathways assessed in P90 Cdh16CreErt2::Tfebfs mice induced at (A) P14 and at (B) P30 with tamoxifen respectively. Data are shown as the average (± SEM) of at least Cdh16CreErt2::Tfebfs mice and values are normalized to the wild-type line. (*p<0.05, **p<0.01, ***p<0.001, two-sided Student’s t test).
Figure 3—figure supplement 2

Biochemical analysis of ErbB signaling.
Immunoblot analysis performed on P90 kidneys from Cdh16Cre::Tfebfs mice (A) and P90 Cdh16CreErt2::Tfebfs animals induced with tamoxifen at P14 (B) and at P30 (C), respectively. Each replicate is a different biological sample. ErbB was analyzed by quantifying phosphoAKT (Ser473) to total AKT, and phosphoERK1 (T202/Y204)/ERK2(T185/Y187) to total ERK; graphs are the densitometry quantifications of Western blot bands normalized to wild-type line and are shown as an average (± SEM) (*p<0.05, **p<0.01, ***p<0.001, two-sided Student’s t test).
Figure 4 with 1 supplement
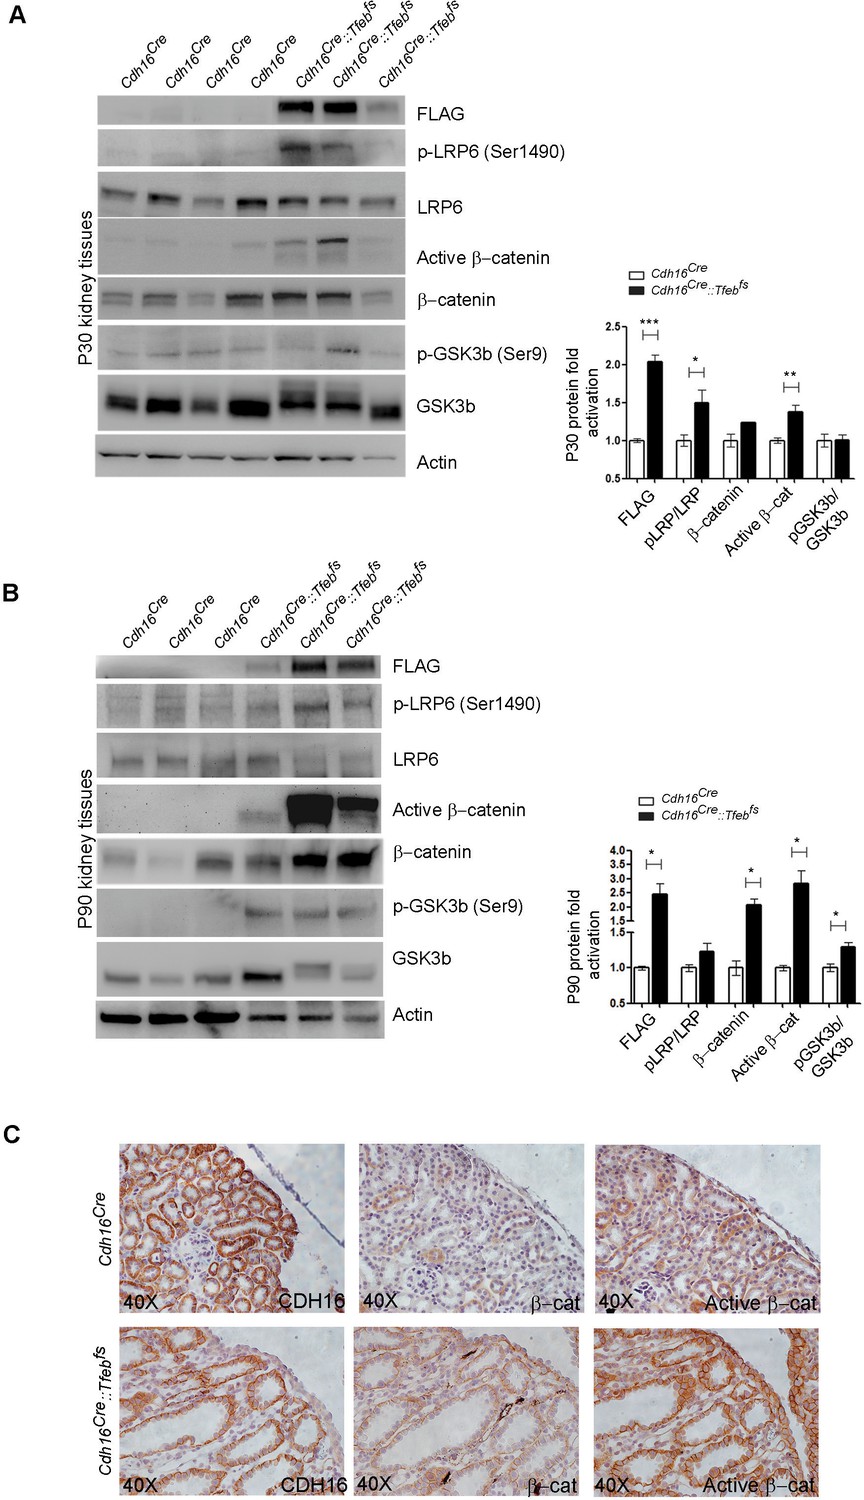
Molecular and histological analysis of WNT signaling.
(A,B) Western blot analysis performed on (A) P30 and (B) P90 kidneys from Cdh16Cre::Tfebfs mice to assess WNT signaling activation by looking at different proteins related to this pathway. Each replicate is a distinct biological sample. p-LRP6 (Ser1490)/LRP6, active β-catenin, β-catenin and p-GSK3β (Ser9)/GSK3β protein levels were quantified by densitometry analysis of the Western blot bands. Values are normalized to actin when not specified, and are shown as an average (± SEM) (*p<0.05, **p<0.01, ***p<0.001, two-sided Student’s t test). (C) Immunohistochemistry staining of CDH16, β-catenin and active β-catenin proteins performed on P30 kidney tissues from Cdh16Cre::Tfebfs mice.
Figure 4—figure supplement 1

Molecular analysis of WNT signaling pathway in Cdh16CreErt2::Tfebfs animals.
(A,B) Immunoblot analysis of WNT-related proteins performed on P90 Cdh16CreErt2::Tfebfs animals induced with tamoxifen at P14 (A) and at P30 (B). Each replicate is a different biological sample. Graphs show densitometry analysis of the Western blot bands. Values are normalized to actin when not specified, and are shown as an average (± SEM) (*p<0.05, **p<0.01, ***p<0.001, two-sided Student’s t test).
Figure 5
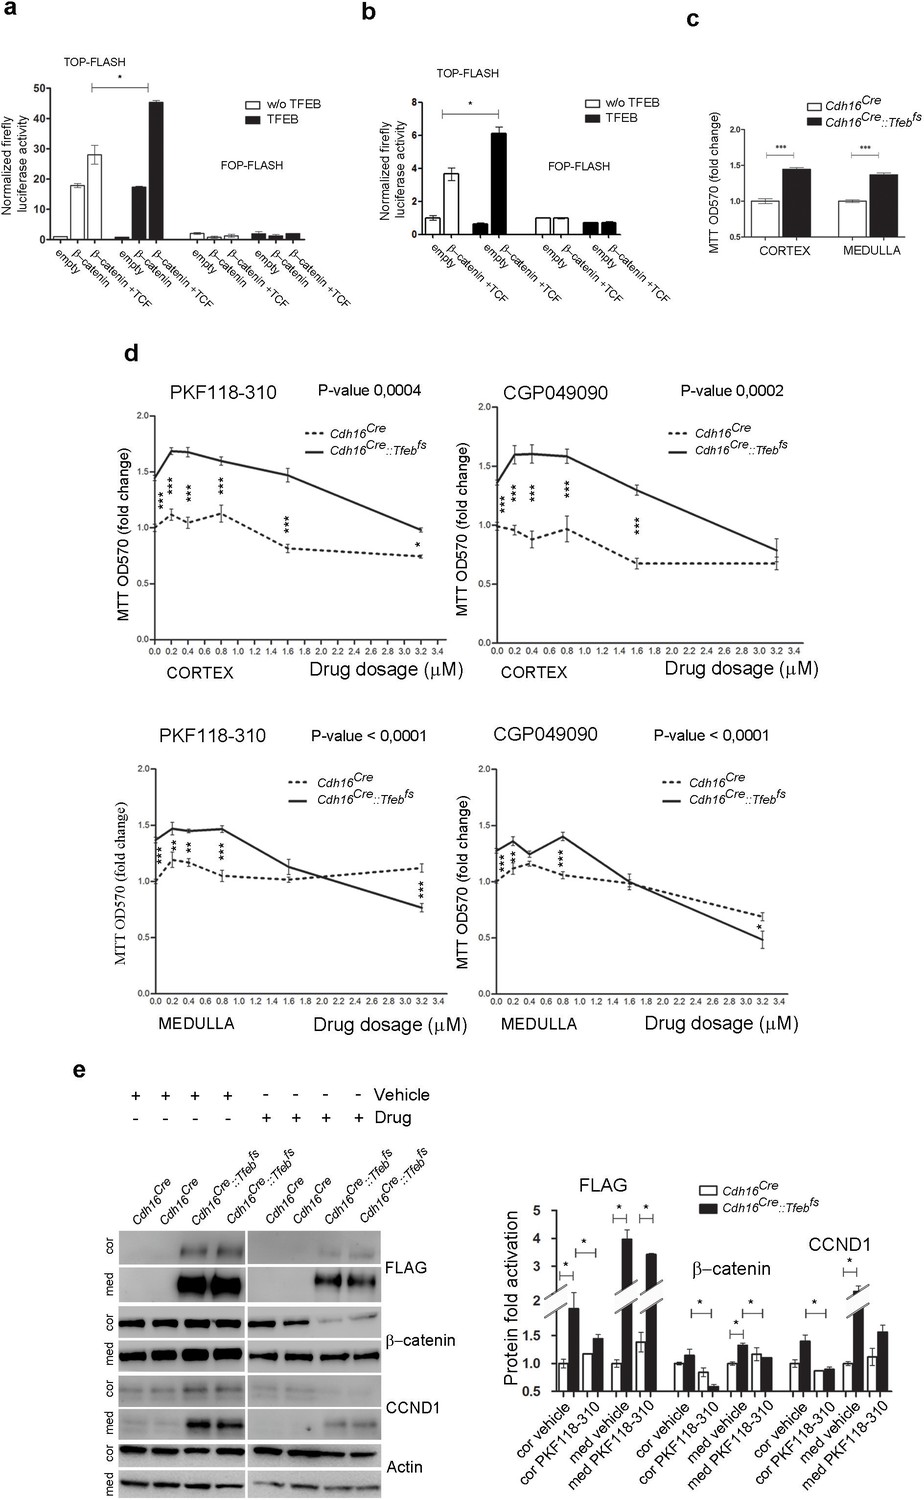
Inhibition of WNT signaling rescues the hyper-proliferative phenotype of kidney cells from Cdh16/Tfeb mice.
(A,B) Activity of the TCF/LEF reporter TOP-FLASH. Luciferase activity after co-transfection of β-catenin and TCF plasmids in HEK293 (A) and HK2 (B) cells with and without Tfeb overexpression. Values are shown as an average (± SEM) of each point in duplicate, normalized to the Renilla values and to the basal condition. Data are representative of three independent experiments. (C) MTT tetrazolium reduction assay (MTT) was used to evaluate proliferation of primary kidney cells derived from Cdh16Cre::Tfebfs mice. Values are shown as an average (± SEM) of each point in triplicate and normalized versus wild-type mice. Data are representative of three independent experiments. (D) MTT proliferation assays of primary kidney cells treated independently with two WNT signaling inhibitors, PKF118-310 and CGP049090, added at different dosages for 24 hr. 0 µm represents the basal proliferation of cells. Values are shown as means (± SEM) of three replicates per point normalized to the vehicle (DMSO), added at the same concentration, and versus the Cdh16Cre cells without drug treatment. Results are representative of three independent experiments. Two-way Anova was applied (factors: cell genotype, treatment). (E) Immunoblot analysis on primary kidney cells treated with Drug (PKF118-310) or Vehicle (DMSO) for 24 hr at 1.6 µM. Graphs show the densitometry quantifications of Western blot bands. Values are normalized to actin and are shown as averages (± SEM) (Cor, cortex; Med, medulla). (*p<0.05, **p<0.01, ***p<0.001).
Figure 6 with 3 supplements
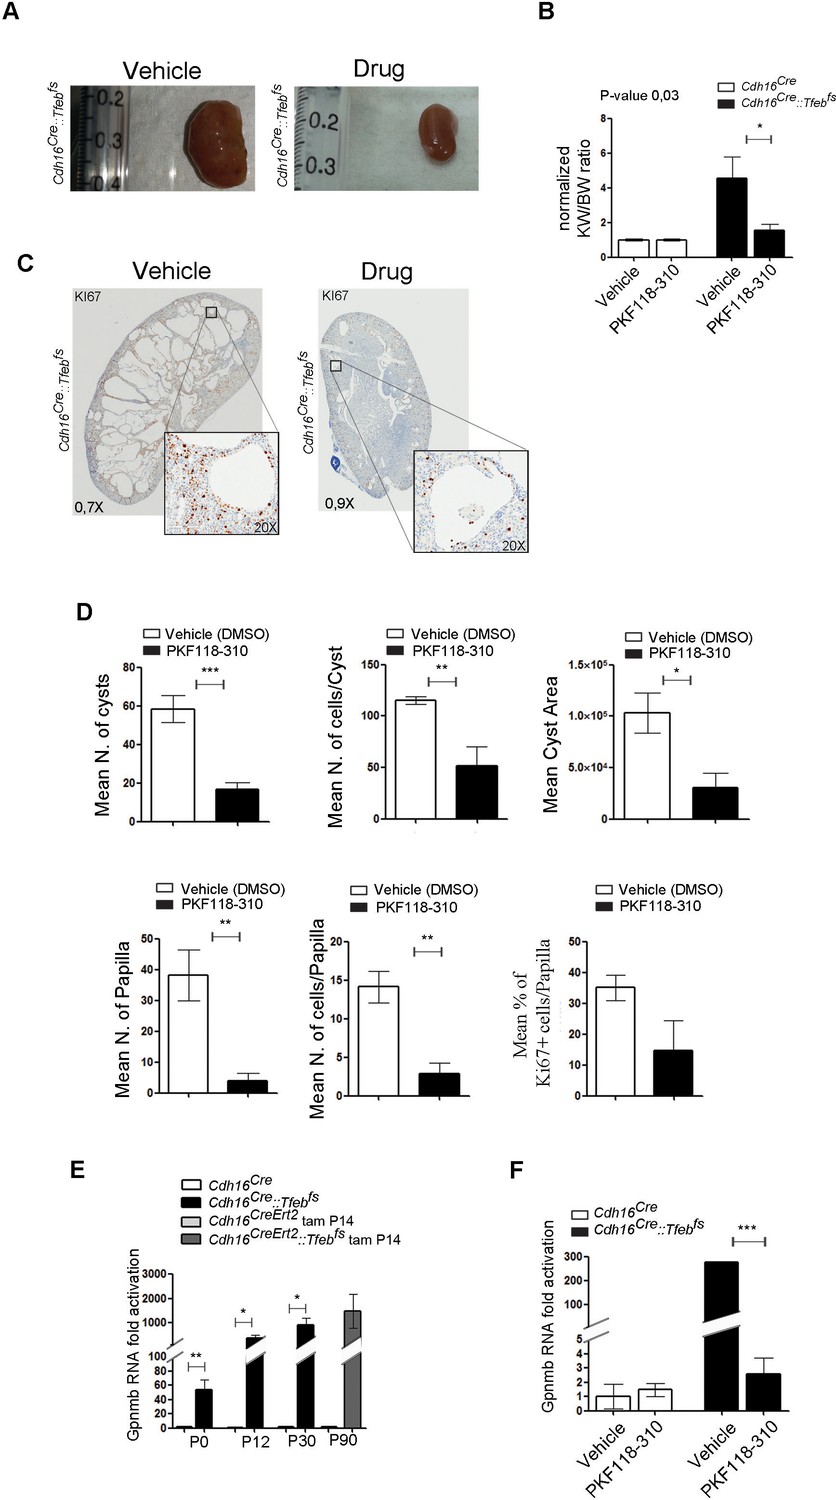
Treatment with WNT inhibitor attenuates cystic and neoplastic phenotypes.
Morphological, histological and biochemical analyses performed on Cdh16Cre::Tfebfs mice treated with Vehicle (DMSO) or Drug (PKF118-310). (A,B) Kidney images (A) and sizes (KW/BW) (B) from Cdh16Cre::Tfebfs mice injected intraperitoneally (IP) either with vehicle or drug at 0.85 mg/kg. KW/BW ratios are shown as means (± SEM) and values are normalized to the Cdh16Cre animals treated with vehicle. Two-way ANOVA was applied (factors: treatment, genotype). (C) Ki67 staining of kidneys from Cdh16Cre::Tfebfs mice after treatment with vehicle or drug. Insets are enlargements of a single cyst. (D) Quantification of several parameters related to cysts and papillae performed on kidney sections from vehicle- and PKF118-310-treated Cdh16Cre::Tfebfs mice. (E) Gpnmb mRNA fold activation in kidneys from Cdh16Cre::Tfebfs and tam-treated Cdh16CreErt2::Tfebfs mice at different stages. Values are shown as means (± SEM) of at least three mice and each group is normalized to the proper control (respectively Cdh16Cre and tam-treated Cdh16CreErt2). (F) Gpnmb fold activation in kidneys from Cdh16Cre::Tfebfs mice treated with vehicle or PKF118-310. Values are shown as means (± SEM) of at least three animals per group and are all normalized versus the Cdh16Cre mice treated with vehicle. (*p<0.05, **p<0.01, ***p<0.001, two-sided Student’s t test).
-
Figure 6—source data 1
Numerical data of each parameter showed in Figure 6D and divided per genotype and treatment.
- https://doi.org/10.7554/eLife.17047.018
Figure 6—figure supplement 1
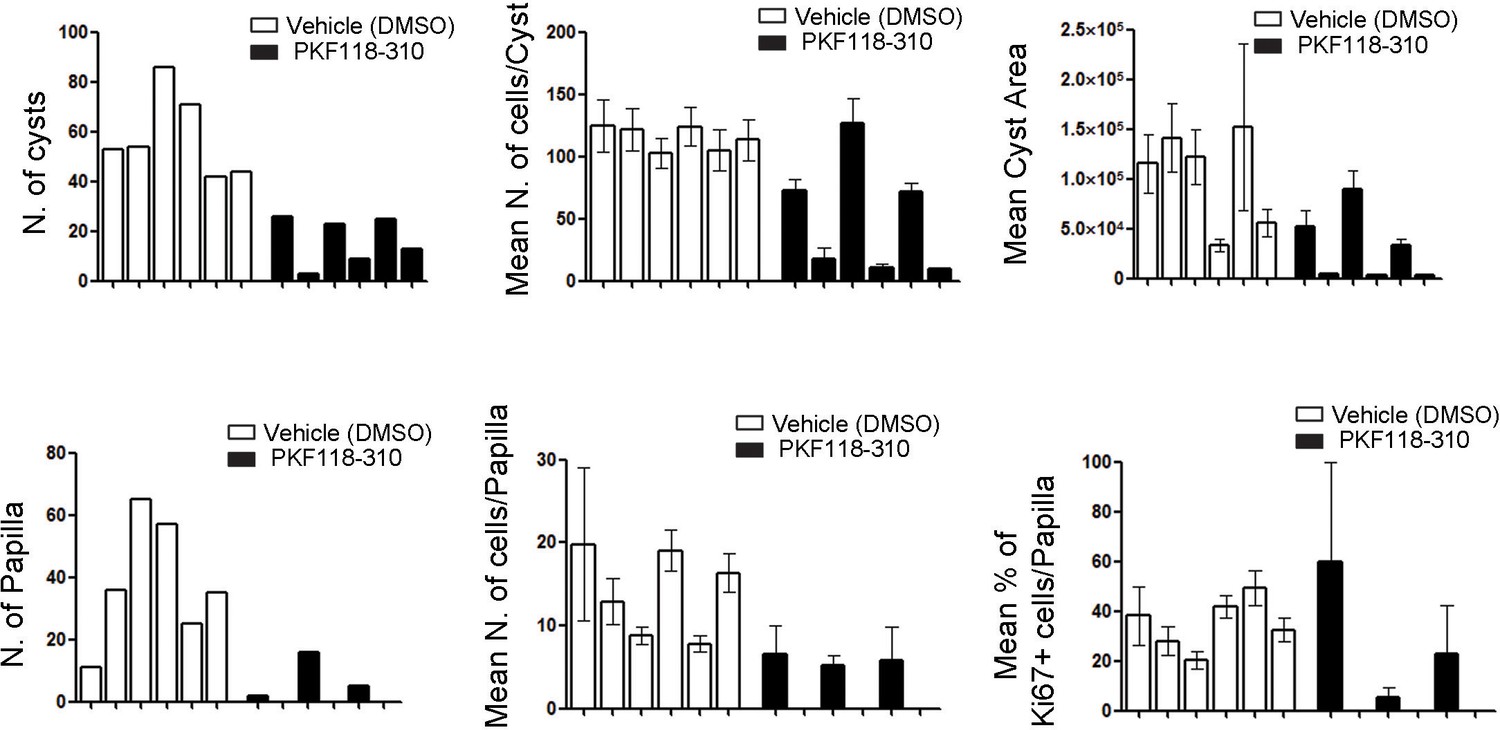
In vivo treatment of Cdh16Cre::Tfebfs mice with the WNT inhibitor PKF118-310 partially rescues cystic and neoplastic phenotypes.
Measurements of different parameters related to the cystic and papillary phenotype on six animals treated with vehicle (DMSO) and six animals treated with drug (PKF118-310). Values are shown as means (± SEM) when appropriate and are represented separately for each animal.
Figure 6—figure supplement 2
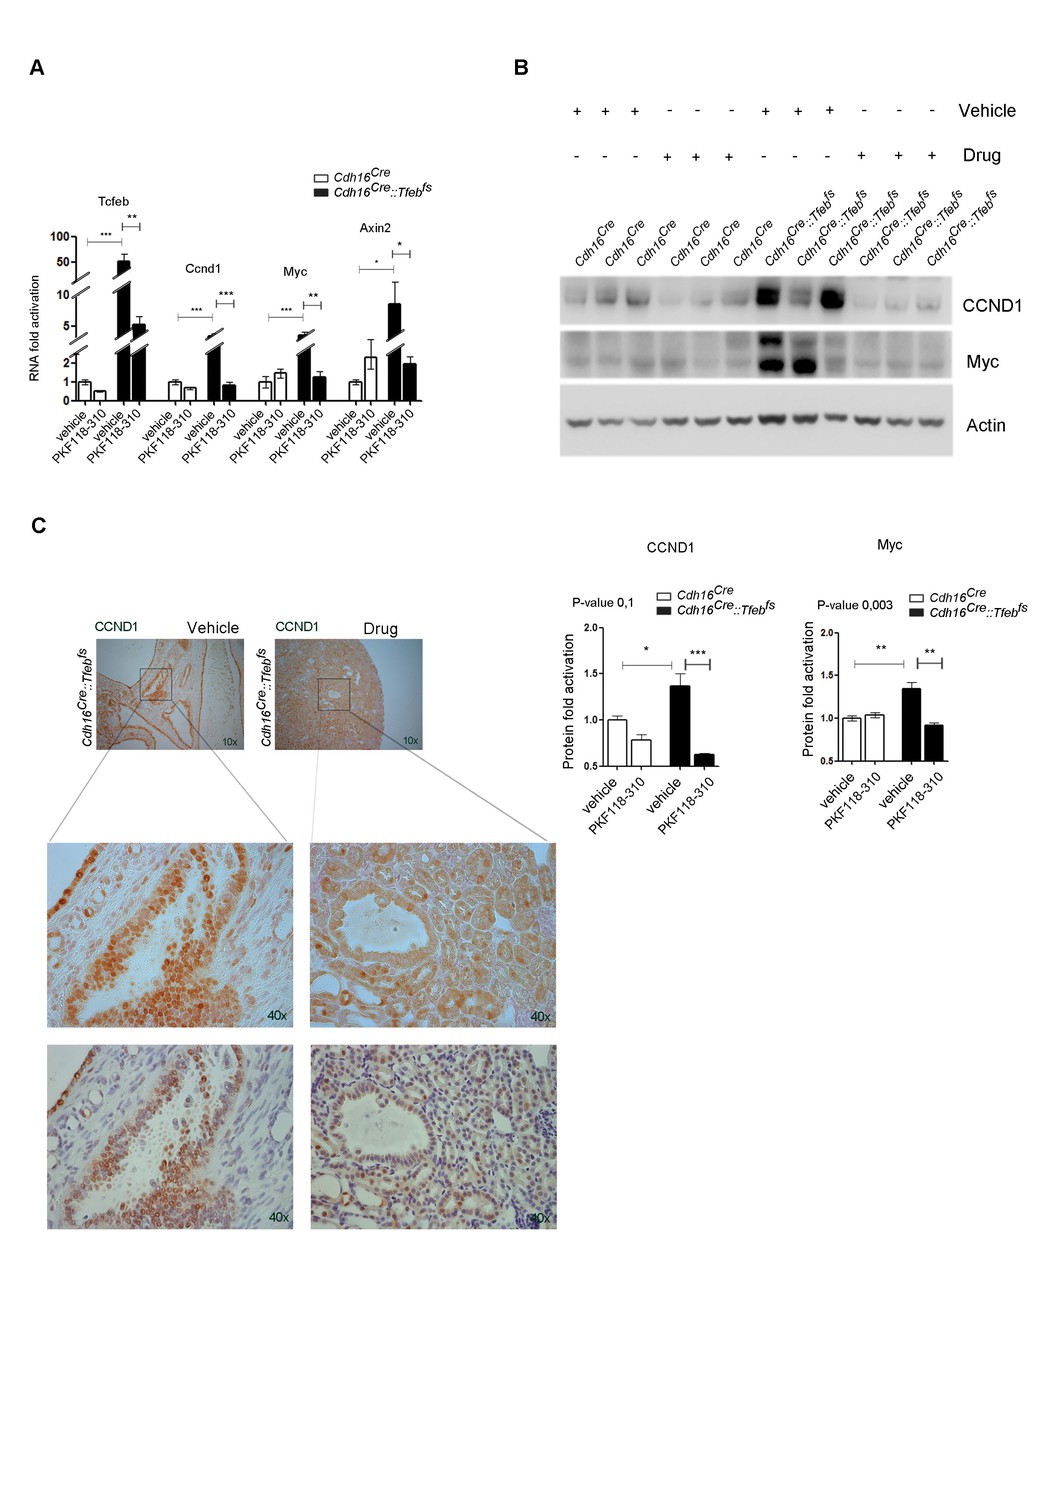
In vivo treatment of Cdh16Cre::Tfebfs mice with the PKF118-310 drug inhibits WNT pathway overactivation.
(A) Tfeb, Cyclin D1, Myc and Axin2 mRNA levels in kidneys from Cdh16Cre and Cdh16Cre::Tfebfs mice treated with vehicle or PKF118-310. Values are shown as the average (± SEM) of four animals per group, and are all normalized to the Cdh16Cre mice treated with vehicle. (B) Biochemical analysis performed on Cdh16Cre and Cdh16Cre::Tfebfs mice treated with vehicle or PKF118-310. Each replicate is a distinct biological sample. Cyclin D1 and MYC protein levels were quantified by densitometry analysis of Western blot bands. Values are normalized to actin when not specified, and are shown as an average (± SEM) of at least three animals per time-point and genotype. Two-way ANOVA was applied (factors: cell genotype, treatment) (*p<0.05, **p<0.01, ***p<0.001). (C) Cyclin D1 staining performed on drug- and vehicle- treated Cdh16Cre::Tfebfs mice before and after the hematoxylin counterstaining.
Figure 6—figure supplement 3
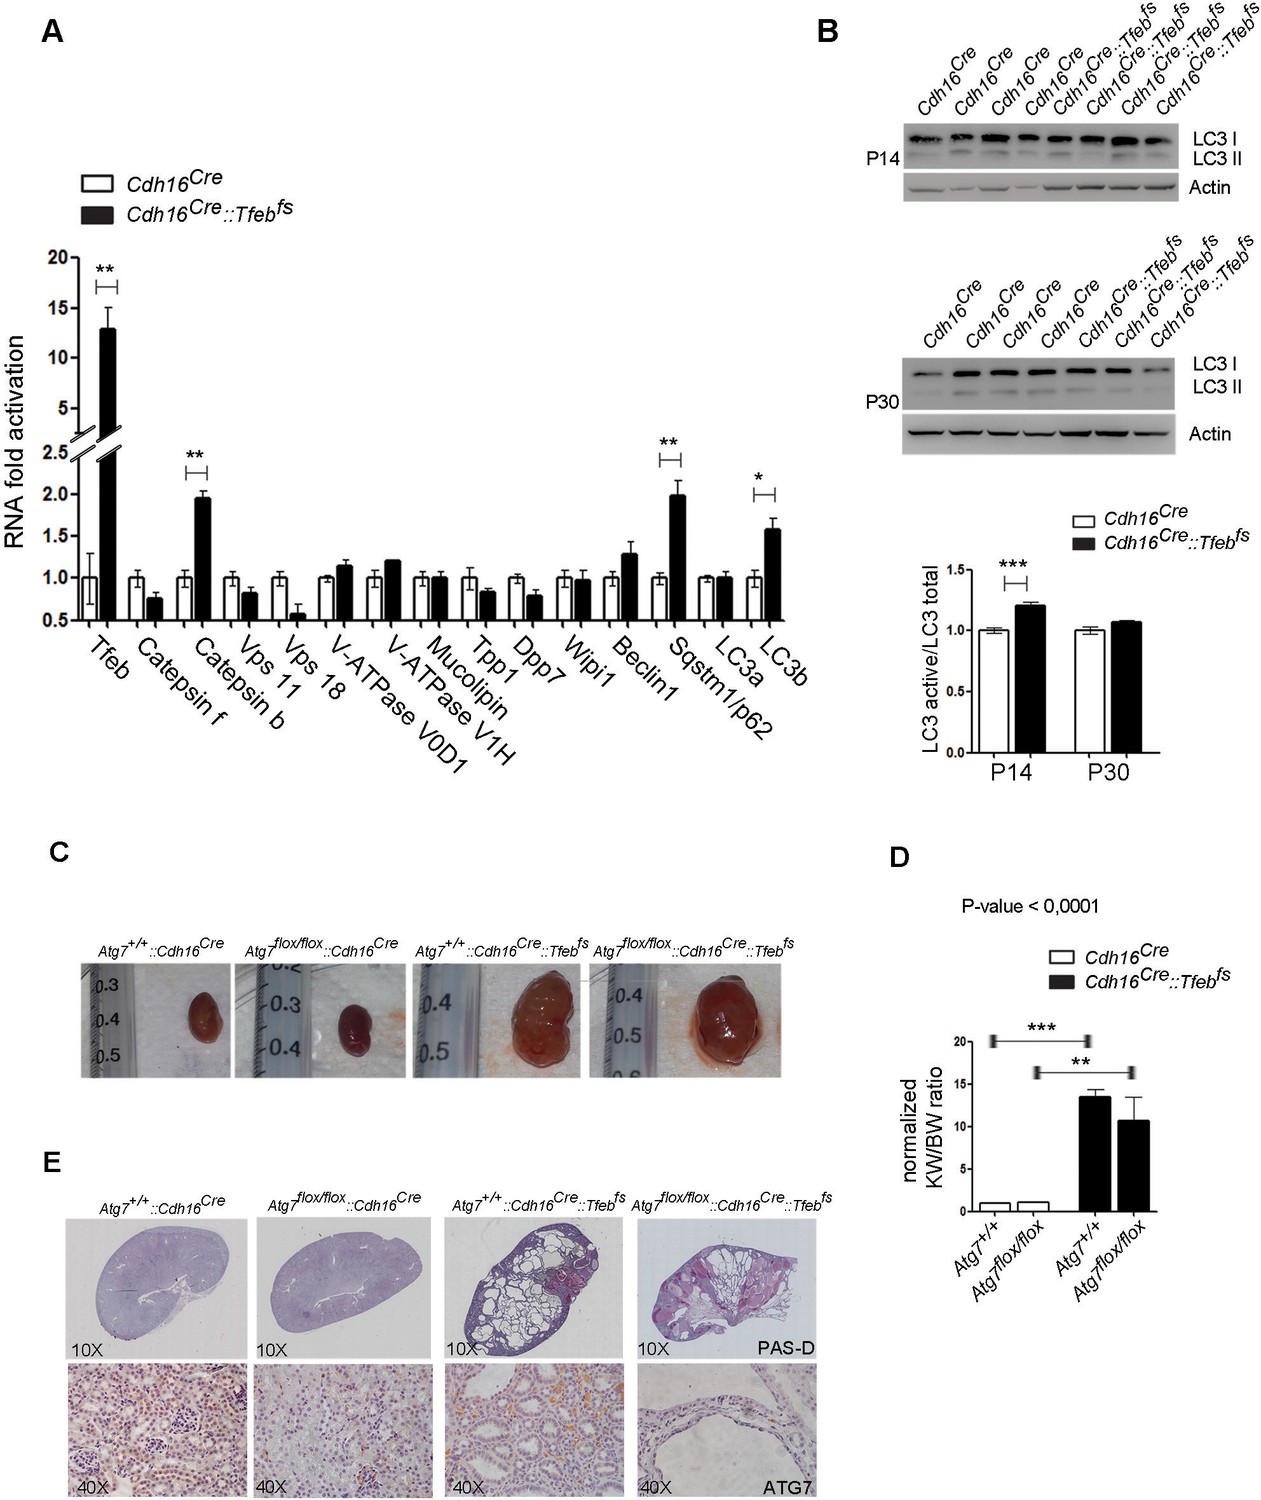
Inhibition of autophagy in Tfeb overexpressing mice (Atg7flox/flox::Cdh16Cre::Tfebfs) does not affect the cystic phenotype.
(A) Real-time PCR validation of well-known TFEB direct gene targets whose function is related to the lysosomal and autophagic pathways performed on P30 Cdh16Cre::Tfebfs mice. Values are shown as the average (± SEM) of at least three Cdh16Cre::Tfebfs mice and are normalized to wild-type mice (*p<0.05, **p<0.01, ***p<0.001, two-sided Student’s t test). (B) P14 and P30 kidney lysates from Cdh16Cre::Tfebfs animals were evaluated by LC3I/II immunoblot. LC3 active / LC3 total ratios were quantified via densitometry of the Western blot bands (graph). Each replicate is a different biological sample. Values are shown as the average (± SEM) of at least three Cdh16Cre::Tfebfs mice and are normalized to wild-type lines. (*p<0.05, **p<0.01, ***p<0.001, two-sided, Student’s t test). (C) Renal images of (Atg7flox/flox::Cdh16Cre::Tfebfs) double transgenic mice and controls at P30. (D) Kidney-to-body weight ratio (KW/BW) from the different genotypes obtained. Values are normalized to the Atg7flox/flox::Cdh16Cre line and are shown as the average (± SEM) of at least three mice per genotype. One-way Anova was applied (factors: genotype) (*p<0.05, **p<0.01, ***p<0.001). (E) PAS and ATG7 staining of kidneys from the different mouse lines.
Author response image 1
Tables
Table 1
ErbB-related genes up-regulated in the microarray analyses. (A) List of six genes with a known role in ErbB signaling pathway which are significantly up-regulated (FDR≤0.05) following TFEB overexpression in KSP_P0 microarray dataset (GSE62977). (B) One gene with a known role in ErbB signaling pathway which are significantly up-regulated (FDR≤0.05) following TFEB overexpression in KSP_P14 microarray dataset (GSE62977).
| A | |||
|---|---|---|---|
| Probe set ID | Gene symbol | Gene title | signed_ratio (KSP_P0/CTL) |
1418350_at | Hbegf | heparin-binding EGF-like growth factor | 2,194808473 |
1421943_at | Tgfa | transforming growth factor alpha | 1,9286888 |
1421134_at | Areg | amphiregulin | 1,631011877 |
1424638_at | Cdkn1a | cyclin-dependent kinase inhibitor 1A (P21) | 1,628361867 |
1425855_a_at | Crk | v-crk sarcoma virus CT10 oncogene homolog (avian) | 1,579433149 |
1450070_s_at | Pak1 | p21 protein (Cdc42/Rac)-activated kinase 1 | 1,507716537 |
| B | |||
|---|---|---|---|
| Probe set ID | Gene symbol | Gene title | signed_ratio (KSP_P14/CTL) |
1421134_at | Areg | amphiregulin | 1,221605795 |
Table 2
WNT-related genes up-regulated in the microarray analyses. (A) List of four genes with a known role in WNT signaling pathway which are significantly up-regulated (FDR≤0.05) following TFEB overexpression in KSP_P0 microarray dataset (GSE62977). (B) List of 10 genes with a known role in WNT signaling pathway which are significantly up-regulated (FDR≤0.05) following TFEB overexpression in KSP_P14 microarray dataset (GSE63376).
| A | |
|---|---|
Gene symbol | signed ratio (KSP_P0/CTL) |
Rnf146 | 1,700903945 |
Fzd3 | 1,650328884 |
Kdm6a | 1,565386988 |
Ccnd1 | 1,377411994 |
| B | |
|---|---|
Gene symbol | signed ratio (KSP_P14/CTL) |
Rhou | 1,639718601 |
Plcg2 | 1,601227563 |
Gata3 | 1,358534898 |
Fbxw2 | 1,262750602 |
Mark2 | 1,248332335 |
Axin1 | 1,21985179 |
Tab1 | 1,217280695 |
Psmb3 | 1,211737817 |
Ndrg2 | 1,193338279 |
Chd8 | 1,185904267 |
Table 3
GPNMB expression profiles and CLEAR sites. (A) Differentially expression of Gpnmb transcript in KSP_P0 (GSE62977), in KSP_P14 microarray dataset (GSE63376) and in RCC dataset. (B) Sequence analysis of the CLEAR sites (i.e. the consensus TFEB binding sites) in the human and murine promoter region of Gpnmb.
| A | |||||||
|---|---|---|---|---|---|---|---|
Probe set ID | Gene symbol | Gene title | Representative public ID | Ensembl | ratio (KSP_P0/CTL) | ratio (KSP_P14/CTL) | ratio (RCC/CTL) |
1448303_at | Gpnmb | glycoprotein (transmembrane) nmb | NM_053110 | ENSMUSG00000029816 | 10,61358979 | 4,926015853 | 141,4101213 |
| B | |||||||
|---|---|---|---|---|---|---|---|
Gene | Score | Sequence | Chrom | ABS start | ABS end | TSS_position | |
Gpnmb | 0,8731563 | GGGGCAAGTGACTC | chr6 | 49036518 | 49036531 | 1 | |
Gpnmb | 0,803943 | ACATCACATGATCT | chr6 | 49036587 | 49036600 | 70 | |
GPNMB | 0,8484716 | CCATCACATGATCC | chr7 | 23286328 | 23286341 | 13 | |
Table 4
List of 11 genes shared between the KSP_P0 dataset and from an HeLa TFEB-overexpressing ChIP-Seq dataset.
| Gene symbol | signed_ratio (KSP_P0/CTL) | chromosome | start | stop | peak tags | distance from 5' end of gene | RefSeq ID | symbol | ID | ABS distance |
|---|---|---|---|---|---|---|---|---|---|---|
Elf3 | 1,881188134 | chr1 | 2E+08 | 201978977 | 8 | -712 | NM_001114309 | ELF3 | ETS-related transcription factor Elf-3 | 712 |
Gna13 | 1,504591673 | chr17 | 6E+07 | 63053379 | 8 | -58 | NM_006572 | GNA13 | guanine nucleotide-binding protein subunit | 58 |
Ankrd12 | 1,599217835 | chr18 | 9E+06 | 9137025 | 15 | 0 | NM_015208 | ANKRD12 | ankyrin repeat domain 12 isoform 1 | 0 |
Atp6v1c1 | 1,658752808 | chr8 | 1E+08 | 104033525 | 15 | 0 | NM_001695 | ATP6V1C1 | V-type proton ATPase subunit C 1 | 0 |
Bhlhe40 | 2,03490115 | chr3 | 5E+06 | 5021164 | 10 | 0 | NM_003670 | BHLHE40 | class E basic helix-loop-helix protein 40 | 0 |
Gpnmb | 10,61358979 | chr7 | 2E+07 | 23286524 | 9 | 0 | NM_002510 | GPNMB | transmembrane glycoprotein NMB isoform b | 0 |
Kdm6a | 1,58385317 | chrX | 4E+07 | 44732628 | 33 | 0 | NM_021140 | KDM6A | lysine-specific demethylase 6A | 0 |
Lats2 | 1,761917857 | chr13 | 2E+07 | 21636098 | 22 | 0 | NM_014572 | LATS2 | serine/threonine-protein kinase LATS2 | 0 |
Ppargc1a | 2,713649997 | chr4 | 2E+07 | 23891989 | 11 | 0 | NM_013261 | PPARGC1A | peroxisome proliferator-activated receptor gamma | 0 |
Rnf146 | 1,700903945 | chr6 | 1E+08 | 127588198 | 14 | 0 | NM_030963 | RNF146 | ring finger protein 146 | 0 |
Usp2 | 2,284889961 | chr11 | 1E+08 | 119252760 | 8 | 0 | NM_004205 | USP2 | ubiquitin specific peptidase 2 isoform a | 0 |
Download links
A two-part list of links to download the article, or parts of the article, in various formats.
Downloads (link to download the article as PDF)
Open citations (links to open the citations from this article in various online reference manager services)
Cite this article (links to download the citations from this article in formats compatible with various reference manager tools)
Modelling TFE renal cell carcinoma in mice reveals a critical role of WNT signaling
eLife 5:e17047.
https://doi.org/10.7554/eLife.17047


