Crystal structure of an HIV assembly and maturation switch
- University of Virginia, United States
- University of Virginia Health System, United States
Figures
Figure 1 with 3 supplements
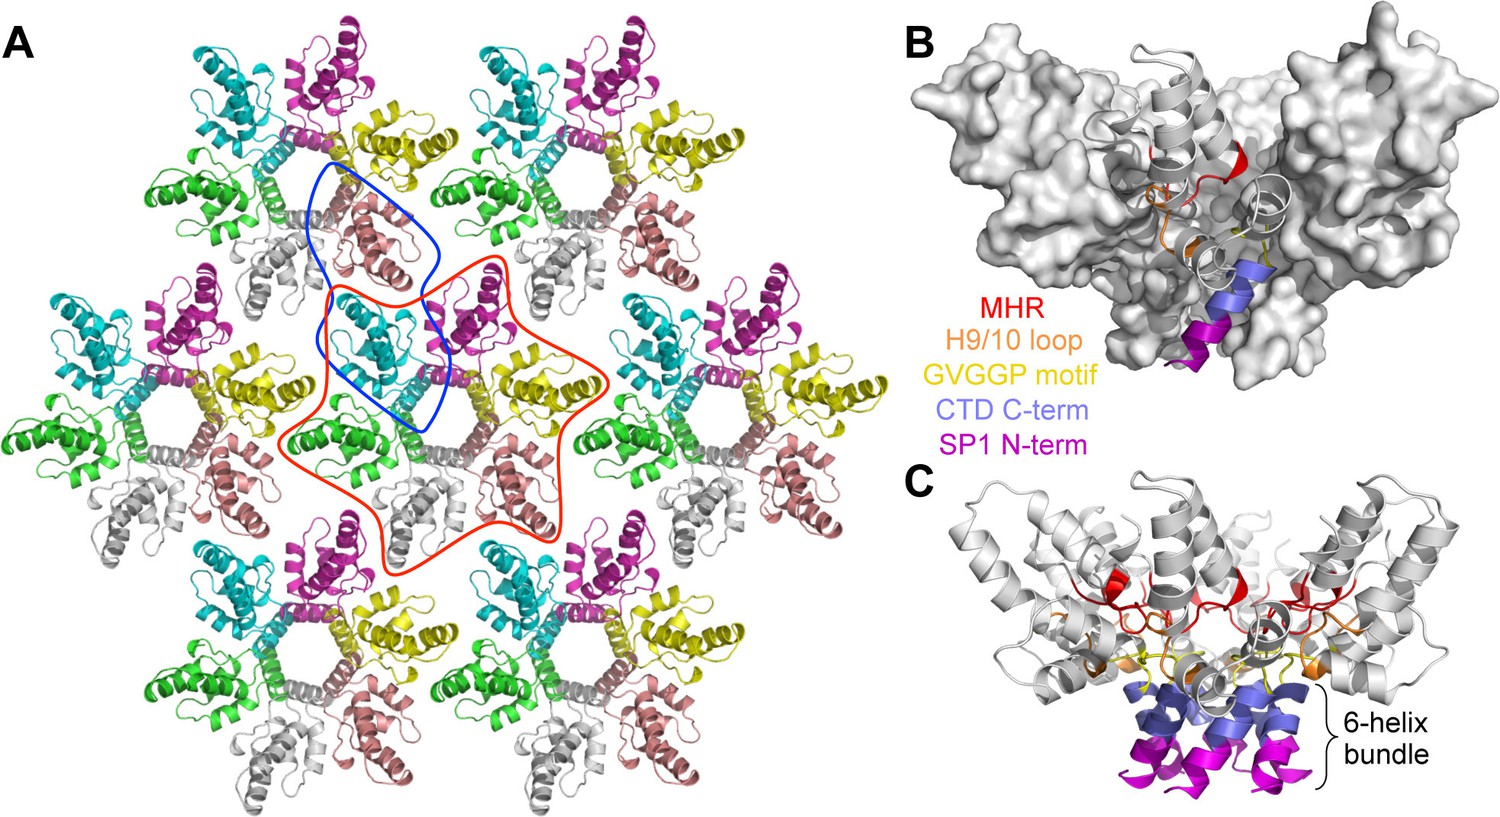
Crystal structure of the immature HIV-1 Gag CTD-SP1 lattice.
(A) Top view of the lattice, with symmetry equivalent subunits in the same color. A hexameric unit is outlined in red, and a dimeric unit is outlined in blue. (B,C) Side views of the hexamer. The structural elements that make intermolecular contacts are colored and labeled: MHR (red), helix 9/10 loop (orange), GVGGP β-turn motif (yellow), and junction helix (blue/magenta).
Figure 1—figure supplement 1
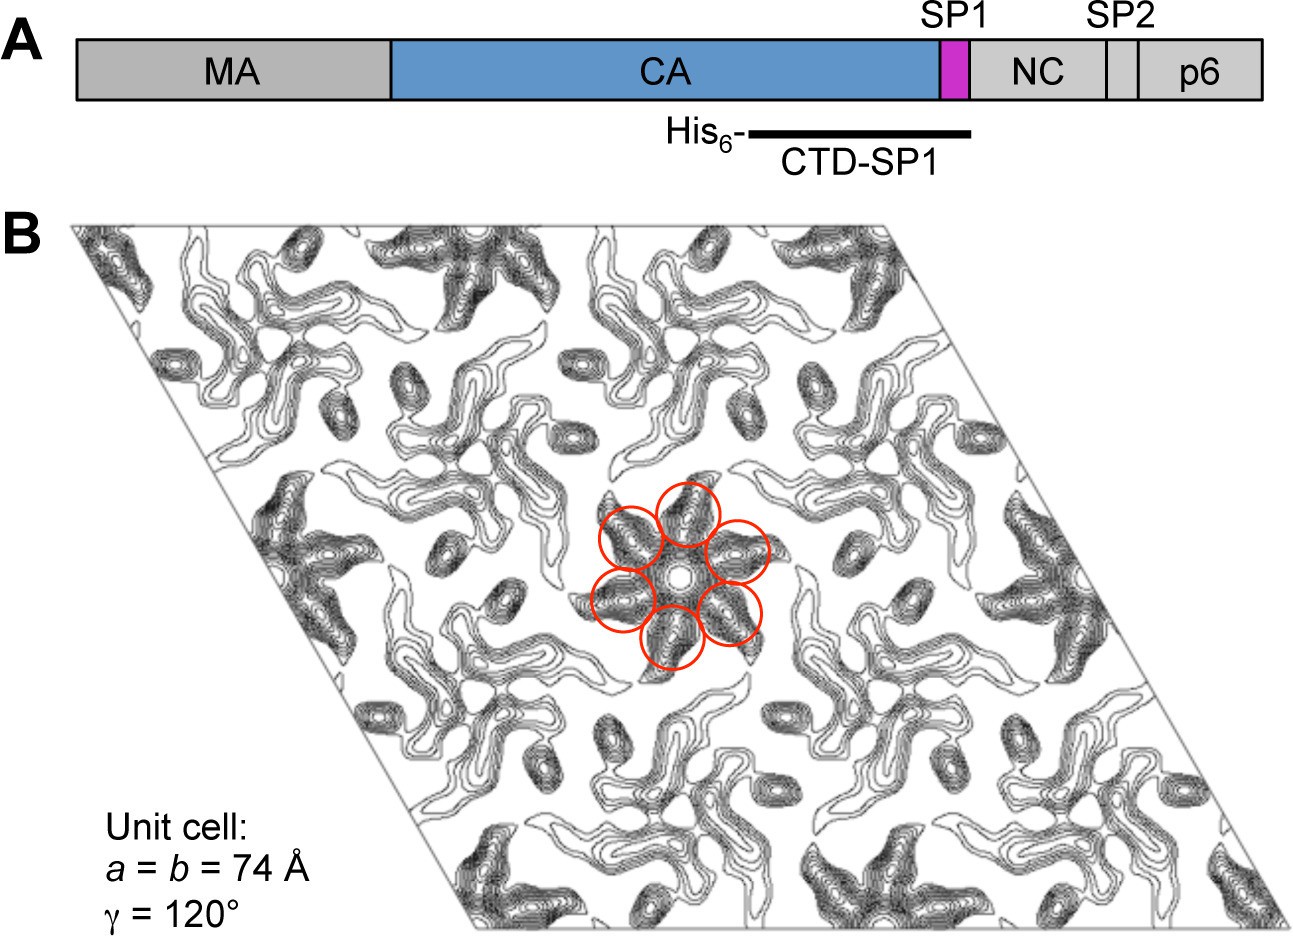
Initial characterization of CTD-SP1.
(A) Schematic diagram of the HIV-1 Gag protein, with the different domains indicated. The polyhistidine-tagged CTD-SP1 construct used in these studies is indicated beneath. (B) Merged projection map of two-dimensional CTD-SP1 crystals at about 9 Å resolution. Density features consistent with a 6-helix bundle are encircled in red.
Figure 1—figure supplement 2
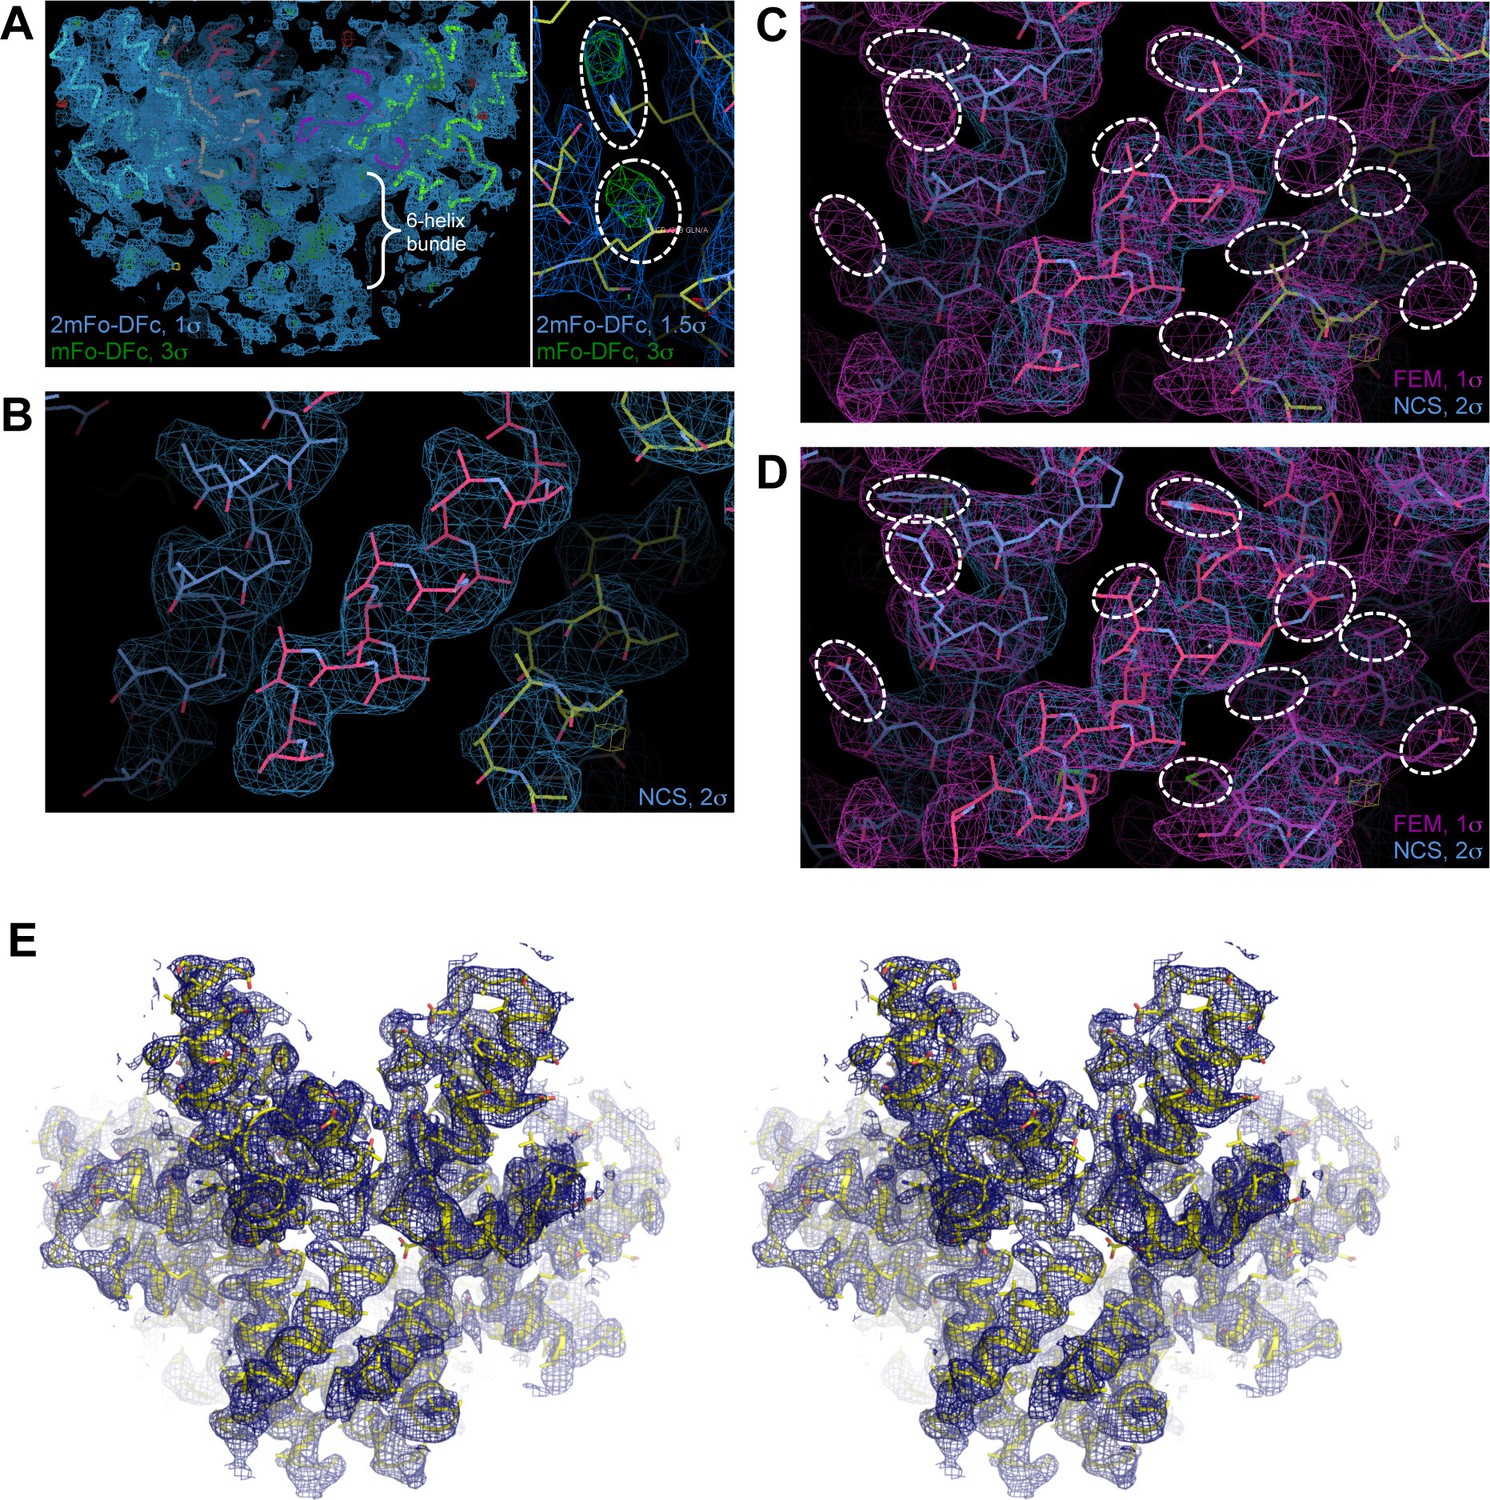
Maps and model building.
(A) Initial maps (mesh) calculated after molecular replacement with the CTD and rigid body refinement in PHENIX. The maps are of high quality, as evidenced by the appearance of unbiased densities for the 6-helix bundle (indicated in left) and sidechains (encircled in right). (B) Initial unbiased 6-fold NCS map (blue mesh) of the junction helix region, which was used to build a polyalanine model (sticks). (C) After several rounds of refinement and rebuilding, a feature-enhanced map (FEM, magenta mesh) was calculated with model phases (Afonine et al., 2015). Sidechains densities are evident in the FEM map (encircled), which provided a unique solution to the helix registry. (D) The model (sticks) was rebuilt into the FEM map, with the helical registry assigned. (E) Validation of the final model (yellow) with a composite simulated annealing (SA) omit map (blue mesh, 1σ) shown in stereoview. Close-up views of the SA omit map are also shown in Figure 3D and Figure 4A.
Figure 1—figure supplement 3
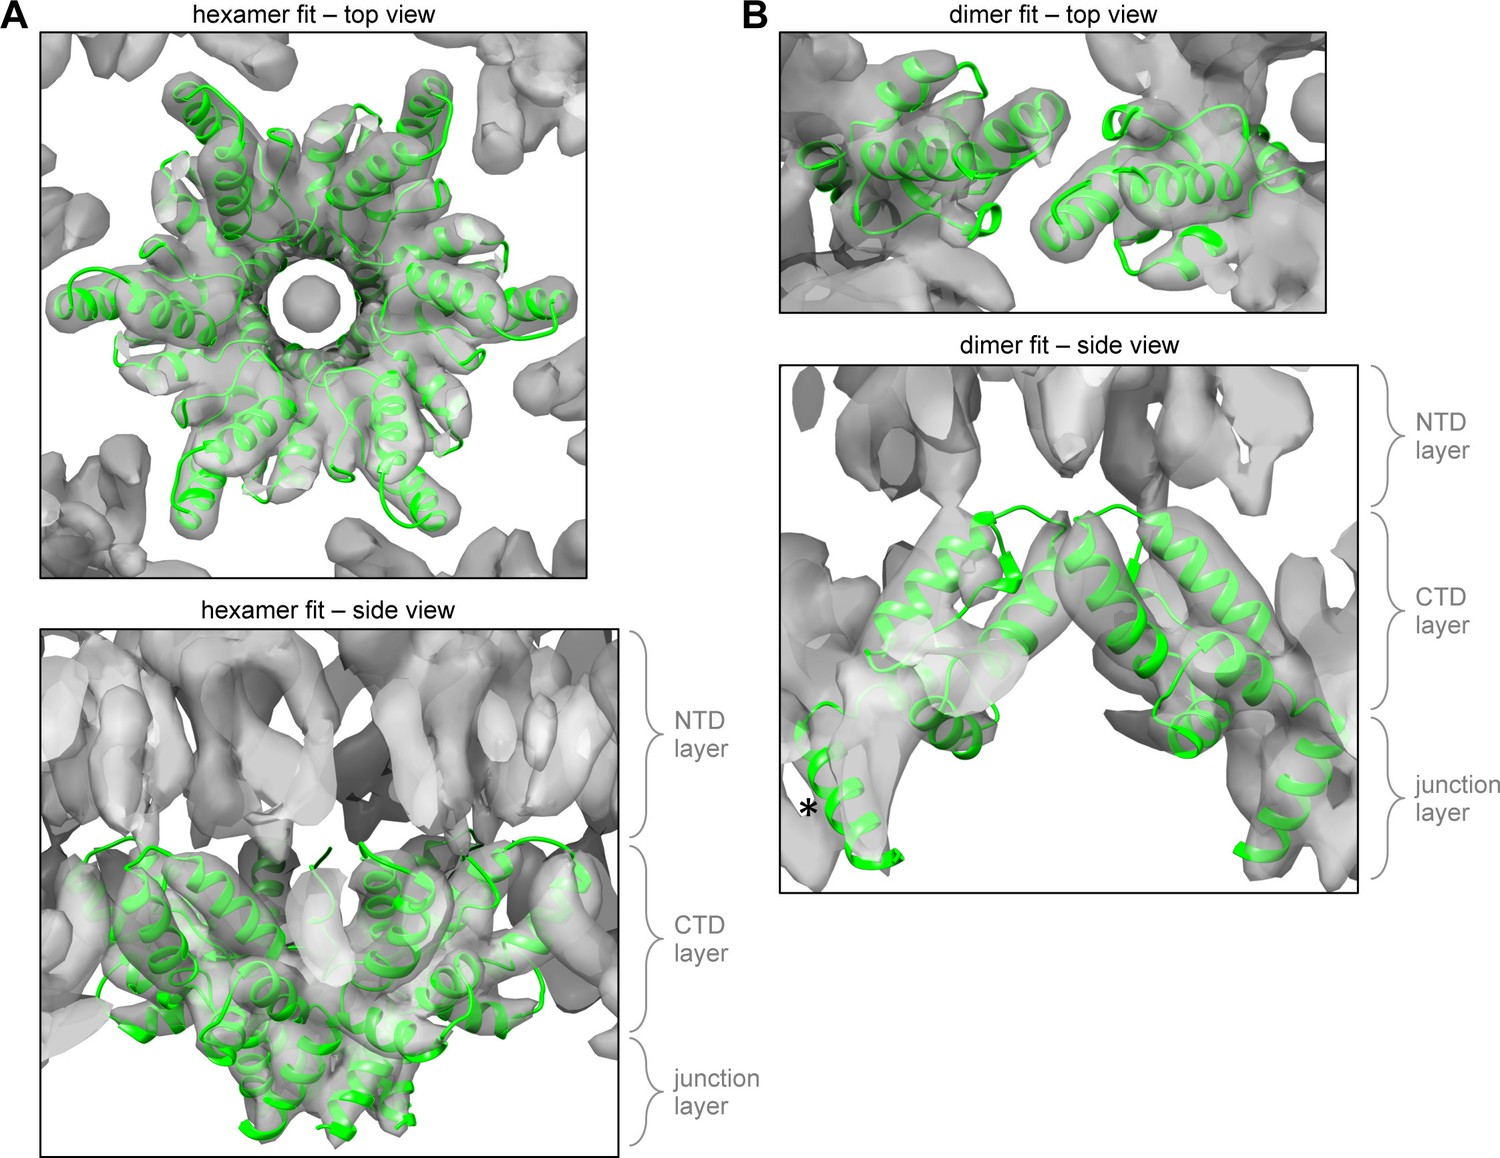
Comparison with the 8.8 Å cryoEM map of the immature HIV-1 Gag hexamer.
(A) Fitting of the CTD-SP1 hexamer as a single unit into the 8.8 Å resolution cryoEM map of the immature HIV-1 lattice (Schur et al., 2015b). (B) Fitting of the CTD-SP1 dimer. Asterisk indicates the CA-SP1 junction helix that is laterally displaced from its corresponding density in the cryoEM map.
Figure 2 with 1 supplement

Comparison of immature and mature forms of the CTD-SP1 switch.
(A) The immature CTD-SP1 subunit. Helices are shown as colored ribbons. Absolutely conserved MHR residues that mediate a salt bridge/hydrogen bond network are shown as yellow sticks, as are contributing residues from the helix 9/10 loop. (B) Equivalent view of the mature CTD (PDB 1A43) (Worthylake et al., 1999). Disordered residues at the C-terminus are in dashes. A pronounced kink in the dimerization helix (H9, pink) is absent in the immature form (black arrows). (C) Sequence conservation in the CTD-SP1 junction, derived from the curated Los Alamos HIV sequence database (Kuiken et al., 2003) (6824 sequences). Secondary structure of the immature and mature forms are shown above, with dashes indicating disordered regions. Proteolytic processing sites are marked by red arrowheads.
Figure 2—figure supplement 1
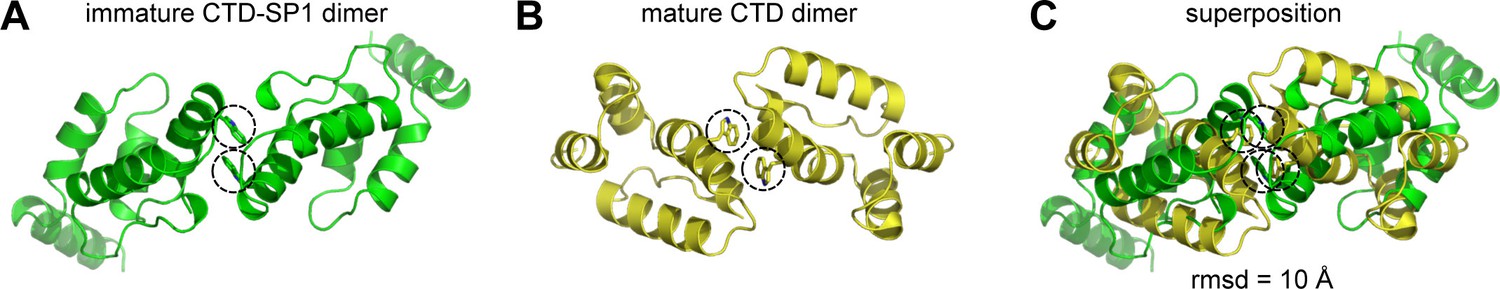
Quasi-equivalent conformations of the immature and mature dimers.
(A, B) Top views of the CTD-SP1 dimer in context of: (A) the planar immature lattice from this study and (B) the CTD dimer in context of the planar mature lattice (PDB 4XFX) (Gres et al., 2015). The interfacial Trp316 sidechains (Trp184 in mature) are encircled for reference. (C) Superposition of the two structures as dimeric units emphasizes the different configurations of the subunits across the same interface.
Figure 3
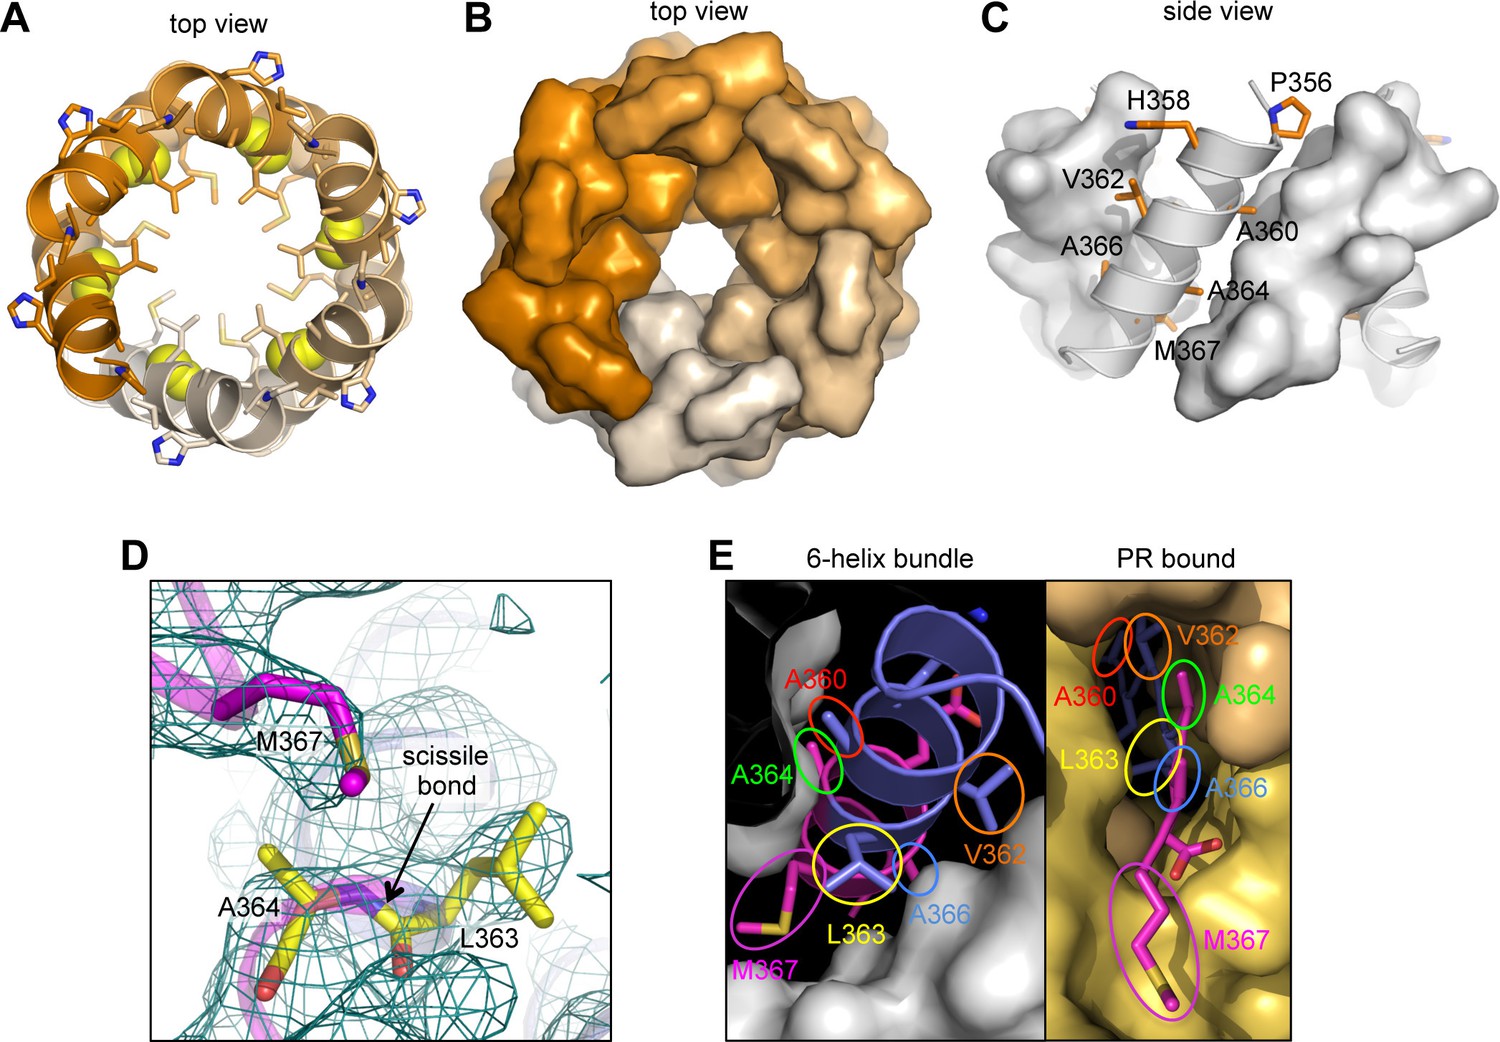
The junction 6-helix bundle.
(A) Top view of the 6-helix bundle. The helical backbone is in ribbons, and sidechains that mediate 'knobs-in-holes' type packing are shown as sticks. Yellow spheres indicate the scissile peptide bond between Leu363 and Ala364 (CA residue Leu231 and SP1 residue Ala1). (B) Same top view, with the subunits rendered in surface representation. (C) Side view, with alternating subunits rendered as ribbons or surfaces. 'Knobs-in-holes' sidechains are shown as orange sticks and labeled. (D) Close-up of the scissile bond, which is sequestered at the bottom of a pocket occupied by the Met367 sidechain. Mesh shows a composite simulated annealing omit map (1σ). (E) Comparison of the CA-SP1 junction in context of the 6-helix bundle (left) and bound to the viral protease active site (right) (PDB 1 KJH) (Prabu-Jeyabalan et al., 2000). Sidechains that mediate both types of interactions are encircled, with equivalent residues in the same color.
Figure 4 with 1 supplement
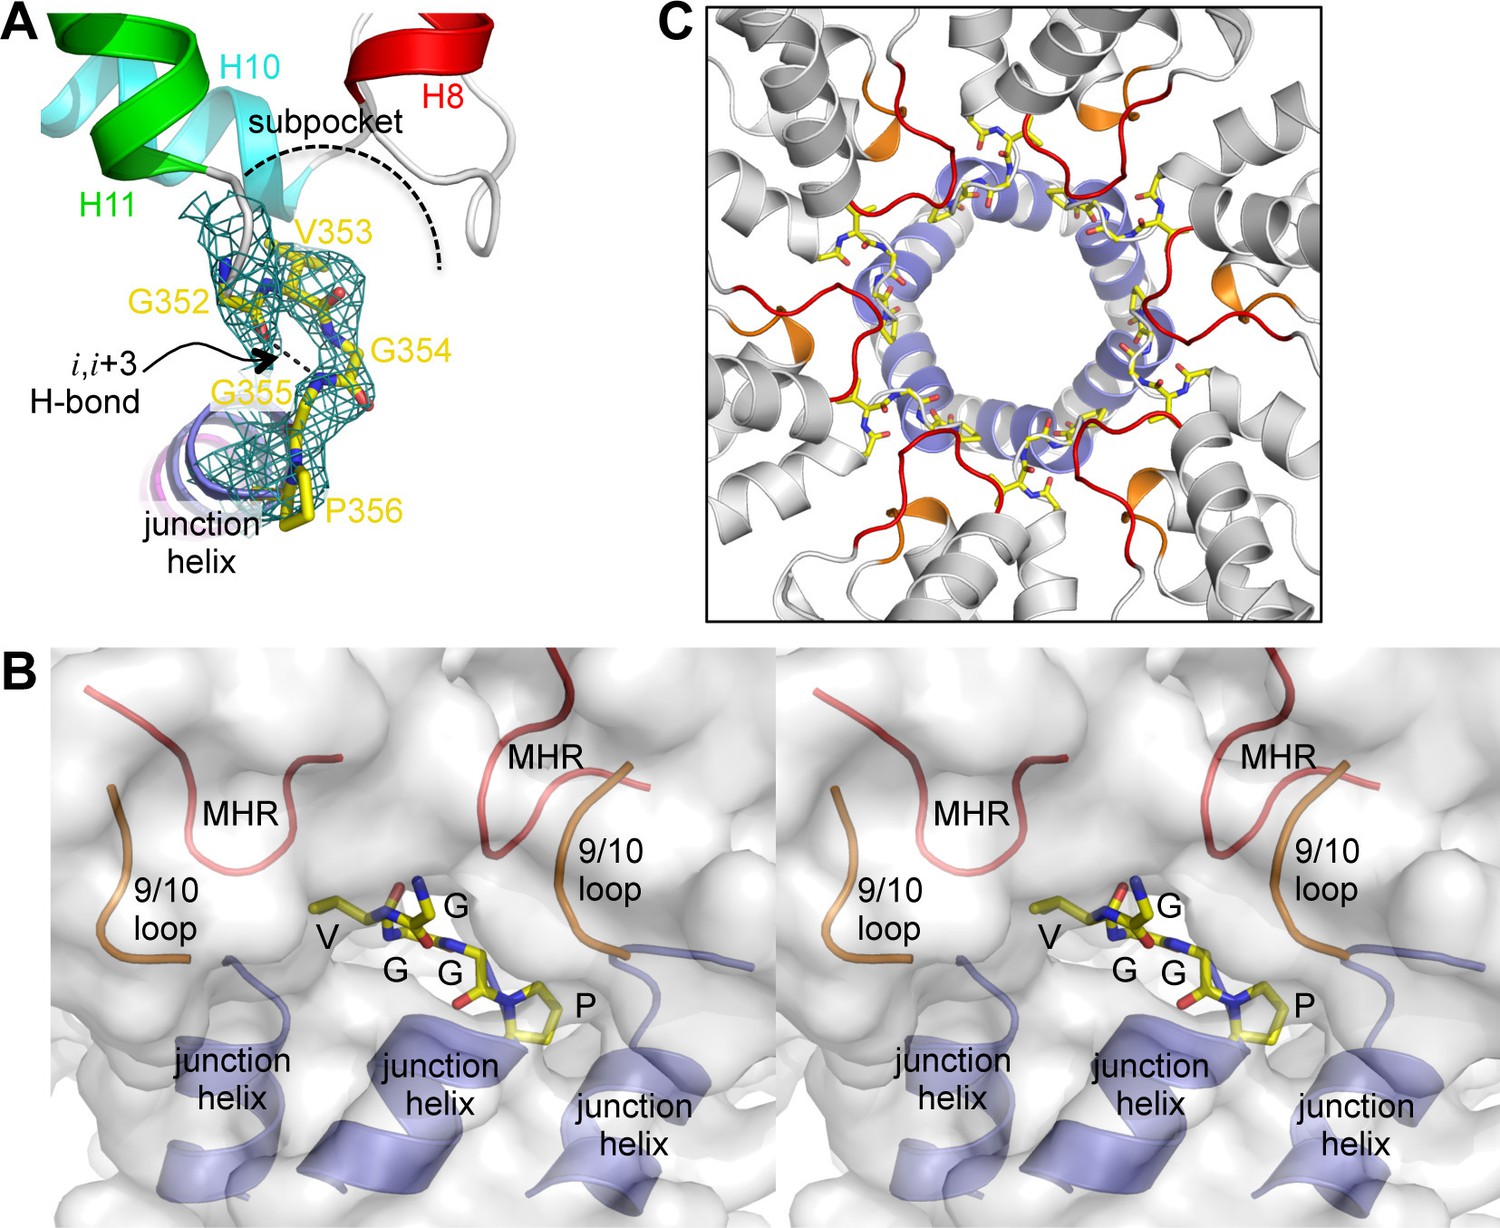
The β-turn 'clasp' motif.
(A) Close-up view of the GVGGP motif in context of a single subunit. An i,i+3 hydrogen bond characteristic of a right-handed β-turn is indicated, as is the sub-pocket occupied by the Val353 sidechain. Mesh shows a composite simulated annealing omit map (1σ). (B) Stereo view of the β-turn and its surrounding pocket, which is made up of two MHR loops (red), two helix 9/10 loops (orange), and the N-terminal ends of three junction helices (blue). The hexamer is rendered as a translucent surface. (C) The six β-turns (yellow sticks) in context of the hexamer. The surrounding MHR, 9/10 loops, and junction helices are colored as in (B).
Figure 4—figure supplement 1
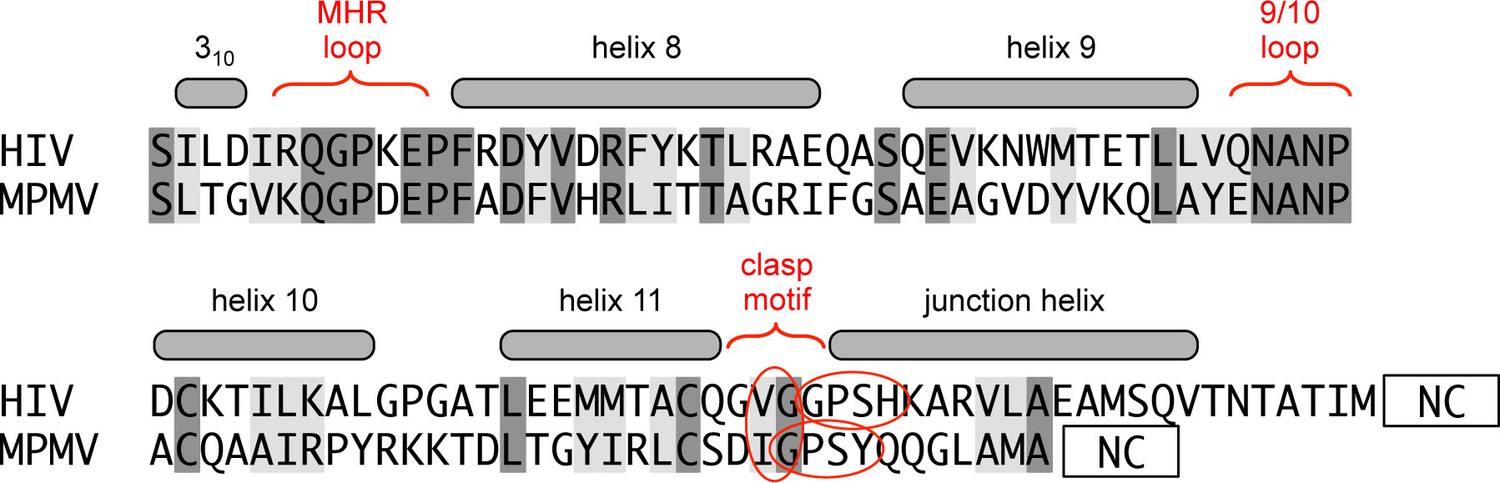
Comparison of the HIV and MPMV switch regions.
The sequence alignment spans the CTD-SP1 fragment of HIV-1 Gag and CTD of MPMV Gag. Unlike HIV-1, MPMV does not have a spacer peptide in between its CA and NC domains. Despite the absence of a junction helix, the MHR, helix 9/10 loop, and putative 'clasp' motif of MPMV are highly similar in sequence to HIV-1.
Figure 5 with 2 supplements

Summary of structure-based alanine scanning mutagenesis.
(A–D) Phenotypes of HIV-1 Gag △MA-CA-SP1-NC assembled with DNA. The ribbon diagram is of two opposing subunits in the hexamer with Cα atoms shown as spheres and color-coded according to assembly phenotypes as shown in panels B, C, and D. (E–H) Phenotypes of △MA-CA-SP1-NC assembled with tartrate. Scale bars = 150 nm.
Figure 5—figure supplement 1
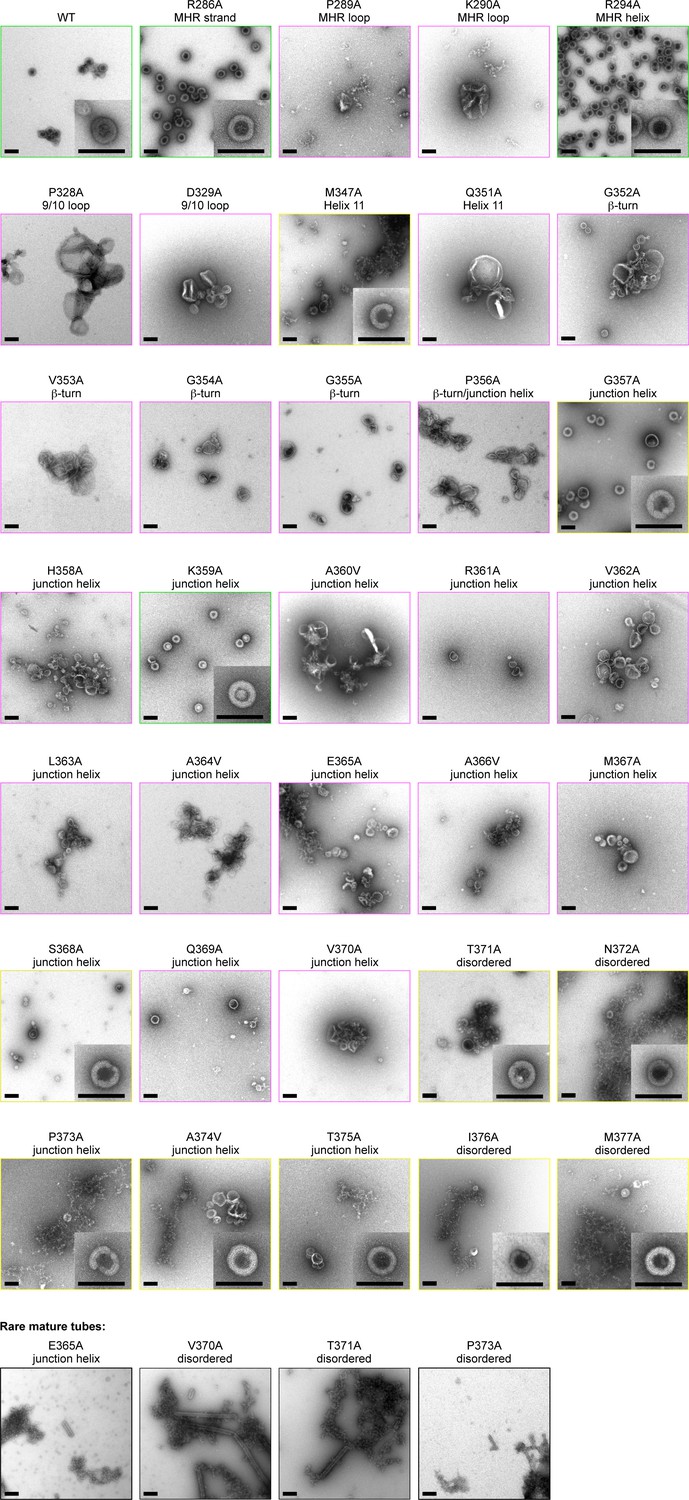
Alanine scanning mutagenesis of CA-SP1.
Shown are representative images of △MA-CA-SP1-NC proteins assembled in vitro through dialysis with a single-stranded DNA template. Boxes are colored according to assembly phenotypes as indicated in Figure 5A–D and Table 2. Insets show a representative immature particle for each particular mutant, if observed. Scale bars = 150 nm.
Figure 5—figure supplement 2
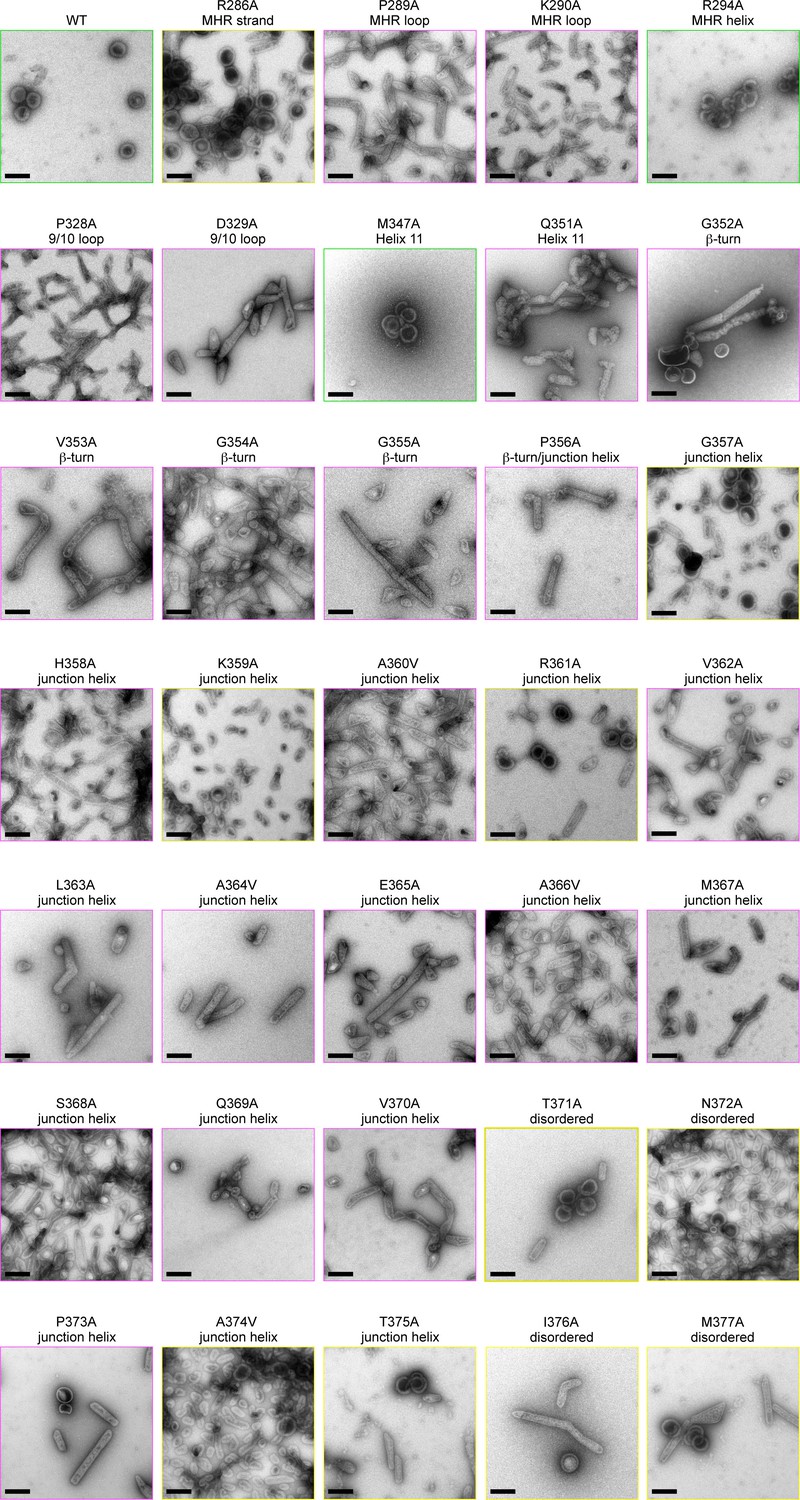
Alanine scanning mutagenesis of CA-SP1.
Shown are representative images of △MA-CA-SP1-NC proteins assembled in vitro by incubating with tartrate. Boxes are colored according to assembly phenotypes as indicated in Figure 5E–H and Table 2. Scale bars = 150 nm.
Tables
Table 1
Structure statistics for HIV-1 Gag CTD-SP1.
| Diffraction | |
|---|---|
| Beamline | APS 22ID |
| Wavelength (Å) | 1.0 |
| Processing program | HKL2000 |
| Space group | C2 |
| Cell dimensions | a = 70.96 Å |
| b = 122.73 Å | |
| c = 85.41 Å | |
| α = γ = 90°, β = 94.3° | |
| Resolution range, Å | 50-3.27 (3.42-3.27) |
| Rmerge / Rpim | 0.22 (0.74) / 0.11 (0.47) |
| Mean I/σ<I> | 5.99 (1.28) |
| Completeness,% | 87.0 (66.4) |
| Average redundancy | 3.7 (2.5) |
| Wilson B-factor, Å2 | 85.21 |
| Refinement | |
| Refinement program | PHENIX |
| Resolution range | 42.59-3.27 (3.45-3.27) |
| No. of unique reflections | 9,710 (908) |
| Reflections in free set | 1,009 (88) |
| Rwork | 0.246 (0.369) |
| Rfree | 0.278 (0.408) |
| No. of nonhydrogen atoms | |
| protein | 3,865 |
| solvent | 0 |
| Average B-factor, Å2 | |
| protein | 84.09 |
| solvent | n/a |
| Coordinate deviations | |
| bond lengths, Å | 0.003 |
| bond angles, ° | 0.513 |
| Validation and Deposition | |
| Ramachandran plot | |
| favored,% | 98.9 |
| outliers,% | 0 |
| MolProbity clash score | 0.13 |
| PDB ID | 5I4T |
-
Values in parenthesis are for the highest resolution shell.
Table 2
In vitro assembly phenotypes of HIV-1 △MA-CA-SP1-NC Gag.
| Mutation | Location | DNA template1 | Tartrate2 |
|---|---|---|---|
| Wildtype | + | + | |
| R286A | MHR strand | + | +/m |
| P289A | MHR loop | – | m |
| K290A | MHR loop | – | m |
| R294A | MHR helix | + | + |
| P328A | 9/10 loop | – | m |
| D329A | 9/10 loop | – | m |
| M347A | Helix 11 | +/– | + |
| Q351A | Helix 11 | – | m |
| G352A | β-turn | – | m |
| V353A | β-turn | – | m |
| G354A | β-turn | – | m |
| G355A | β-turn | – | m |
| P356A | β-turn /Junction helix | – | m |
| G357A | Junction helix | +/– | +/m |
| H358A | Junction helix | – | m |
| K359A | Junction helix | + | +/m |
| A360V | Junction helix | – | m |
| R361A | Junction helix | – | +/m |
| V362A | Junction helix | – | m |
| L363A | Junction helix | – | m |
| A364V | Junction helix | – | m |
| E365A | Junction helix | –* | m |
| A366V | Junction helix | – | m |
| M367A | Junction helix | – | m |
| S368A | Junction helix | +/– | m |
| Q369A | Junction helix | – | m |
| V370A | Junction helix | –* | m |
| T371A | Disordered | +/–* | +/m |
| N372A | Disordered | +/– | +/m |
| P373A | Disordered | +/–* | m |
| A374V | Disordered | +/– | +/m |
| T375A | Disordered | +/– | +/m |
| I376A | Disordered | +/– | +/m |
| M377A | Disordered | +/– | +/m |
-
* rare mature tubes
Download links
A two-part list of links to download the article, or parts of the article, in various formats.
Downloads (link to download the article as PDF)
Open citations (links to open the citations from this article in various online reference manager services)
Cite this article (links to download the citations from this article in formats compatible with various reference manager tools)
Crystal structure of an HIV assembly and maturation switch
eLife 5:e17063.
https://doi.org/10.7554/eLife.17063


