Boundary cells restrict dystroglycan trafficking to control basement membrane sliding during tissue remodeling
- Duke University, United States
- Center for Tissue Engineering and Regenerative Medicine, Union Hospital, China
- Huazhong University of Science and Technology, China
- Union Hospital, China
Figures
Figure 1
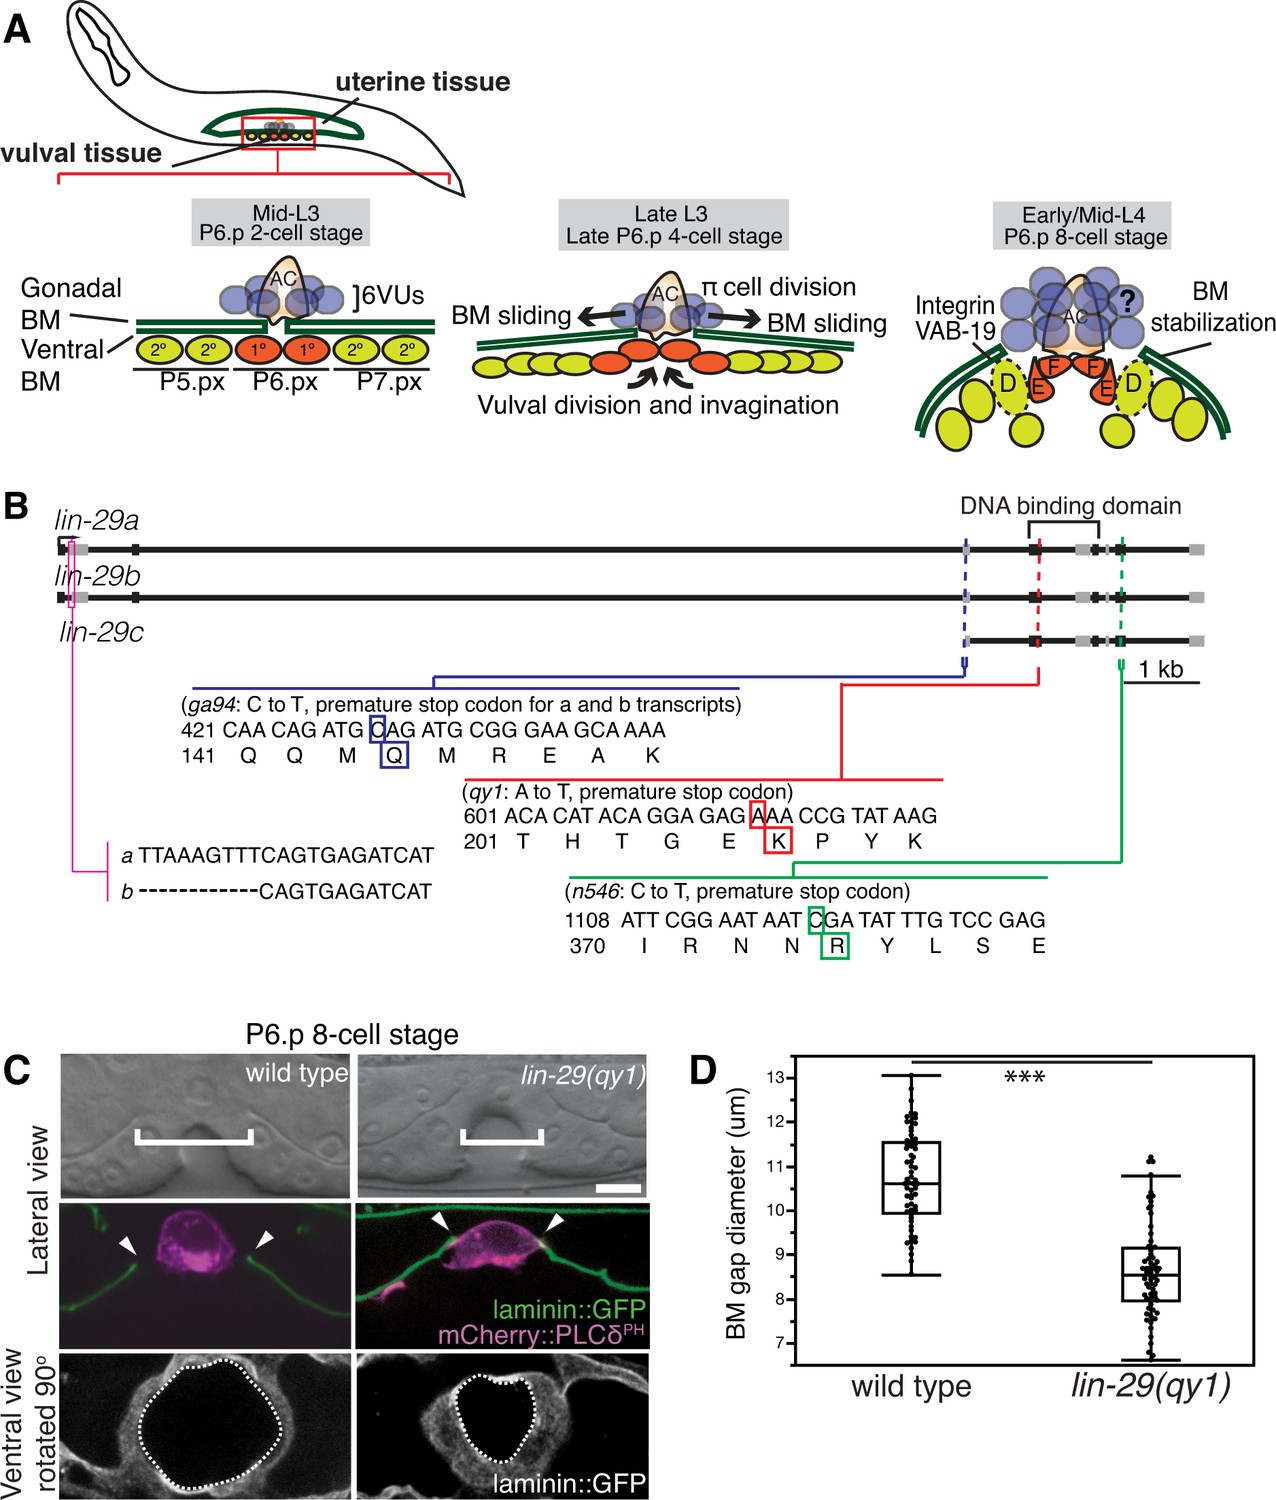
BM sliding during uterine-vulval connection and isolation of lin-29(qy1).
(A) Top left: During the mid-L3 larval stage (vulval P6.p 2-cell stage), the uterine anchor cell (AC) breaches the juxtaposed gonadal and ventral BMs (green) and contacts the central 1° fated vulval precursor cells (VPCs; P6.px cells, red). Middle: After AC invasion is completed at the late L3 (P6.p 4-cell stage), VPC growth, divisions, and invagination drive BM sliding, which widens the BM gap. Ventral uterine (VU) π cells (blue) also begin to divide at the late L3. Right: By the early-to-mid L4 (P6.p 8-cell stage), the BM stops sliding and is stabilized over the non-dividing 2° fated vulD cells (dotted line) by vulD expression of cytoplasmic VAB-19 (Kank) and cell surface integrin. BM sliding allows direct connection between vulE and F cells with uterine π cells, which form the mature uterine-vulval connection. The regulation of BM sliding by the uterine π cells is unknown (represented with '?'). (B) A schematic diagram of the lin-29 gene. Allele qy1 (red) creates an early stop codon affecting all three transcripts. Allele ga94 (blue) affects the lin-29a/b transcripts but leaves the translation of lin-29c largely unaffected, while n546 (green) introduces a nonsense mutation affecting all three encoded isoforms of the LIN-29 protein. (C) A lateral, central plane (with the AC in focus) DIC image (top) with BM (laminin::GFP) and AC (cdh-3 > mCherry::PLCδPH) fluorescence (middle) and ventral view of laminin::GFP (bottom) showing the circular opening of the BM at the uterine-vulval connection at the P6.p 8-cell stage. In lin-29(qy1) mutants the BM gap (top, white brackets=diameter; middle, arrowheads=edges of gap; bottom, white dashed lines=outline of circular BM gap) failed to widen after AC invasion. Scale Bar, 5 μm. (D) Quantification of the BM gap diameter at the P6.p 8-cell stage in wild type (n = 66) and lin-29(qy1) mutants (n = 65). Box signifies first and third quartiles and median measurement; whisker ends signify minimum and maximum values that fall within 1.5 times the interquartile range. The asterisks denote a statistically significant difference (*** indicates p<0.001 Wilcoxon rank sum test).
-
Figure 1—source data 1
BM gap diameter in wild type vs. lin-29(qy1).
- https://doi.org/10.7554/eLife.17218.004
Figure 2 with 1 supplement
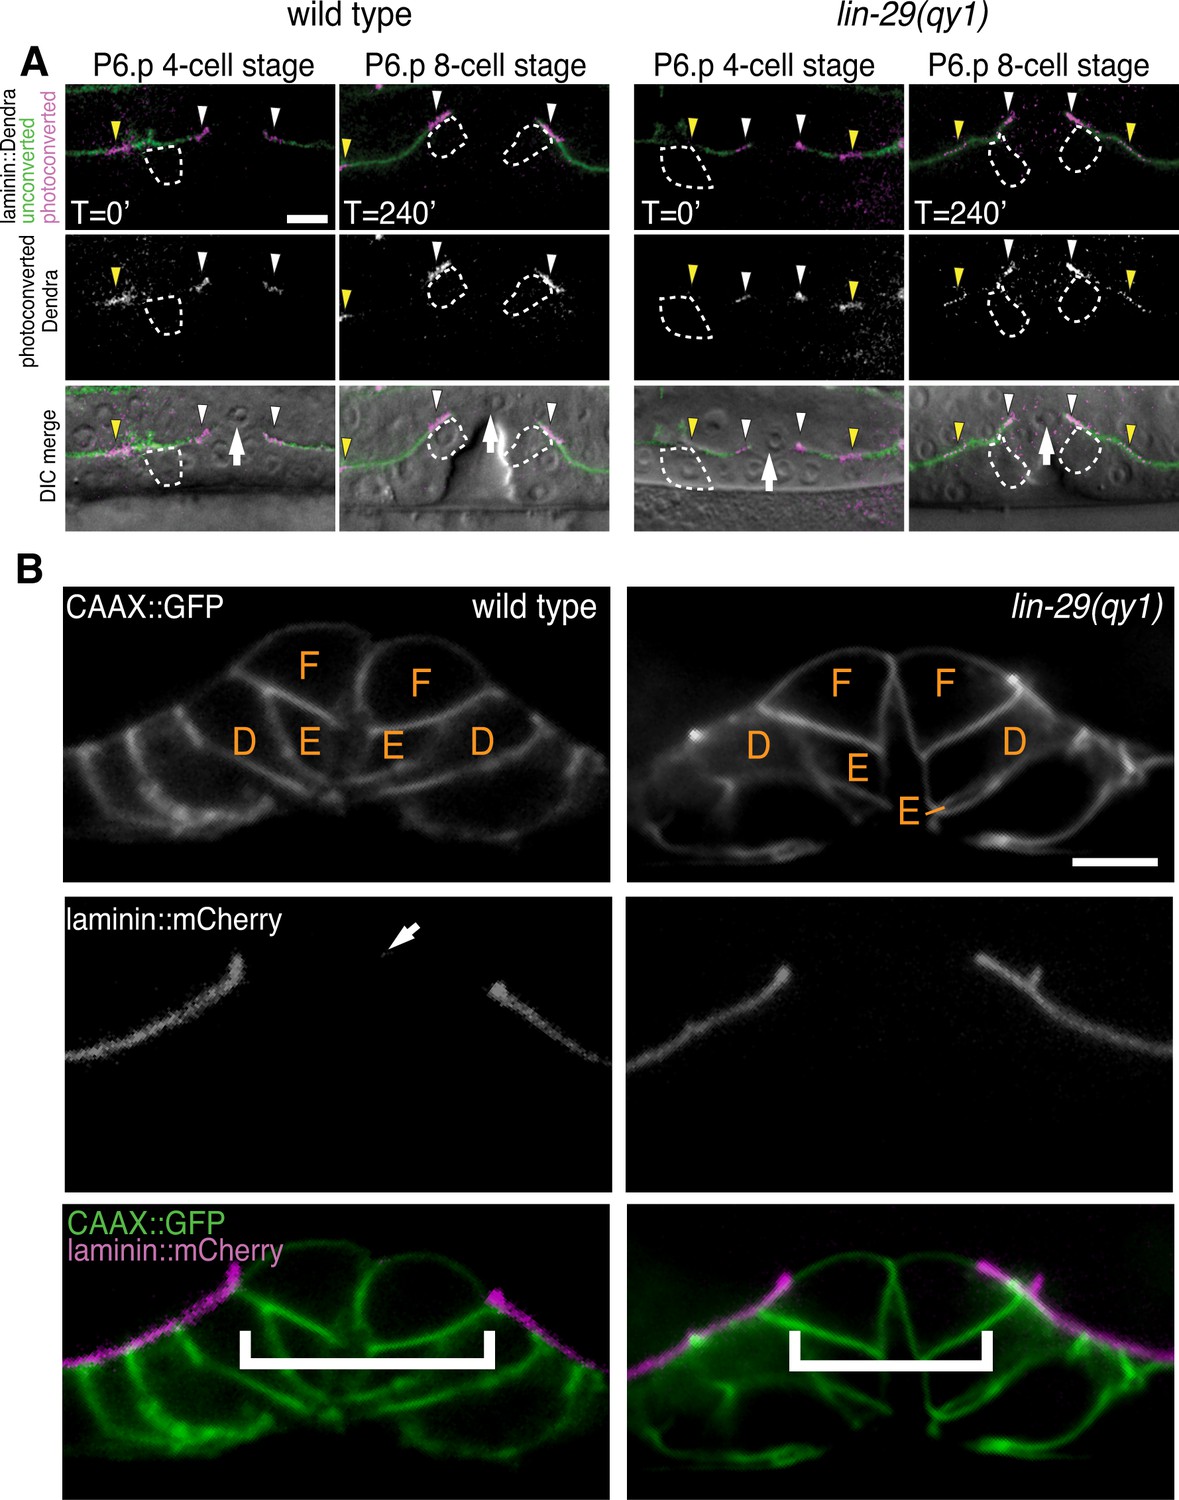
lin-29(qy1) mutants are defective in BM sliding but have a normal vulval precursor morphology.
(A) Fluorescence overlays of optical highlighting (photoconversion) of ~5 µm long laminin::Dendra segments (magenta in top; white in middle; white arrowheads highlighted regions next to BM gap, yellow arrowheads highlighted regions farther from gap) in wild type (left) versus lin-29(qy1) mutant (right). The fate of optically highlighted BM at the P6.p 4-cell stage (T=0’) was assessed at the P6.p 8-cell stage (T=240’). In wild type animals, optically highlighted laminin::Dendra at the edges of the BM gap slid from a position over the vulF precursor cell to over the vulD cell (indicated with dashed outline; n = 10/10 animals). In contrast, in lin-29(qy1) mutants the optically highlighted laminin did not move over the vulD cell (n = 18/18 animals). The arrow in the bottom panels indicates the AC. (B) Vulval morphology in wild type (left) versus a qy1 mutant (right). The number (see text) and positions of vulF, vulE, and vulD (outlined in CAAX::GFP) were normal in lin-29(qy1) animals (top panels: grayscale, bottom panels: green), while the BM (laminin::mCherry, middle panels: grayscale and bottom panels: magenta) gap boundaries are narrower in the lin-29(qy1) mutant. (bracket). The arrow in the middle panel for the wild type denotes a puncta of laminin internalized by the AC during invasion, and does not represent the edge of the BM gap (which is located above vulD in wild type and is characterized by a build-up of laminin). All images lateral, central plane. Scale Bars, 5 um.
Figure 2—figure supplement 1
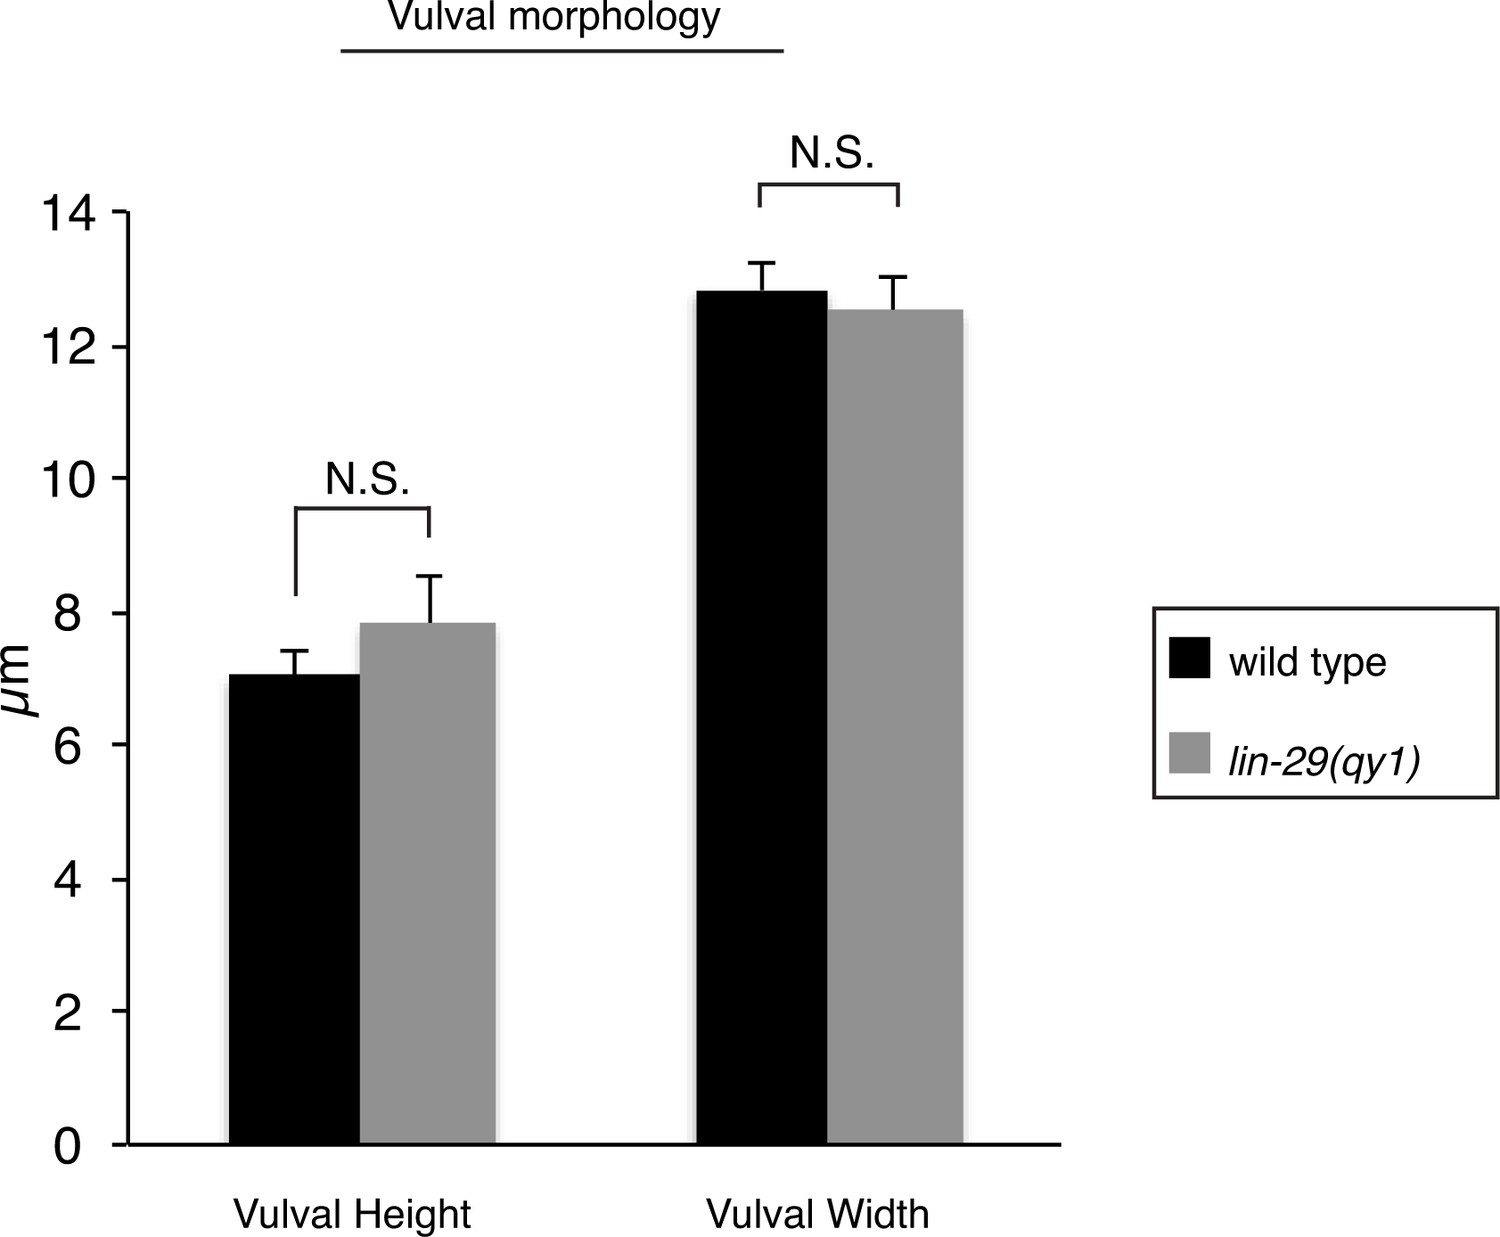
Vulval morphology measurements in lin-29 mutants.
Quantification of vulval height (measured as the distance between the nucleus of vulE and the base of the vulva) and width (measured as the distance between the nuclei of the 2 vulD cells) in wild type (n = 34) and lin-29(qy1) (n = 16) No significant differences were observed (p>0.05, Student’s t-test).
Figure 3
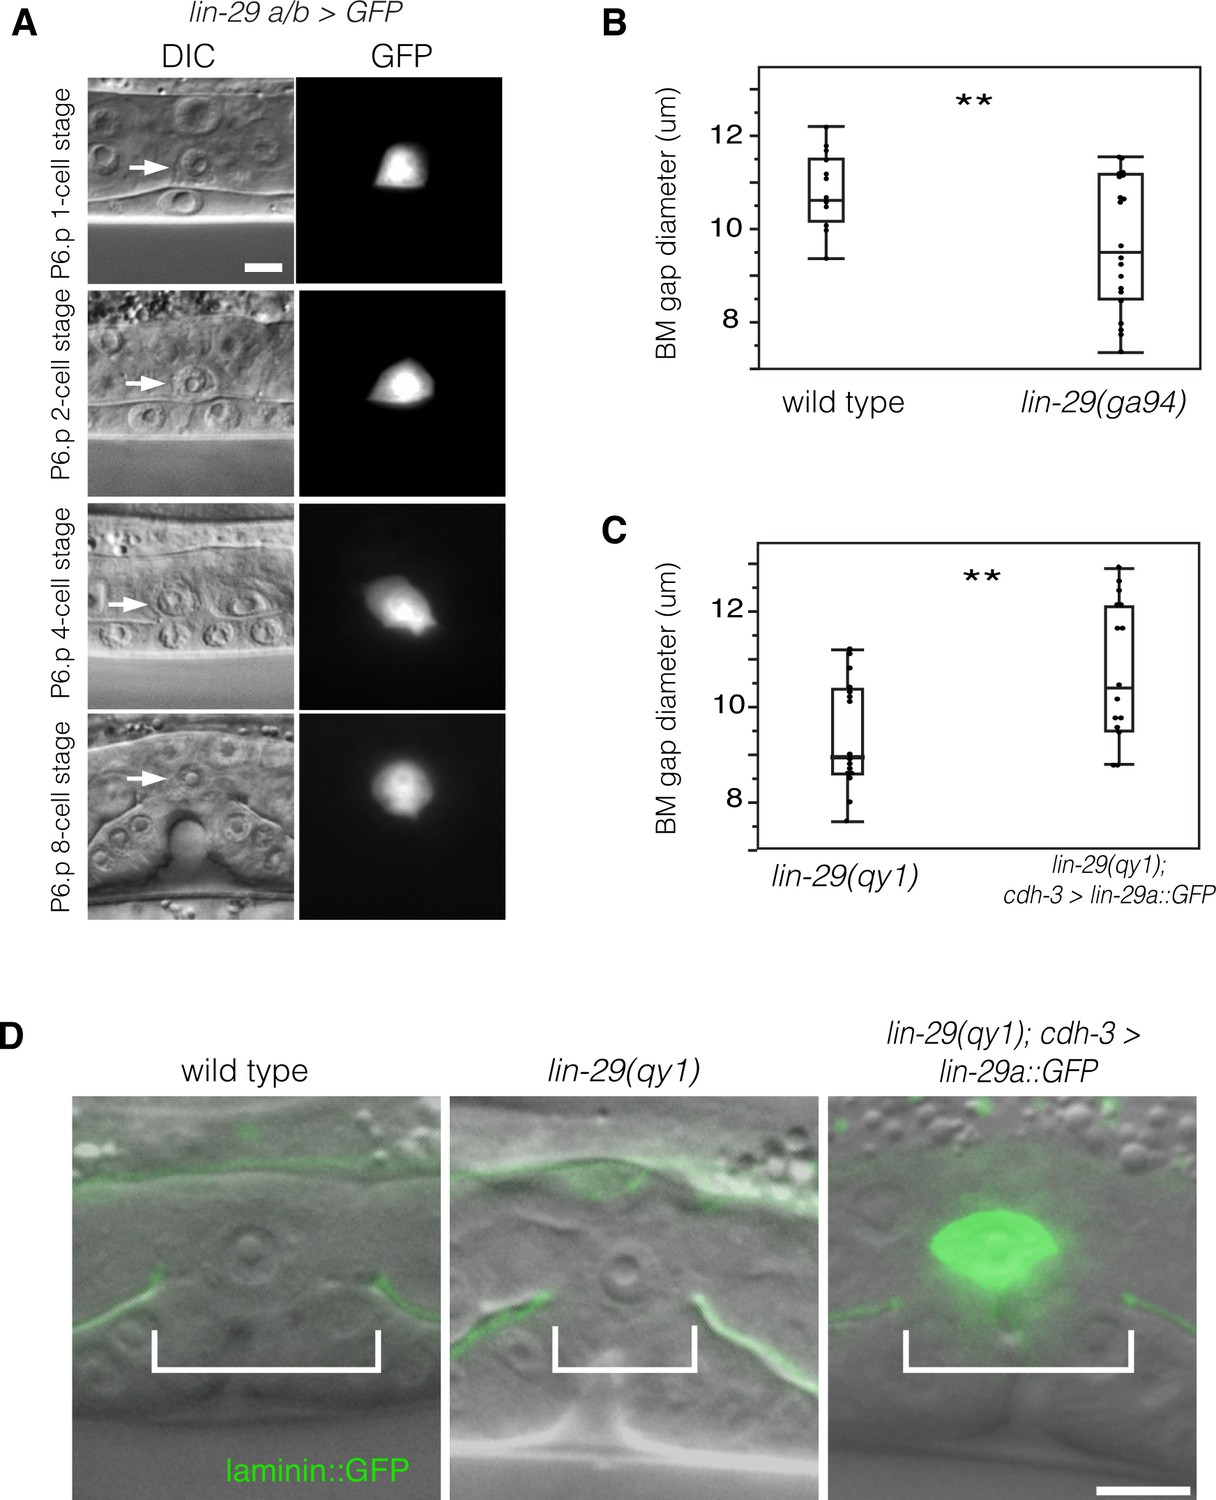
LIN-29 functions within the AC to promote BM gap expansion.
(A) Expression of GFP from a lin-29a/b > GFP transcriptional reporter in the AC throughout the course of BM gap expansion. (B) Quantification of the BM gap in wild type (n = 16) and lin-29(ga94) (n = 22) at the P6.p 8-cell stage. (C) Quantification of the BM gap in lin-29(qy1) (n = 16) and AC specific rescue of LIN-29A (n = 15) at the P6.p 8-cell stage. (D) Laminin::GFP overlaid on DIC in wild type, lin-29(qy1), and a lin-29 mutant with AC specific rescue of LIN-29A protein showing diameter of the BM gap (brackets). In B and C, ** indicates p<0.01, Wilcoxon rank sum test. All images lateral, central plane. Scale Bars, 5 um.
-
Figure 3—source data 1
BM gap diameter in wild type vs. lin-29(ga94).
- https://doi.org/10.7554/eLife.17218.008
-
Figure 3—source data 2
BM gap diameter in lin-29(qy1) vs. lin-29(qy1); cdh-3 > lin-29a::GFP.
- https://doi.org/10.7554/eLife.17218.009
Figure 4 with 1 supplement
AC-mediated Notch signaling to the uterine π cells promotes BM sliding.
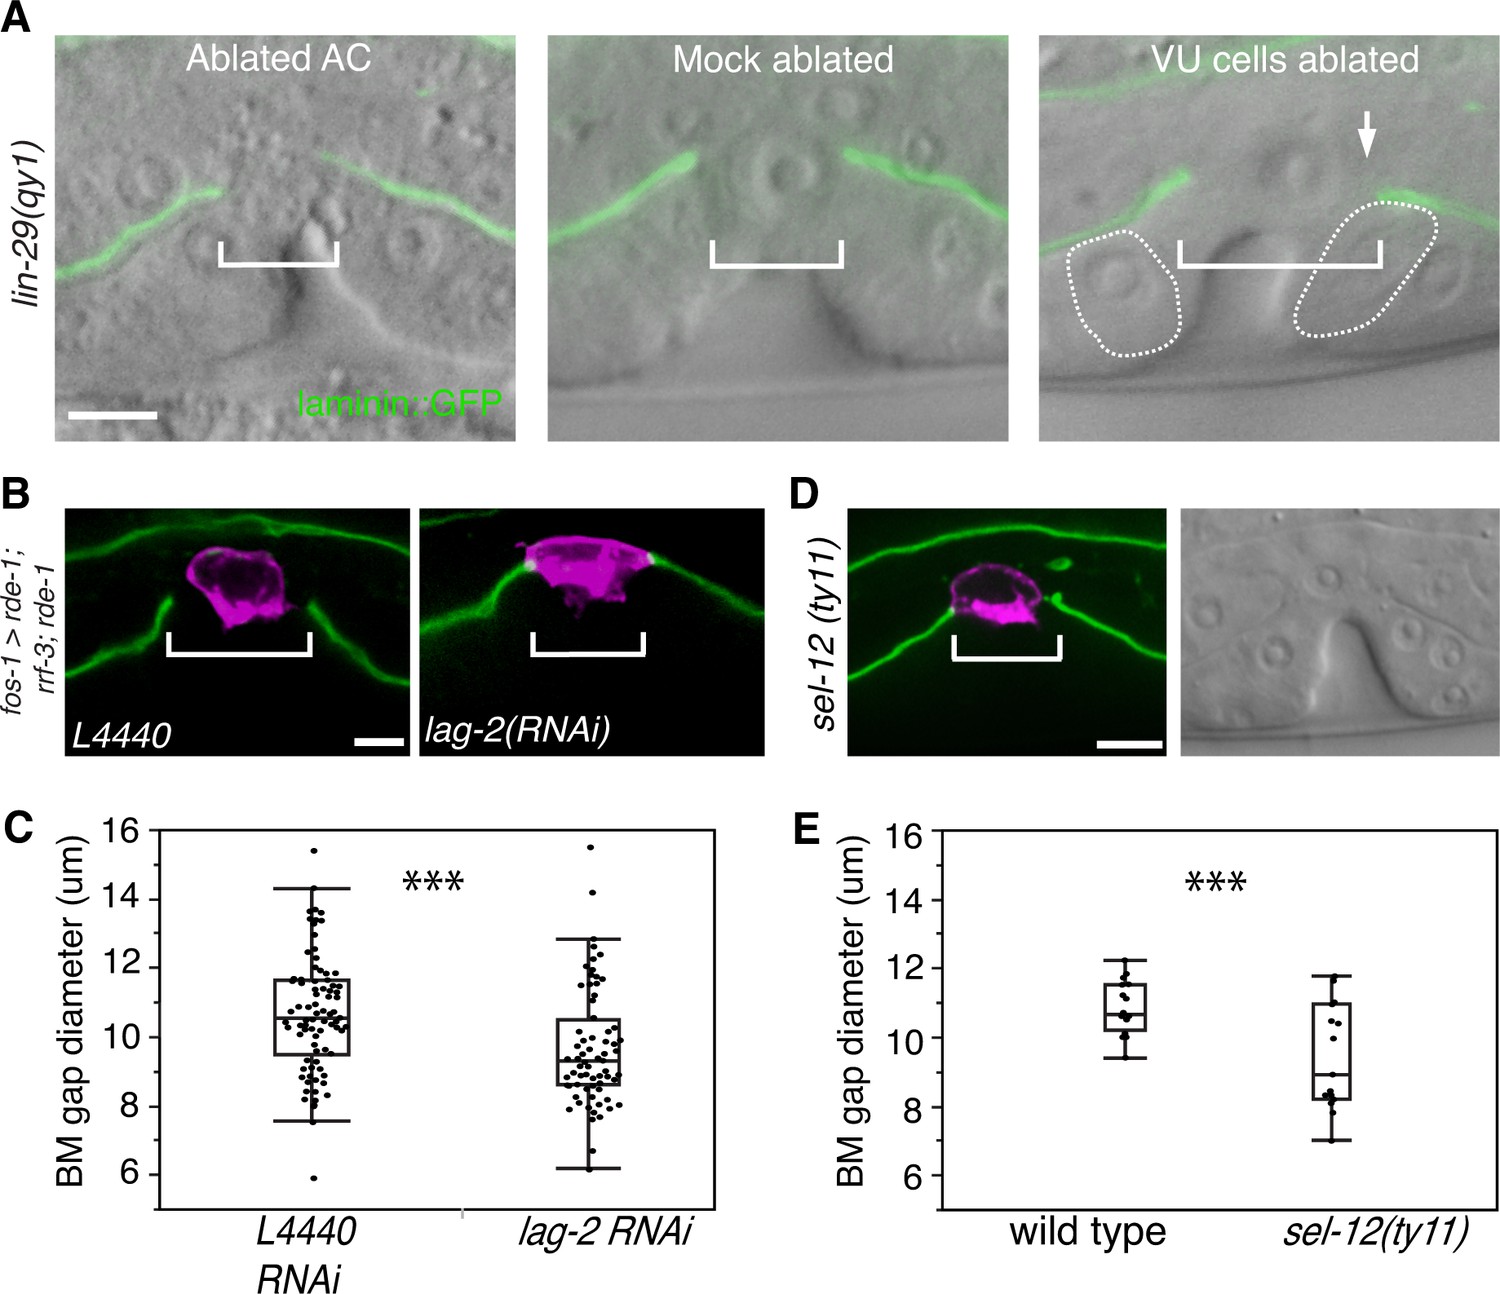
(A) Fluorescence overlays of laminin::GFP on DIC images show that the BM gap (brackets) failed to expand in lin-29(qy1) mutants after the AC was ablated (left, n = 8/8) or in mock ablated lin-29 mutants (middle, n = 8/8). However, the BM gap opened wider on the side of the AC in lin-29 mutants (BM slid over the vulD cell, outlined with dashed line) after laser ablation of the uterine π cells on that side (right, arrow, n = 5/8 animals; p<0.001, Fisher’s Exact Test). (B) Uterine-specific RNAi targeting the L4440 empty vector control (left) and the AC-expressed Notch ligand lag-2 (right) revealed that lag-2 is required for BM sliding (BM visualized with laminin::GFP, green) away from the AC (mCherry::PLCδPH, magenta). (C) Quantification of the BM gap size after treatment L4440 control (n = 62) and uterine-specific lag-2 RNAi (right, n = 68). (D) In sel-12(ty11) mutants, which perturbs LIN-12(Notch) signaling in the uterine π cells, the BM gap (laminin::GFP, right; visualized at P6.p 8-cell stage, DIC left) failed to expand. (E) Quantification of the BM gap in sel-12(ty11) (n = 15) and wild type (n = 15). For C and E, *** indicates p<0.001 Wilcoxon rank sum test. All images lateral, central plane. Scale Bars, 5 µm
-
Figure 4—source data 1
BM gap diameter in L4440 vs. lag-2 RNAi.
- https://doi.org/10.7554/eLife.17218.011
-
Figure 4—source data 2
BM gap diameter in wild type vs. sel-12(ty11).
- https://doi.org/10.7554/eLife.17218.012
-
Figure 4—source data 3
BM gap diameter in lag-2 vs. lin-12 and glp-1 RNAi.
- https://doi.org/10.7554/eLife.17218.013
Figure 4—figure supplement 1
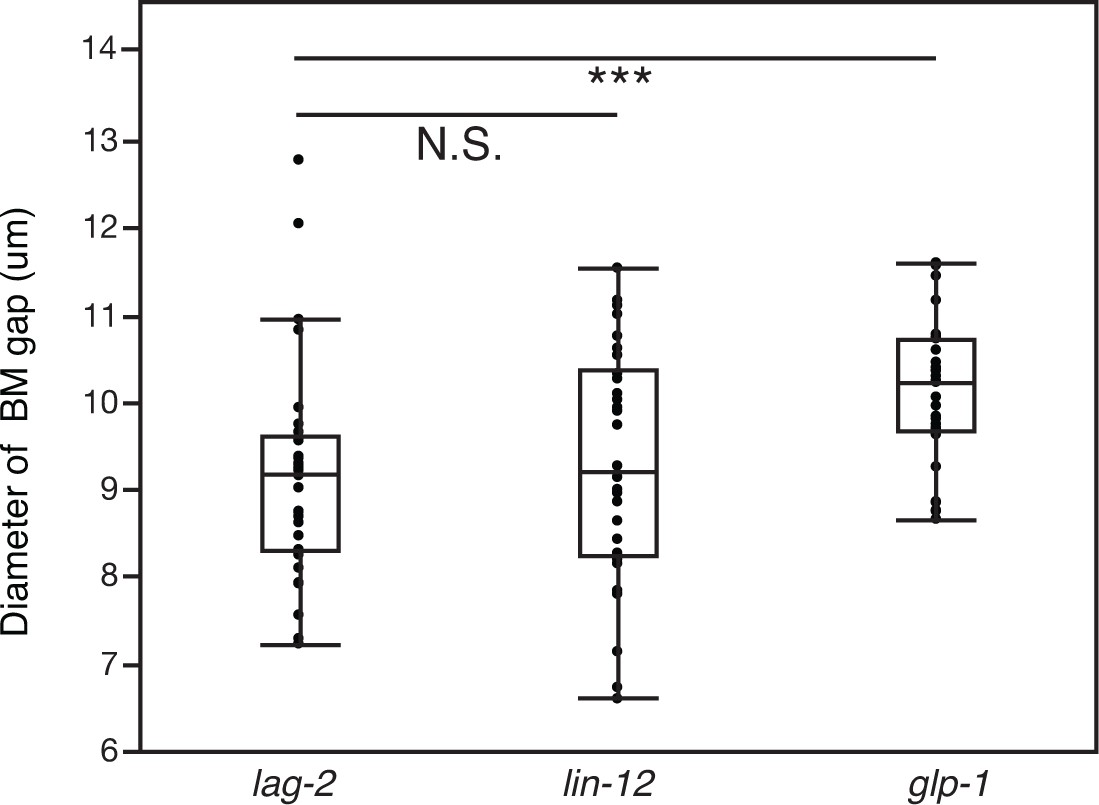
The AC signals through Notch receptor LIN-12 to promote BM sliding.
Quantification of the BM gap size after treatment with uterine-specific lag-2 RNAi, lin-12 RNAi, and glp-1 RNAi (n = 30 each). No significant difference was observed between lag-2 and lin-12 (p>0.05, Wilcoxon rank sum test), but glp-1 knockdown yielded a significantly larger BM gap (*** indicates p<0.001, Wilcoxon rank sum test).
Figure 5
π cell division does not regulate BM sliding.
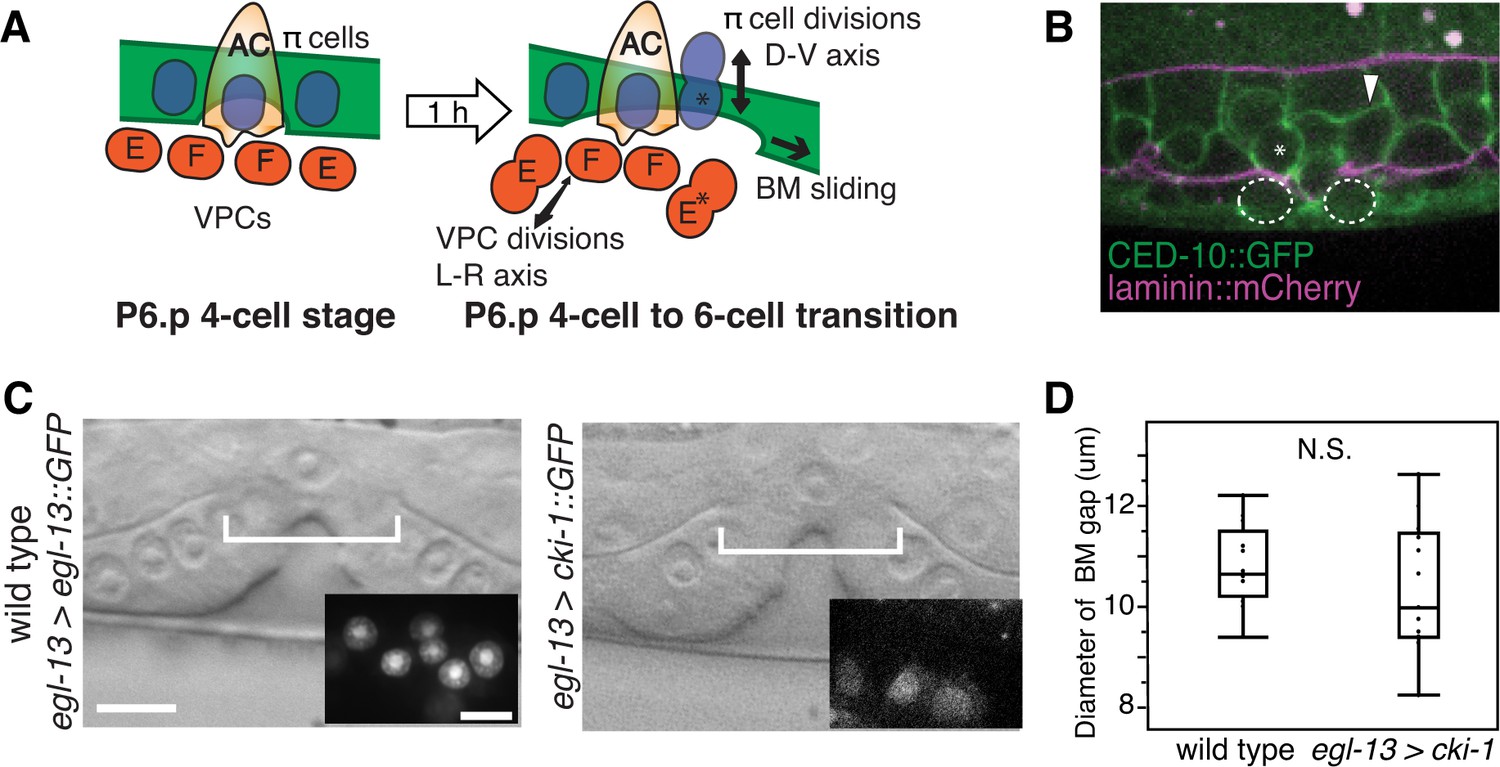
(A) A schematic diagram presenting the hypothesis that uterine π cell (blue) divisions (along the dorsal-ventral axis) are coordinated with divisions of the underlying vulE and vulF cells (red, which divide along the left-right axis) such that the BM (green) is released on both sides when dividing cells lose contact with the BM, allowing it to slide. (B) Fluorescence overlay showing a cell membrane marker (CED-10::GFP, green) of dividing vulE (dashed outline) and adjacent uterine π cells (asterisk denotes a dividing cell and arrowhead a non-dividing cell) with the BM (laminin::mCherry, magenta). (C) A lateral, central plane DIC image of wild type (left) with inset showing divided π cells expressing EGL-13::GFP driven by the egl-13 promoter (egl-13 > egl-13::GFP) had a similar BM gap size (bracket) to an animal expressing CKI-1::GFP in the π cells (right, egl-13 > cki-1::GFP), thus arresting their divisions. (D) Quantification of the BM gap in wild type (n = 15) and egl-13 > cki-1::GFP transgenic animals (n = 13). Only animals in which the π cells failed to divide were included in the analysis. No significant difference was observed (p>0.05, Wilcoxon rank sum test).
-
Figure 5—source data 1
BM gap diameter in wild type vs. egl-13 > cki-1.
- https://doi.org/10.7554/eLife.17218.016
Figure 6
The π cells remain in contact with the BM during and after BM sliding.
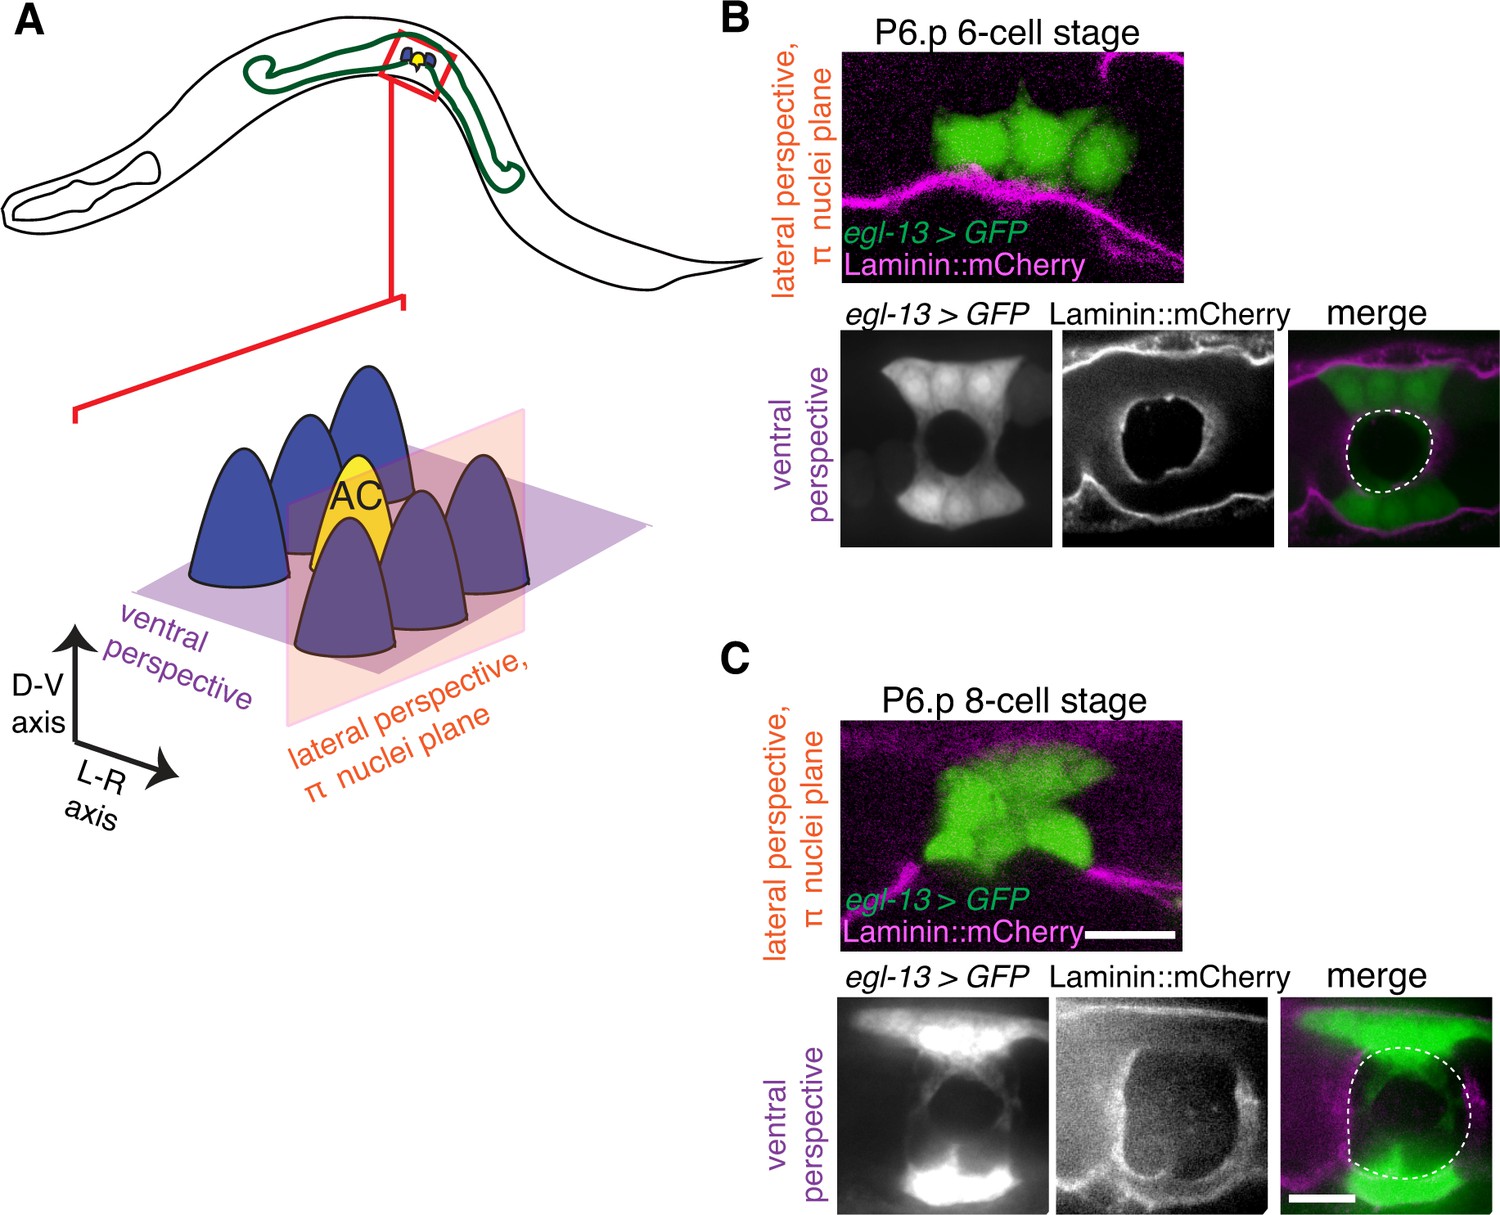
(A) A schematic diagram showing image planes of lateral view (orange) and ventral view (purple) of the π cells in relation to the BM. (B) In the early P6.p 6-cell stage, the π cells (visualized with GFP driven by the egl-13 promoter, green) lie almost completely over BM (magenta). (C) By the P6.p 8-cell stage, the BM slides open farther and the π cells loose BM contact in the central region, but maintain contact on the lateral edges of the cell. Scale bars, 5 μm. In B and C, ventral perspective is a max intensity projection of all z-slices with the BM gap edge and the edge of the BM highlighted in merge (white dashed line).
Figure 7 with 3 supplements
Notch signaling promotes BM sliding through upregulation of the Sec14 family phospholipid transfer protein CTG-1.
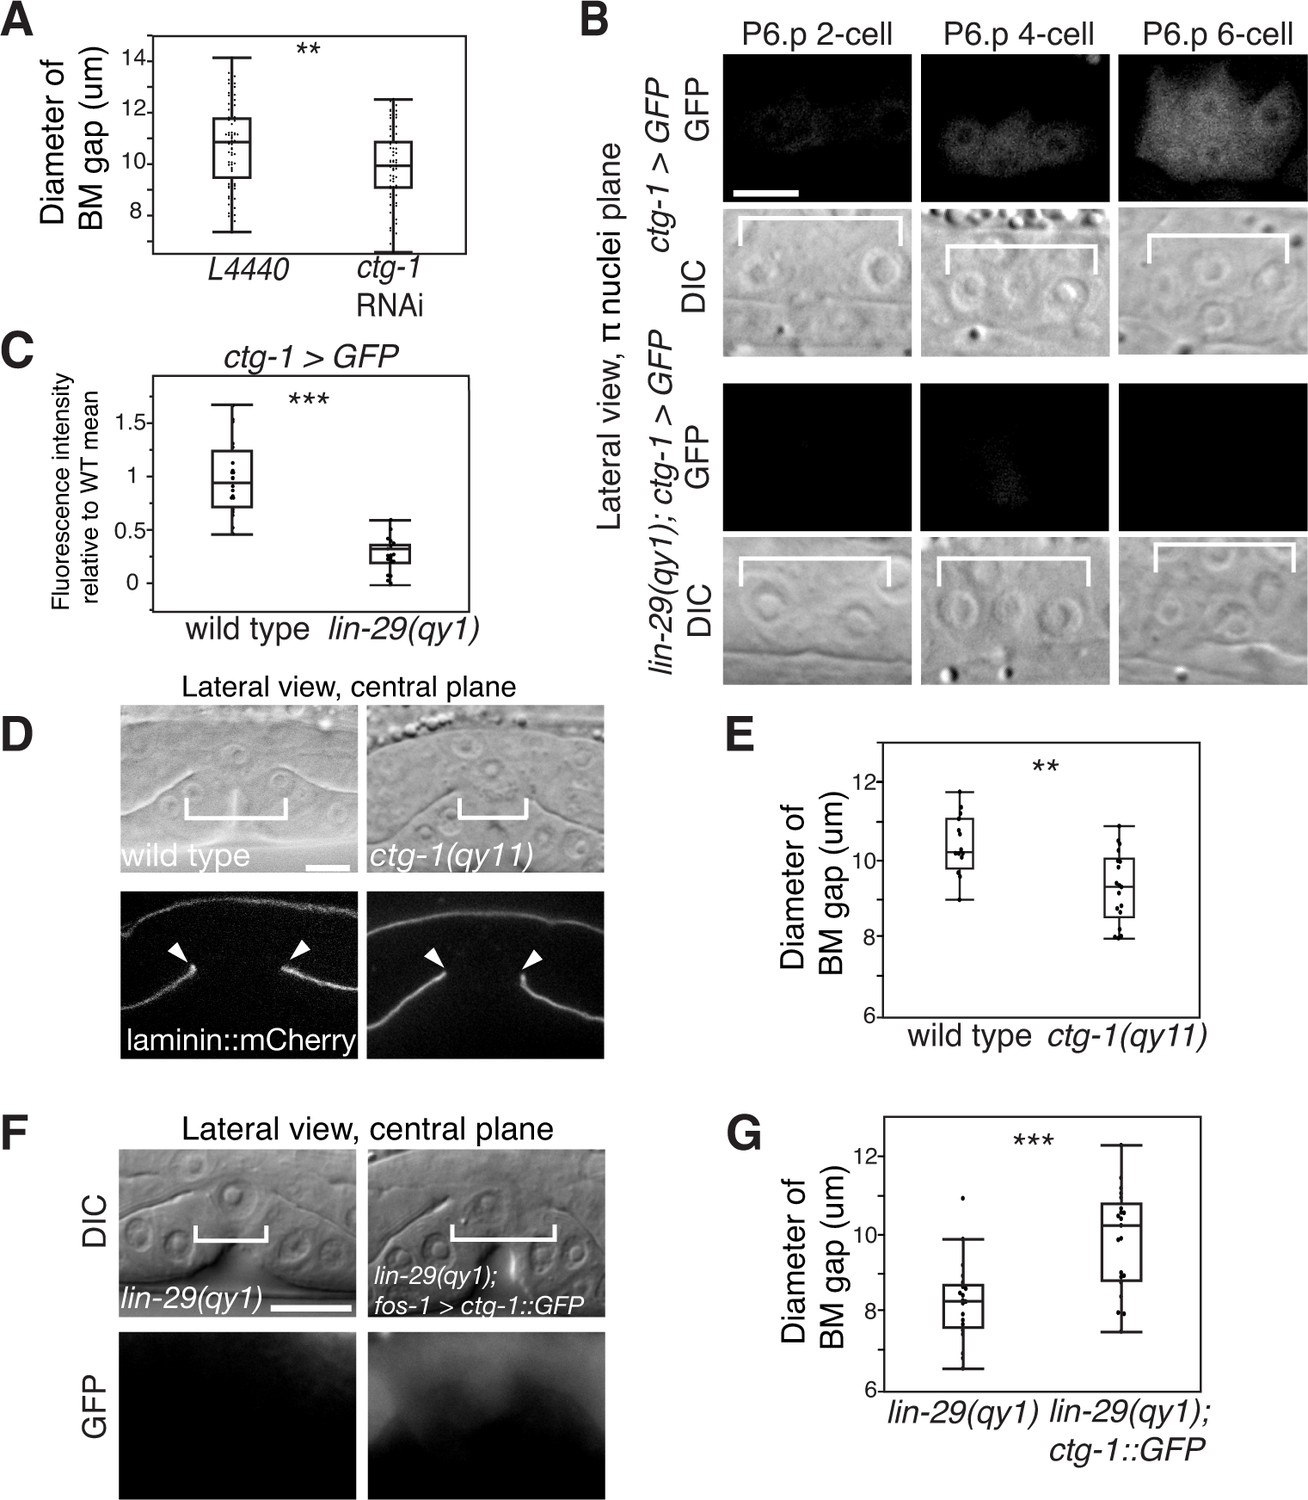
(A) Quantification of uterine-specific RNAi targeting ctg-1. Loss of ctg-1 led to a smaller BM gap at the early L4 (L4440 control, n = 65; ctg-1 RNAi, n = 64). (B) DIC and fluorescence images showing lateral views in the π cell nuclei plane (see Figure 5F) of animals harboring a genomic insertion of GFP at the ctg-1 locus (ctg-1 > GFP). ctg-1 expression is upregulated in the π cells of wild type worms at the time of Notch mediated induction of π cell fate, which coincides with BM sliding (n = >5 animals each stage, top). Expression of ctg-1 was not induced when the π cell fate was disrupted in a lin-29 mutant (n = >5 animals each stage; bottom). Brackets in DIC images denote the location of the π cells in wild type and non-specified ventral uterine boundary cells in lin-29(qy1) animals. (C) Quantification of fluorescence intensity of the GFP from the ctg-1> GFP genomic locus shows reduced expression in lin-29 mutants relative to wild type (n = 20 for each). Values in the plot are normalized to the wild type mean. The asterisks signify a statistically significant difference. (D) A CRISPR-cas9 mediated deletion allele of ctg-1(qy11) (lateral central plane; DIC, top; laminin::mCherry, bottom) has a smaller BM gap (bracket and arrowheads) compared to a wild type animal. (E) Quantification of BM gap diameter in ctg-1(qy11) (n = 18) and wild type (n = 16) animals. (F) Pan-uterine cell expression of CTG-1 (fos-1 > ctg-1::GFP) in a lin-29(qy1) mutant increased BM gap size (brackets). Lateral central plane; DIC, Top; GFP expression, bottom. (G) Quantification of BM gap diameter in lin29(qy1) (n = 21) and lin-29(qy1) rescued with fos-1 > ctg-1::GFP (n = 21). For A, C, E, and G, the asterisks signify a statistically significant difference (** indicates p<0.01 and *** indicates p<0.001, Wilcoxon rank sum test). Scale bars, 5 μm.
-
Figure 7—source data 1
BM gap diameter in L4440 vs. ctg-1 RNAi.
- https://doi.org/10.7554/eLife.17218.019
-
Figure 7—source data 2
Fluorescence intensity of GFP from ctg-1 > GFP in wild type vs. lin-29(qy1).
- https://doi.org/10.7554/eLife.17218.020
-
Figure 7—source data 3
BM gap diameter in wild type vs. ctg-1(qy11).
- https://doi.org/10.7554/eLife.17218.021
-
Figure 7—source data 4
BM gap diameter in lin-29(qy1) vs. lin-29(qy1); fos-1 > ctg-1::GFP.
- https://doi.org/10.7554/eLife.17218.022
-
Figure 7—source data 5
BM gap diameter in L4440 vs. pifk-1, C56A3.8, ZC8.6, Y75B8A.24, and ppk-1 RNAi.
- https://doi.org/10.7554/eLife.17218.023
Figure 7—figure supplement 1
LAG-1 binding sites in the ctg-1 promoter and ctg-1(qy11) schematics.
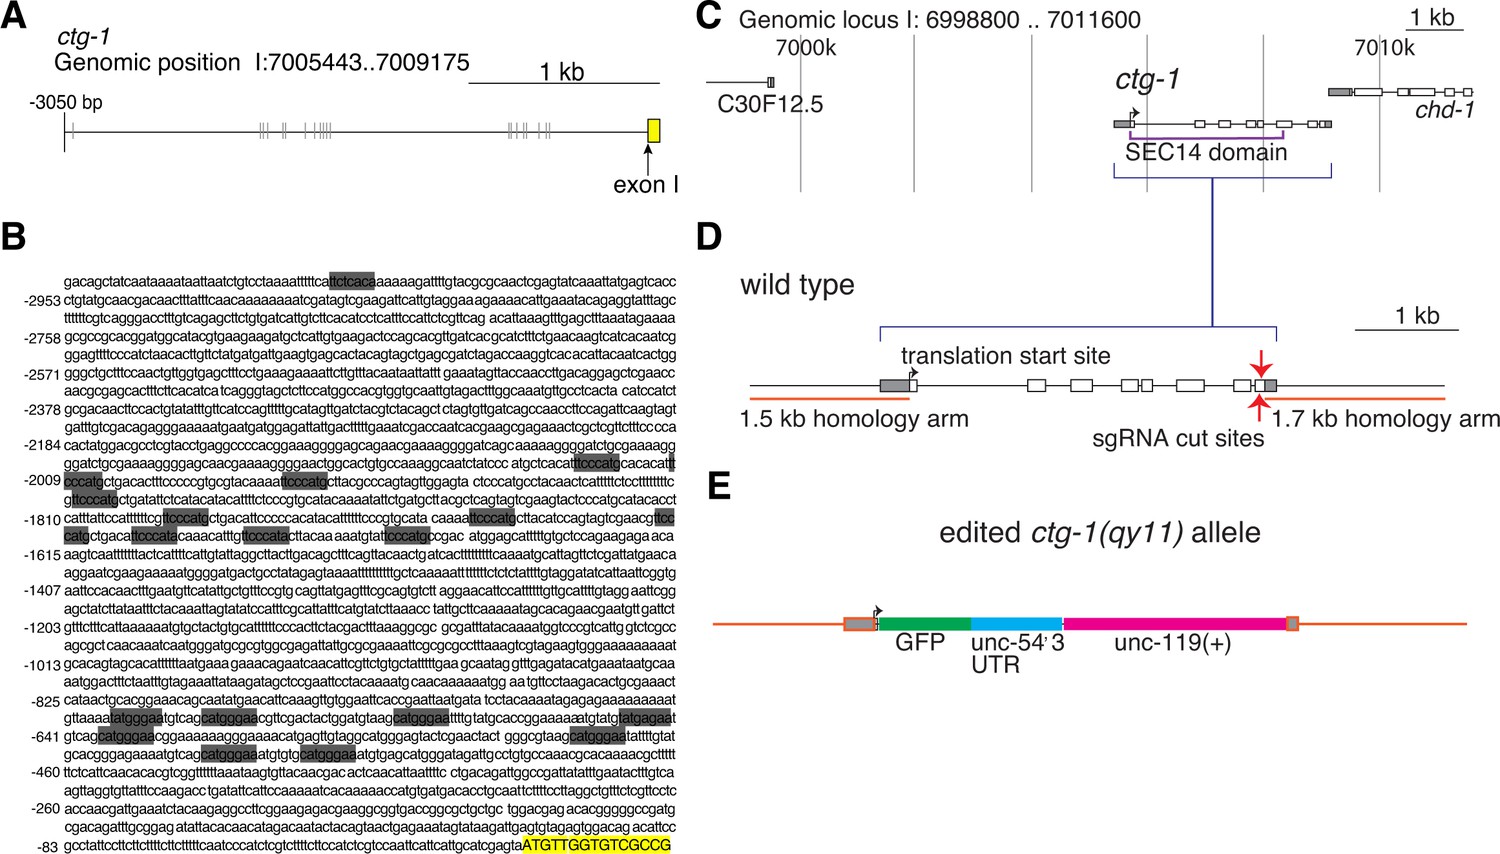
(A) A schematic of approximately 3 kb of the 5’ regulatory sequence of ctg-1. (B) The DNA sequence of approximately 3 kb of the 5’ regulatory sequence of ctg-1. In both (A) and (B), gray bars highlight LAG-1 binding site consensus sequences (YRTGRGAA) and the yellow bar indicates the start of ctg-1 exon I. (C) A schematic of the ctg-1 genomic locus showing the coding region corresponding to the Sec14 domain (purple brackets). (D) A schematic of the ctg-1 gene with the homology arms used for CRISPR-cas9 repair vector (orange bars) and sgRNA cut site (red arrows). Gray regions represent UTR sequences. (E) A schematic of the edited ctg-1(qy11) GFP knock-in allele.
Figure 7—figure supplement 2
CTG-1::GFP expression.
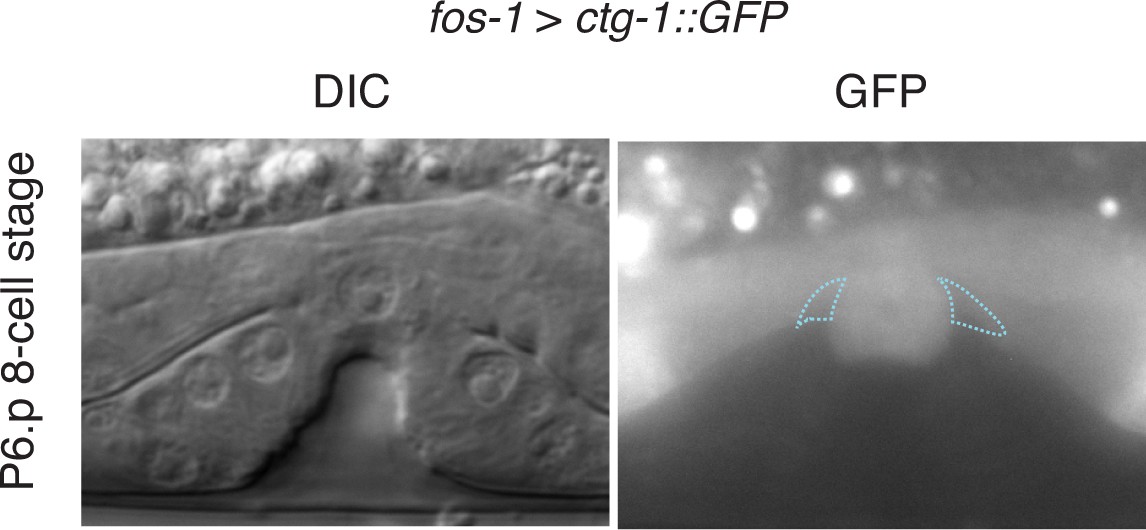
Pan-uterine expression of CTG-1::GFP (fos-1 > ctg-1::GFP) translational fusion at the P6.p 8-cell stage (right) with DIC (left) in wild type worms includes the π cells (blue dashed outlines).
Figure 7—figure supplement 3
PI4-kinase PIFK-1 is required for BM sliding.
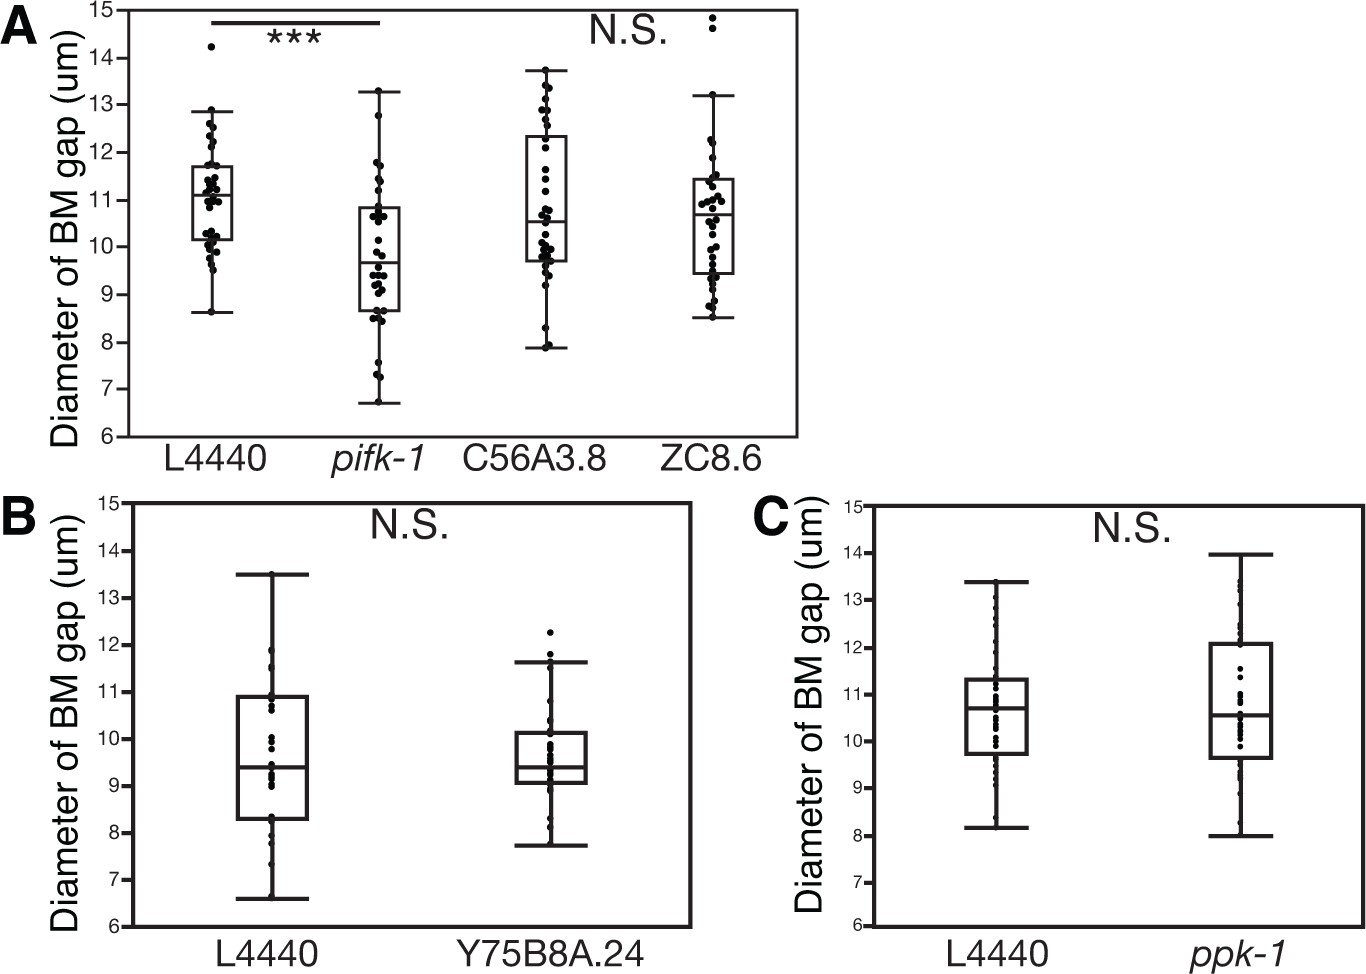
(A) Quantification of the BM gap size after treatment with L4440 control and uterine-specific pifk-1 (yeast Pik1 and vertebrate PI4KIIIβ) RNAi, C56A3.8 (vertebrate PI4KIIα/β) RNAi, and ZC8.6 (vertebrate PI4KIIα/β) RNAi (n = 34 each), (B) Quantification of the BM gap size after treatment with L4440 control and uterine-specific Y75B8A.24 (vertebrate PI4KIIIa) (n = 34 each) RNAi, and (C) Quantification of the BM gap size after treatment with L4440 control and uterine-specific ppk-1 (vertebrate type I PIP 5-Kinase) RNAi (n = 40 each) revealed that only pifk-1 is required for BM sliding. (*** indicates p<0.001 Wilcoxon rank sum test, N.S. indicates no significant difference (p>0.05), Wilcoxon rank sum test).
Figure 8 with 4 supplements

LIN-29/CTG-1 restricts dystroglycan (DGN-1) levels and trafficking at the π cell-BM interface.
(A) A functional translational fusion of the BM-receptor DGN-1 (DGN-1::GFP, top) reveals that more DGN-1 localizes on the surface of the ventral uterine cells (blue dashed outlines) at the edges of the BM gap in a lin-29 mutant compared to a wild type animal. Enlargement of boxes in top images (bottom) shows regions (red bars) where DGN-1 levels were measured in (B). (B) Quantification of the fluorescence intensity of a functional DGN-1::GFP translational reporter (dgn-1 > dgn-1::GFP) at the BM gap boundary in the π cells in wild type and lin-29(qy1) animals (n = 22 for each). Values in plot are normalized to the wild type mean (** indicates p<0.01, Wilcoxon rank sum test). (C) Quantification of the fluorescence intensity of a dgn-1 transcriptional reporter in wild type and lin-29(qy1) animals (n = 21 for each) revealed no significant difference in expression levels (p>0.05 Wilcoxon rank sum test). Values in plot are normalized to the wild type mean. (D) Uterine-specific dgn-1 RNAi rescued the BM gap (brackets) defect in a lin-29(qy1) background expressing BM and AC reporters (laminin::GFP and cdh-3 > mCherry::PLCδPH). (E) BM gap diameters in uterine-specific RNAi knockdown of dgn-1 (n = 50) and L4440 control (n = 63) in the lin-29 mutant background (*** indicates p<0.001, Wilcoxon rank sum test). (F) Fluorescence recovery after photobleaching (FRAP) of a 1.0-µm region of DGN-1::GFP along the basal surface of the uterine π cells during the late the early P6.p 6-cell stage (time of BM sliding) in wild type and lin-29(qy1) mutant animals. DGN-1::GFP recovers more quickly in the lin-29 mutant. (G) Graph reports DGN-1::GFP recovery in wild type and lin-29(qy1) mutants (n = 9 animals for each). Error bars represent standard deviation and the asterisks signify a statistically significant difference at comparable time points (p<0.05 Student’s t-test). T1/2 denotes time to recovery of 50% of initial fluorescence signal. All images lateral, central plane. Scale bars, 5 μm.
-
Figure 8—source data 1
Fluorescence intensity of DGN-1::GFP in wild type vs. lin-29(qy1).
- https://doi.org/10.7554/eLife.17218.028
-
Figure 8—source data 2
Fluorescence intensity of GFP from a dgn-1 > GFP transcriptional reporter in wild type vs. lin-29(qy1) animals.
- https://doi.org/10.7554/eLife.17218.029
-
Figure 8—source data 3
BM gap diameter in L4440 vs. dgn-1 RNAi in lin-29(qy1) background.
- https://doi.org/10.7554/eLife.17218.030
-
Figure 8—source data 4
Fluorescence intensity recovered over time in DGN-1::GFP FRAP.
- https://doi.org/10.7554/eLife.17218.031
-
Figure 8—source data 5
Fluorescence quantifications for pat-3 transcriptional and translational markers.
- https://doi.org/10.7554/eLife.17218.032
-
Figure 8—source data 6
Fluorescence intensity recovered over time in PAT-3::GFP FRAP.
- https://doi.org/10.7554/eLife.17218.033
-
Figure 8—source data 7
Fluorescence intensity of DGN-1::GFP in wild type vs. lin-29(qy1) over vulD (past region of BM sliding).
- https://doi.org/10.7554/eLife.17218.034
-
Figure 8—source data 8
RAB-7 and DGN-1 co-localization in wild type vs. lin-29(qy1).
- https://doi.org/10.7554/eLife.17218.035
-
Figure 8—source data 9
Fluorescence intensity of moesinABD::mCherry in wild type vs. lin-29(qy1).
- https://doi.org/10.7554/eLife.17218.036
Figure 8—figure supplement 1
Integrin expression and localization are unaffected by LIN-29/CTG-1.
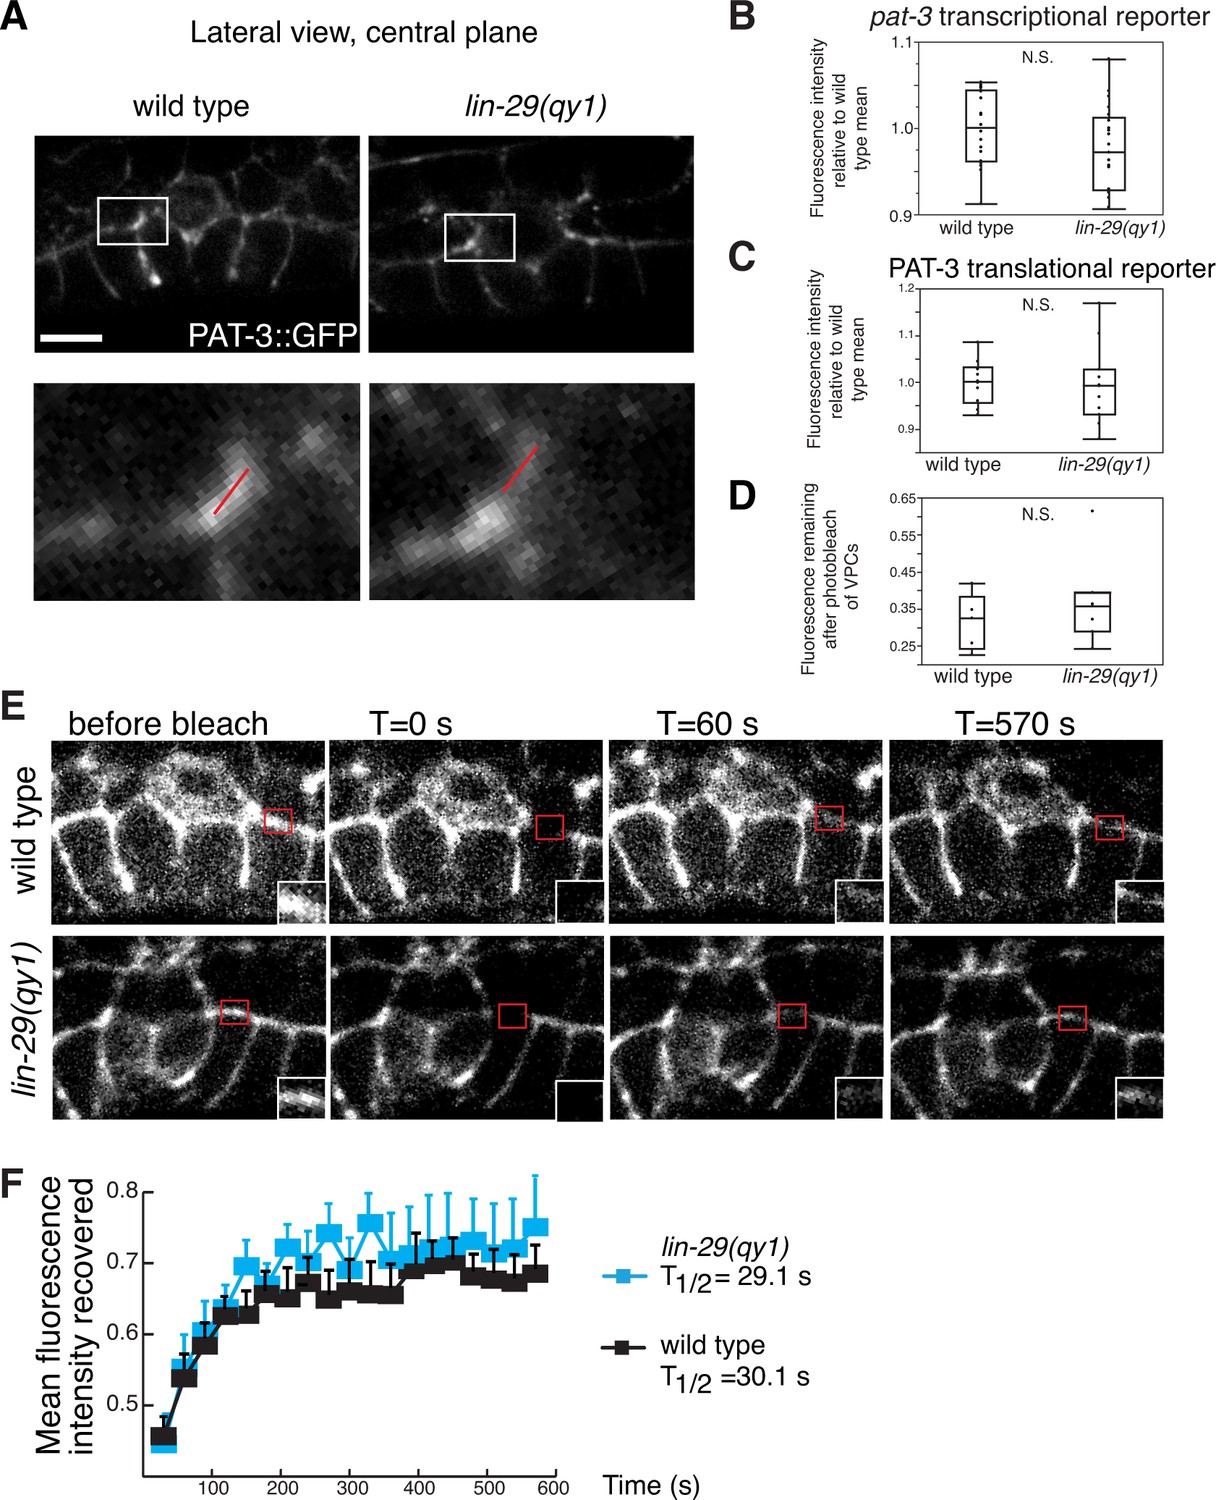
(A) An integrin translational reporter (PAT-3::GFP) localized similarly at the edges of the BM gap in lin-29 mutant (right) compared to a wild type (left) animal. Enlargement of boxes in top images (bottom) shows regions in π cells (white bars) where PAT-3::GFP levels were measured in (C). (B) Quantification of the fluorescence intensity of a pat-3 transcriptional reporter in wild type and lin-29(qy1) animals (n = 21 for each) revealed no significant difference in expression levels (p>0.05 Wilcoxon rank sum test). Values in the plot are normalized to the wild type mean. (C) Quantification of the fluorescence intensity of a PAT-3 translational reporter at the BM gap boundary in the π cells in wild type and lin-29(qy1) animals (n = 10 for wild type, 11 for lin-29) revealed no significant difference in expression levels (p>0.05 Wilcoxon rank sum test). Values in the plot are normalized to the wild type mean. (D) Quantification of the fluorescence intensity of a PAT-3 translational reporter at the BM gap boundary in the π cells in which GFP signal was bleached from the VPCs and remaining fluorescence intensity was measured (n = 5 for wild type, 7 for lin-29) revealed no significant difference is expression levels (p>0.05 Wilcoxon rank sum test). (E) Fluorescence recovery after photobleaching (FRAP) of a 1.0-µm region of PAT-3::GFP along the basal surface of the uterine π cells during the early P6.p 6-cell stage (time of BM sliding) in wild type and lin-29(qy1) mutant animals revealed similar rates of PAT-3::GFP recovery. (F) Graph reports PAT-3::GFP recovery in wild type (n = 13) and lin-29(qy1) mutants (n = 12). Error bars represent standard deviation. There was no significant difference in PAT-3 recovery at comparable time points (p>0.05 Students t-test). T1/2 denotes time to recovery of 50% of initial fluorescence signal. Scale bars, 5 μm.
Figure 8—figure supplement 2
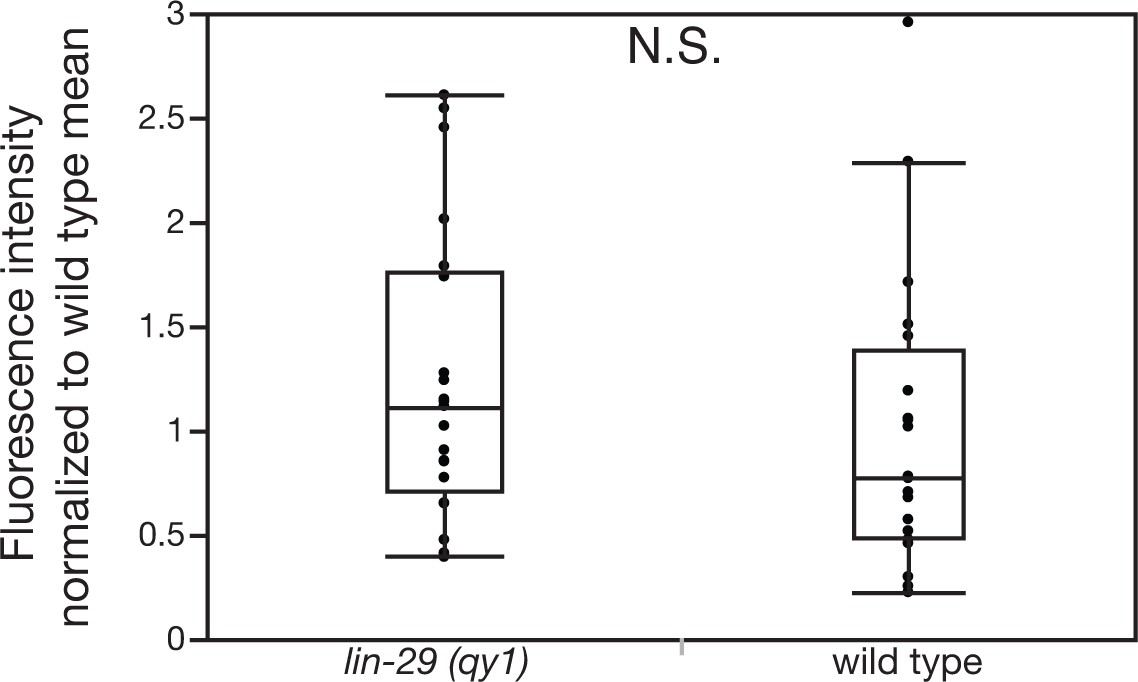
Loss of LIN-29/CTG-1 does not affect dystroglycan (DGN-1) localization in regions beyond the BM gap interface.
Quantification of the fluorescence intensity of a DGN-1 translational reporter (dgn-1 > dgn-1::GFP) at a 1 µm region in uterine cells opposite vulD in wild type and lin-29(qy1) animals (n = 20 each). No significant difference was observed (p>0.05, Wilcoxon rank sum test).
Figure 8—figure supplement 3
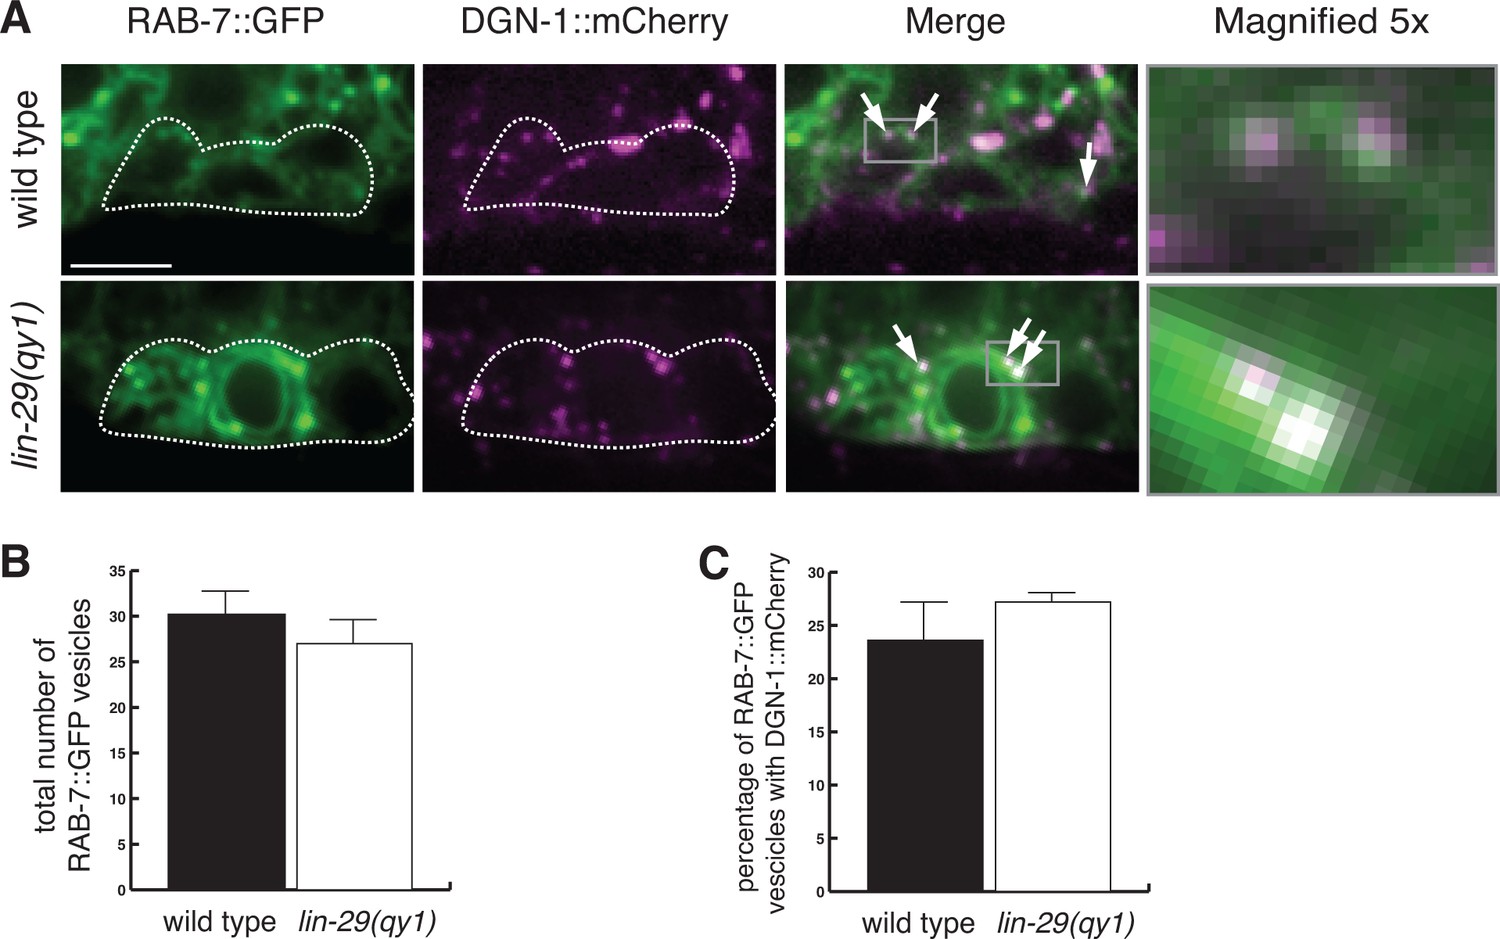
Loss of LIN-29/CTG-1 does not affect DGN-1 localization to late endosomes.
(A) RAB-7::GFP (green) and DGN-1::mCherry (magenta) co-localize to a similar degree in wild type (left) and lin-29(qy1) (right) mutants. White dashed outline indicates the position of the π cells. Arrows indicate vesicles with co-localization. Gray boxes in merge indicate area of magnification (far right panels). Scale bar, 5 µm. (B) Quantification of the total number of RAB-7::GFP marked vesicles indicate a similar number of late endosomes in wild type and lin-29(qy1) (n = 8 each, error bars SEM, not significant (p>0.05, Student’s t-test)). (C) Quantification of co-localization of DGN-1::mCherry and RAB-7::GFP in wild type and lin-29(qy1) (n = 8 each, error bars SEM, not significant (p>0.05, Student’s t-test.)).
Figure 8—figure supplement 4
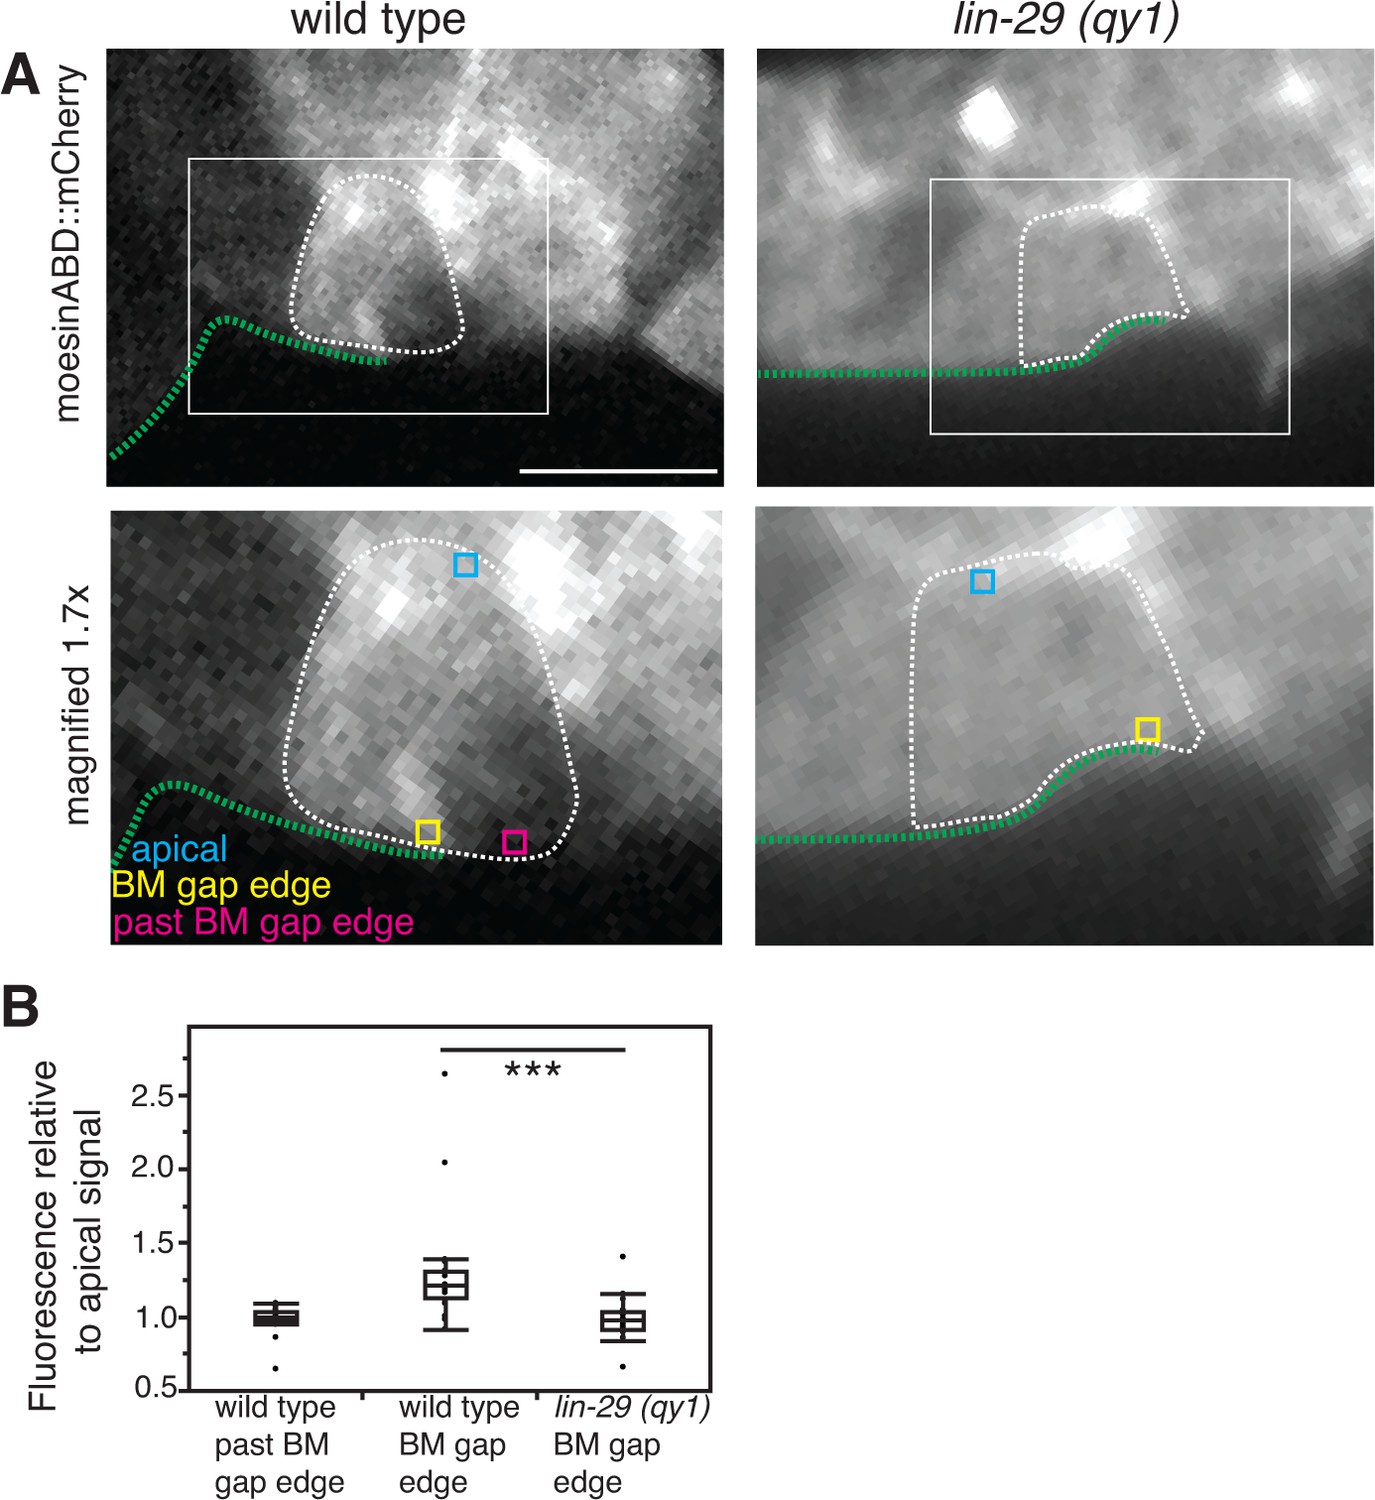
F-actin is reduced at the cell-BM interface with loss of LIN-29/CTG-1.
(A) moesinABD::mCherry expression in wild type (left) and lin-29(qy1) (right) shows that decreased levels of F-actin at the BM gap edge accompany reduced BM sliding. White boxes indicate areas magnified in lower panels. In lower panels, regions of interest are highlighted: yellow indicates a region of the basal surface on the BM gap edge, blue indicates a region on the apical surface of the cell, and magenta indicates a region of the basal surface beyond the boundary of the sliding BM. Scale bar, 5 μm. (B) Quantification of moesinABD::mCherry expression in wild type and lin-29(qy1) (n=20 each). Measurements were made on a 0.3-µm x 0.3-µm region as indicated by the boxes in the lower panels of (A). Fluorescence intensities are normalized to the expression level of a region along the apical membrane in the same cell. *** indicates p<0.001 Wilcoxon rank sum test.
Figure 9
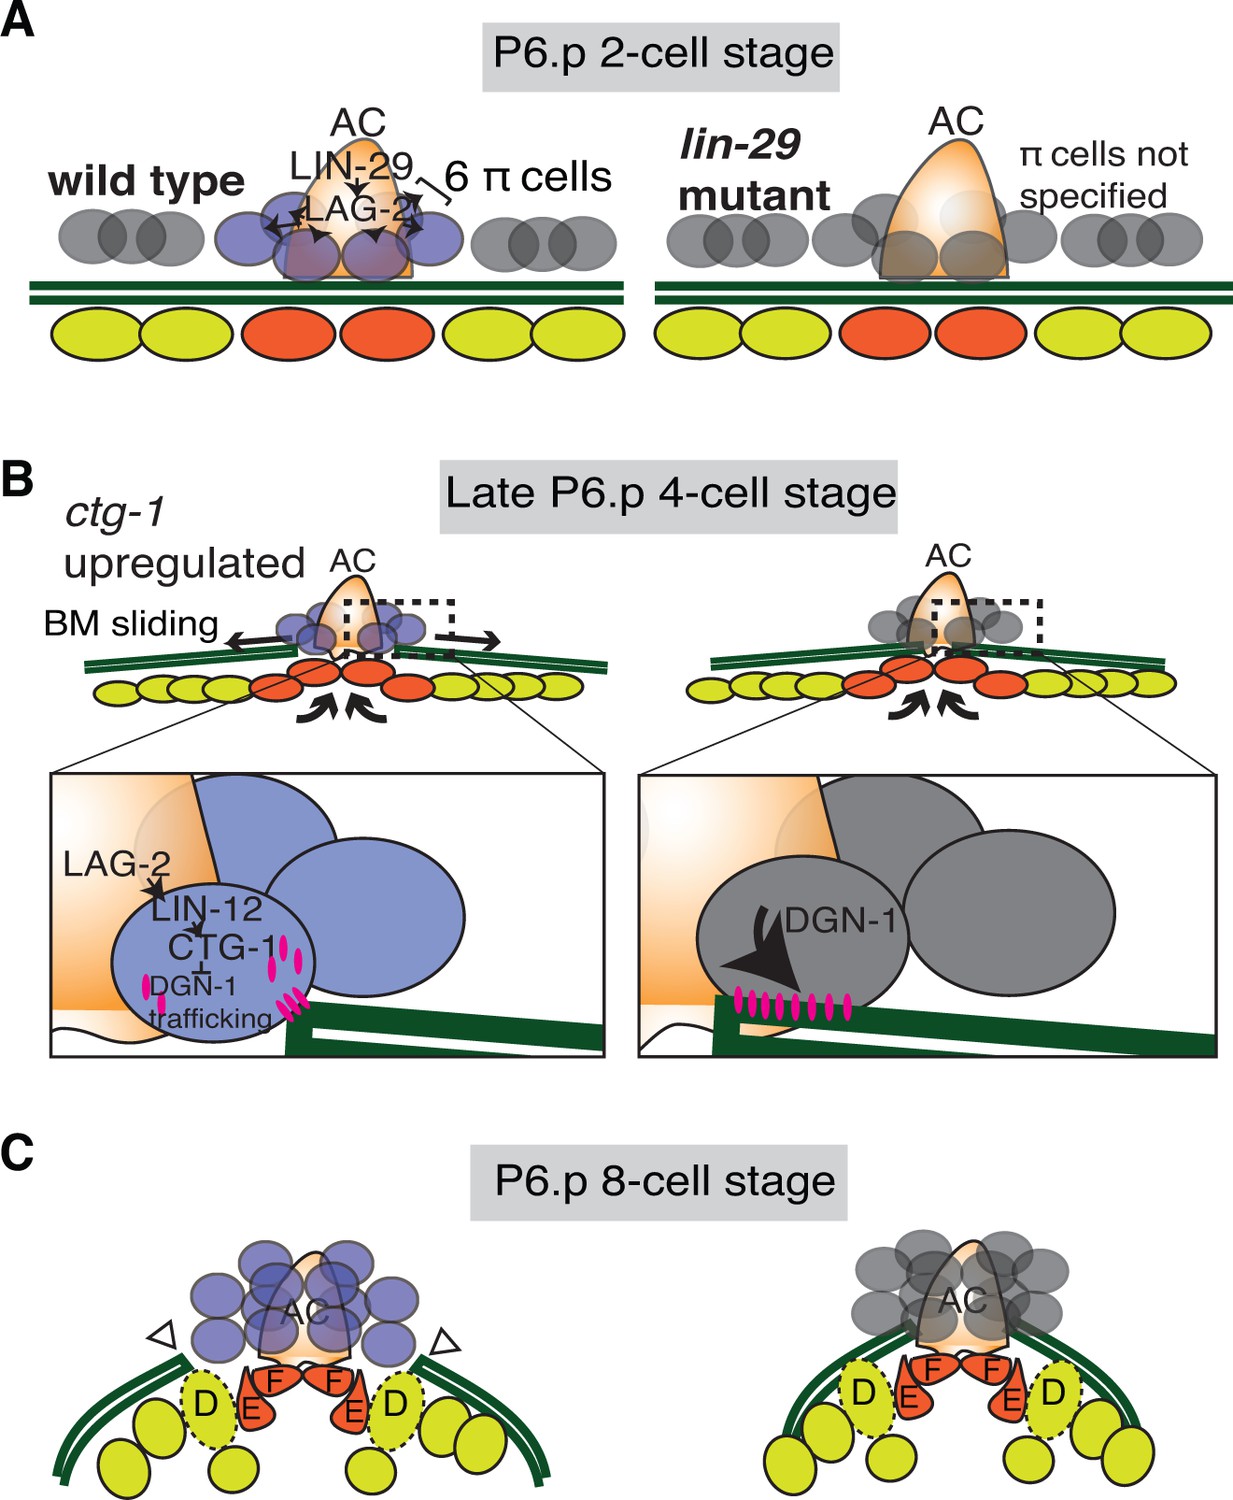
Summary of uterine boundary cell regulation of BM sliding.
(A) A schematic diagram of the mid L3 stage in wild type (left). The Kruppel-family EGR protein LIN-29 acts in the AC to maintain LAG-2 (Notch ligand) expression, which induces the π cell fate in the six VU cells that contact the AC. This specification event fails to occur in lin-29 mutants (right). (B) During the late L3 stage after AC invasion, invagination, growth, and division of the vulval cells generates forces that promote BM sliding in wild type animals (left). Within the π cells (inset), LAG-2 binding of LIN-12(Notch) activates transcriptional upregulation of ctg-1, which encodes a Sec14-GOLD phospholipid transfer protein. CTG-1 restricts BM receptor DGN-1 (dystroglycan) trafficking to the cell-BM interface of the π cells, thus decreasing their adhesion to the BM and allowing BM sliding. In lin-29 mutants (right) ctg-1 expression is not upregulated in the unspecified ventral uterine descendant cells, and more DGN-1 is trafficked to the cell-BM interface, maintaining cell adhesion to the BM and preventing sliding. (C) At the early-to-mid L4, the BM gap edges have slid (arrowheads) and stabilize over the vulval D cells and at the edges of uterine π cells in wild type animals (left). In contrast, the BM does not slide in lin-29 mutants and maintains its position adjacent to the AC (right).
Author response image 1
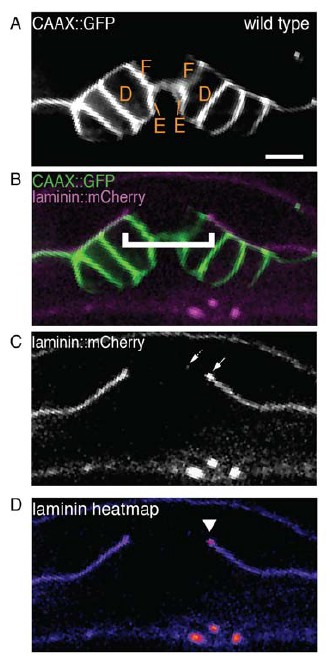
(A) and (B) Are the image panels from the manuscript submitted on August 23, 2016.
(C) The single-channel image of laminin::mCherry showing the BM gap edge (solid arrow) and a puncta of laminin signal to the left (dotted arrow) that is discontinuous from the rest of the BM. D) A heatmap of the laminin::mCherry fluorescence showing an increase in laminin at the previously identified BM gap edge (arrowhead).
Additional files
-
Supplementary file 1
Presumptive Notch targets screened by RNAi for BM sliding defects.
- https://doi.org/10.7554/eLife.17218.042
-
Supplementary file 2
Sec14 family genes in the C. elegans genome.
- https://doi.org/10.7554/eLife.17218.043
Download links
A two-part list of links to download the article, or parts of the article, in various formats.
Downloads (link to download the article as PDF)
Open citations (links to open the citations from this article in various online reference manager services)
Cite this article (links to download the citations from this article in formats compatible with various reference manager tools)
Boundary cells restrict dystroglycan trafficking to control basement membrane sliding during tissue remodeling
eLife 5:e17218.
https://doi.org/10.7554/eLife.17218


