Human intracranial recordings link suppressed transients rather than 'filling-in' to perceptual continuity across blinks
- The Hebrew University of Jerusalem, Israel
- New York University, United States
- Weizmann Institute of Science, Israel
- Hofstra Northwell School of Medicine, United States
- The Feinstein Institute for Medical Research, United States
- Max Planck Institute for Brain Research, Germany
- School of Medicine, New York University, United States
- Columbia University College of Physicians and Surgeons, United States
- Nathan Kline Institute, United States
Figures
Figure 1 with 1 supplement

Experimental design.
Two blocks of the experimental task are illustrated. All stimuli are presented for 1 s each. The block on the left is preceded with an auditory instruction to execute voluntary blinks about once a second. The block on the right is interleaved with experimenter-induced black gaps (at 350, 550 or 750 ms following trial-onset). See Figure 1—figure supplement 1 for individual latency and duration distributions of gaps, voluntary blinks and spontaneous blinks.
Face photographs: Owen Lucas. Available on Flickr under the Public Domain Mark 1.0 https://creativecommons.org/publicdomain/mark/1.0/). https://www.flickr.com/photos/144006675@N05/27487033282. https://www.flickr.com/photos/owen_lucas_photography/7454467582. https://www.flickr.com/photos/owen_lucas_photography/7454436922. https://www.flickr.com/photos/owen_lucas_photography/8102080226. Accessed on August 2016.
Figure 1—figure supplement 1
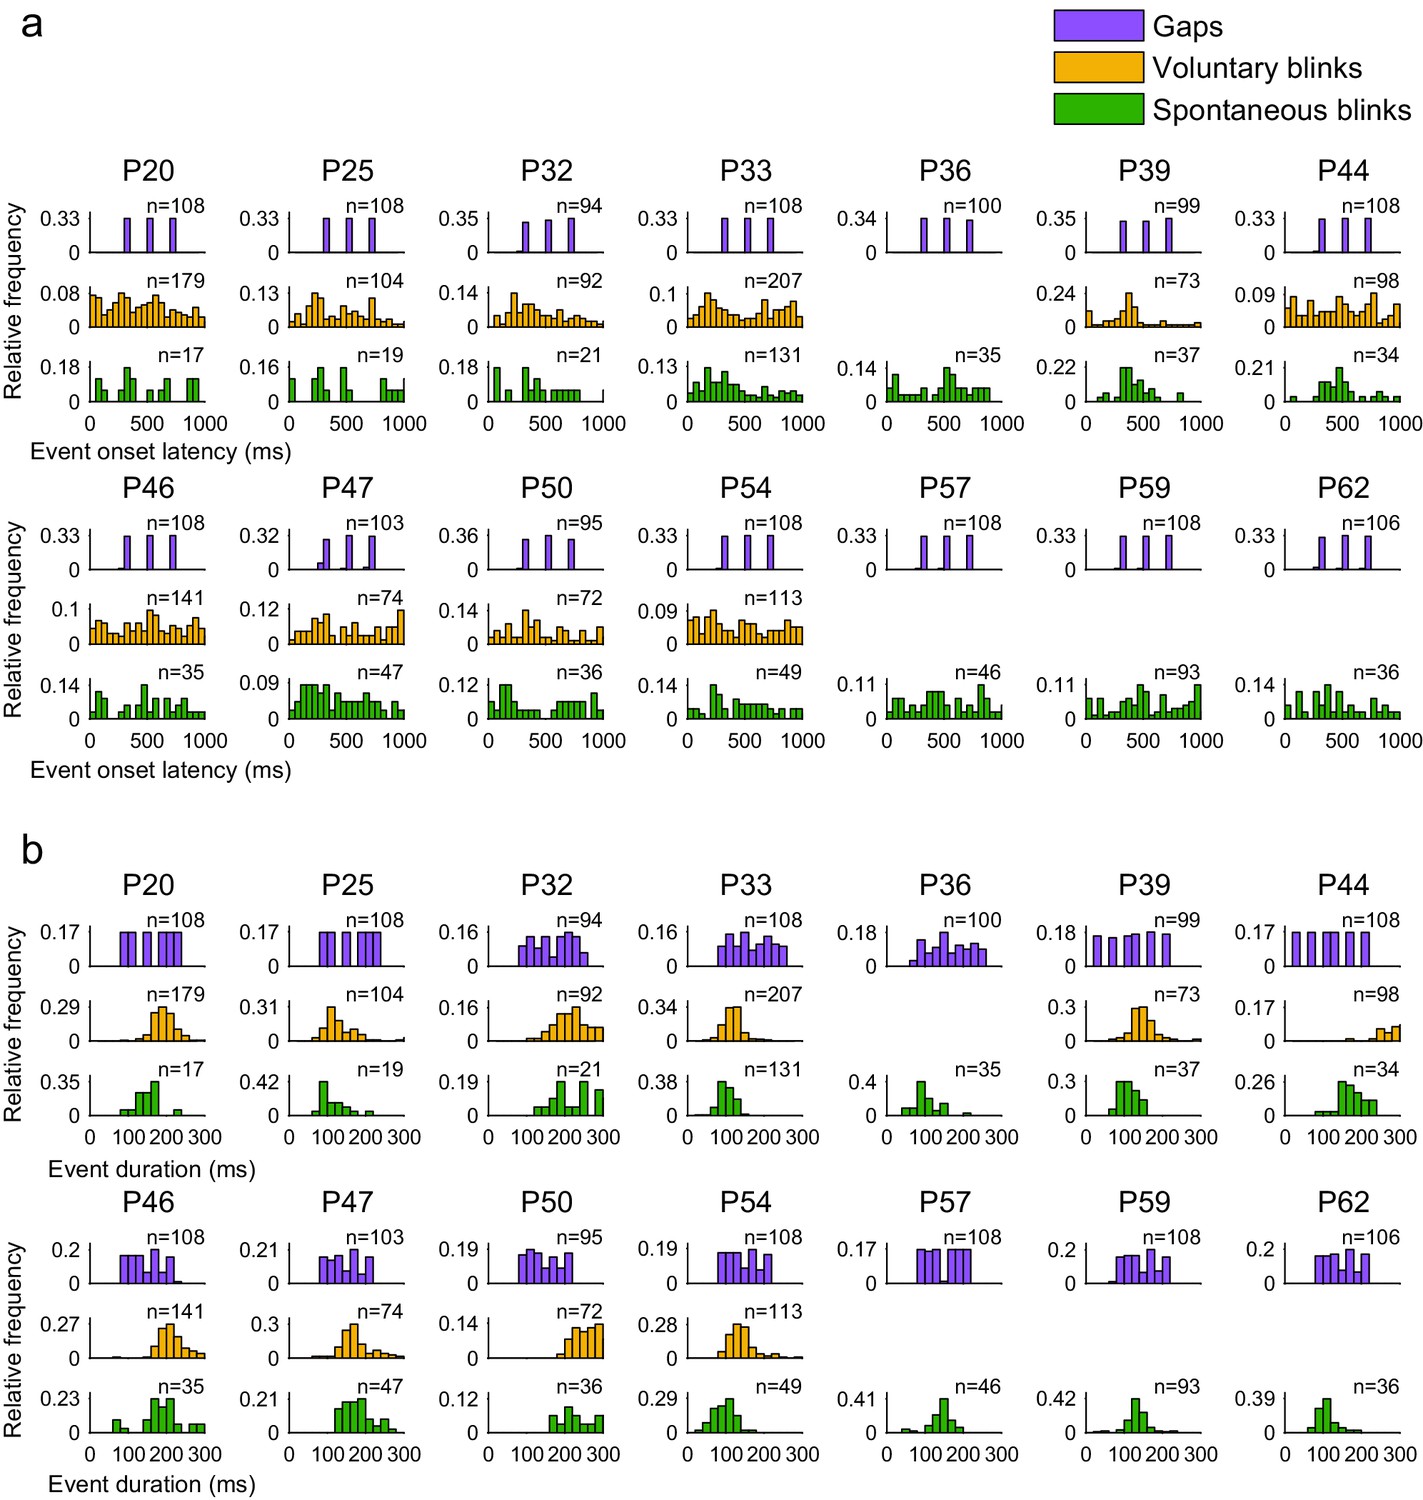
Onset latencies and durations of gaps, voluntary and spontaneous blinks.
Each histogram triplet presents data from an individual patient. (a) Onset latencies, the time from the appearance of a new object image to its disappearance due to a gap or a blink, in milliseconds. (b) Event duration, time from image disappearance to image reappearance, in milliseconds.
Figure 2
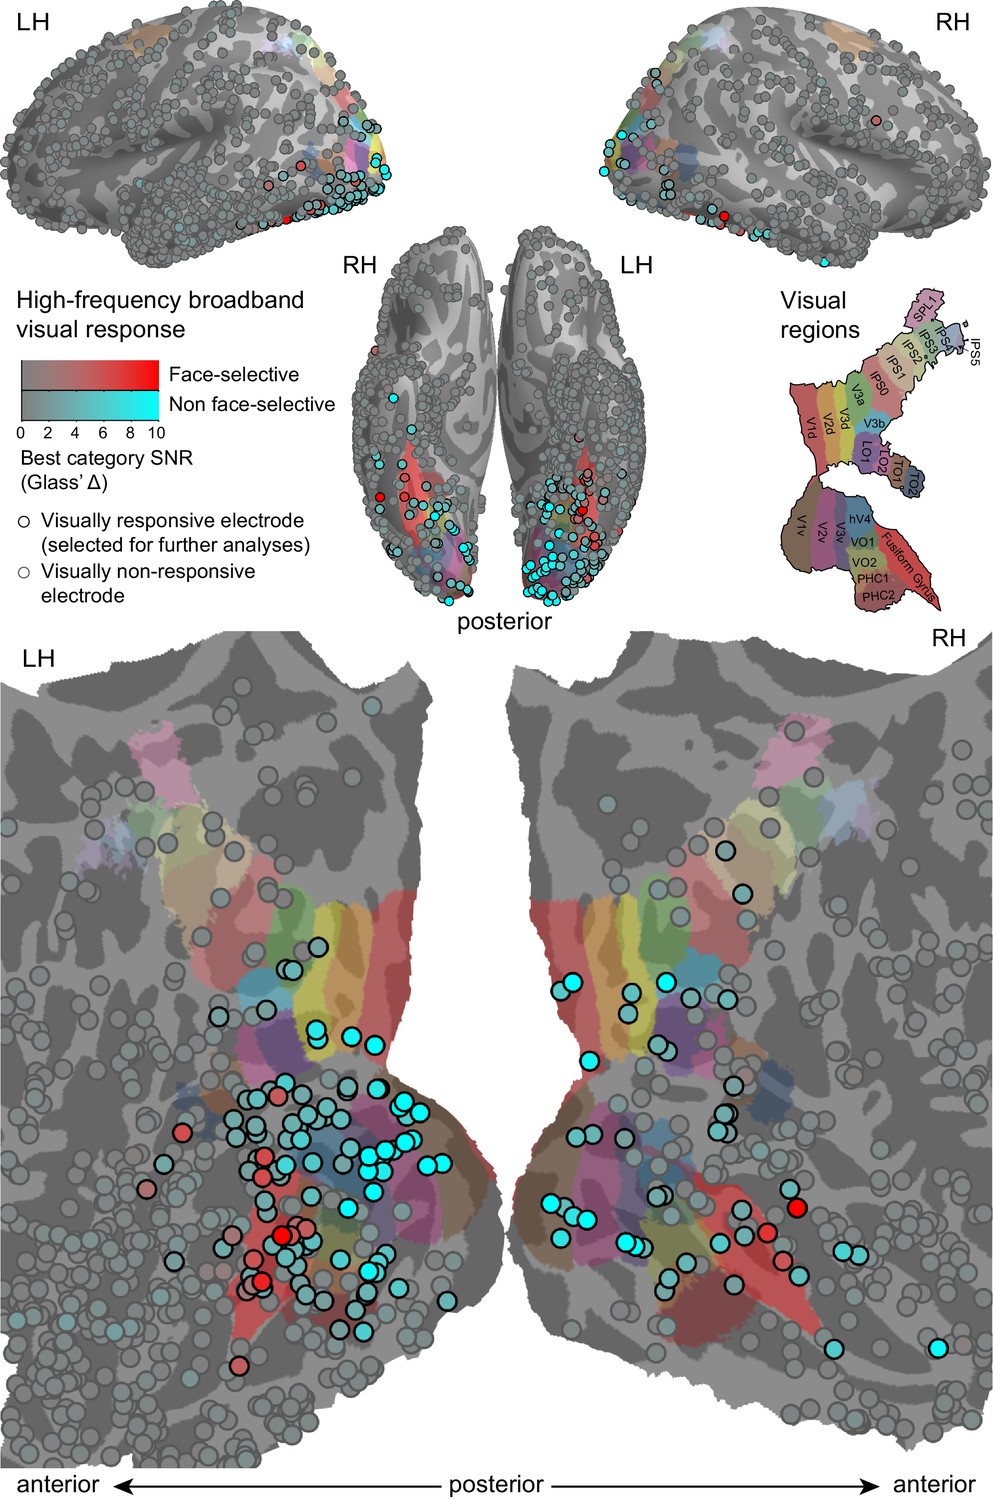
High-frequency broadband (HFB, 70–150 Hz) visual responses to object images.
HFB responses from all participants, sampled from 50 to 350 ms following the transition from one object image to another, compared with the HFB activity sampled during inter-block blanks are presented. Each circle marks the location of one electrode on a common cortical template. The response strength for each electrode's optimal (maximally responding) category is measured in standard deviations of the baseline (Glass' Δ) and is color-coded as the circles' face color saturation. Electrodes showing significant face-selectivity are presented in a red hue and the others are presented in a cyan hue. Electrodes that passed the inclusion criteria for the subsequent analyses (corrected significance < 0.05 and an effect size of at least two standard deviations) are encircled in black. The colored labels on the cortical surface were derived from a surface-based atlas of retinotopic areas (Wang et al., 2014) and from Destrieux Atlas (Destrieux et al., 2010) as implemented in FreeSurfer 5.3 (Fusiform gyrus, in red).
-
Figure 2—source data 1
Individual electrode data for Figure 2.
Each row describes an electrode, with its SUMA standardized mesh nearest vertex (index, hemisphere and MNI coordinates), its FWE-corrected p-value for stimuli HFB greater than baseline HFB, best responding category, the effect-size of the best responding category (in baseline standard deviations), whether the electrode was selected for further analyses and face-selectivity (uncorrected) p-value.
- https://doi.org/10.7554/eLife.17243.007
Figure 3 with 1 supplement
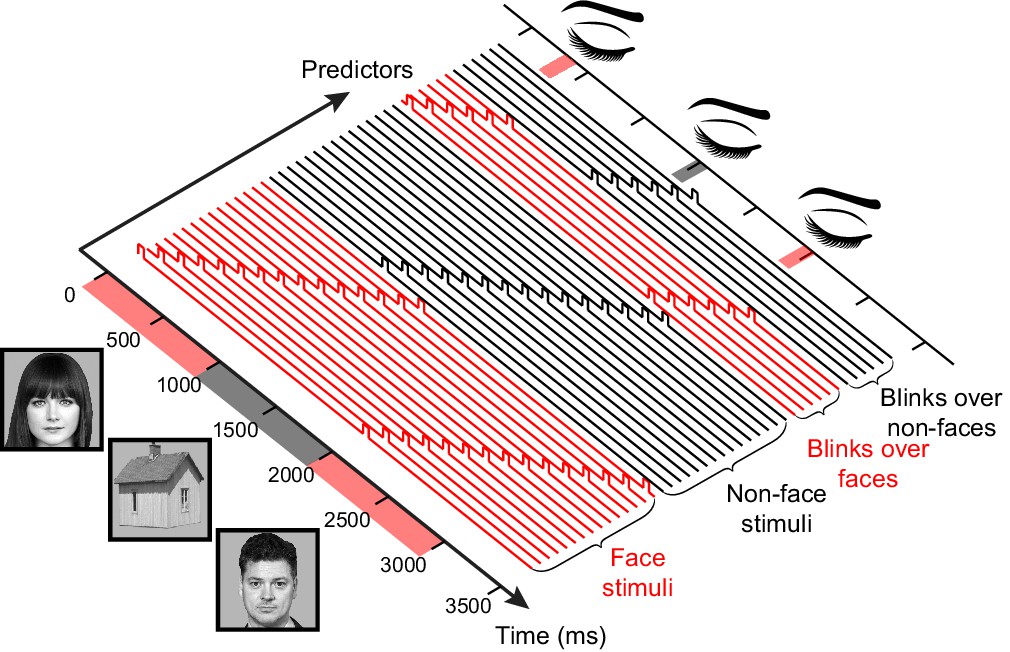
A schematic illustration of the general linear model (GLM) design matrix used in the deconvolution of the neural responses.
The observed time series in each electrode is modeled as a linear sum of overlapping responses triggered by the displayed stimuli and by the different interrupting events – gaps, voluntary blinks and spontaneous blinks (for simplicity, only a single set of blinks predictors appears in the illustration). Each response is composed of a sequence of non-overlapping unit pulses (4 ms-wide pulses were used for the actual 250 Hz HFB timecourse, here a less detailed, 10 Hz model is presented). Note that in this example both the stimuli and the interruptions are modeled separately for face and non-face trials. See Figure 3—figure supplement 1 for a demonstration of the advantage of this approach over standard-event related averaging.
Face photographs: Owen Lucas. Available on Flickr under the Public Domain Mark 1.0 https://creativecommons.org/publicdomain/mark/1.0/). https://www.flickr.com/photos/144006675@N05/27487033282. https://www.flickr.com/photos/owen_lucas_photography/7454467582. Accessed on August 2016.
Figure 3—figure supplement 1
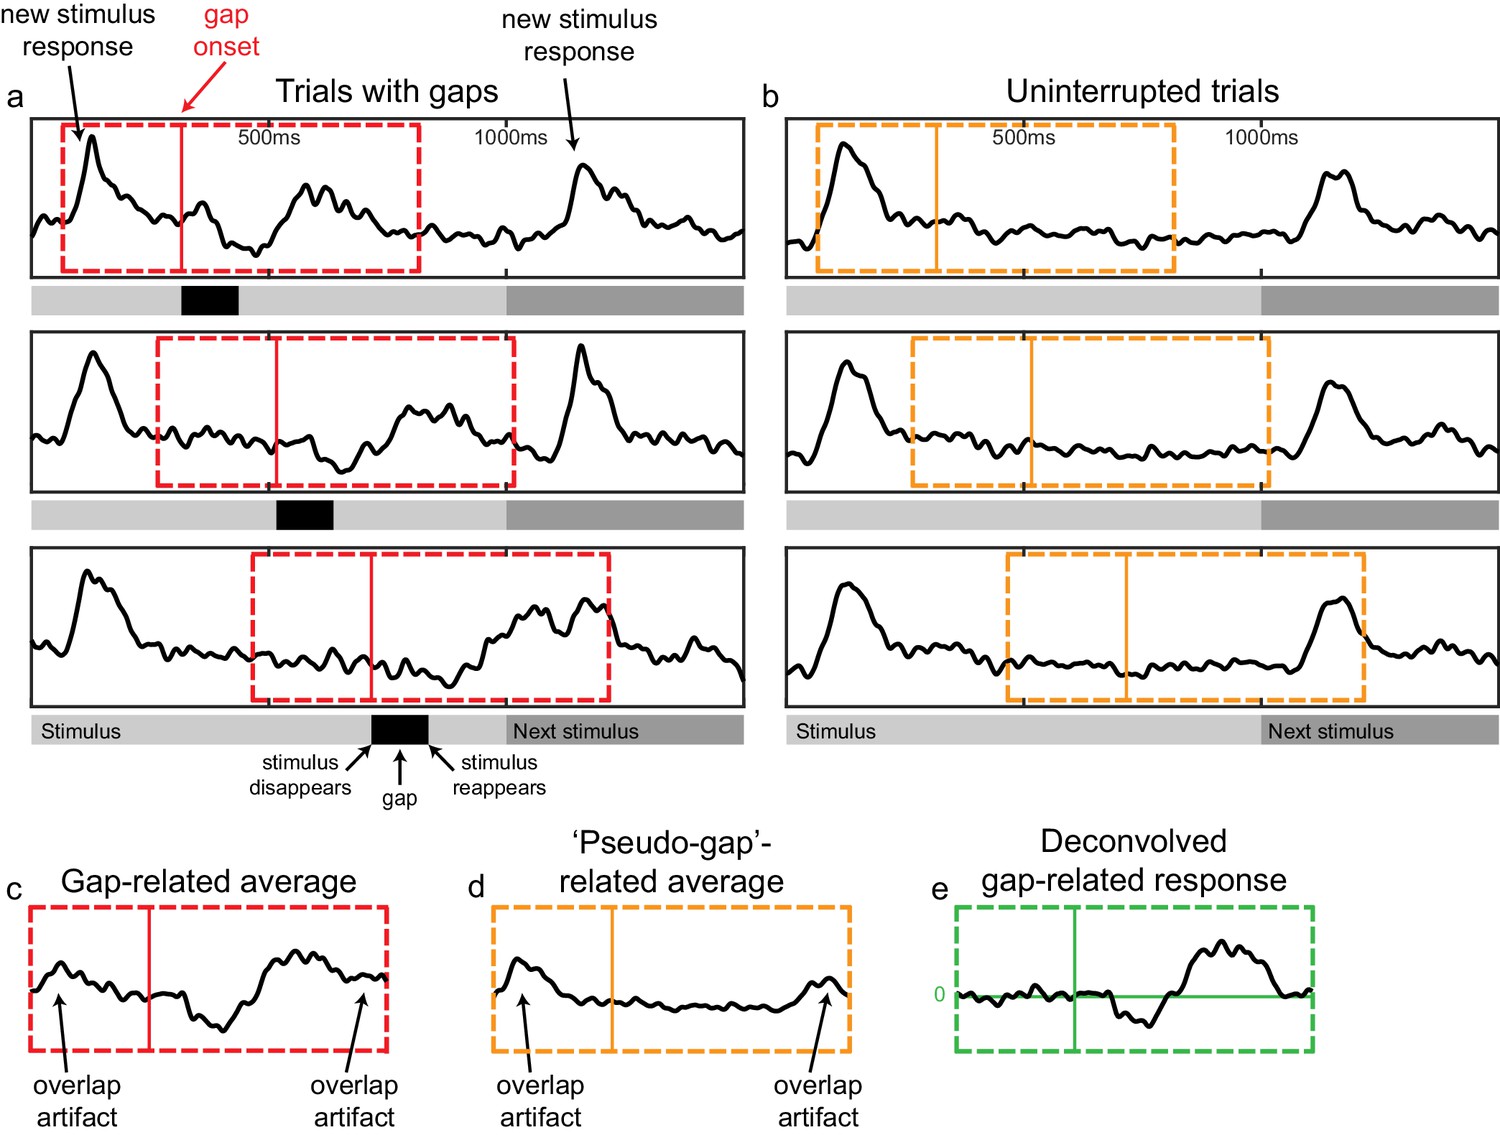
Bias in the estimation of gap-related responses due to unaccounted overlap of stimulus and gap responses and its correction by the deconvolution approach.
All responses here are from a representative V3d electrode in patient P20, sampled during both face and non-face trials. (a) Trials with early, middle and late gaps. The red dashed rectangle marks the window used for gap-related event-related averaging. The red solid line marks the moment of image disappearance (gap-onset). (b) Trials without any gaps or blinks, used as a control. The orange rectangle marks the window used for event-related averaging of 'pseudo-gaps', null-events situated at similar latencies as the true gaps. (c) Gap-related response as estimated by standard event-related averaging. Note the artifacts caused by unaccounted response-overlap, appearing at the beginning and end of the trace. (d) Pseudo-gap related response. Since this trace is based on event-related averaging of trials that did not contain true gaps, it reflects only the overlap-related artifacts. (e) Deconvolved gap-related response. Middle horizontal green line marks zero HFB contribution. Note the lack of overlap-artifacts.
Figure 4 with 1 supplement
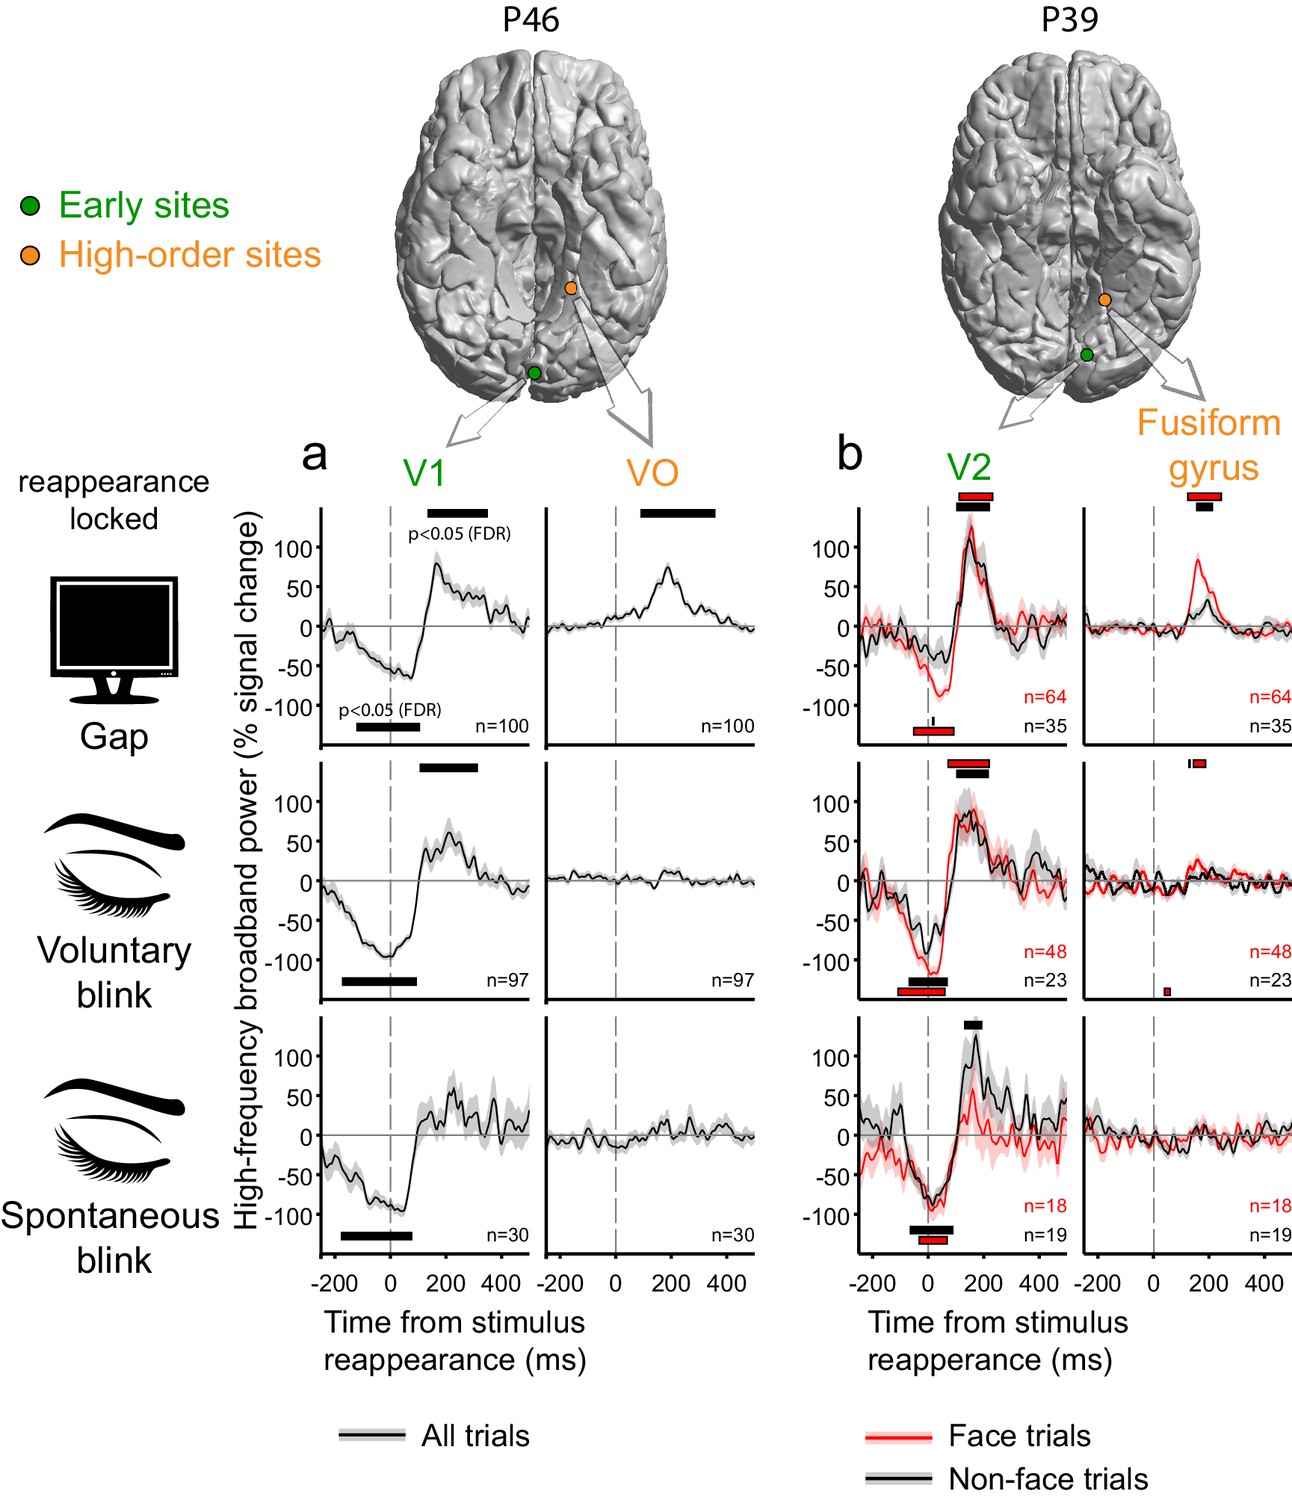
Deconvolved high-frequency broadband responses to gaps, voluntary and spontaneous blinks, simultaneously sampled at the early visual cortex and at the ventral high-level cortex.
Two pairs of electrodes from two patients are presented. All responses here are locked to the stimulus reappearance. Error bounds show the standard error of the regression coefficients. Horizontal bars mark response timepoints significantly different from zero (p<0.05, FDR-corrected within-participant, see Materials and methods). n is the number of event occurrences. Note the activation-dip followed by a reappearance-related overshoot for gaps, voluntary blinks and spontaneous blinks in early visual sites in both participants. By contrast, the two ventral high-level sites showed almost no disappearance-related dip for all three interruptions and a reappearance-related overshoot response only following gaps. (a) In participant P46, events from all trials (face and non-face alike) are depicted in black. (b) In patient P39, the high-level electrode showed greater responses to faces. By estimating the contribution of gaps, voluntary and spontaneous blinks separately during face and non-face trials (red and black traces, correspondingly), it is evident that the high-level reappearance-overshoot effect is dependent on the category of the reappearing stimulus.
Figure 4—figure supplement 1
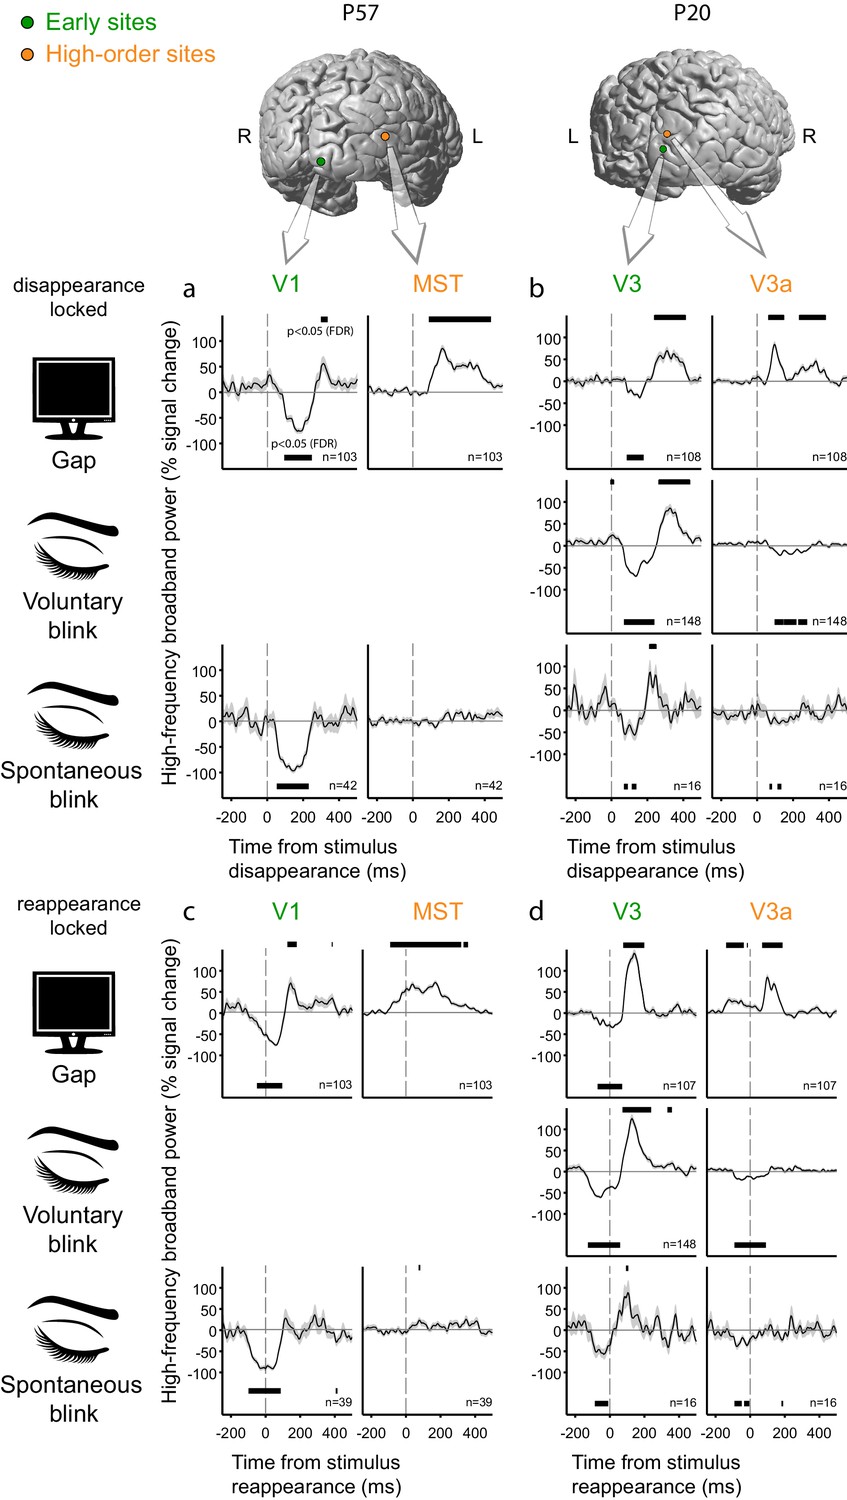
Deconvolved high-frequency broadband responses to gaps, voluntary and spontaneous blinks, simultaneously sampled at the early visual cortex and at the dorsal high-level cortex.
Two pairs of electrodes from two patients are presented. Responses in the upper panels (a,b) are locked to stimulus disappearance and responses in the lower panels (c,d) are locked to stimulus reappearance. Error bounds show the standard error of the regression coefficients. Horizontal black bars mark timepoints significantly different from zero (p<0.05, FDR-corrected within patient). (a/c) Patient P57. For visualization proposes, the brain image has been horizontally flipped. Note the similar responses to gaps and to spontaneous blinks in the V1 site. By contrast, the MST site responds exclusively to gap-related disappearance with a burst of HFB activation increase. This patient was not instructed to produce voluntary blinks. (b/d) Patient P20. In this case, two adjacent electrodes over dorsal V3 and V3a showed a sharp transition between similar responses to gaps and blinks in V3 and a positive response to gap-related image disappearance and gap-related image reappearance in V3a (seen as two positive bumps, the latter smeared due to jitter) but not for blink-related disappearance or reappearance.
Figure 5 with 2 supplements
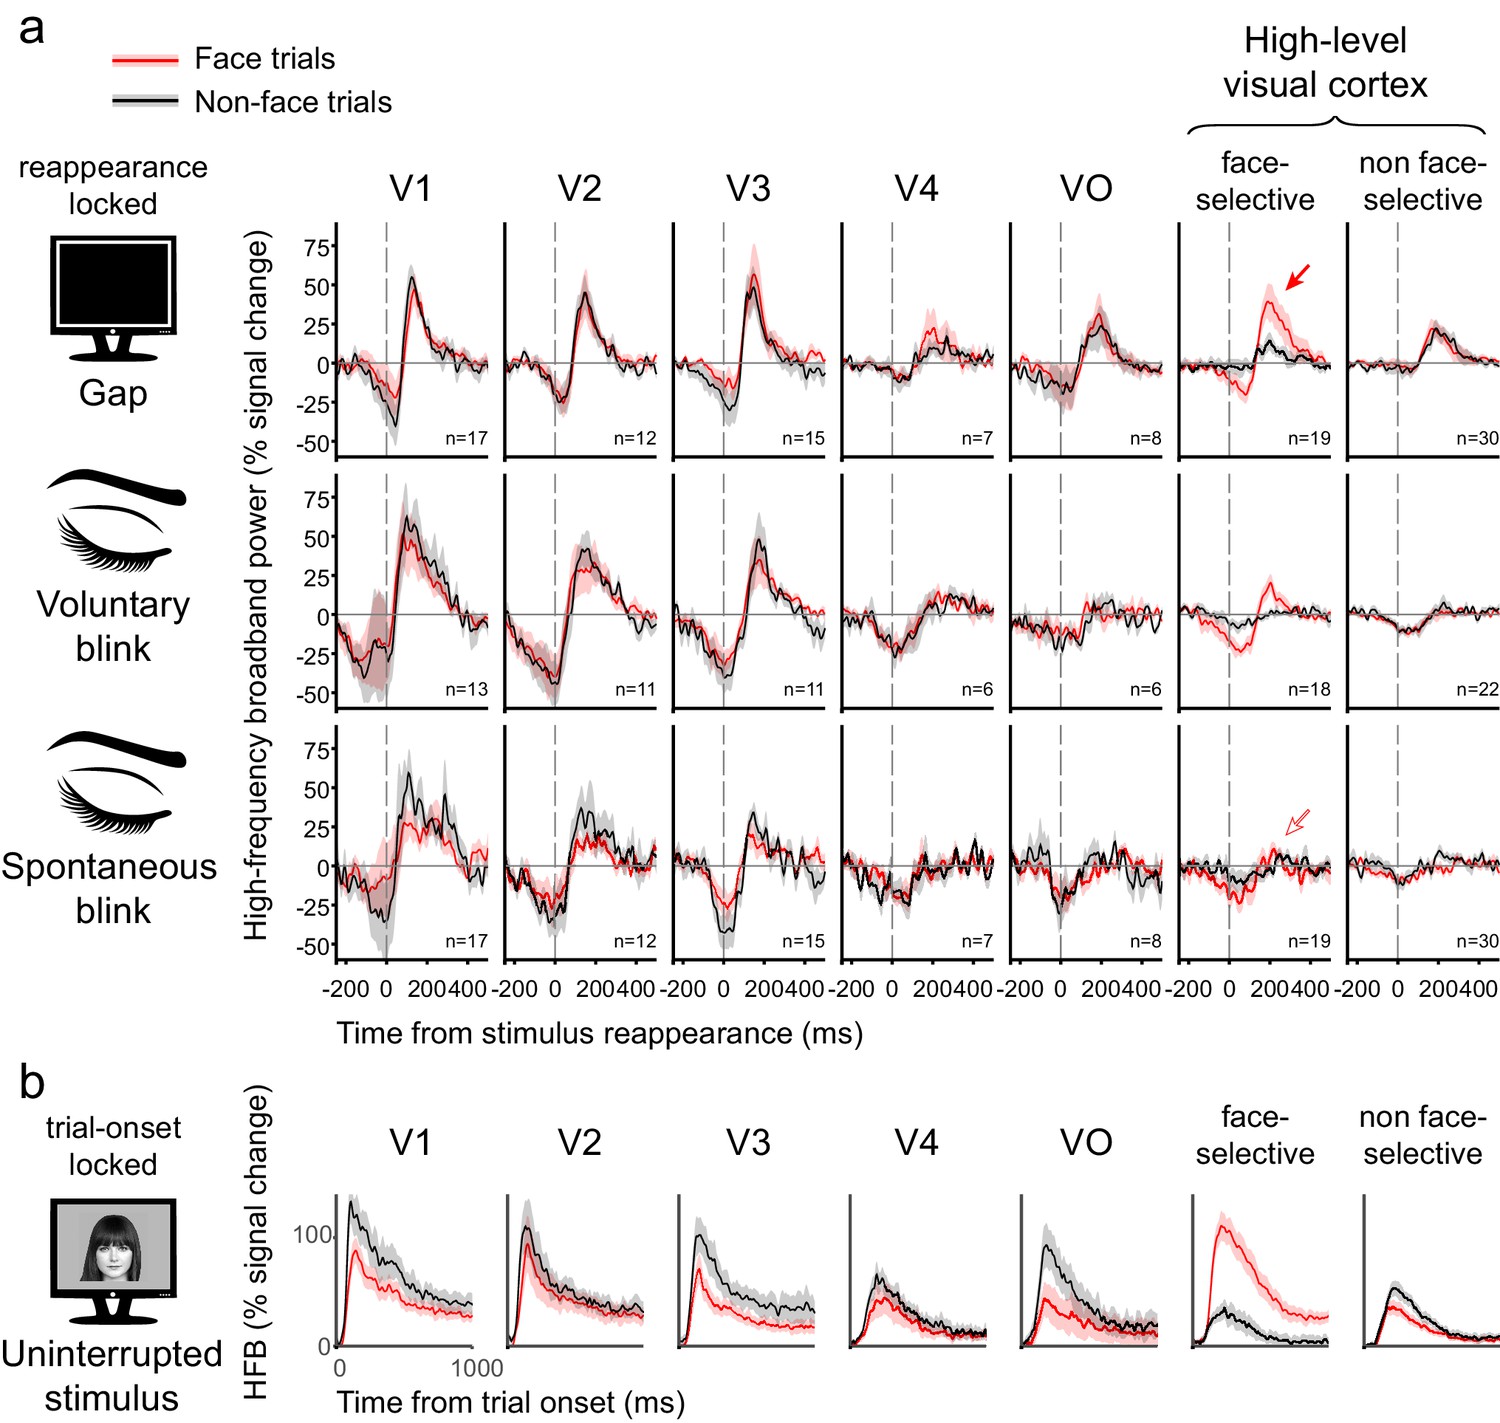
Grand averages of deconvolved high-frequency broadband responses.
(a) Responses to gaps, voluntary blinks and spontaneous blinks along the visual hierarchy. All of the traces here are locked to the image reappearance, marked as t = 0. See Figure 5—figure supplement 1b for the analogous stimulus-disappearance locked traces. After within-electrode estimation, the traces were averaged first within individuals and then across individuals, such that each grand-average is derived from independent individual traces. n is the total number of averaged electrodes for each trace. Error bounds show the standard error of the mean across individuals. Note the gradual appearance of differential responses to gaps compared with voluntary and spontaneous blink as the visual signal traveled forward. (b) Responses to object images (face and non-faces). Note that each stimulus was presented for one whole second.
Face photograph: Owen Lucas. Available on Flickr under the Public Domain Mark 1.0 https://creativecommons.org/publicdomain/mark/1.0/). https://www.flickr.com/photos/144006675@N05/27487033282. Accessed on August 2016.
Figure 5—figure supplement 1
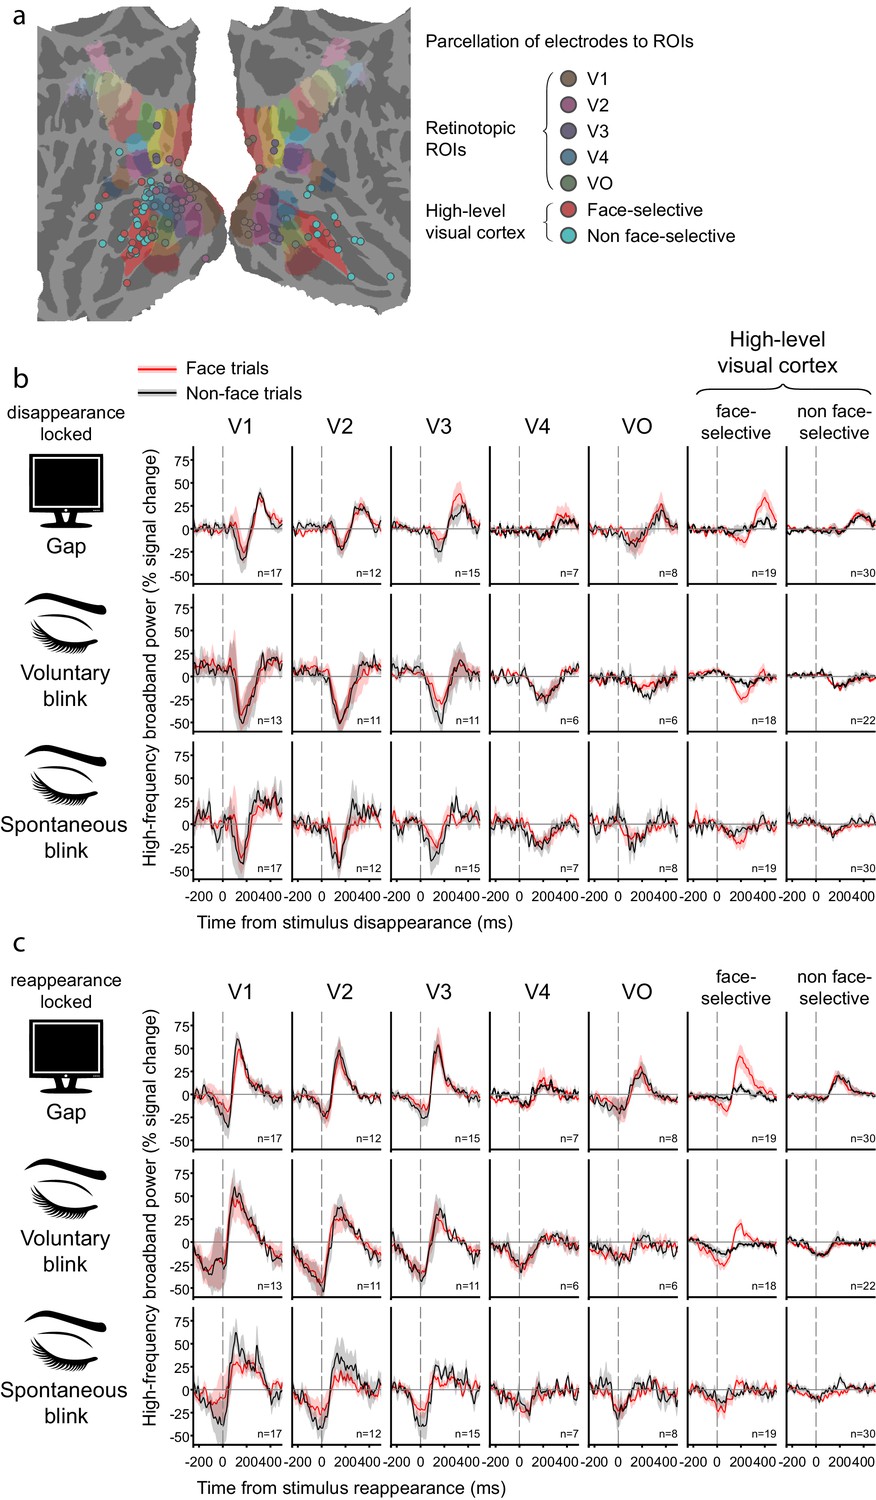
ROI parcellation and additional grand-averages.
(a) Parcellation of visually responsive electrodes into ROIs. (b) Grand-averages of deconvolved disappearance-locked responses to gaps, voluntary and spontaneous blinks. t = 0 is the moment in which the object image disappeared due to gap/blink onset. Compare with Figure 5a which is reappearance-locked. Note the lack of greater activation-dip for gaps compared with blinks in higher-level visual ROIs, which would have been expected if blinks (but not gaps) were filled-in by these regions. (c) Grand-averages of reappearance-locked responses to gaps, voluntary and spontaneous blinks, calculated by the subtraction of the uninterrupted response template followed by averaging, instead of deconvolution. Note the similarity of the estimated traces to these in Figure 5a.
Figure 5—figure supplement 2
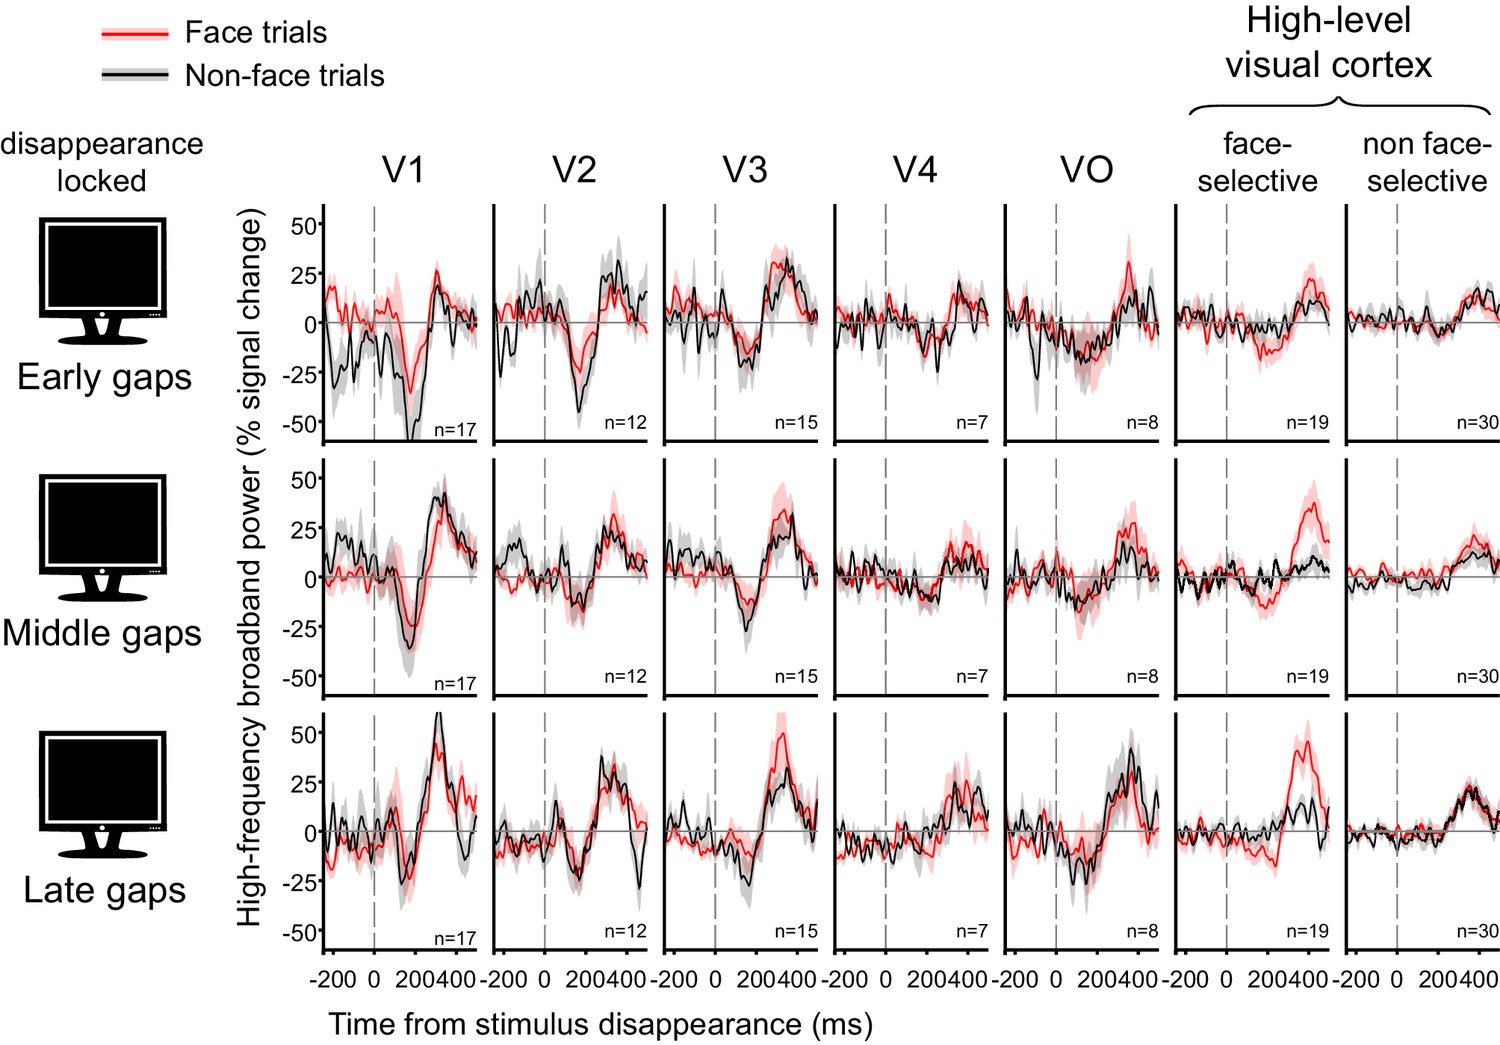
Effect of gap latency.
Grand averages of deconvolved high-frequency broadband responses to gaps, shown separately for early (350 ms), middle (550 ms) and late gaps (750 ms). All traces are locked to object image disappearance (i.e. gap onset).
Figure 6 with 1 supplement

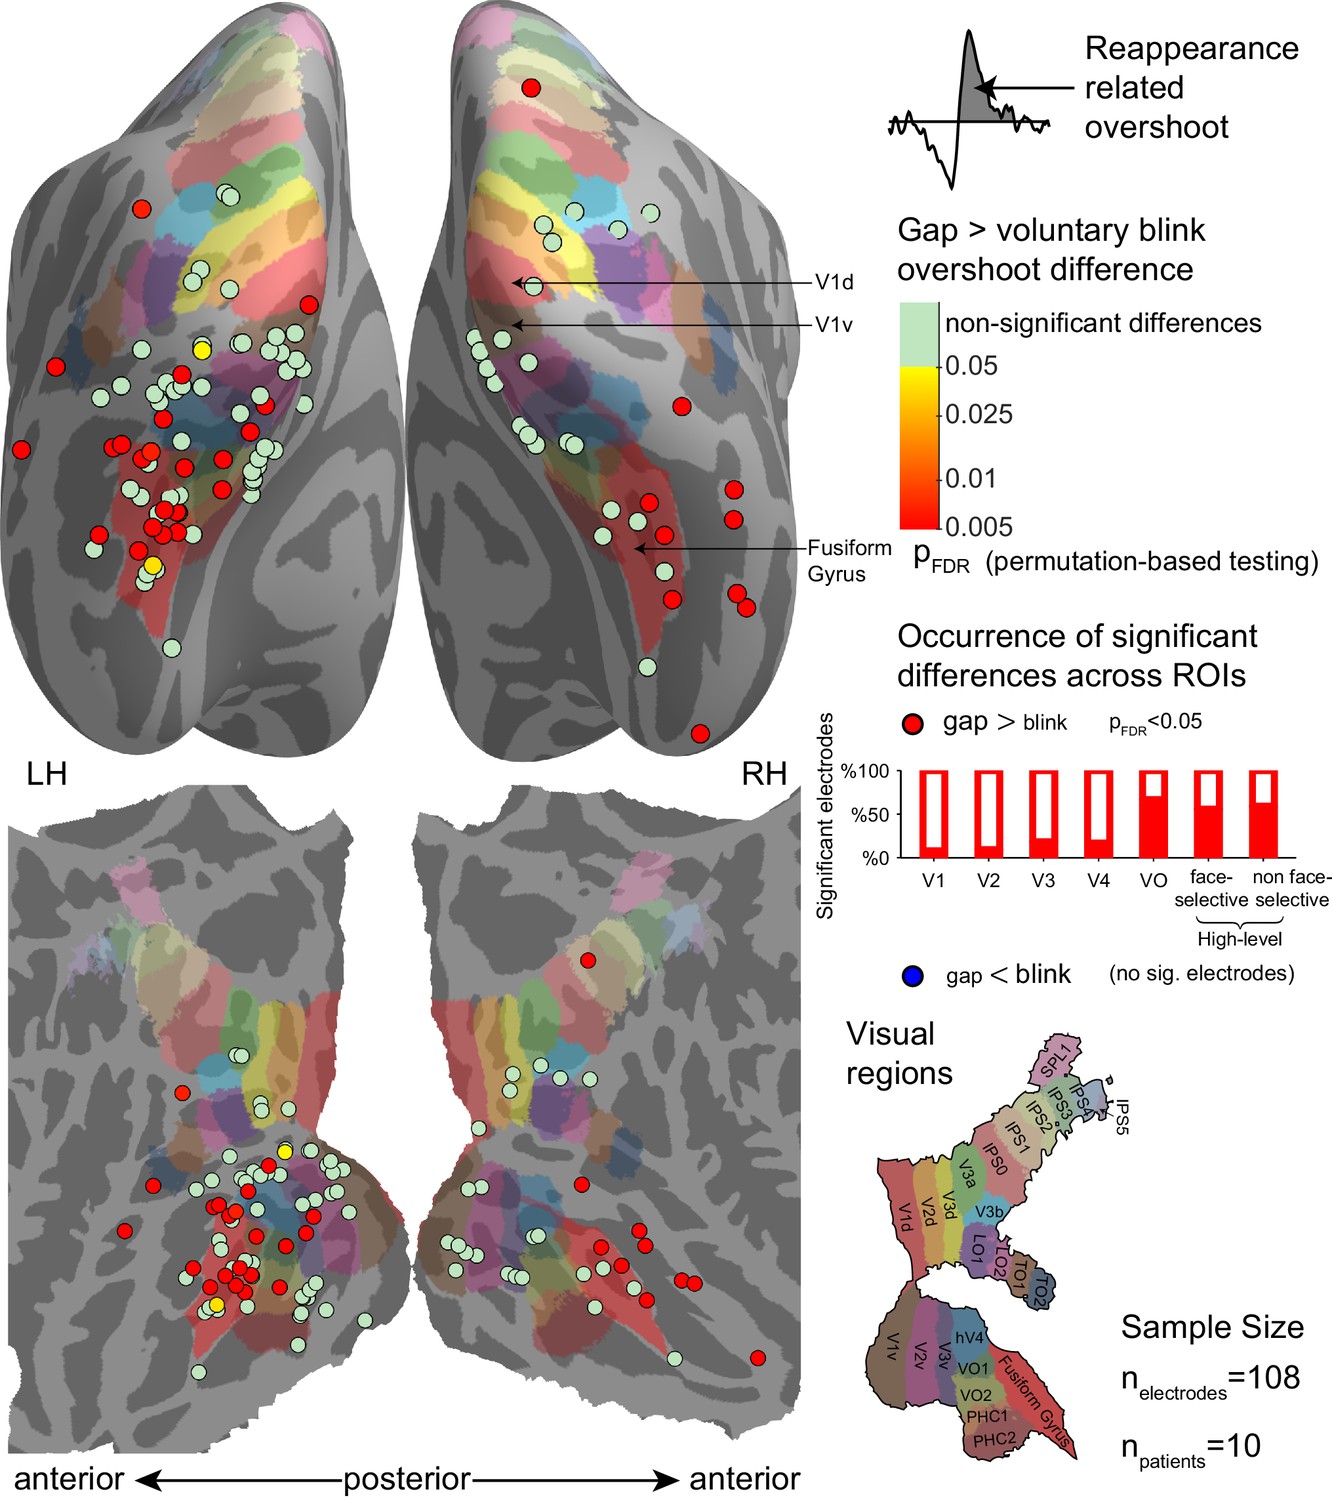
Electrode-level permutation testing of the reappearance-related response overshoot for gaps compared with the same measure for spontaneous blinks.
See Figure 6—figure supplement 1 for a comparison of gaps with the voluntary blinks. Each circle stands for one of 143 visually responsive electrodes polled across 14 participants, colored according to the FDR-adjusted permutation test p-value (logarithmic color scale). The partially filled bars on the right show the percentage of electrodes showing a significant gap overshoot > blink overshoot effect within-each region of interest. None of the visually responsive electrodes exhibited a significant inverse effect (blink overshoot>gap overshoot).
-
Figure 6—source data 1
Individual electrode data for Figure 6.
Each row describes an electrode, with its SUMA standardized mesh nearest vertex (index, hemisphere and MNI coordinates), its ROI (if assigned), unbiased (split-half based) integral under the gap overshoot response, unbiased integral under the spontaneous blink overshoot response, FDR-corrected p-value for gaps greater than spontaneous blinks and FDR-corrected p-value for spontaneous blinks greater than gaps.
- https://doi.org/10.7554/eLife.17243.018
Figure 6—figure supplement 1
Electrode-level permutation testing of the reappearance-related response overshoot for gaps compared with the same measure for voluntary blinks.
See Figure 6 for the same measure compared between gaps with spontaneous blinks and for a full legend.
-
Figure 6—figure supplement 1—source data 1
Individual electrode data for Figure 6—figure supplement 1.
Each row describes an electrode, with its SUMA standardized mesh nearest vertex (index, hemisphere and MNI coordinates), its ROI (if assigned), unbiased (split-half based) integral under the gap overshoot response, unbiased integral under the voluntary blink overshoot response, FDR-corrected p-value for gaps greater than voluntary blinks and FDR-corrected p-values for voluntary blinks greater than gaps.
- https://doi.org/10.7554/eLife.17243.020
Figure 7 with 3 supplements

Mixed-effects response estimates.
The bars depict estimated average magnitudes (mixed-effects least squares means and their SEs) of reappearance-related overshoots (upper panels) and disappearance-related activation-dips (lower panels) for gaps, voluntary blinks and spontaneous blinks, occurring during face trials (left panels) and during non-face trials (right panels). Asterisks mark significant within-ROI simple effects (pFDR < 0.05 – *, pFDR < 0.01 – **, pFDR < 0.001 – ***). (a) Average reappearance-related overshoot magnitudes (face trials). (b) The same measurement for events occurring during non-face trials. (c) Disappearance-related activation-dips magnitudes (deeper activation-dips are more negative) during face-trials. (d) The same measurement for events occurring during non-face trials.
-
Figure 7—source data 1
Mixed-effect model outputs used to create Figure 7.
This excel workbook includes parameter estimates for each experimental condition and ROI as well as within-ROI simple effects, both calculated by lsmeans R package. Simple effects are accompanied with FDR-corrected p-values. Data for overshoot (Figure 7a,b) and dip components (Figure 7c,d) are provided in different excel spreadsheets.
- https://doi.org/10.7554/eLife.17243.022
Figure 7—figure supplement 1
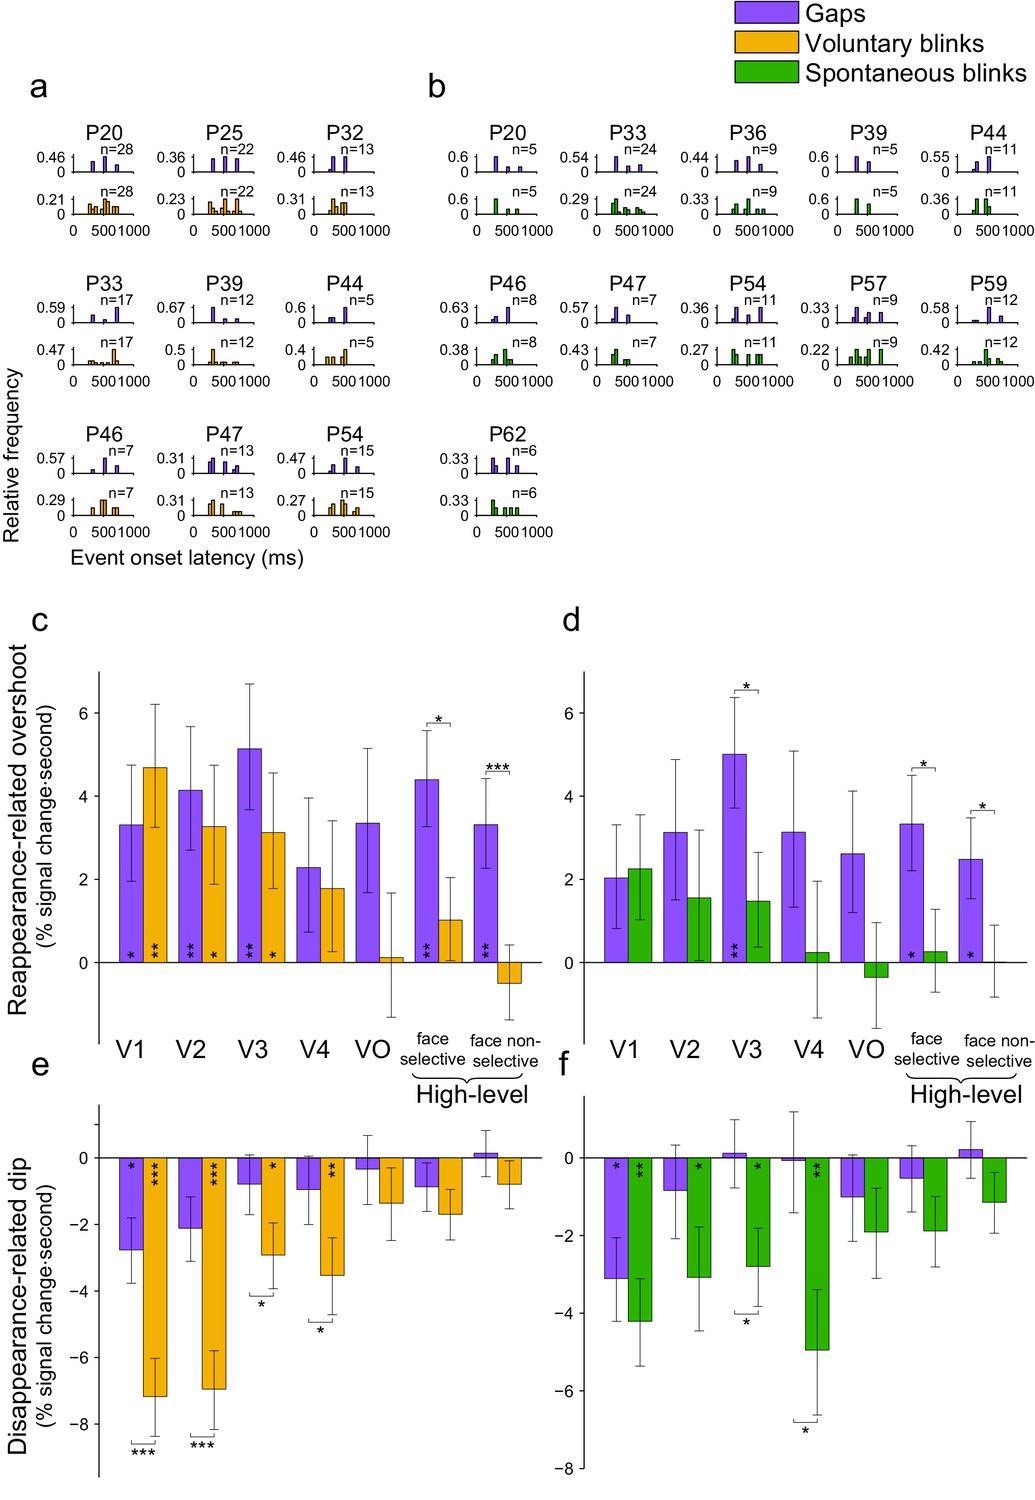
Mixed-effects group analysis of gap and blink events matched for onset latency.
Only events occurring during face-trials were used. Asterisks mark significant FDR-corrected within-ROI simple effects (p<0.05 – *, p<0.01 – **, p<0.001 – ***, FDR-corrected). (a) Individual onset latency histograms of matched gaps and voluntary blinks. (b) The equivalent data for matched gaps and spontaneous blinks. (c) Average HFB reappearance-related overshoot magnitudes for the matched gaps and voluntary blinks (mixed-effects least-square means and their standard errors). Compare with Figure 7a – the same diminishing of the responses for voluntary blinks but not gaps is evident. (d) HFB reappearance-related overshoot magnitudes for the matched gaps and spontaneous blinks. Compare with Figure 7b. (e) Disappearance-related activation-dip magnitudes for matched gaps and voluntary blinks. Compare with Figure 7c. (f) Disappearance-related activation-dip for matched gaps and voluntary blinks. Compare with Figure 7d.
Figure 7—figure supplement 2
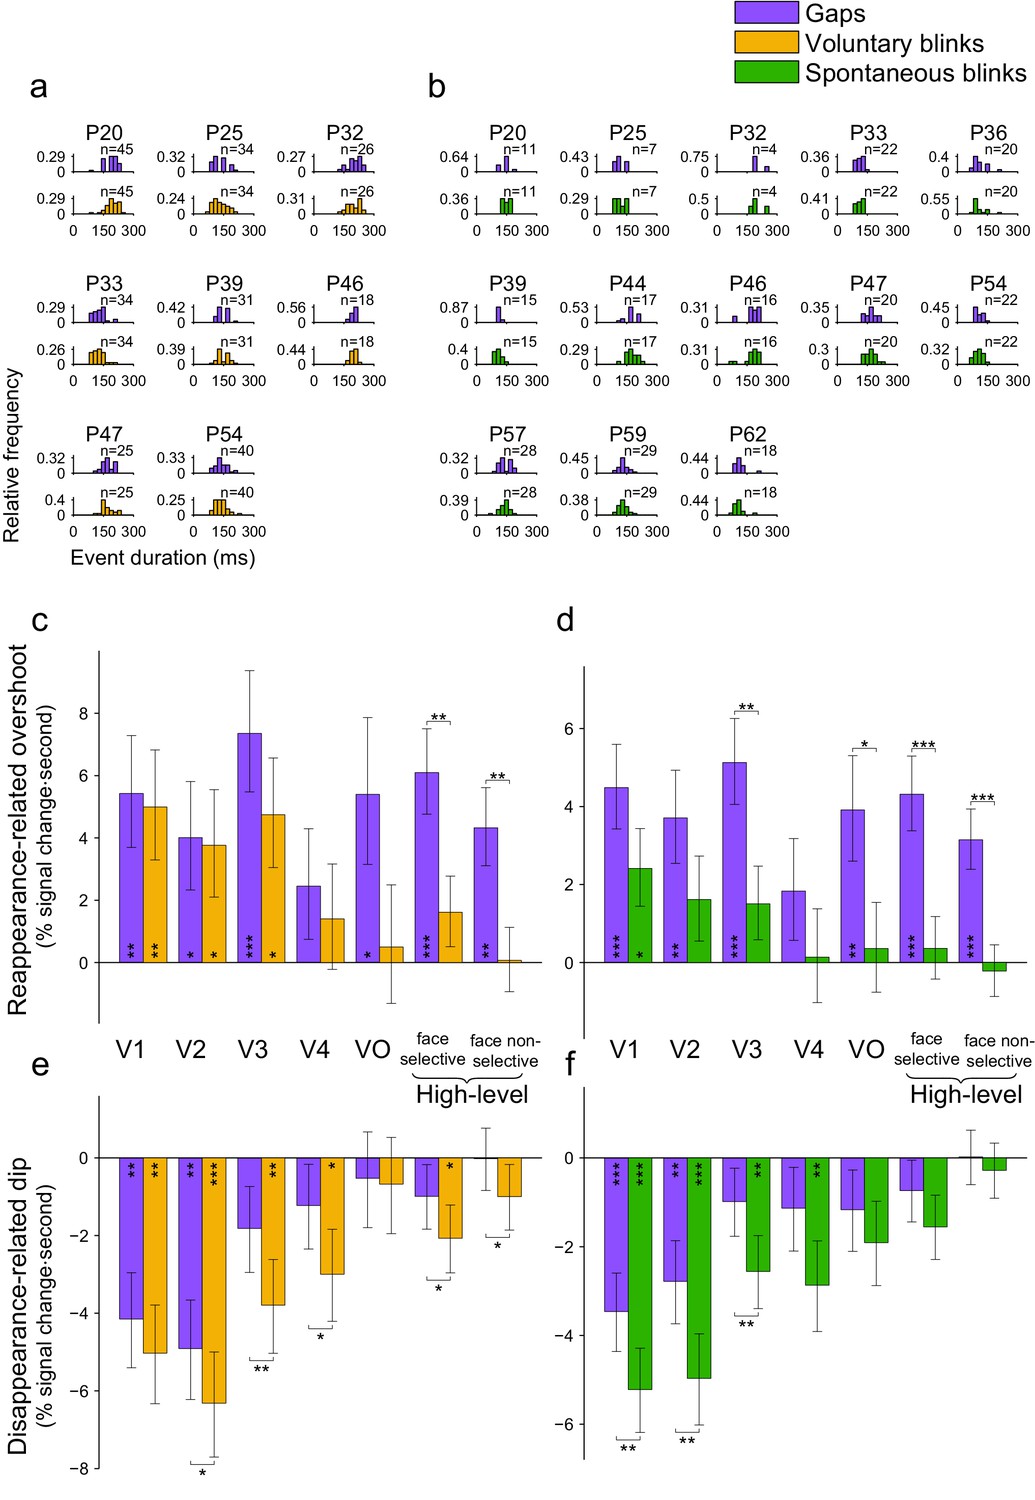
Mixed-effects group analysis of gap and blink events matched for duration.
Asterisks mark significant FDR-corrected within-ROI simple effects (p<.05 – *, p<.01 – **, p<.001 – ***, FDR-corrected). (a) Individual duration histograms of matched gaps and voluntary blinks. (b) The equivalent data for matched gaps and spontaneous blinks. (c) Average HFB reappearance-related overshoot magnitudes for the matched gaps and voluntary blinks (mixed-effects least-squares means and their standard errors). Compare with Figure 7a. (d) HFB reappearance-related overshoot magnitudes for the duration matched gaps and spontaneous blinks. Compare with Figure 7B. (e) Disappearance-related activation-dip magnitudes for the duration matched gaps and voluntary blinks. Compare with Figure 7c. (f) Disappearance-related activation-dip for the duration matched gaps and voluntary blinks. Compare with Figure 7d.
Figure 7—figure supplement 3
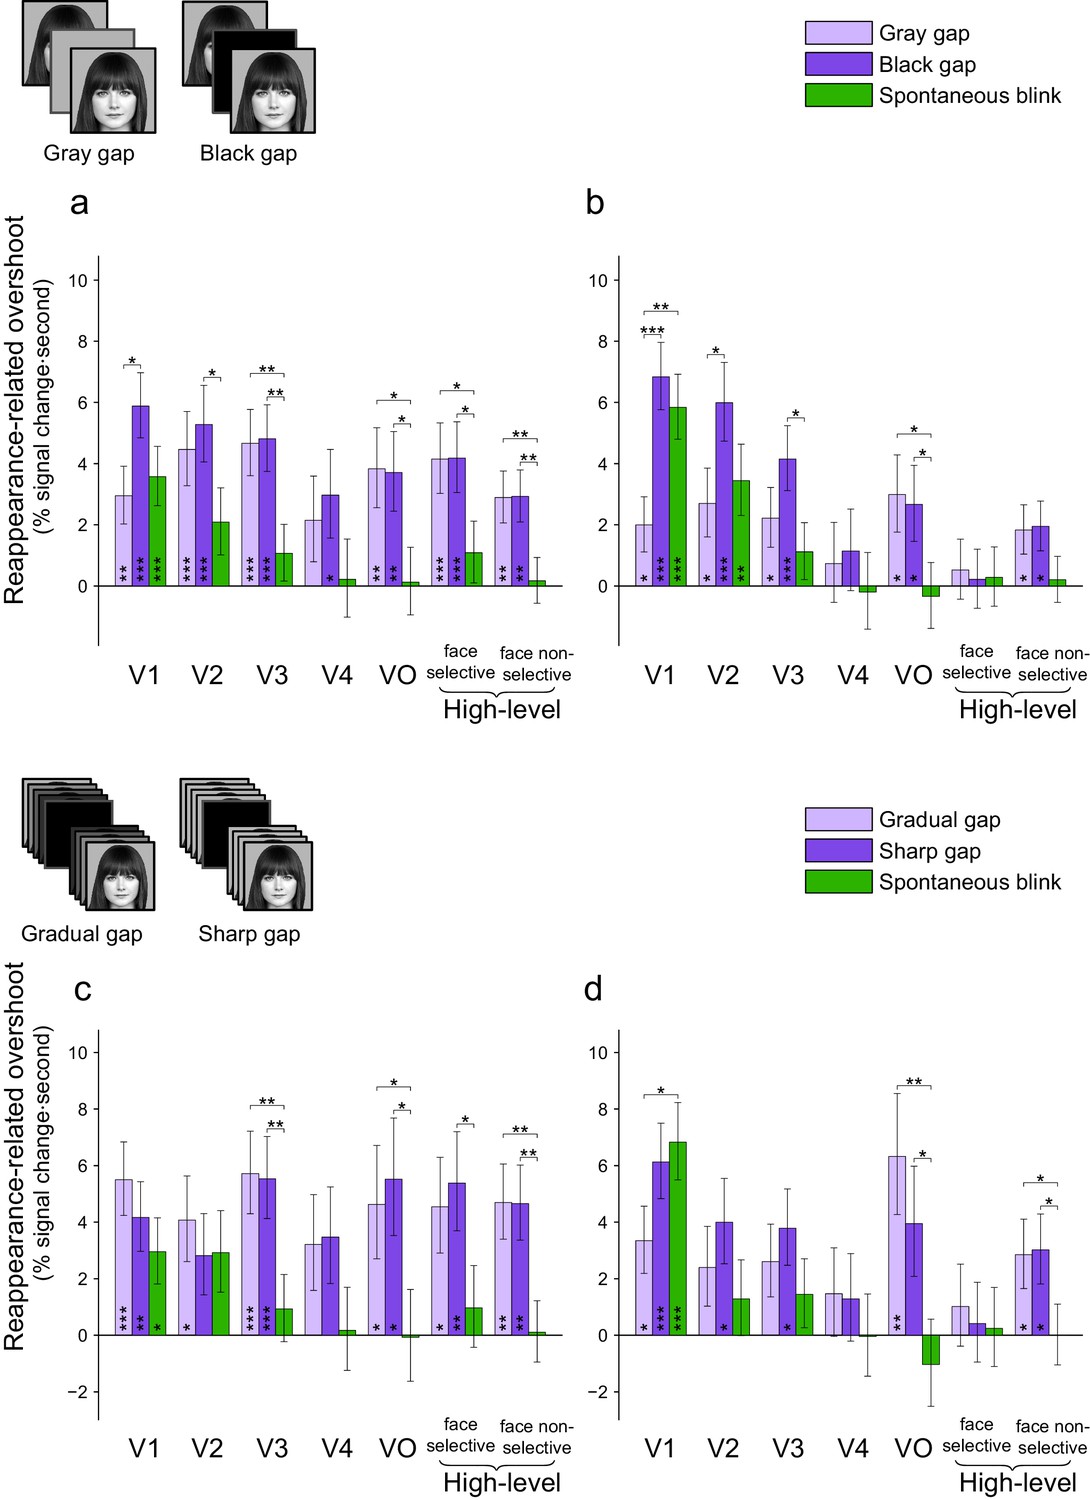
Controls for gap low-level properties.
The panels depict mixed-effects group analysis of responses to gap and spontaneous blink events, with control of the gap luminance (black or gray, panels a-b) or the gap temporal gradient (gradual or sharp, panels c-d). The values shown are mixed-effects least-square means and their standard errors. Asterisks mark significant FDR-corrected within-ROI simple effects (p<0.05 - *, p<0.01 - **, p<0.001 - ***, FDR-corrected). (a) Reappearance-related overshoot magnitudes for gray gaps, black gaps and spontaneous blinks (face-trials). Note how the gray gaps caused less low-level impact than blinks yet they still triggered a significantly greater response than blinks in high-level visual areas. (b) Reappearance-related overshoot magnitudes for gray gaps, black gaps and spontaneous blinks (non-face trials). (c) Reappearance-related overshoot magnitudes for gradual gaps (fading-in and out), sharp gaps (abruptly appearing) and spontaneous blinks (face-trials). (d) Reappearance-related overshoot magnitudes for gradual gaps (fading-in and out), sharp gaps (abruptly appearing) and spontaneous blinks (non-face trials).
Face photograph: Owen Lucas. Available on Flickr under the Public Domain Mark 1.0 https://creativecommons.org/publicdomain/mark/1.0/). https://www.flickr.com/photos/144006675@N05/27487033282. Accessed on August 2016.
Figure 8
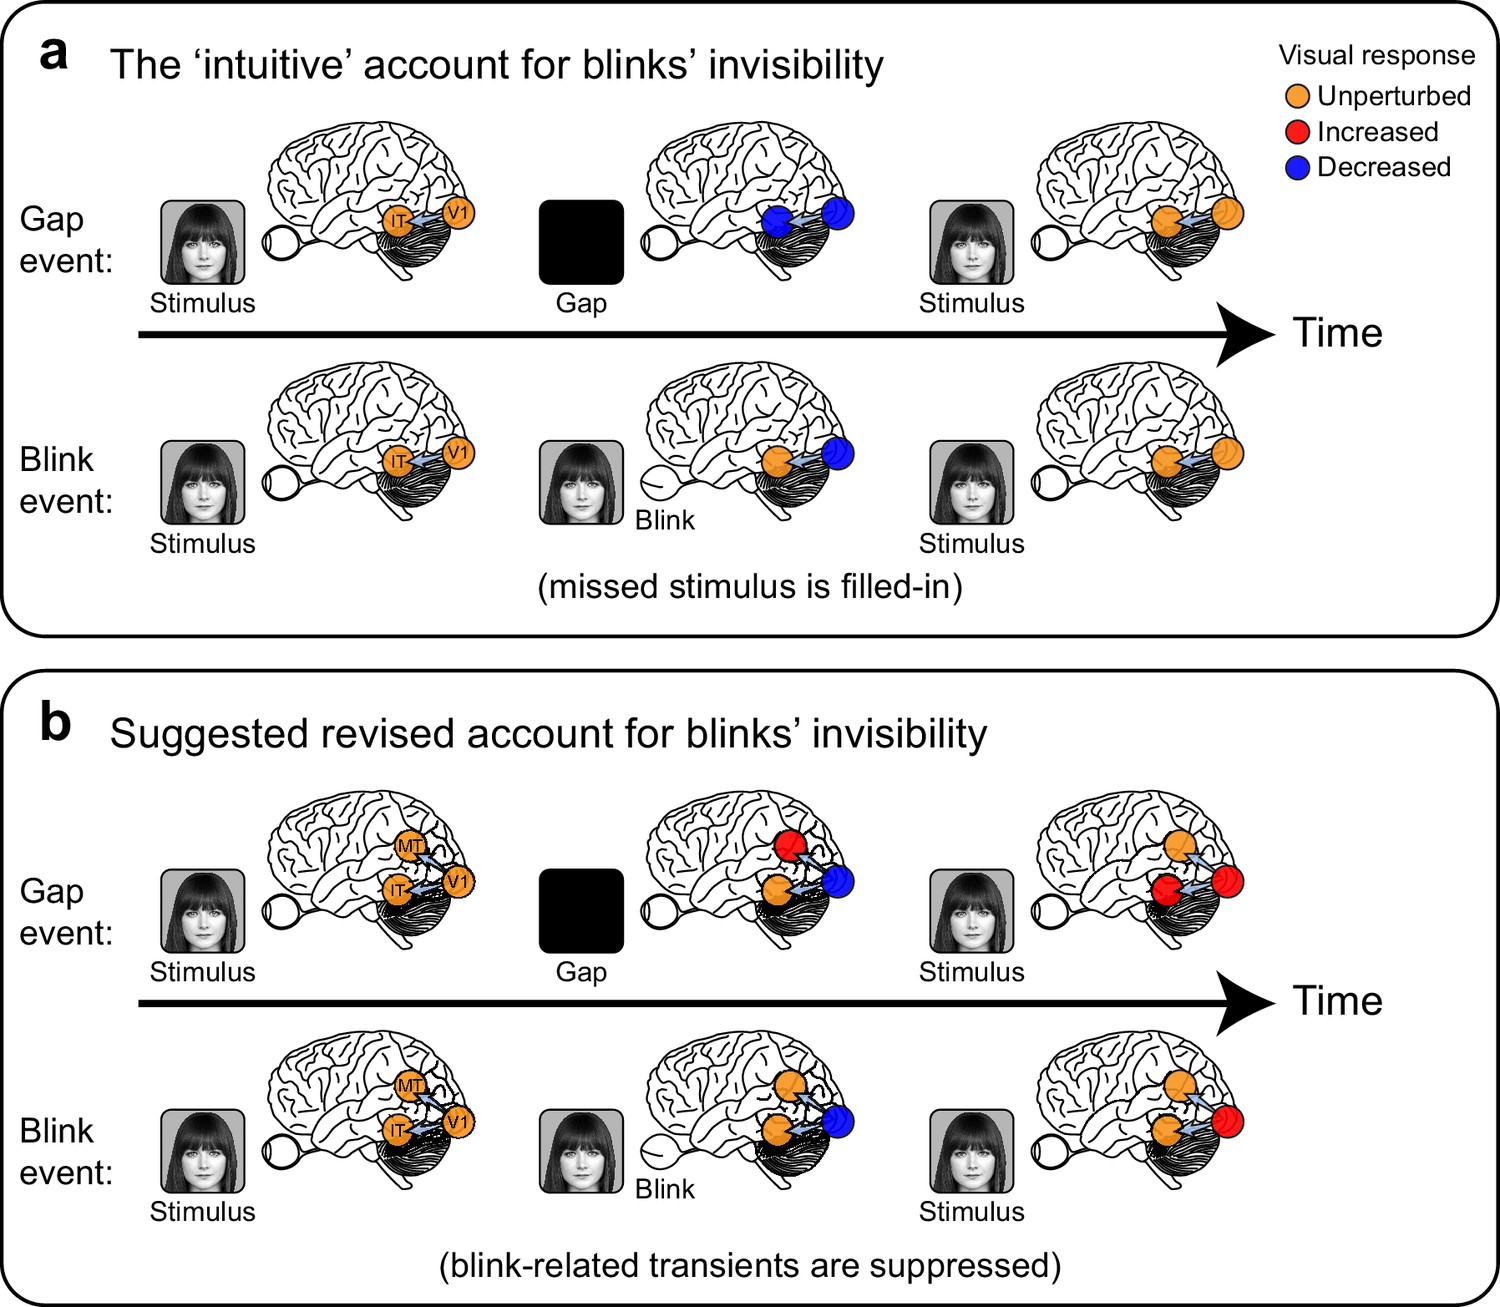
Two alternative accounts for the perceived continuity across blinks compared with perceived discontinuity following external blanking of the stimulus ('gaps').
(a) The 'intuitive' or commonsense account, by which the occluded face-stimulus is actively 'filled-in' by ventral high-level, category-selective visual regions during blinks but not during gaps, resulting in perceived continuity only across blinks. (b) A suggested revised account, consistent with the current findings: transient neuronal activations follow the perceived disappearance and reappearance of the face-stimulus. These transients (red filled circles) are evident in gaps but are extra-retinally suppressed in blinks, forming a distributed neural correlate of the perceptual distinction between these two events.
Face photograph: Owen Lucas. Available on Flickr under the Public Domain Mark 1.0 https://creativecommons.org/publicdomain/mark/1.0/). https://www.flickr.com/photos/144006675@N05/27487033282. Accessed on August 2016.
Videos
Video 1
Response to gaps (stimulus-reappearance lock).
Face photograph: Owen Lucas. Available on Flickr under the Public Domain Mark 1.0 https://creativecommons.org/publicdomain/mark/1.0/). https://www.flickr.com/photos/144006675@N05/27487033282. Accessed on August 2016.
Video 2
Response to spontaneous blinks (stimulus-reappearance lock).
Face photograph: Owen Lucas. Available on Flickr under the Public Domain Mark 1.0 https://creativecommons.org/publicdomain/mark/1.0/). https://www.flickr.com/photos/144006675@N05/27487033282. Accessed on August 2016.
Tables
Table 1
Patients' demographic, clinical and experimental details.
| Patient code* | Sex | Age | Seizure onset zone(s) | Voluntary blinks blocks | Black /gray gap control | Gradual / abrupt gap control | Total analyzed electrodes | Total visually responsive electrodes | Number of visually responsive electrodes in each ROI | ||||||
|---|---|---|---|---|---|---|---|---|---|---|---|---|---|---|---|
| Retinotopic | High-level | ||||||||||||||
| V1 | V2 | V3 | V4 | VO | FC | N-FC | |||||||||
| P20 | F | 30 | RH: Supramarginal Gyrus | ✓ | 103 | 6 | 0 | 0 | 2 | 0 | 0 | 1 | 2 | ||
| P25 | M | 45 | RH: Inferior Frontal Gyrus, Precentral S. | ✓ | 117 | 8 | 0 | 0 | 0 | 0 | 0 | 2 | 6 | ||
| P32 | M | 23 | RH: Superior Temporal Gyrus, Hippocampus | ✓ | 181 | 10 | 2 | 2 | 0 | 1 | 0 | 1 | 2 | ||
| P33 | F | 52 | LH: Hippocampus, Middle Entorhinal Cortex | ✓ | 83 | 8 | 0 | 0 | 0 | 0 | 0 | 4 | 1 | ||
| P36 | M | 24 | RH: Parahippocampal Gyrus, Temporal Pole | ** | ✓ | 58 | 8 | 0 | 0 | 1 | 0 | 1 | 1 | 4 | |
| P39 | M | 25 | RH: Hippocampus, Amygdala | ✓ | ✓ | 128 | 18 | 3 | 2 | 2 | 1 | 2 | 3 | 4 | |
| P44 | M | 30 | RH: Anterior Temporal Lobe | ✓ | ✓ | 118 | 10 | 1 | 1 | 1 | 0 | 1 | 1 | 1 | |
| P46 | M | 45 | RH: Hippocampus, Parahippocampal Gyrus | ✓ | ✓ | ✓ | 58 | 15 | 3 | 2 | 2 | 1 | 2 | 1 | 4 |
| P47 | F | 34 | LH: Anterior Temporal Lobe | ✓ | ✓ | ✓ | 142 | 7 | 0 | 0 | 0 | 1 | 1 | 3 | 2 |
| P50 | M | 27 | LH: Amygdala, Hippocampus, Parahippocampal Gyrus, Anterior Fusiform Gyrus, Post Central Gyrus | ✓ | ✓ | ✓ | 108 | 3 | 2 | 1 | 0 | 0 | 0 | 0 | 0 |
| P54 | M | 21 | RH: Medial Temporal, Middle Occipital Gyrus, Parieto-Occipital-Sulcus, Middle Temporal Gyrus, LH: Hippocampus | ✓ | ✓ | ✓ | 160 | 23 | 2 | 3 | 4 | 2 | 0 | 2 | 0 |
| P57 | M | 29 | RH: Amygdala | ✓ | ✓ | 110 | 6 | 1 | 0 | 1 | 0 | 0 | 0 | 2 | |
| P59 | M | 50 | RH: Parieto-Occipital Sulcus | ✓ | ✓ | 94 | 13 | 3 | 0 | 0 | 0 | 1 | 0 | 2 | |
| P62 | F | 44 | LH: Hippocampus, Anterior Cingulate Gyrus, Amygdala, Parahippocampal Gyrus | ✓ | ✓ | 125 | 8 | 0 | 1 | 2 | 1 | 0 | 0 | 0 | |
-
LH/RH – left/right hemisphere, VO – ventral-occipital, FC – face-selective electrodes, N-FC non-face selective high-level electrodes. * Patients' identities were coded by order of admission to surgery. Since not every admitted patient performed the experiment, the codes are not consecutive. ** Failed to follow the instruction to voluntary blink due to language barrier.
Download links
A two-part list of links to download the article, or parts of the article, in various formats.
Downloads (link to download the article as PDF)
Open citations (links to open the citations from this article in various online reference manager services)
Cite this article (links to download the citations from this article in formats compatible with various reference manager tools)
Human intracranial recordings link suppressed transients rather than 'filling-in' to perceptual continuity across blinks
eLife 5:e17243.
https://doi.org/10.7554/eLife.17243


