Stage-specific effects of Notch activation during skeletal myogenesis
- Purdue University, United States
Figures
Figure 1 with 1 supplement
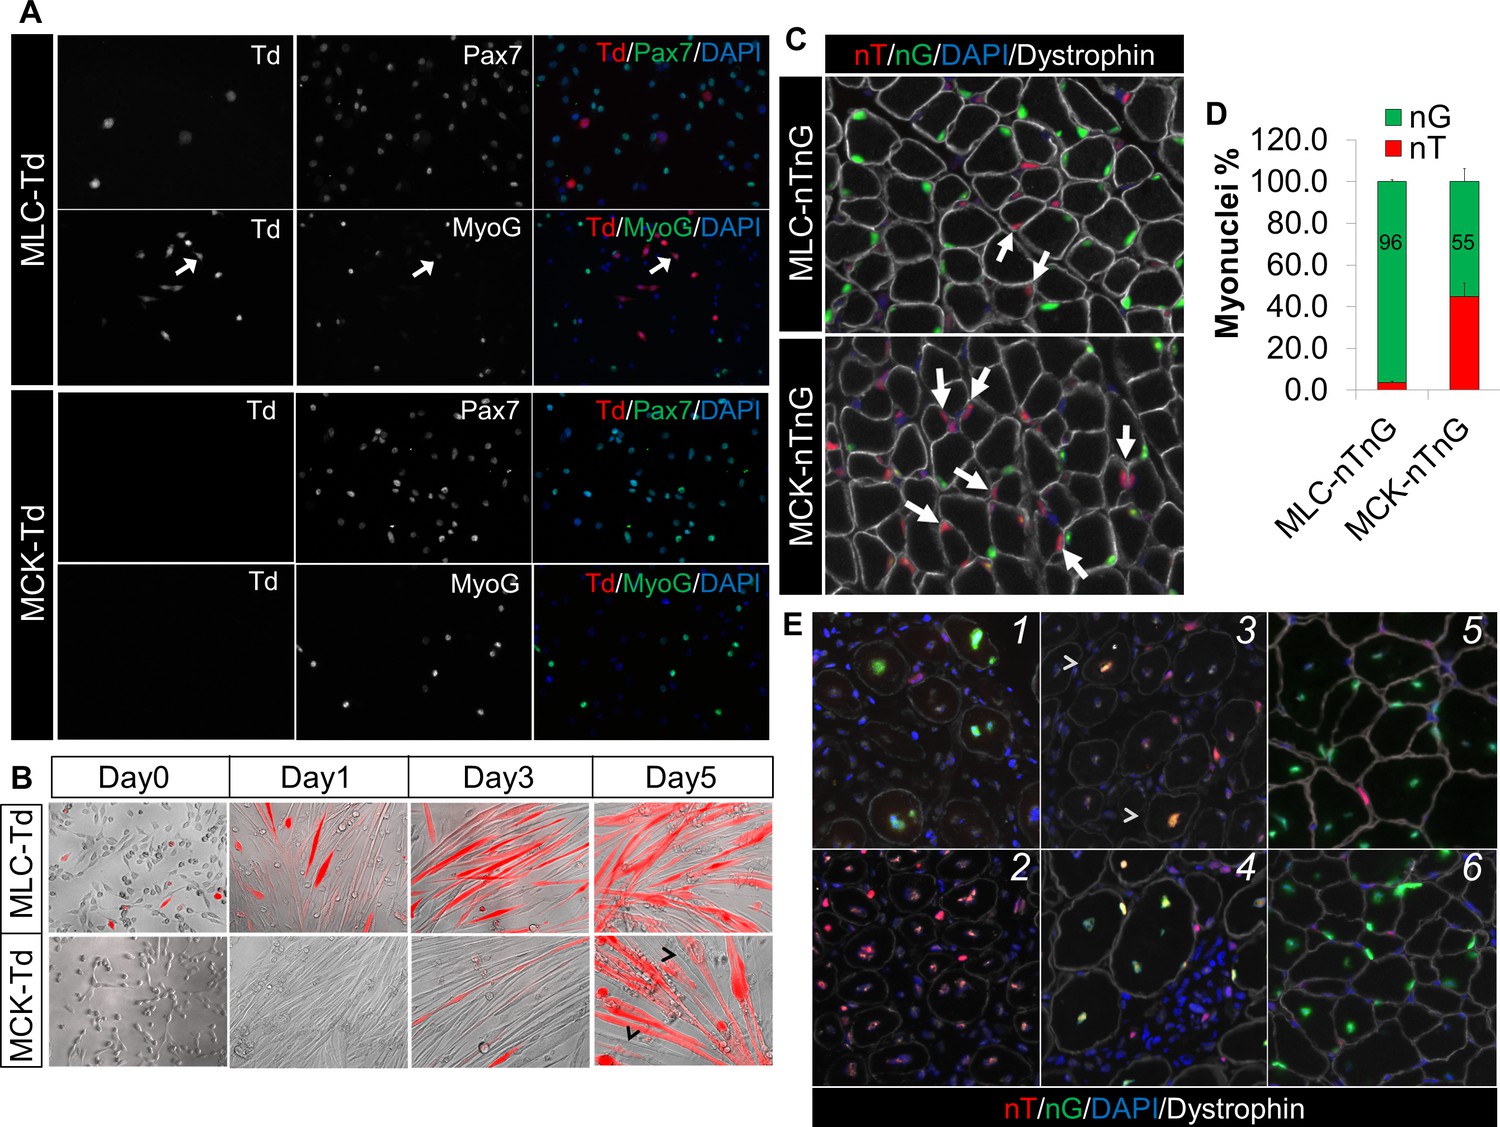
Sequential activation of Myl1Cre (MLC-Cre) and MCK-Cre in post-differentiation myocytes and post-fusion myotubes, respectively.
(A,B) Immunofluorescence images of cultured myoblasts (A) and myocytes (B). Arrow in A points to a weak MyoG+/Td+ cell. Arrowhead in B points to Td– myofibers. (C,D) Immunofluorescence images (C) of TA cross sections of postnatal day-12 mice, and myonuclei counting (D). Arrow points to nT myonucleus. (E) Immunofluorescence images of TA cross sections at different days post CTX injury (dpi): 1 (MLC-nTnG, 4 dpi), 2 (MCK-nTnG, 4 dpi), 3 (MCK-nTnG, 6 dpi), 4 (MCK-nTnG, 9 dpi), 5 (MLC-nTnG, 21 dpi), 6 (MCK-nTnG, 21 dpi). Arrowhead in panel 3 points to the nT/nG myofiber.
Figure 1—figure supplement 1
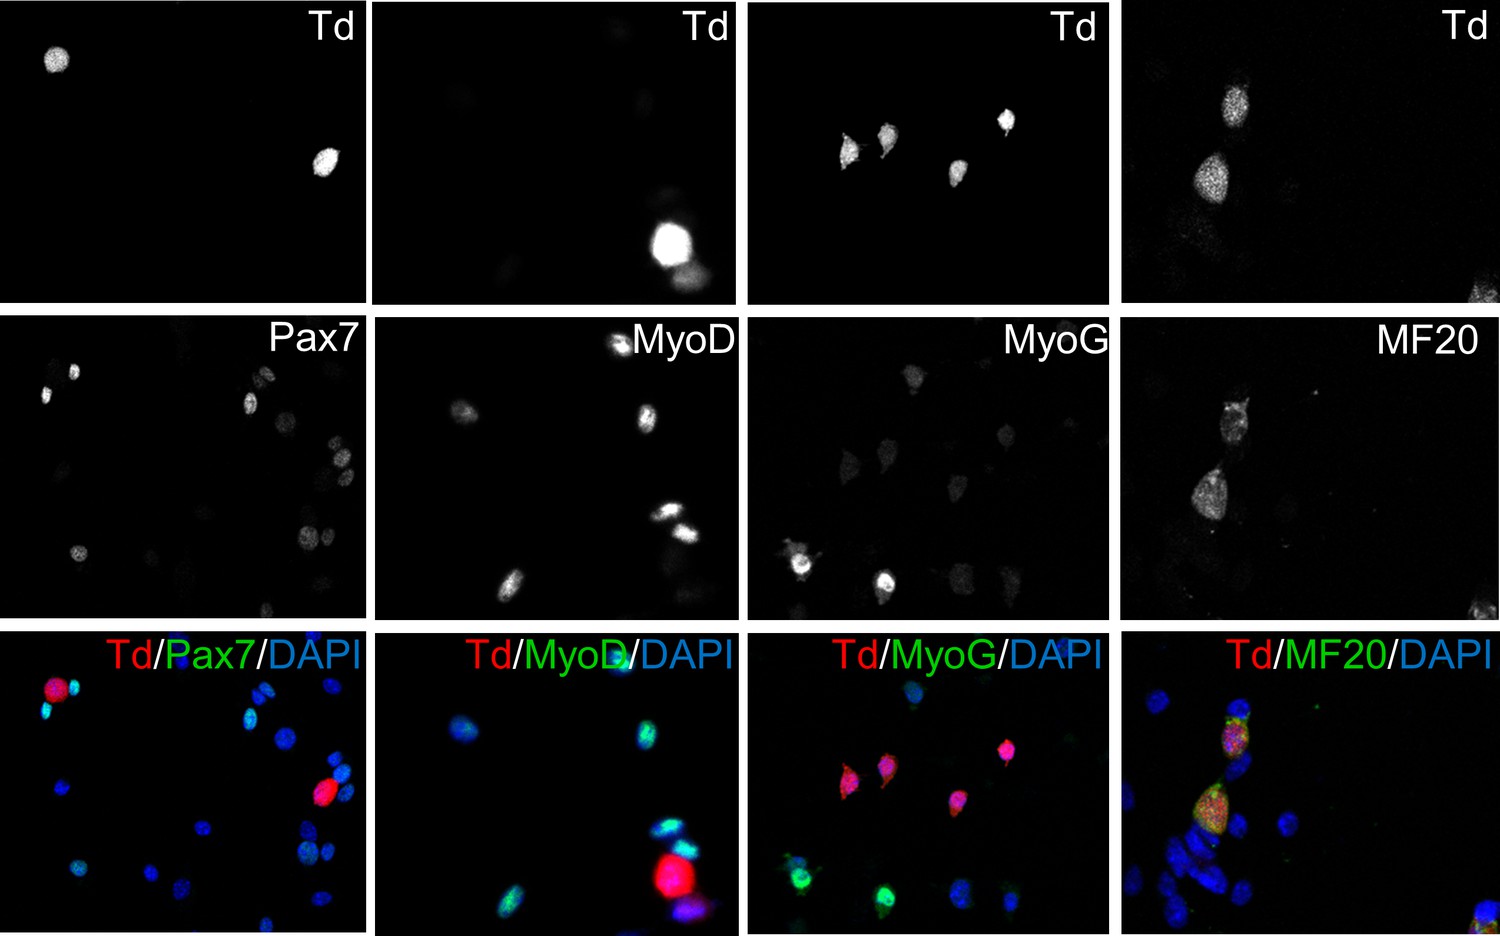
Expression of myogenic markers in MLC-Td myoblasts.
Primary myoblasts were isolated from MLC-Td mice and cultured in growth medium. Cells were fixed and stained with antibodies to detect Pax7, Myog, Myod and MF20, and merged with Td fluorescence.
Figure 2
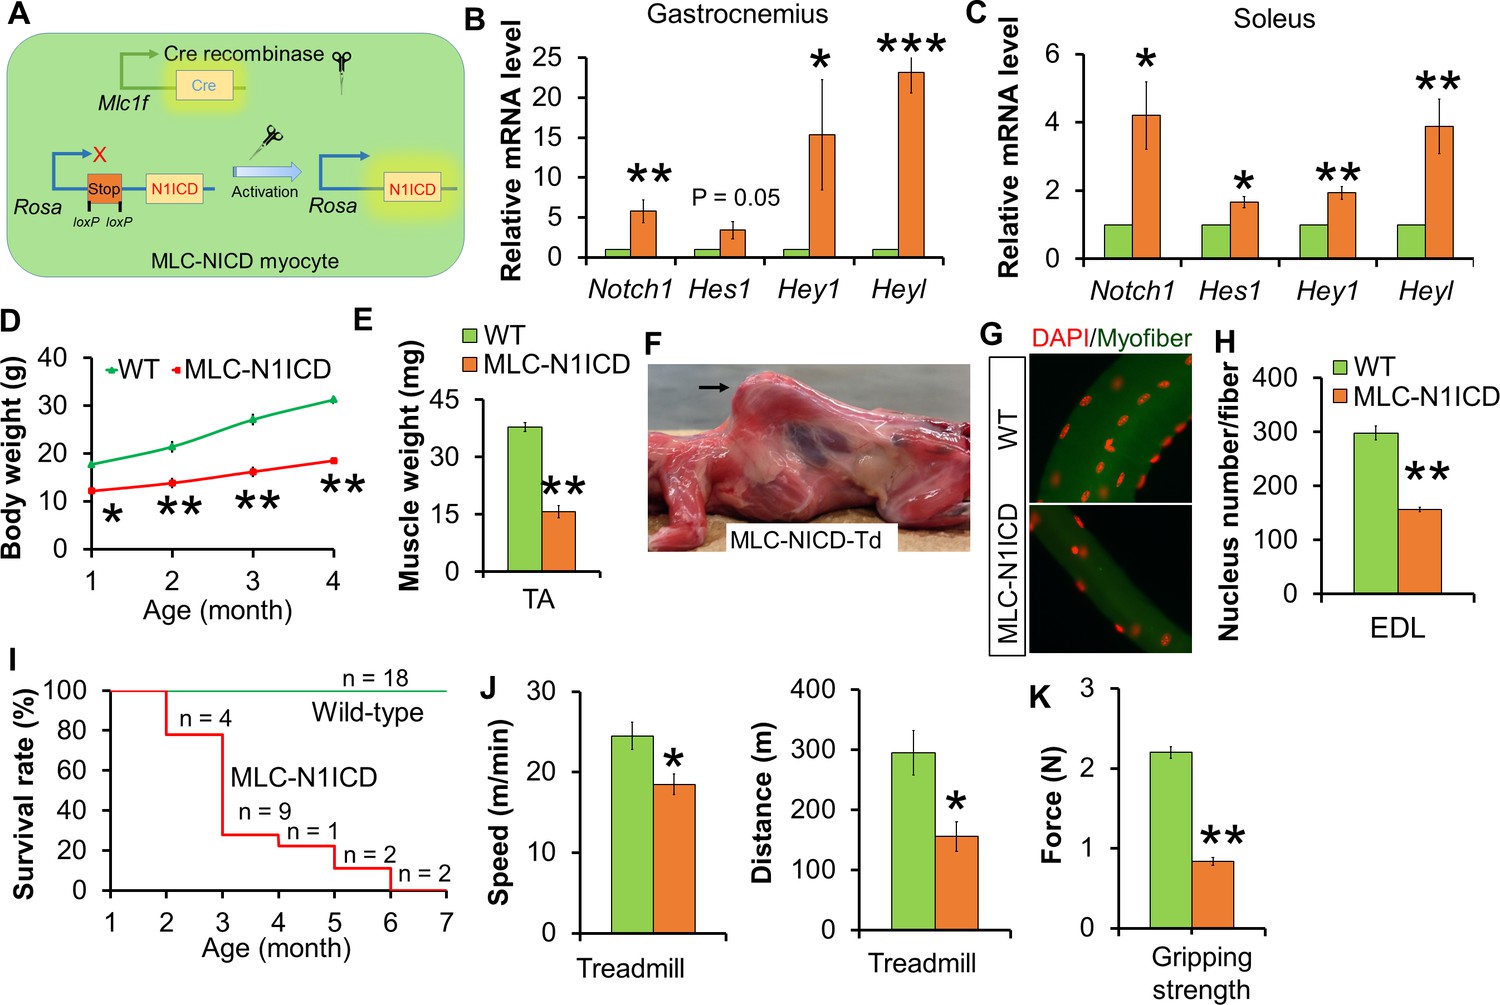
Muscle growth and motor-function defects of MLC-N1ICD mice.
(A) Cartoon illustration of Notch activation by Cre in MLC-N1ICD mice. (B,C) Relative gene expression levels in fast (B, gastrocnemius, n = 3) and slow muscles (C, soleus, n = 4). (D) Growth curve of MLC-N1ICD mice (n = 3). (E) TA muscle weight (n = 4). (F) Image of MLC-N1ICD-Td mouse with kyphosis (arrow), note muscles are in red color as labeled by RFP (Td). (G,H) Immunofluorescence images of EDL fiber (G) and quantification of myonucleus numbers (H, n = 3). (I) Survive curve of MLC-N1ICD mice. (J) Exhaustive treadmill exercise test results (n = 4). (K) Gripping strength measurement result of limbs (n = 3). *p<0.05, **p<0.01. Bar graphs indicate mean SEM.
Figure 3 with 2 supplements

Muscle regeneration defect, and myocyte dedifferentiation in MLC-N1ICD mice.
(A) H&E staining results of TA muscle cross sections. Right panels, 7 dpi. (B) Immunofluorescence images of TA muscle cross sections. Arrow points to Pax7+ cell in WT mice. (C) Immunofluorescence images (left) and quantification (right, n = 3) of Pax7+ cells (arrow) on EDL fibers. (D) Western blot results of protein extracts from non-injured muscle. (E,G) Relative expression of Pax7 (E, n = 3) and quiescent SC marker genes (G, n = 5) in gastrocnemius muscle. (F,H) Immunofluorescence images of EDL fibers. Note all Pax7+ cells are Ki67– in F; Note Pax7+/Td+ cells only appeared on MLC-N1ICD-Td but not on MLC-Td fibers in H, arrow points to Pax7+/Td– cells in H. *p<0.05, **p<0.01. Bar graphs indicate mean SEM.
Figure 3—figure supplement 1

Myocytes dedifferentiation in MLC-N1ICD mice.
(A) Immunostaining result of MyoG on EDL myofibers. (B,C) Relative expression of Pax7 (B, n = 3) and quiescent SC marker genes (C, n = 4) in soleus muscles. (D) Immunofluorescence result of Pax7 on regenerating MLC-Td EDL fibers, note all Pax7+ cells are Td–.
Figure 3—figure supplement 2
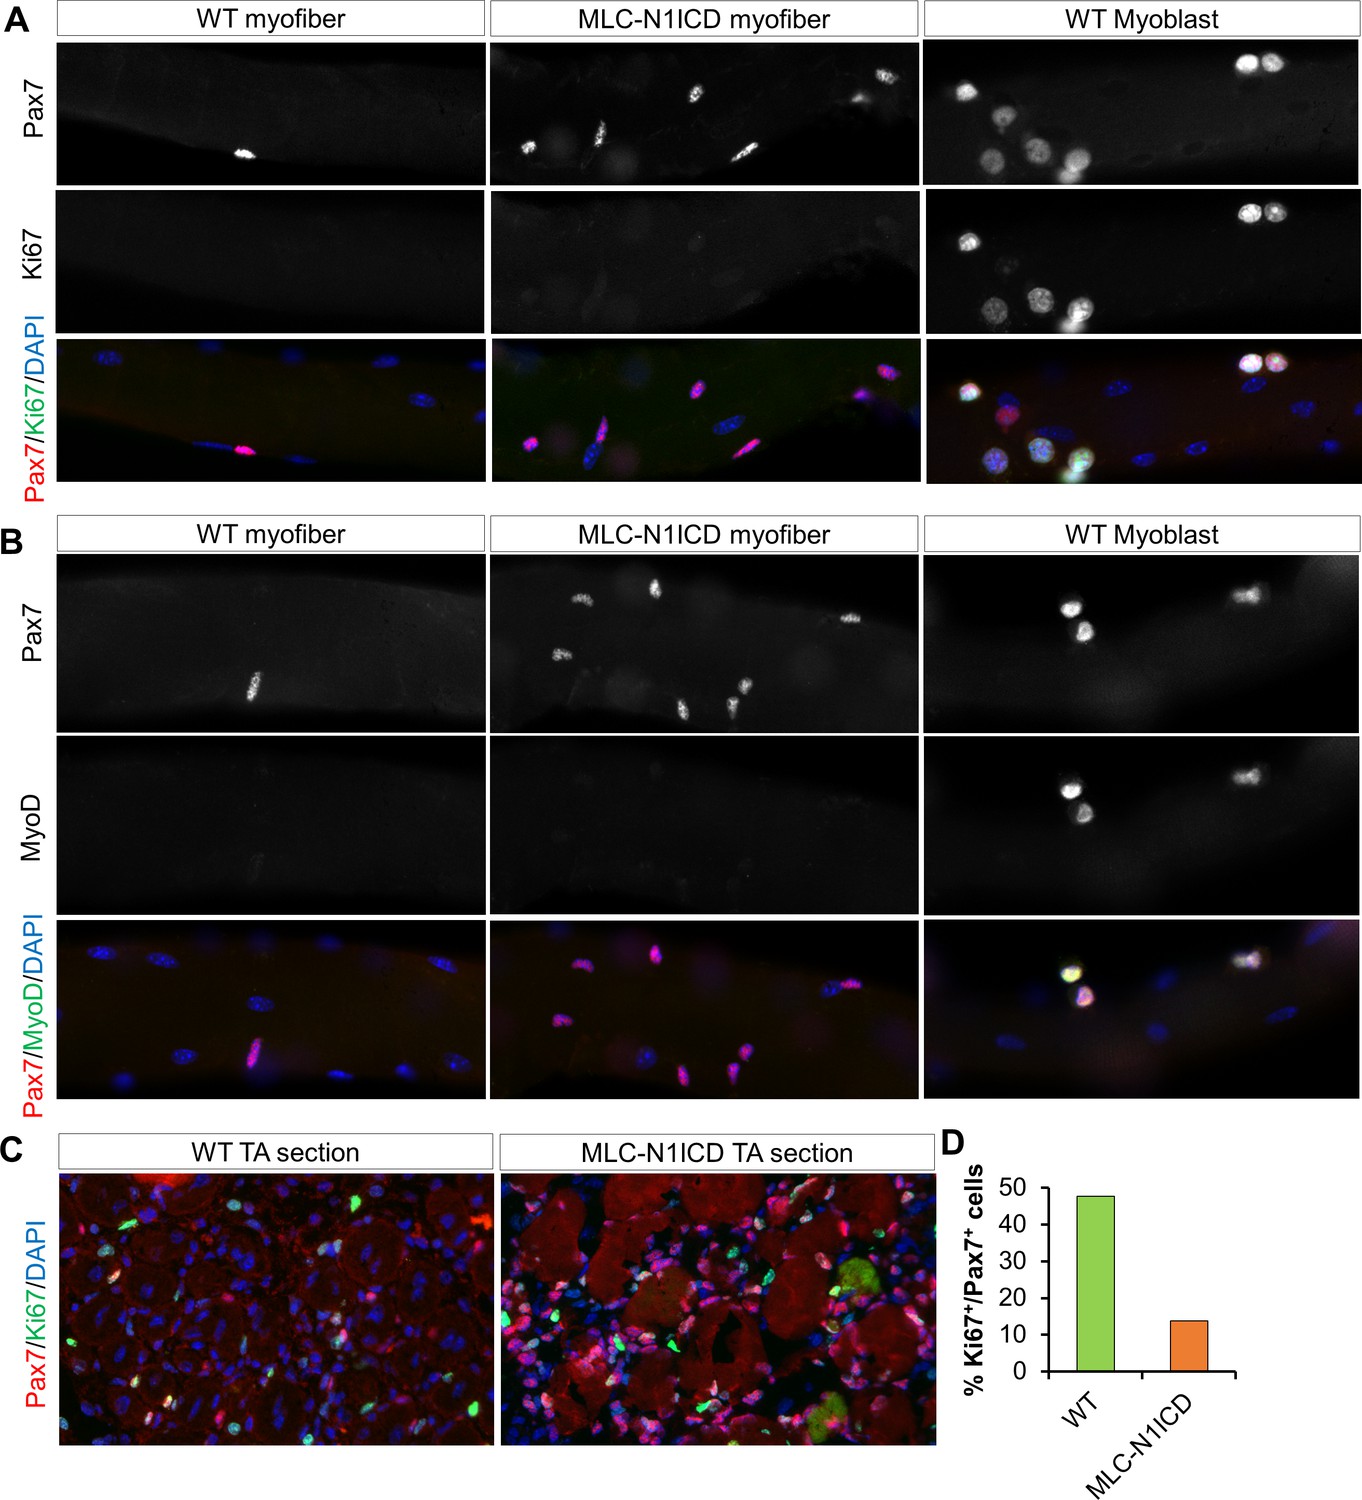
Immunostaining results of myofibers, myoblasts and sections of CTX damaged TA muscles.
Lack of Ki67 (A) and MyoD (B) expression in Pax7+ cells in freshly isolated EDL myofibers from WT and MCK-N1ICD mice. The right panels are control staining for Ki67 and MyoD positive cells in cultured WT myoblasts. (C) WT and MLC-N1ICD TA muscles at 7 days after CTX injury showing Pax7+ and Ki67+ myoblasts. (D) Percentage of Pax7+/Ki67+ cells among all Pax7+ cells in WT and MLC-N1ICD muscles as stained in C. n = 182 cells in WT, 660 cells in MLC-N1ICD muscles from two pairs of mice.
Figure 4 with 2 supplements
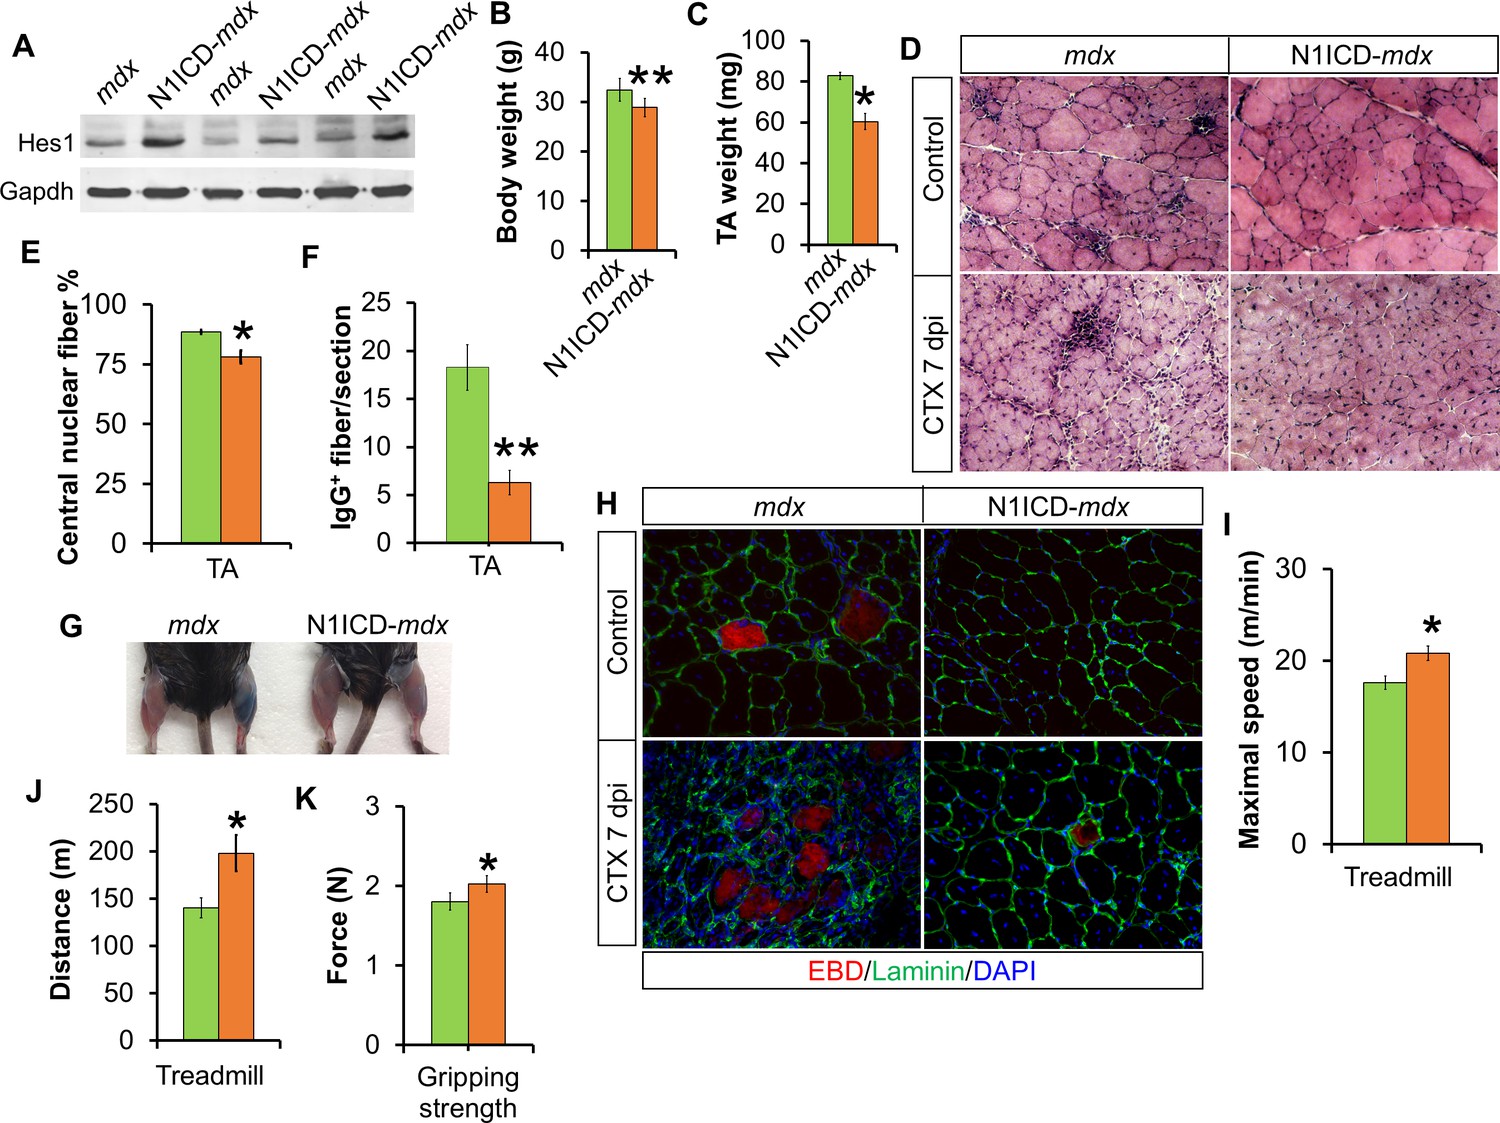
Improved muscle morphology, regeneration and exercise performance of adult MCK-N1ICD-mdx (short as N1ICD-mdx) mice.
(A) Western blot results of Notch target gene Hes1 in muscle protein extracts. (B,C) Mice body weights (B, n = 4) and TA muscle weights (C, n = 3), to show less muscle pseudo-hypertrophy of N1ICD-mdx, versus mdx mice. (D) H&E staining results of TA muscle sections. (E,F) Quantification of central nuclei fiber ratio (E, n = 3) and IgG+ fiber numbers (F, n = 7) of non-CTX injected mdx and N1ICD-mdx mice. (G) Results of Evans blue dye (EBD) uptake by control (left leg) and 7 dpi CTX-injured muscles (right leg). (H) Immunofluorescence staining results of TA muscle cross sections. (I,J) Exhaustive treadmill exercise test results (n = 5). (K) Gripping strength measurement of limbs of adult mice (n = 15). *p<0.05, **p<0.01. Bar graphs indicate mean SEM.
Figure 4—figure supplement 1
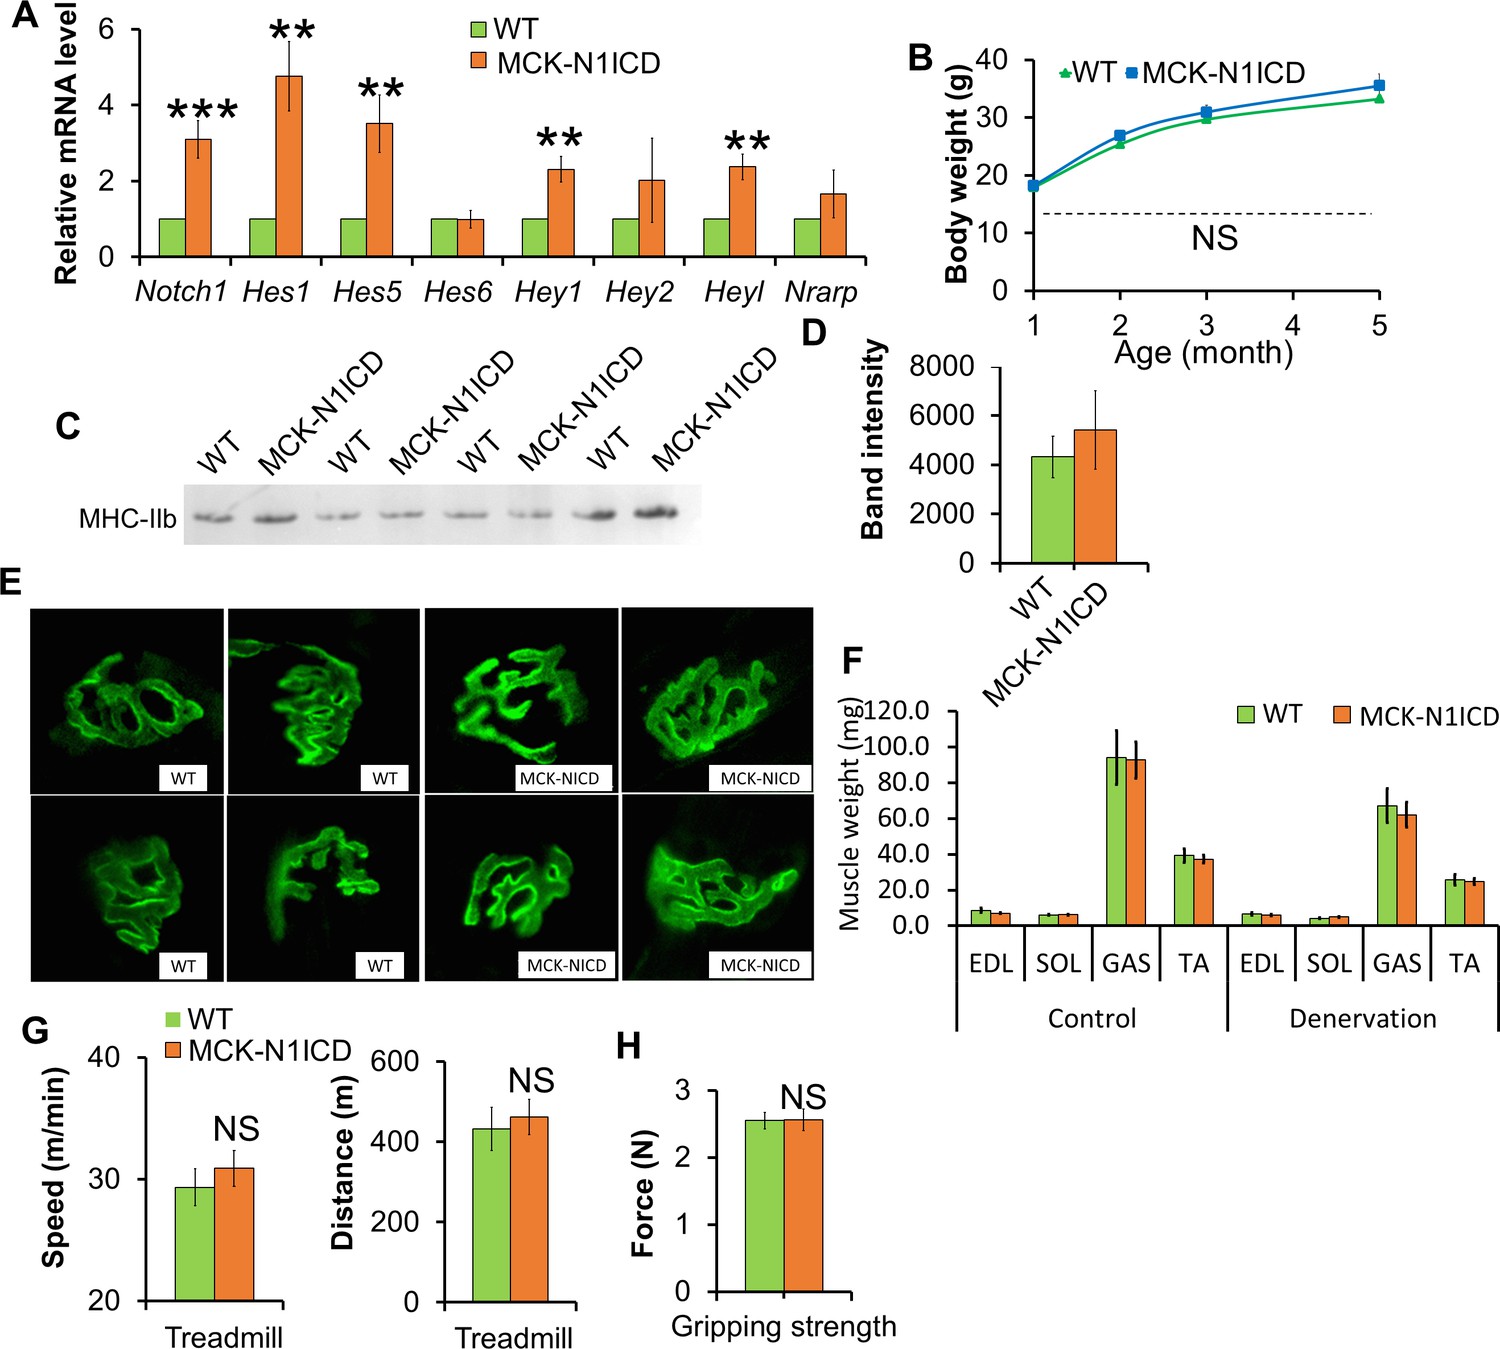
Normal muscle development, function and denervation response of MCK-N1ICD mice.
(A) Gene expression of Notch1 and its target genes in muscle tissues (n = 6). (B) Growth curve of mice (n = 4). (C,D) Silver staining (C) and quantification result (D) of gastrocnemius protein extracts separated by SDS-PAGE gel. (E) α-Bungarotoxin (green) staining of EDL muscles. (F) Weights of control muscle and 2-week post denervation muscles (n = 4). (G) Exhaustive treadmill exercise test results of adult mice (n = 4 WT and 9 MCK-N1ICD mice). (H) Gripping strength measurement result of limbs of adult mice (n = 5).
Figure 4—figure supplement 2
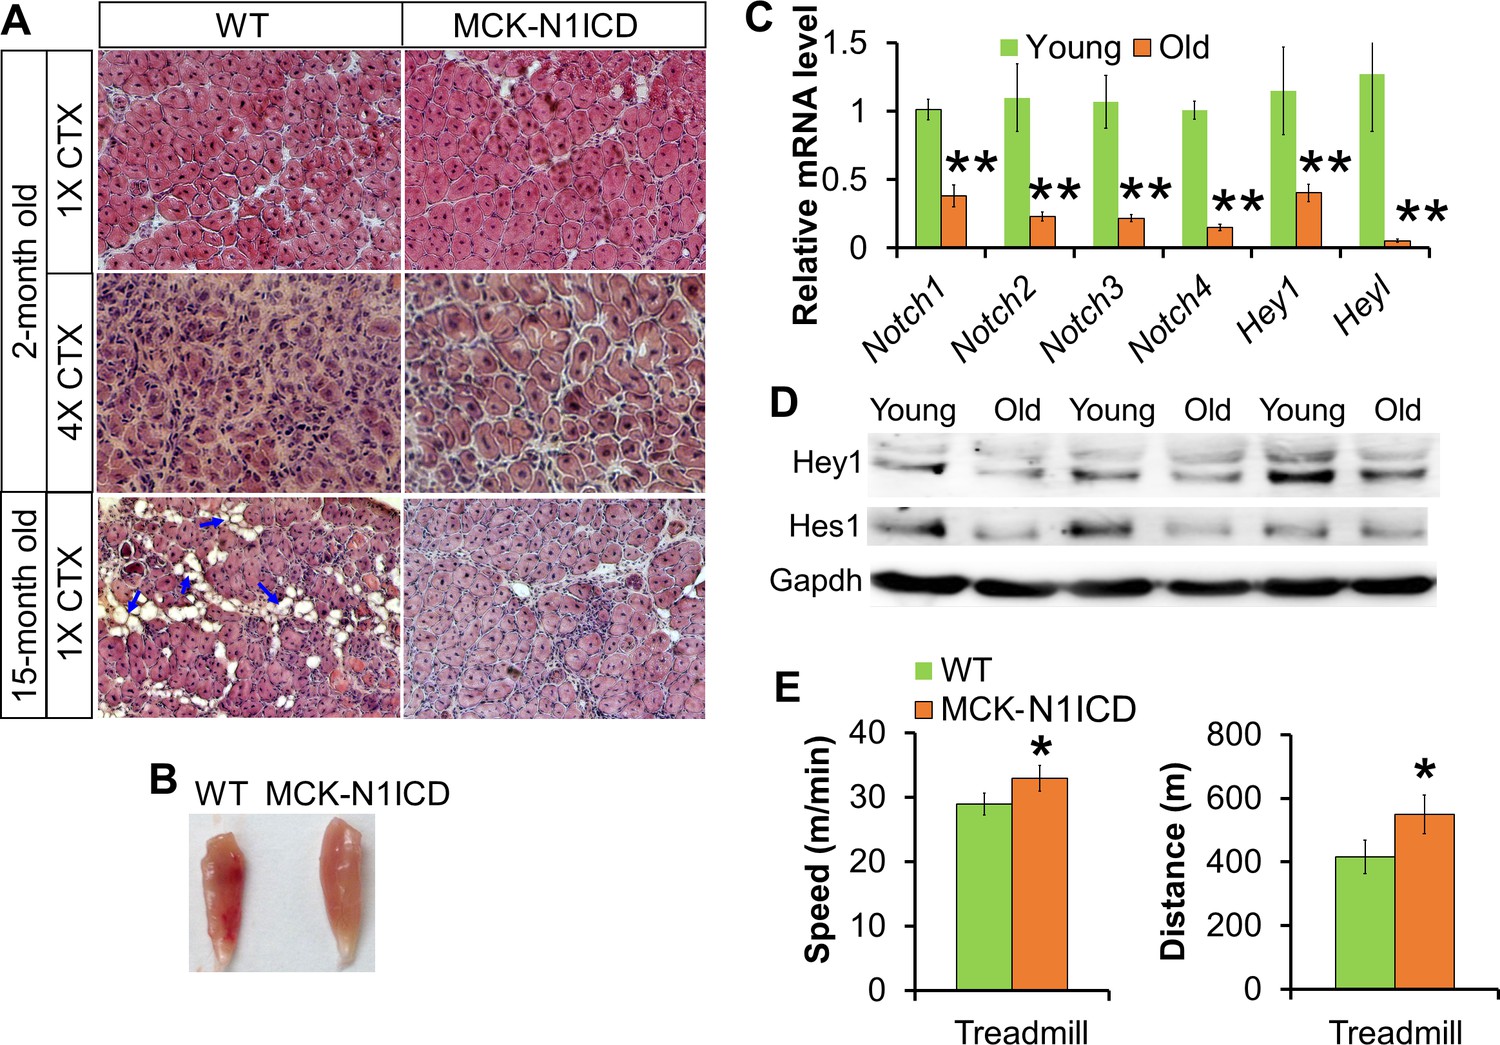
Improved muscle regeneration and function of aged MCK-N1ICD mice.
(A) H&E staining results of 7 dpi muscle of indicated conditions. Arrows point to adipocytes in aged muscles. (B) Image of TA muscle sections after 4 serial CTX-injuries, 7 dpi. (C,D) Gene expression of Notch receptors and target genes in WT muscle tissues (C, n = 5 young and 6 >1-year old muscles). (E) Exhaustive treadmill exercise performance test results of aged mice. *p<0.05, **p<0.01. Bar graphs indicate mean SEM.
Figure 5 with 1 supplement
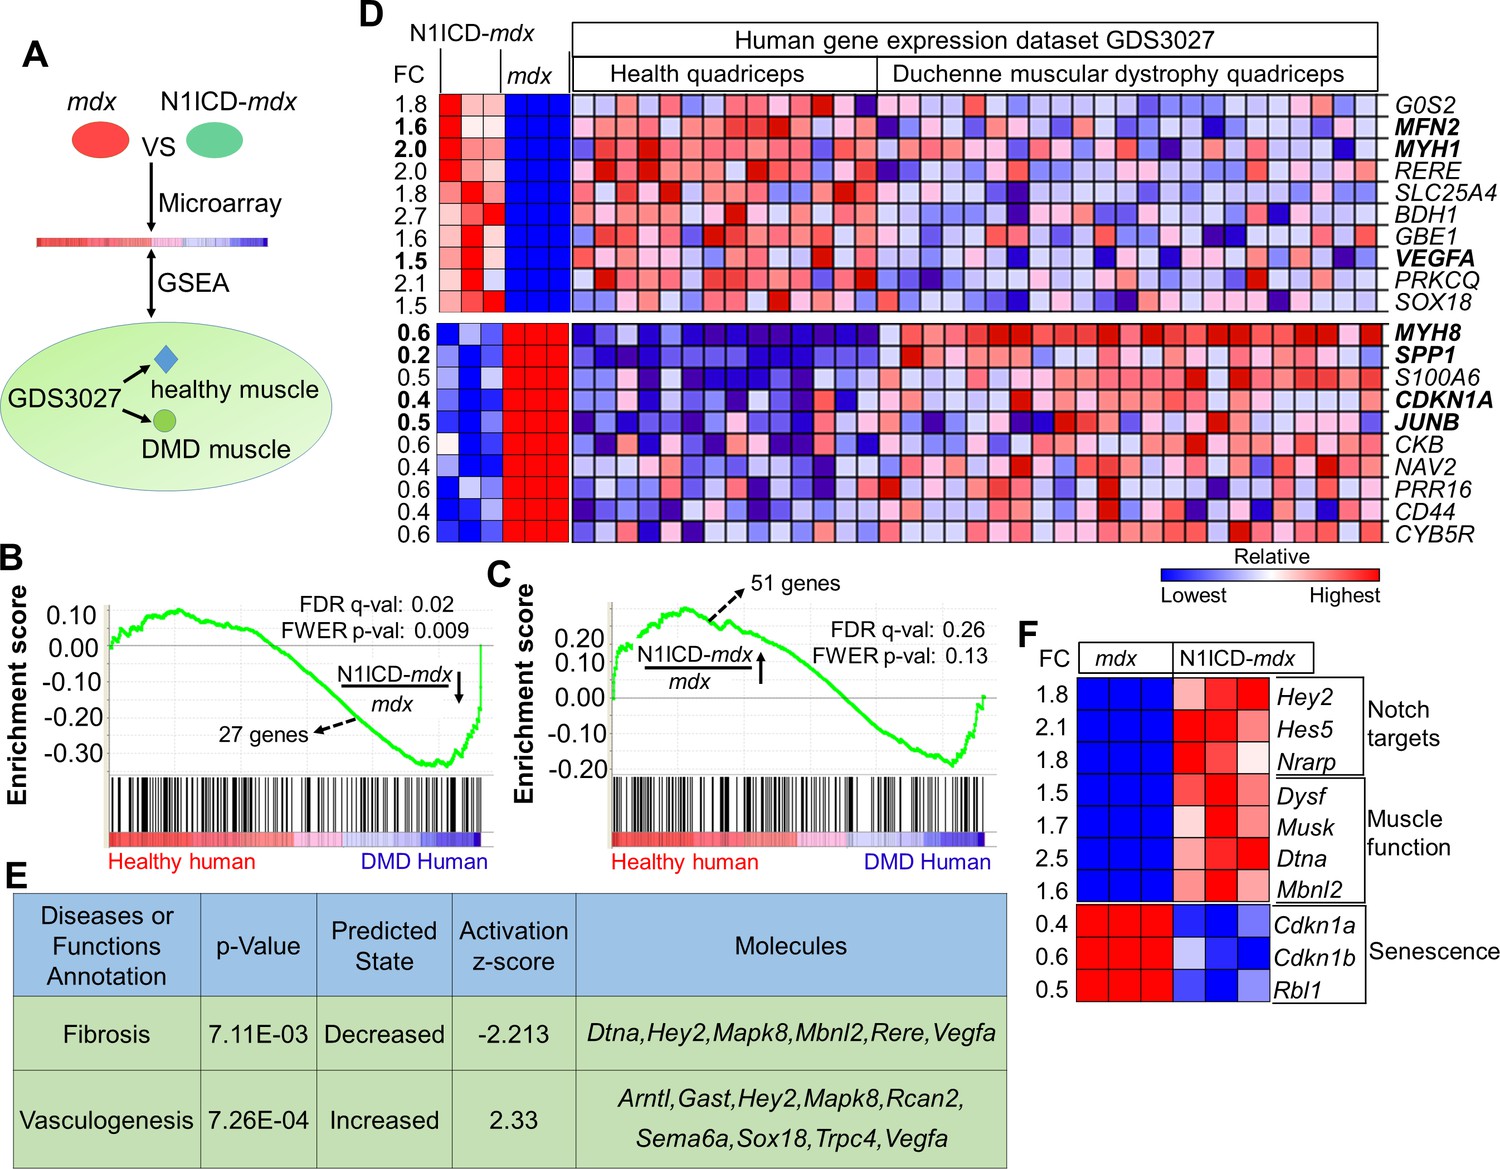
N1ICD-mdx muscle transcriptomes gained gene signatures enriched in healthy versus DMD human muscles.
(A) Cartoon illustration of experiment design for (B–D). (B,C) Gene set enrichment plots from GSEA analysis of the normal human and DMD muscle gene expression database (GDS3027), interrogated with the down-regulated (B) and up-regulated (C) gene sets in N1ICD-mdx versus mdx muscles. FC, fold change. (D) Heatmap results of top 10 commonly up-regulated and down-regulated gene expression in N1ICD-mdx muscles and normal human muscles (GDS3027). (E) Ingenuity analysis of 51 genes that are commonly up-regulated in N1ICD-mdx muscles and normal human muscles (GDS3027). (F) Heatmap results of gene expression in the indicated pathways. FC, fold change in N1ICD-mdx relative to mdx muscles.
-
Figure 5—source data 1
Agilent microarray results showing genes up-regulated and down-regulated in N1ICD-mdx versus mdx muscles.
- https://doi.org/10.7554/eLife.17355.013
Figure 5—figure supplement 1
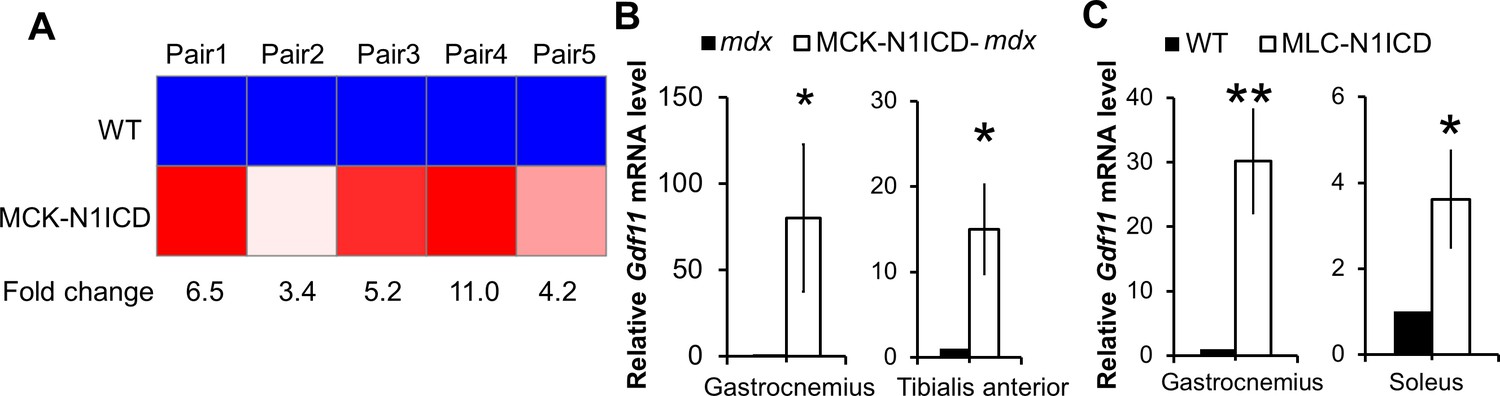
Activation of Notch1 signaling upregulates Gdf11 expression in muscles.
(A) Heat-map of gene expression results from microarray analysis, n = 3. (B,C) Relative expression levels of Gdf11 in different muscles of MCK-N1ICD-mdx and MLC-N1ICD mice, n = 5 for B and 3 for C. *p< 0.05, **p<0.01. Bar graphs indicate mean SEM.
Figure 6 with 2 supplements
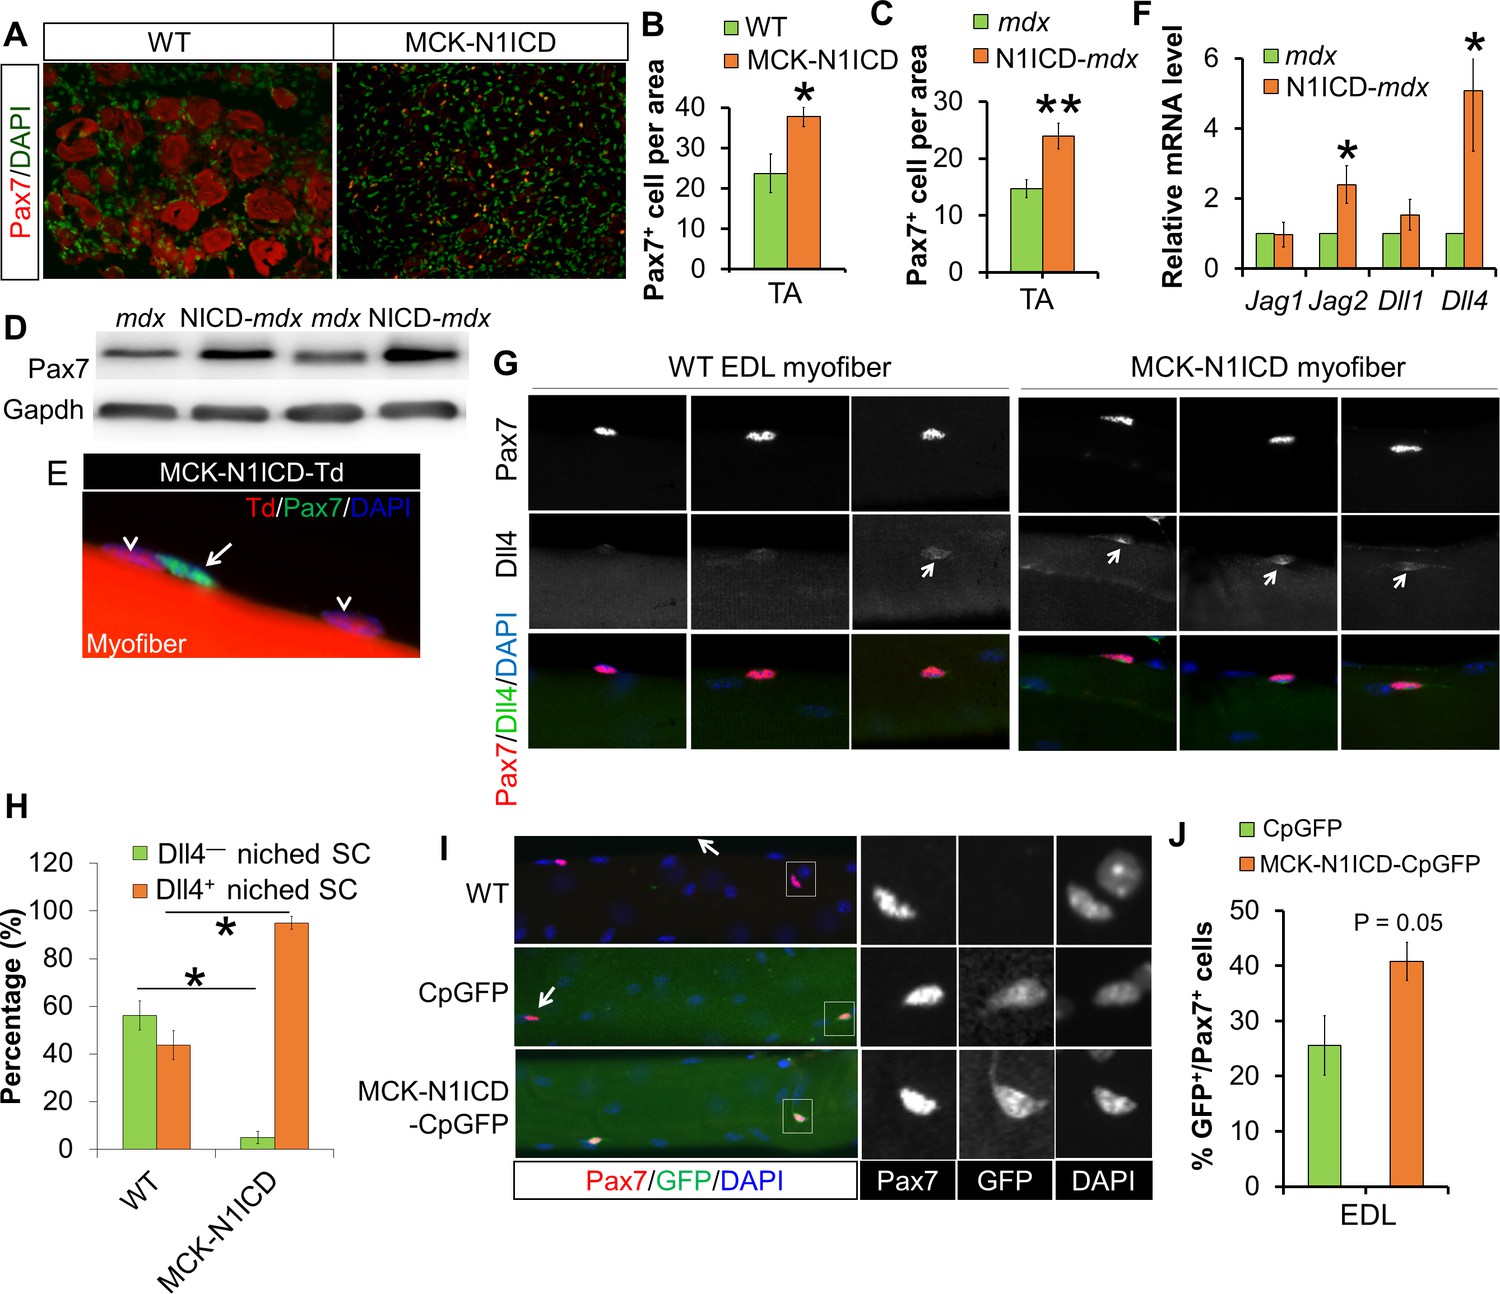
Notch activation in myofiber upregulates Notch ligands’ expression, therefore stimulates Notch-activation and self-renewal of satellite cells niched on MCK-N1ICD myofibers.
(A–C) Immunofluorescence images (A) and quantification of Pax7+ cell numbers in CTX-damaged (B, n = 3) and dystrophic TA muscles (C, n = 7). (D) Western blot results of Pax7 in muscle protein extracts. (E) Immunofluorescence image of one EDL myofiber to show that Pax7 cells are not from MCK-Cre lineage (Td –) of MCK-N1ICD mice. Arrow points to Pax7+/Td– cell, arrow-head points to Pax7–/Td+ myonucleus. (F) Relative mRNA levels of Notch ligand genes. (G,H) Immunofluorescence images (G) and quantification result (H, n = 3) of intact EDL myofibers. Arrow points to Dll4 immuno-signal patch on myofiber. (I,J) Immunofluorescence images (I) and quantification (J, n = 4) of GFP percentage in satellite cells (Pax7) on EDL myofibers. Arrow in I points GFP–/Pax7+ satellite cells; black and white images to shown individual channels of the outlined area on left images. *p<0.05, **p<0.01. Bar graphs indicate mean SEM.
Figure 6—figure supplement 1
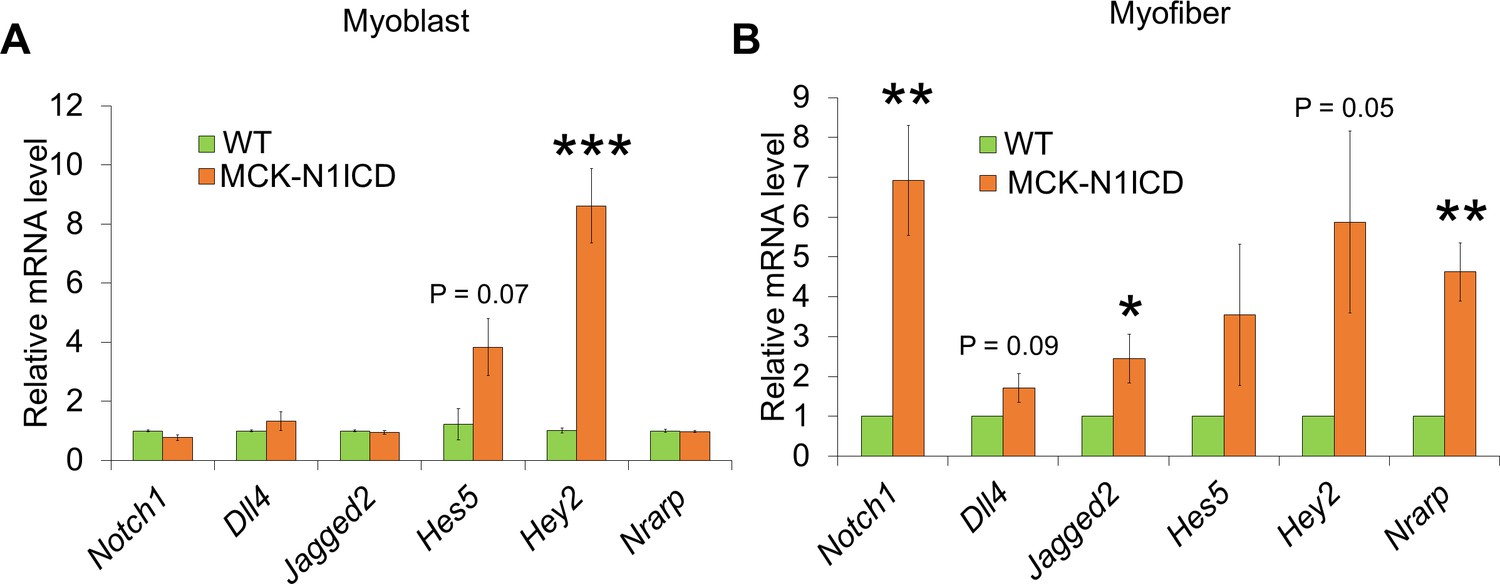
Real-time PCR results of Notch-related gene expression in primary myoblasts (A, n = 3) and myofibers (B, n = 5).
*p<0.05, **p<0.01, ***p<0.001.
Values are mean SEM.
Figure 6—figure supplement 2

Expression of Notch pathway genes in myofiber.
(A) Experiment design. (B) Immunofluorescence images of EDL myofiber from Pax7nGFP mice before and after trypsin stripping. Nuclear GFP labels satellite cells and DAPI labels nuclei. (C) Gel electrophoresis images of RT-PCR results using mRNA isolated from EDL myofibers. (D) Immunofluorescence staining of Pax7 and Dll4 in EDL myofibers. (E) Western blot results of WT myofibers after trypsin-stripping, showing an expression of activated Notch1 (N1ICD) and its target Hes1.
Figure 7 with 1 supplement
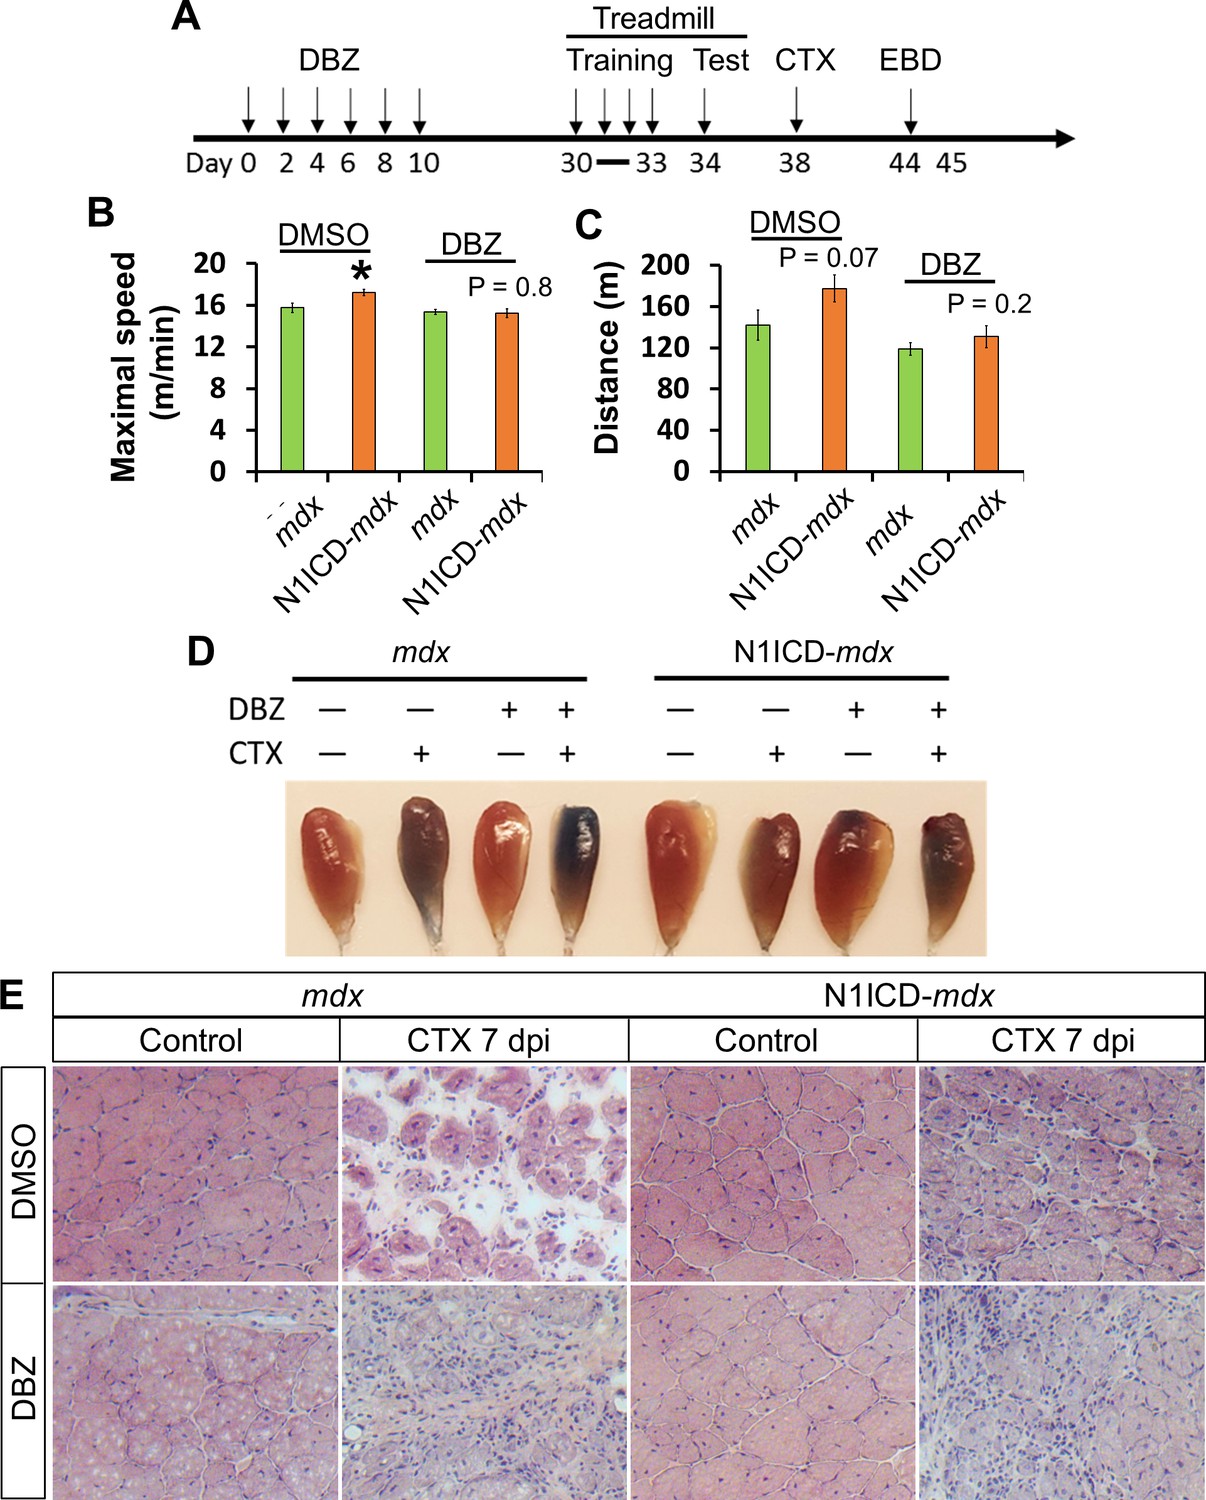
Notch inhibitor DBZ abolished improvements of exercise performance and muscle regeneration of N1ICD-mdx mice.
(A) Experiment design to show the timing of different treatments. EBD, Evans blue dye. (B,C) Exhaustive Treadmill exercise test results (n = 6). (D) Image of EBD uptake by TA muscles. (E) H&E staining results of TA muscle cross sections. *p<0.05. Bar graphs indicate mean SEM.
Figure 7—figure supplement 1

Absence of skeletal muscle development in Myod1Cre-NICD (MyoD-NICD) mice.
(A) H&E staining result of hind limb of newborn mice. (B,C) Immunostaining results of hind limb cross-sections for Pax7 and MyoD (B), MyoG (C). Arrow in B points to Pax7+/MyoD+ cell, arrowhead points to Pax7–/MyoD+ cell.
Figure 8
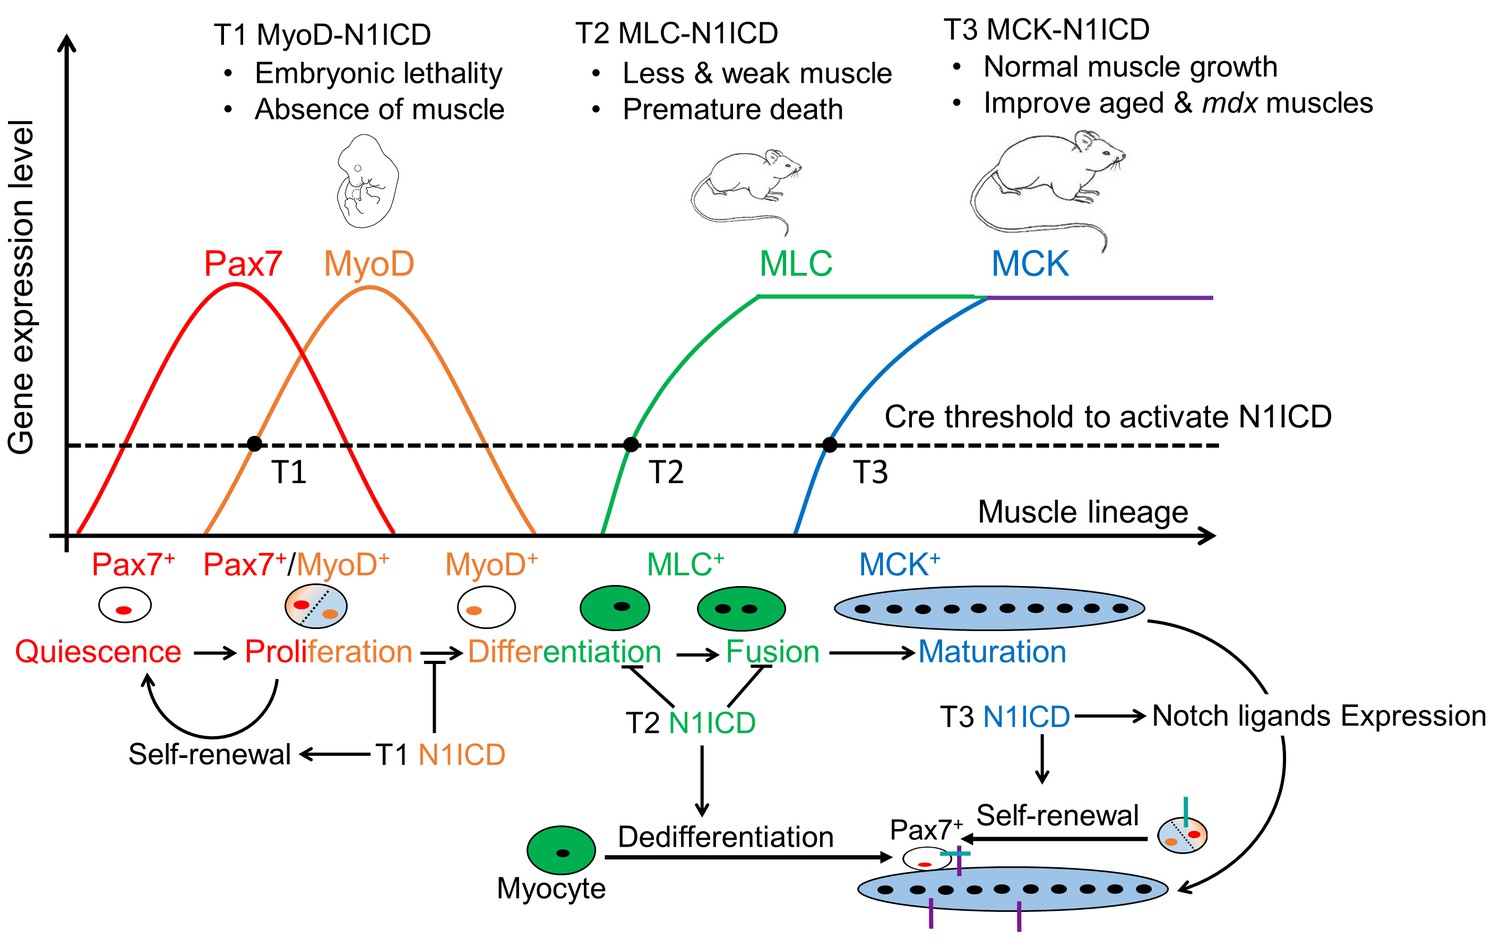
Summary of stage-dependent effects of Notch1 activation on muscle cell fate choice and myogenesis.
Quiescent satellite cells (SCs) are marked as Pax7+. Expression of MyoD activates SCs, which enter into cell cycle. A subpopulation of the replicated SCs downregulate Pax7 to differentiate. After differentiation, MLC starts to express in myocytes and nascent myotubes, while MCK only starts to express in the multi-nucleated myofibers. Activation of Notch1 in MyoDCre lineage (Timing 1, T1) blocks differentiation, promotes self-renewal of SCs, which causes absence of skeletal musculature and embryonic lethality; Activation of Notch1 in MLCCre lineage (T2) induces dedifferentiation of myocytes, and generates Pax7 quiescent SCs. As a consequence, MLC-N1ICD mice show pronounced defects of muscle growth, motor-function and regeneration; Activation of Notch1 in MCKCre lineage (T3) upregulates expression of Notch ligands on myofiber, which physiological promotes Notch activation in neighboring cells, inducing self-renewal of satellite cells. Thus, it improves muscle regeneration and exercise performance of old and mdx mice.
Download links
A two-part list of links to download the article, or parts of the article, in various formats.
Downloads (link to download the article as PDF)
Open citations (links to open the citations from this article in various online reference manager services)
Cite this article (links to download the citations from this article in formats compatible with various reference manager tools)
Stage-specific effects of Notch activation during skeletal myogenesis
eLife 5:e17355.
https://doi.org/10.7554/eLife.17355


