Chromosome-wide mechanisms to decouple gene expression from gene dose during sex-chromosome evolution
- Howard Hughes Medical Institute, University of California, Berkeley, United States
- Howard Hughes Medical Institute, University of Utah, United States
- University of Copenhagen, Denmark
Figures
Figure 1 with 1 supplement
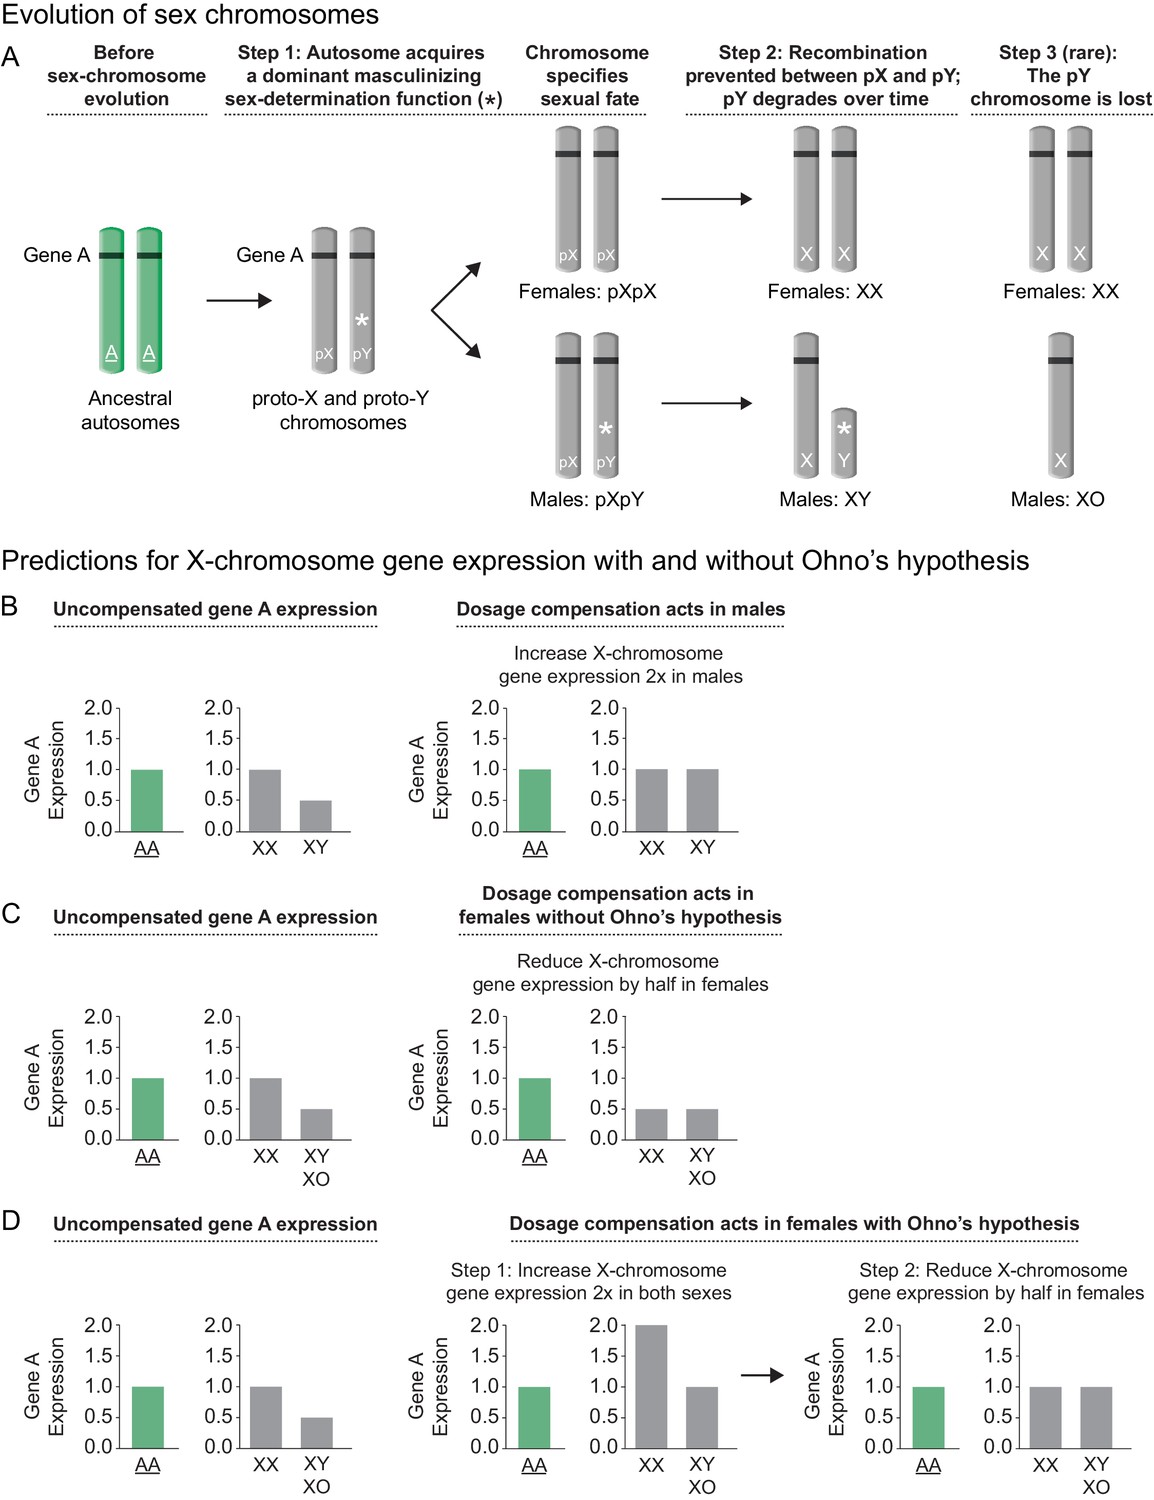
Sex chromosome evolution and its impact on gene expression.
(A) Sex chromosome evolution. In mammals, the X and Y sex chromosomes were derived from a single pair of homologous autosomes referred to as the ancestral autosomes (green). Before the evolution of sex chromosomes, genes represented by gene A (black) were present on both ancestral autosomes (AA). During sex chromosome formation, one autosome acquired a dominant male-determining gene (*), thereby converting an ordinary autosome pair into a proto-X (pX) chromosome and a male sex-determining proto-Y (pY) chromosome (step 1). As recombination ceased between the proto-Y and proto-X, and the proto-Y accumulated other male beneficial alleles, the proto-Y degenerated into the present-day gene-poor Y chromosome that specified male fate (step 2). Loss of genes from Y (e.g. gene A) caused genes from the ancestral autosome to be present in only one copy in males instead of two copies on the ancestral autosomal pair. While most mammalian sex chromosomes progressed only through steps 1 and 2, the nematode sex chromosomes were proposed to have evolved by a similar route but then to have undergone an additional step in which Y chromosome degradation progressed until the Y was lost completely (step 3), giving rise to XX hermaphrodites and XO males. Demise of Y was enabled by the emergence of a sex-determining mechanism that utilizes the ratio of X chromosomes to sets of autosomes (X:A signal) to determine sex rather than the dominant masculinizing gene that initiated sex-chromosome evolution. (B, C, D) Predictions for X-chromosome gene expression with and without Ohno's upregulation mechanism (B) Prediction for X-linked gene expression when the dosage compensation mechanism increases expression of X in males, a case not requiring Ohno's hypothesis. If the dose-sensitive gene A were expressed at a level of 1 when present in two copies on the ancestral autosomes, it would be expressed at a level of 0.5 in present-day males with only one copy on the single male X, and at a level of 1.0 in present-day females, which carry one copy on both X chromosomes. If gene A were haploinsufficient, its reduced expression could have deleterious consequences for the male. To compensate for reduced gene expression in males, a dosage compensation mechanism arose to balance X expression between the sexes. Drosophila melanogaster increases X-linked gene expression two-fold in males, thereby balancing the level of gene expression with that in present-day females and that in the ancestral species prior to sex-chromosome evolution. (C) Prediction for X-linked gene expression when the dosage compensation mechanism reduces X gene expression in females without an accompanying upregulation mechanism proposed by Ohno. X-chromosome dosage compensation in mammals and C. elegans occurs by mechanisms different from that of Drosophila, even though sex chromosomes may have evolved by a similar route. These species compensate for the imbalance in X-chromosome dose between the sexes by reducing X-linked gene expression in females/hermaphrodites by half, causing both sexes to express gene A at half the level of the ancestral species prior to the evolution of sex chromosomes. (D) Prediction for X-linked gene expression when Ohno's mechanism of upregulation operates and the dosage compensation mechanism reduces X gene expression in females. Recognizing that reducing X-chromosome gene expression in females as a mechanism of dosage compensation between sexes might create a deleterious reduction in X-chromosome products for both sexes, Susumo Ohno proposed a two-step mechanism for the regulation of X gene expression. After the degeneration of Y began but before the evolution of dosage compensation, a mechanism would arise to increase X-chromosome gene expression two-fold in both sexes (step 1). This upregulation of X expression would make expression from the male X equal to that of the ancestral autosomes but would cause a two-fold overexpression of X-linked genes in females relative to the ancestral autosomes. The overexpression in females would then be offset by an X-chromosome dosage compensation process that reduced X expression in females, thereby balancing X expression between males and females, as well as balancing expression between female X chromosomes and the ancestral autosomes (step 2).
Figure 1—figure supplement 1
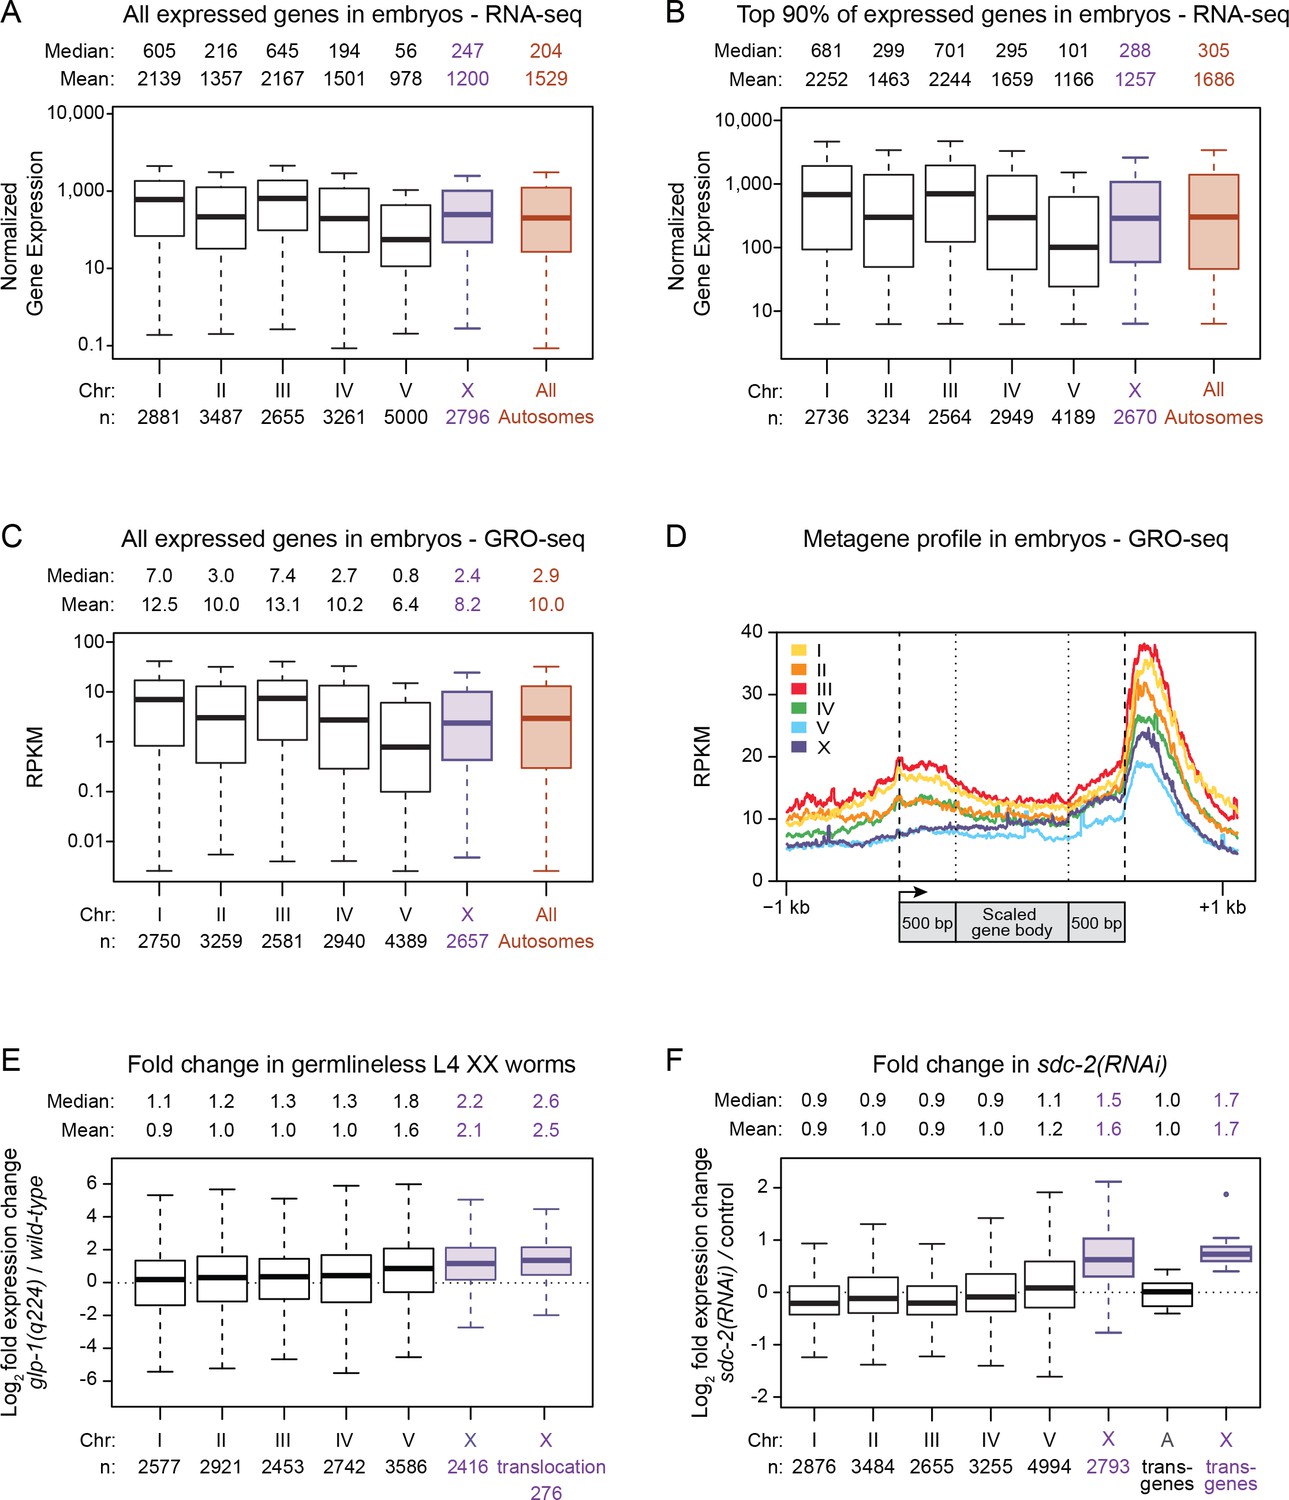
Average gene expression levels vary across autosomes.
(A) Boxplots depict normalized RNA-seq counts per kb for each autosome (black), for X (purple), and for the aggregate level of gene expression on all autosomes (red) as measured from RNA made from mixed-stage embryos. Gene expression levels were normalized between experiments and also by gene length in kb. The analyses included all genes with an expression value greater than 0. The median and mean expression levels are listed above each boxplot, and the number of genes included in each analysis is indicated below the graph. Outliers are not shown. The boxplots show that the mean level of gene expression varies widely across the five autosomes (by 2.2-fold for all expressed genes). (B) Boxplots as in part A but only with genes having expression levels in the top 90%. The mean gene expression varies by 1.9-fold across the autosomes. (C) Global run-on sequencing (GRO-seq) used to quantify gene expression levels in mixed-stage embryos is reported as chromosome-wide boxplots, as in previous figures. Gene expression values were normalized to the number of million mapped reads and to the gene length in kb. As seen with RNA-seq measurements, the GRO-seq measurements show that the average level of gene expression varies widely (by two-fold) across the autosomes. The X:A expression ratio is 0.8 (D) Metagene analysis of gene expression on individual chromosomes as assayed by GRO-seq. Scaling of genic regions was as follows: the gene bodies were scaled to 1 kb, but neither the 5' ends (−1 kb to +500 bp of the transcription start site [arrow]) nor 3' ends (500 bp upstream to 1 kb downstream of 3' end) were scaled. This analysis shows that the variability in average expression among the autosomes is evident as a difference in the distribution of engaged polymerases across the gene bodies and regulatory regions of all genes on each chromosome. (E) Boxplots depict the fold change in gene expression between glp-4(q224) germlineless L4 XX animals and control L4 XX animals. Shown are the modENCODE data for all expressed genes on each autosome (black), the X chromosome (X, purple), and the 276 genes that are X-linked in C. elegans (X translocation, purple) but autosome-linked in P. pacificus. These box plots show that silencing of germline expression is preferential to X chromosomes. Also, the 276 genes that are X-linked in C. elegans but not P. pacificus undergo germline silencing in C. elegans, meaning that analysis of gene expression in young adults is not valid for comparing gene expression between C. elegans and P. pacificus, as done in Albritton et al. (2014). (F) Boxplots depict the fold change in gene expression in sdc-2(y93; RNAi) embryos relative to control embryos for all genes on each autosome (black) or the X chromosome (X, purple). A boxplot also depicts the fold change in gene expression observed for X-linked reporter transgenes in sdc-2(RNAi) L1s vs. control L1s (X transgenes, purple). The single outlier for the X reporter transgenes is shown. The X-linked reporters all have elevated expression in dosage-compensation-defective mutants, as do endogenous genes on X vs. those on autosomes.
Figure 2
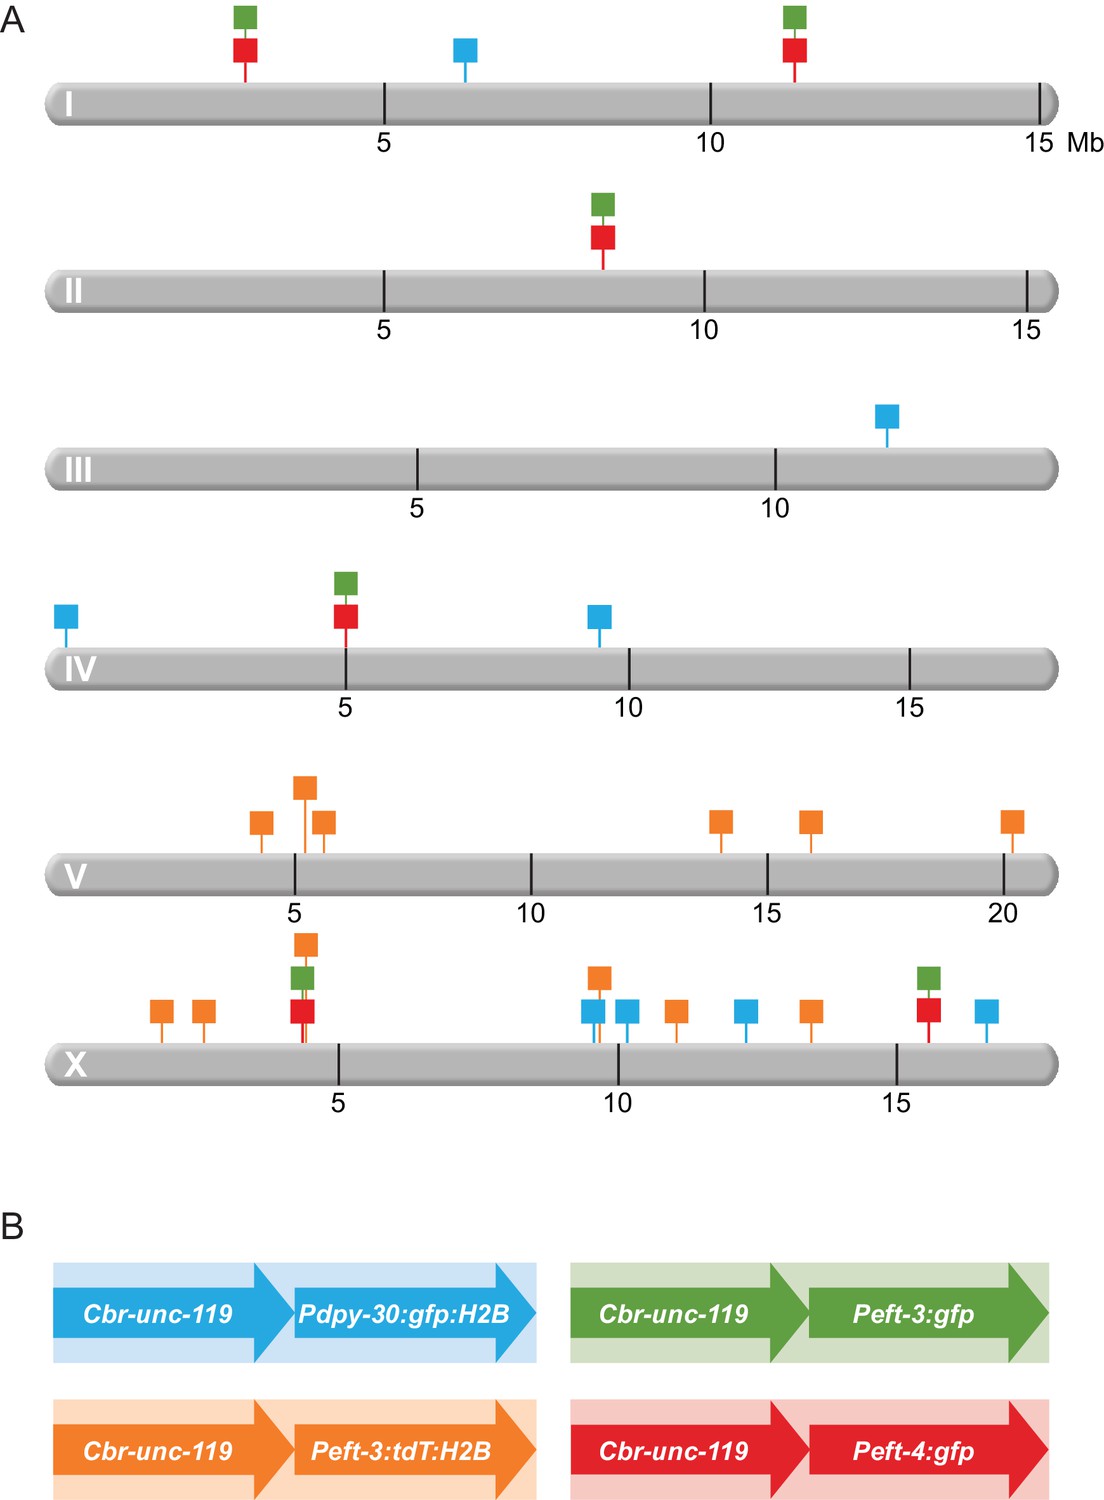
Schematic diagram of transgenes integrated throughout the genome.
(A) Chromosomal locations of transgene cassettes are represented by square flags marking the insertion sites on all six C. elegans chromosomes. (B) A transgene cassette is composed of two distinct reporters integrated at each site: Cbr-unc-119 and a fluorescent reporter with one of three C. elegans promoters. The flag color in (A) corresponds to the composition of the cassettes (shown in B. Transgene cassettes containing Peft-3:gfp (green) and Peft-4:gfp (red) were inserted in the same four sites using targeted Mos1-mediated Single Copy Insertion (mosSCI). Transgene cassettes containing Pdpy-30:gfp:H2B (blue) and Peft-3:tdTomato:H2B (orange) were inserted randomly throughout the genome using miniMos. Cassettes of each type are numbered sequentially, from left to right, along a chromosome. For example, in subsequent figures, the first 'green cassette' on the left end of chromosome I will be indicated by a green flag and 'Chr I, site 1'; the second 'green cassette' will be 'Chr 1, site 2'. The first 'green cassette' on the left end of X will be indicated by a green flag and 'Chr X, site1'.
Figure 3 with 1 supplement

Transgenes integrated on X but not autosomes are regulated by the DCC, which balances X expression between sexes.
(A) Quantification in control RNAi XX (light) or sdc-2(RNAi) XX (dark) L1 larvae of mRNA levels for the two reporters in each transgene cassette on X chromosomes (blue) and autosomes (gray). The bars represent the average level of expression among at least three biological replicates for each reporter in a cassette. Data for reporters are presented in the same order, from left to right, as the order of transgene cassettes along a chromosome (see Figure 2). The fold change in gene expression between sdc-2(RNAi) XX (dark) and control XX animals (light) is shown above each transgene, with the number asterisks indicating the p-value: p≤0.05, one asterisk; p≤0.01, two asterisks; p≤0.0001, four asterisks (Student's t-test). Error bars show the standard error of the mean for at least three biological replicates. All reporters on X show significant elevation in gene expression in the dosage-compensation-defective sdc-2(RNAi) XX L1s compared to control XX L1s. In contrast, none of the reporters on autosomes exhibit a significant increase in expression in sdc-2(RNAi) XX L1s. A few autosomal reporters (see Peft-3:tdT:H2B and Peft-4:gfp) exhibit slight but significant reduction in gene expression, consistent with previous genome-wide measurements of gene expression in dosage compensation mutants (Jans et al., 2009; Kruesi et al., 2013; Crane et al., 2015). (B) Comparison of mRNA levels in XX vs. XO L1/L2 animals for transgene cassettes integrated on X. Total reporter mRNA levels were quantified in XX animals that were homozygous for the transgene cassettes (2 copies of each reporter) and XO animals that were hemizygous for the transgene cassette (1 copy of each reporter). Reporters in cassettes selected for this experiment are designated by § or ‡ in panels A and B. The fold change in gene expression is indicated above each pair of measurements in XX and XO animals. The expression levels were not statistically different between the two copies in XX animals vs. the single copy in XO animals, indicating that the reporters in each transgene cassette became dosage compensated (Student's t-test). Error bars show the standard error of the mean for at least three biological replicates.
Figure 3—figure supplement 1

Transgene expression levels are highly consistent for sites across the X chromosome and for sites across an autosome in XX animals.
(A) Data from qRT-PCR recapitulate RNA-seq and GRO-seq data. The expression levels of two dosage compensated genes (F41E7.5 and F47B10.2), one non-dosage-compensated gene on X (C15C7.5), and one non-dosage-compensated gene on an autosome (F19F10.9) were determined by qRT-PCR in sdc-2(RNAi) XX animals and control RNAi XX animals. Responses of the three classes of genes to sdc-2(RNAi) indicate that our qRT-PCR approach to assess transgene expression recapitulates the gene expression results obtained from RNA-seq and GRO-seq experiments. Known compensated genes have elevated expression in sdc-2(RNAi) animals and non-compensated genes do not. (B) Comparison of transgene expression at different sites along a chromosome reveals only minimal position effects. Each black circle shows the average expression level of the Cbr-unc-119 reporter transgene from all four transgene cassettes at distinct positions in the genome. Reporters are grouped by the chromosomal locations of the transgene cassette, including all sites on autosomes, all sites on chromosome V, and all sites on chromosome X. The expression levels of Cbr-unc-119 reporters on X are provided for both control RNAi and sdc-2(RNAi) XX animals. Each circle represents the average of at least three biological replicates. The red bar indicates the mean, and the blue bars indicate the standard error of the mean. The variation in Cbr-unc-119 expression is low across all insertion sites, as indicated by the absolute variation in expression levels and the coefficient of variation for each group. The number above each pairwise combination indicates the fold change in gene expression, and the asterisks indicate the level of significance: p≤0.001, three asterisks; p≤0.0001, four asterisks (Student's t test). The low expression variation among transgenes on X and autosomes permits the robust conclusion that expression of X-linked transgenes in XX animals is significantly lower than expression of autosomal transgenes, contrary to predictions of a chromosome-wide mechanism of X-chromosome gene upregulation.
Figure 4 with 1 supplement
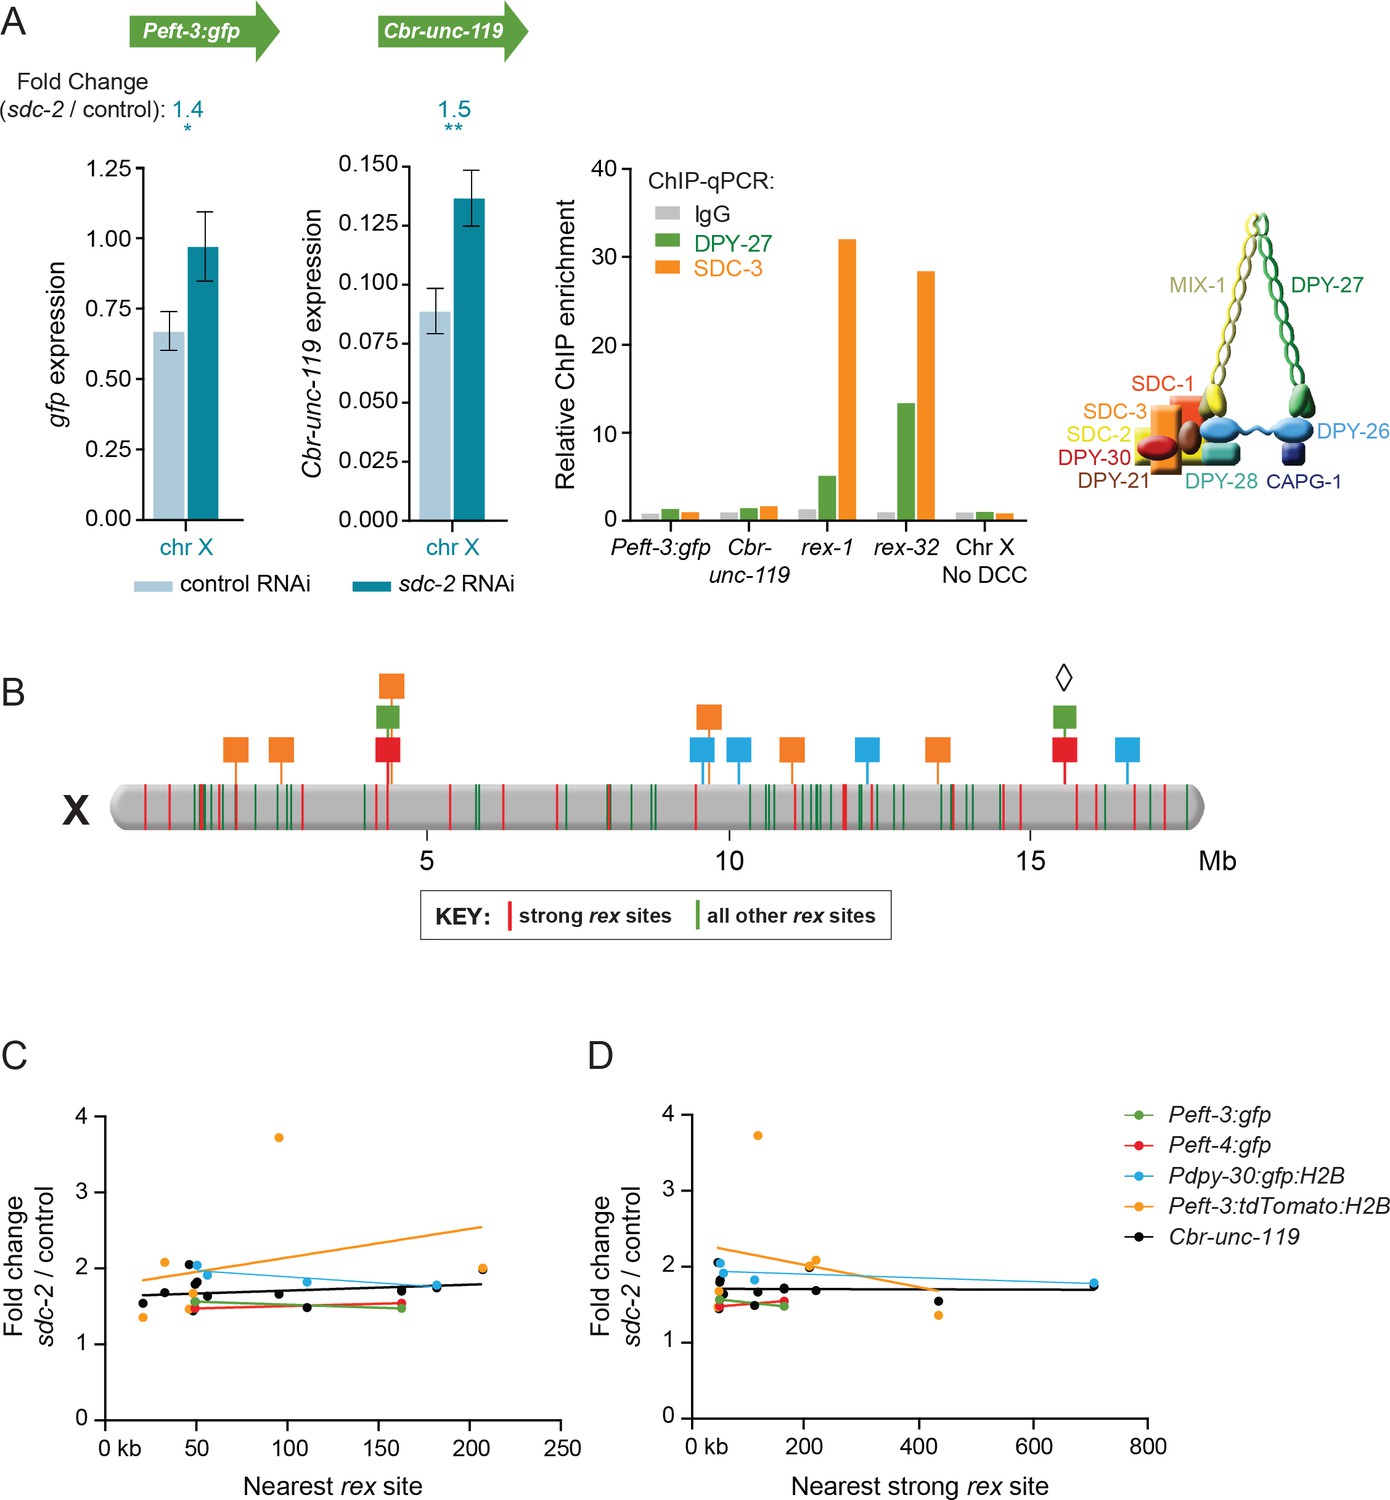
Dosage compensation of transgenes does not require local DCC binding.
(A) Quantification of mRNA levels and DCC binding for the Peft-3:gfp and Cbr-unc-119 reporters integrated at position 15.6 Mb on chromosome X. Gene expression is represented as in Figure 3. ChIP was conducted using antibodies against DCC subunits DPY-27 (green) or SDC-3 (orange), and the negative control IgG (gray). ChIP enrichment was calculated using quantitative PCR with primers for the Peft-3:gfp and Cbr-unc-119 reporters, the strong rex sites rex-1 or rex-32, and a region of X that does not recruit the DCC. Enrichment is expressed relative to an autosomal region that does not recruit the DCC and is normalized to input. A schematic diagram of the DCC is shown. The two reporters became dosage compensated even though no DCC complex was detected at either reporter in the integrated transgene cassette. (B) A schematic diagram of relative positions for X-linked transgene cassettes and endogenous rex sites on the X chromosome. Cassette locations are represented as flags, as in Figure 1. Colored bars on X indicate the positions and strength of endogenous rex sites. The 25 strongest rex sites are shown in red; all other rex sites are shown in green. rex-site strength was assessed by SDC-3 occupancy in ChIP-seq experiments. The diamond indicates the Peft-3:gfp and Cbr-unc-119 transgene cassette tested for DCC binding in part A. (C and D) Scatter plots compare the fold change in gene expression of reporters vs. the distance of the nearest rex site of any strength (C) or the nearest strong rex site (D). No correlation was found between the extent of a reporter's increase in expression in DCC-defective animals and its proximity to a rex site. Linear regression lines are shown for each transgene.
Figure 4—figure supplement 1
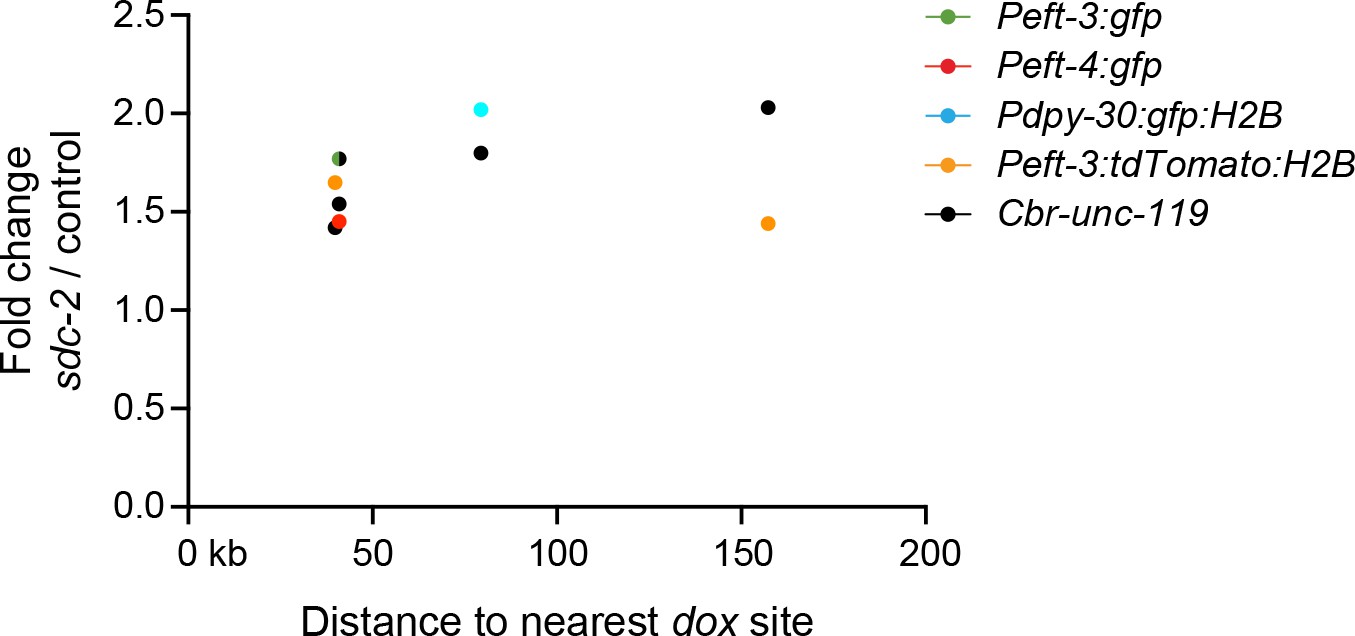
Transgenes do not require close proximity of a dox site to become dosage compensated.
Scatter plots compare the fold change in gene expression of reporters vs. the distance of the nearest dox site. No correlation was found between the extent of a reporter's increase in expression in DCC-defective animals and its proximity to a dox site. Plots show transgenes in the X intervals of 10.3–12.7 Mb and 4.2–4.4 Mb, because those are the intervals on X for which every DCC binding peak (2 kb) determined by ChIP-chip was assayed in vivo for whether it recruited the DCC in an autonomous manner (Jans et al., 2009). For the single case in which the values for Peft-3:gfp and Cbr-unc-119 overlap, the circle is half green and half black.
Figure 5
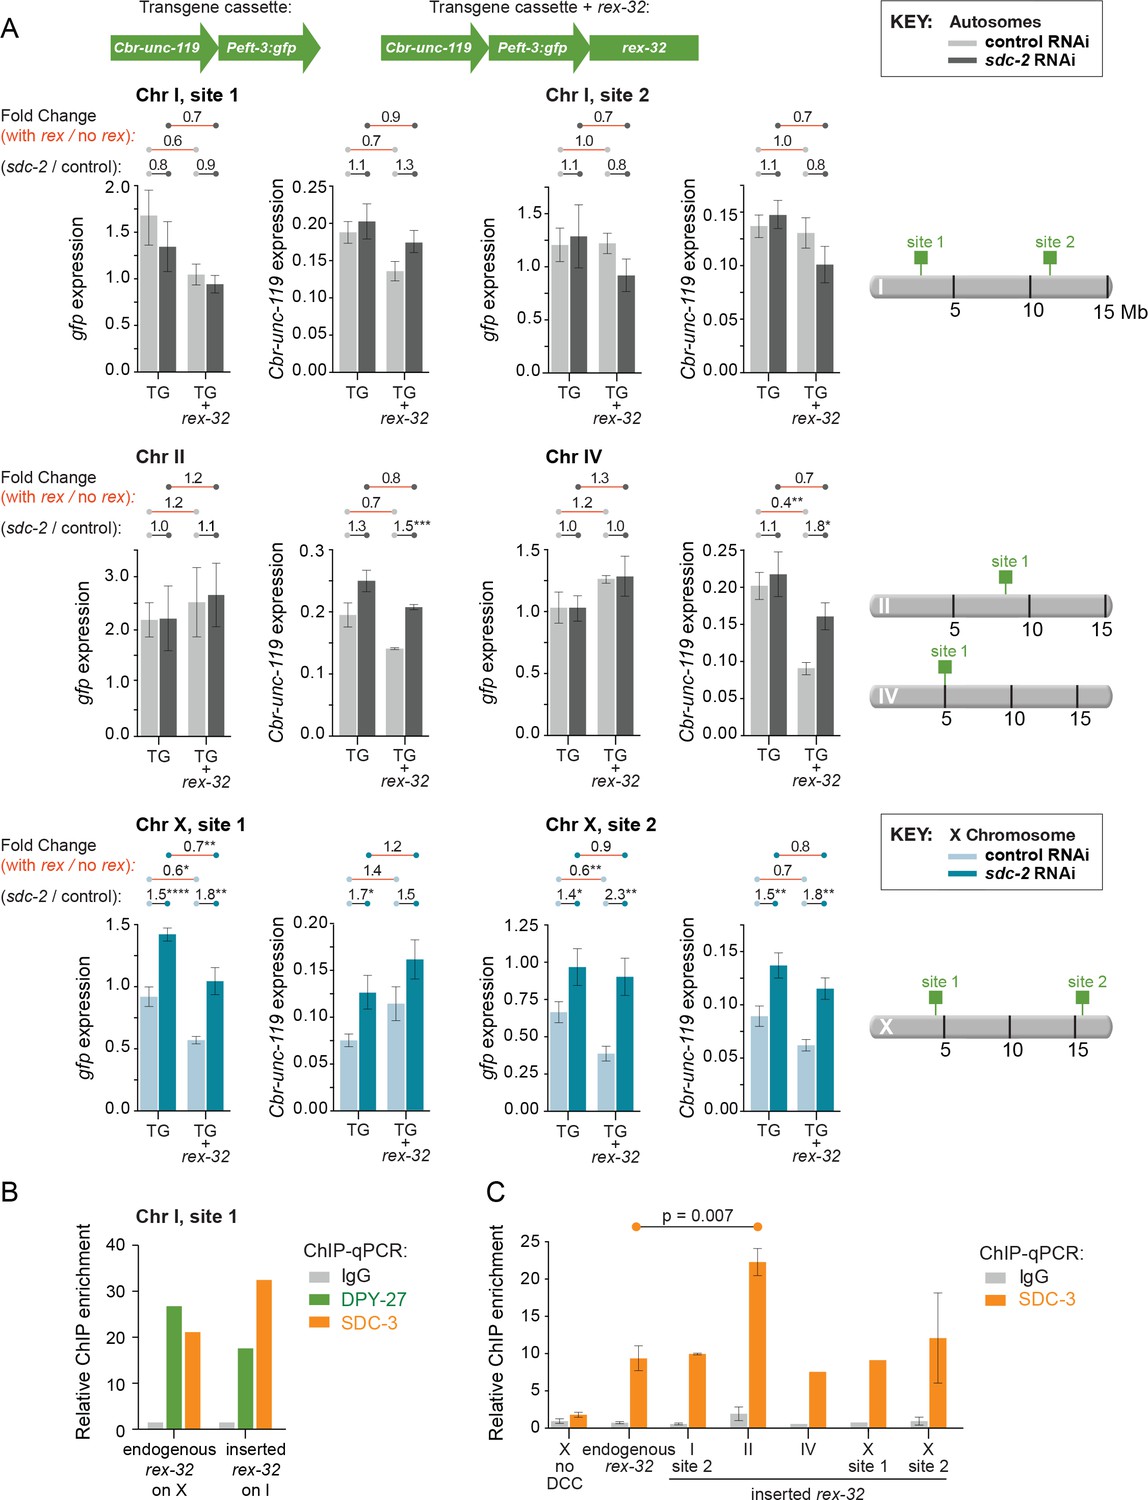
Comparison of transgene expression on X and autosomes with and without a co-inserted strong rex site.
(A) Each graph depicts expression levels of either Cbr-unc-119 or Peft-3:gfp, integrated at the same site on either X or an autosome with (TG + rex-32) or without (TG) a co-inserted copy of the strong DCC binding site rex-32, in both control RNAi XX (light) and sdc-2(RNAi) (dark) XX animals. The specific insertion site is indicated above the graph and corresponds to the schematic on the right. Expression of autosomal transgenes is shown in light and dark gray, and X-linked transgenes in light and dark blue. Numbers above the graphs show the fold change in gene expression (red lines) between transgenes with and without the co-inserted rex site in either control RNAi or sdc-2(RNAi) animals. Also shown is the fold change in expression (gray lines) of transgenes in control RNAi vs. sdc-2(RNAi) animals, either with or without rex-32. The number of asterisks indicates the p-value: p≤0.05, one asterisk; p≤0.01, two asterisks; p≤0.001, three asterisks; p≤0.0001, four asterisks. Proximity to a co-inserted rex site does not increase gene expression in sdc-2(RNAi) vs. control RNAi animals, nor does it generally decrease expression significantly on autosomes in control animals. Error bars show the standard error of the mean for at least three biological replicates. (B) Binding of DPY-27 (green), SDC-3 (orange), and IgG (gray) at Chr I, site 1 was assayed by ChIP-qPCR at the co-inserted copy of rex-32. For this site, ChIP was conducted in an engineered strain lacking the endogenous copy of rex-32, and the graph depicts the enrichment of the two DCC components at the center of the co-inserted rex-32. Similar ChIP experiments were conducted for the endogenous rex-32 site in a wild-type strain. Enrichment is expressed relative to an autosomal region that does not recruit the DCC and is normalized to input. (C) For the designated sites on X and autosomes, SDC-3 (orange) and IgG (gray) ChIP were quantified at the inserted copy of rex-32 in strains carrying the endogenous wild-type copy of rex-32 by using primers that recognize the unique junction between rex-32 and Peft-3::gfp. For four ectopic rex sites, the level of SDC-3 binding was similar to its level at the endogenous rex-32 site. The ectopic rex-32 inserted on Chr II bound significantly more SDC-3 than the endogenous copy on X. Error bars show the standard error of the mean for at least two biological replicates.
Figure 6
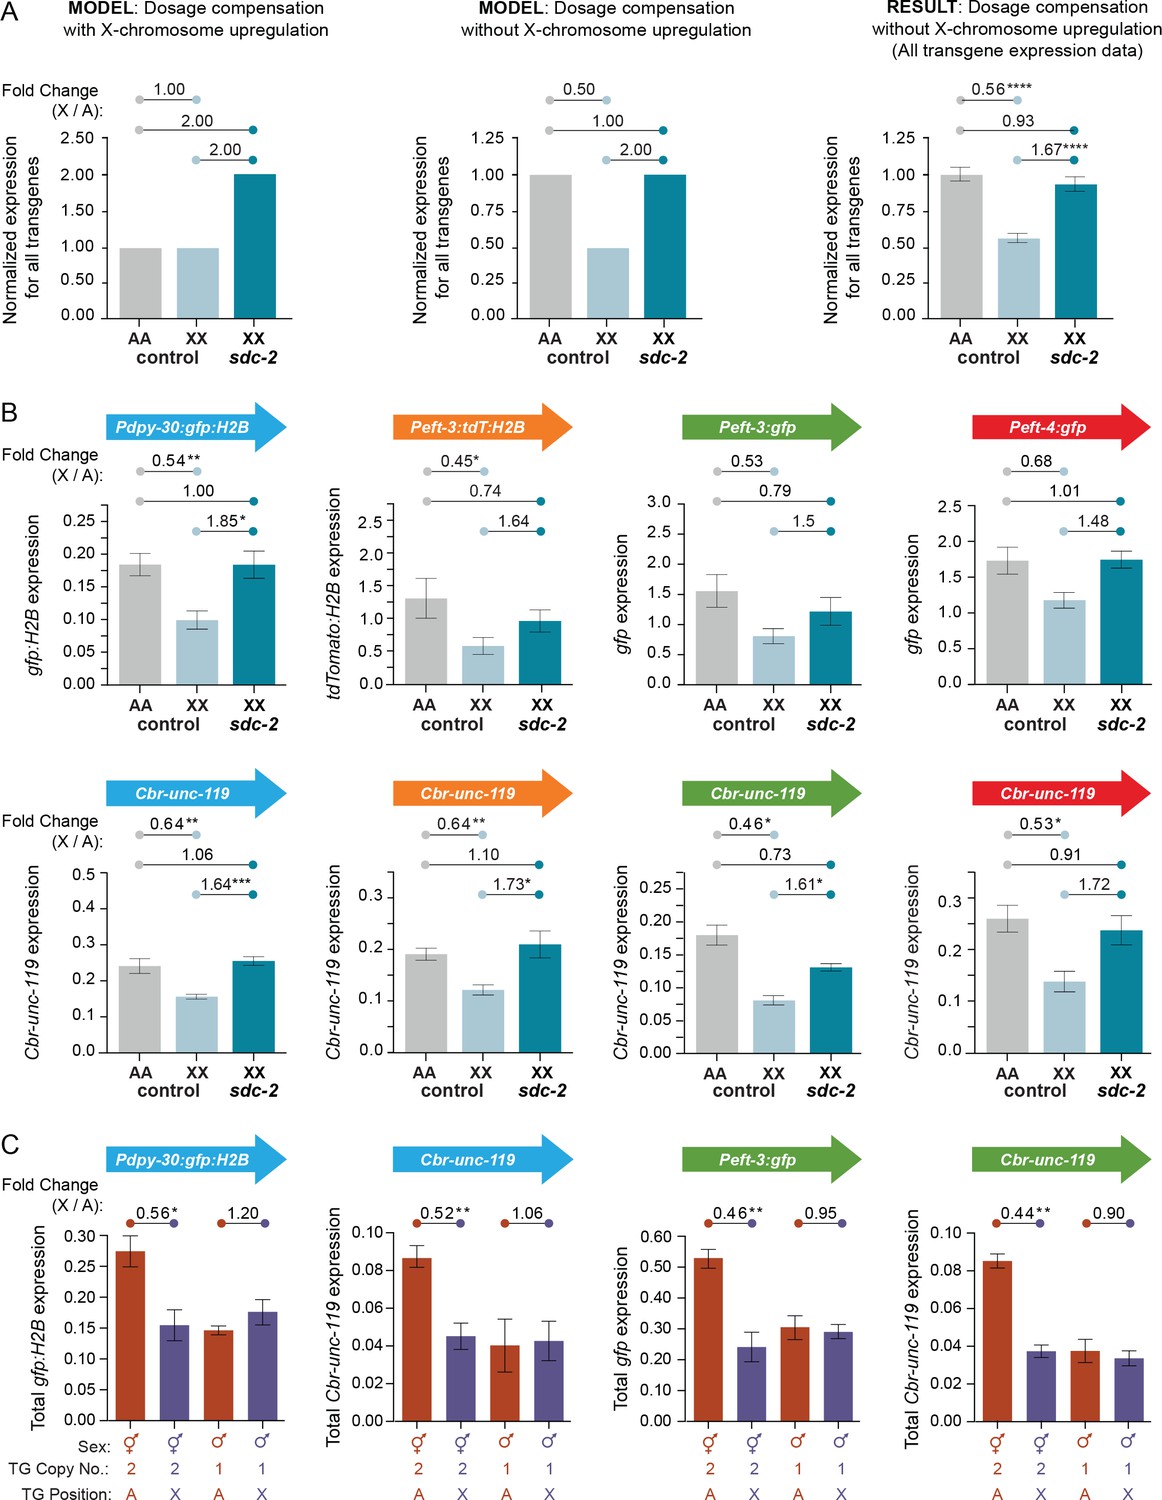
Transgenes on X are expressed at half the level of transgenes on autosomes.
(A) Predicted vs. observed transgene expression levels for dosage compensated transgenes on X relative to transgenes on autosomes for two models of X-chromosome regulation. (Left) Under an X-chromosome-wide model of upregulation, dosage-compensated transgenes on hermaphrodite X chromosomes (2 copies) are predicted to have similar average total expression levels as transgenes on autosomes (2 copies), despite the hermaphrodite-specific repression by the DCC. Moreover, because the DCC reduces gene expression on X by about half, sdc-2(RNAi) animals would be predicted to have two-fold more transgene expression on X relative to autosomes, if X-chromosome upregulation occurred. (Middle) Under a model of no X-chromosome-wide upregulation, dosage compensated transgenes would be expressed at half the level of transgenes on autosomes due to repression by the DCC. In DCC-defective XX animals, transgene expression on X (2 copies) would increase to the level of transgene expression on autosomes (2 copies). (Right) The results of comparing the average expression level of all transgenes on X and autosomes argue against a chromosome-wide model of X-chromosome upregulation. For each reporter, data were normalized to the average autosomal expression level and then combined. Numbers above the graph show the fold change in expression between transgenes on X and on autosomes in control RNAi animals or between transgenes on X in sdc-2(RNAi) animals and transgenes on autosomes in control RNAi animals. The normalized expression level of all transgenes on the X chromosome (light blue) is only 56% of the normalized expression level of all transgenes on autosomes (gray). Expression of transgenes on X is increased to 93% of transgene expression on autosomes in animals treated with RNAi against sdc-2 (dark blue). p≤0.0001, four asterisks. Error bars show the standard error of the mean. (B) Comparison of averaged mRNA expression for all reporter transgenes of each type located at all sites on X or autosomes as quantified in (A), except that expression levels were not normalized to the average autosome expression level. For example, in the first panel, averaged expression from four Pdpy-30:gfp:H2B reporter transgenes inserted on autosomes is compared with averaged expression from four Pdpy-30:gfp:H2B reporter transgenes inserted on X. Expression levels of the Cbr-unc-119 reporter included with each transgene cassette are shown below the expression levels of the fluorescent partner transgenes. The number of asterisks indicates the p-value: p≤0.05, one asterisk; p≤0.01, two asterisks (Student's t-test). Error bars show the standard error of the mean. (C) Comparison between XX and XO L1/L2 larvae of total expression levels for transgenes inserted on X vs. autosomes. For the transgene cassette Pdpy-30:gfp:H2B and Cbr-unc-119, the autosomal cassette was on chromosome IV at site 1, and the X cassette was at site 3. For the transgene cassette Peft-3:gfp and Cbr-unc-119, the autosomal cassette was on chromosome I at site 1 and the X cassette at site 1. Shown below each bar are the sex of the animals in which gene expression was quantified, the copy number of the reporter transgene, and the position of the quantified reporter transgene (either on X or autosomes). For all transgenes, we compared the total level of expression from two reporter copies in XX animals and one reporter copy in XO animals, regardless of whether the reporters were on X or an autosome. The fold change in gene expression between reporters on X and autosomes is given above the graphs. The number of asterisks indicates the p-value: p≤0.05, one asterisk; p≤0.01, two asterisks (Student's t-test). Error bars show the standard error of the mean for at least three biological replicates. Expression of two copies on X was about half the expression of two copies on autosomes. Similarly, expression of the single copy on males was not different from the single copy on autosomes, meaning that expression of one copy on the male X would be half the expression of two copies on male autosomes. Results in (B,C) argue against an Ohno-like mechanism of X-chromosome upregulation in which chromosome-wide transcription of X is increased in expression. The results do not exclude the possibility that diverse gene-specific mechanisms might have arisen to elevate expression of individual X-linked genes with reduced dose.
Figure 7 with 3 supplements
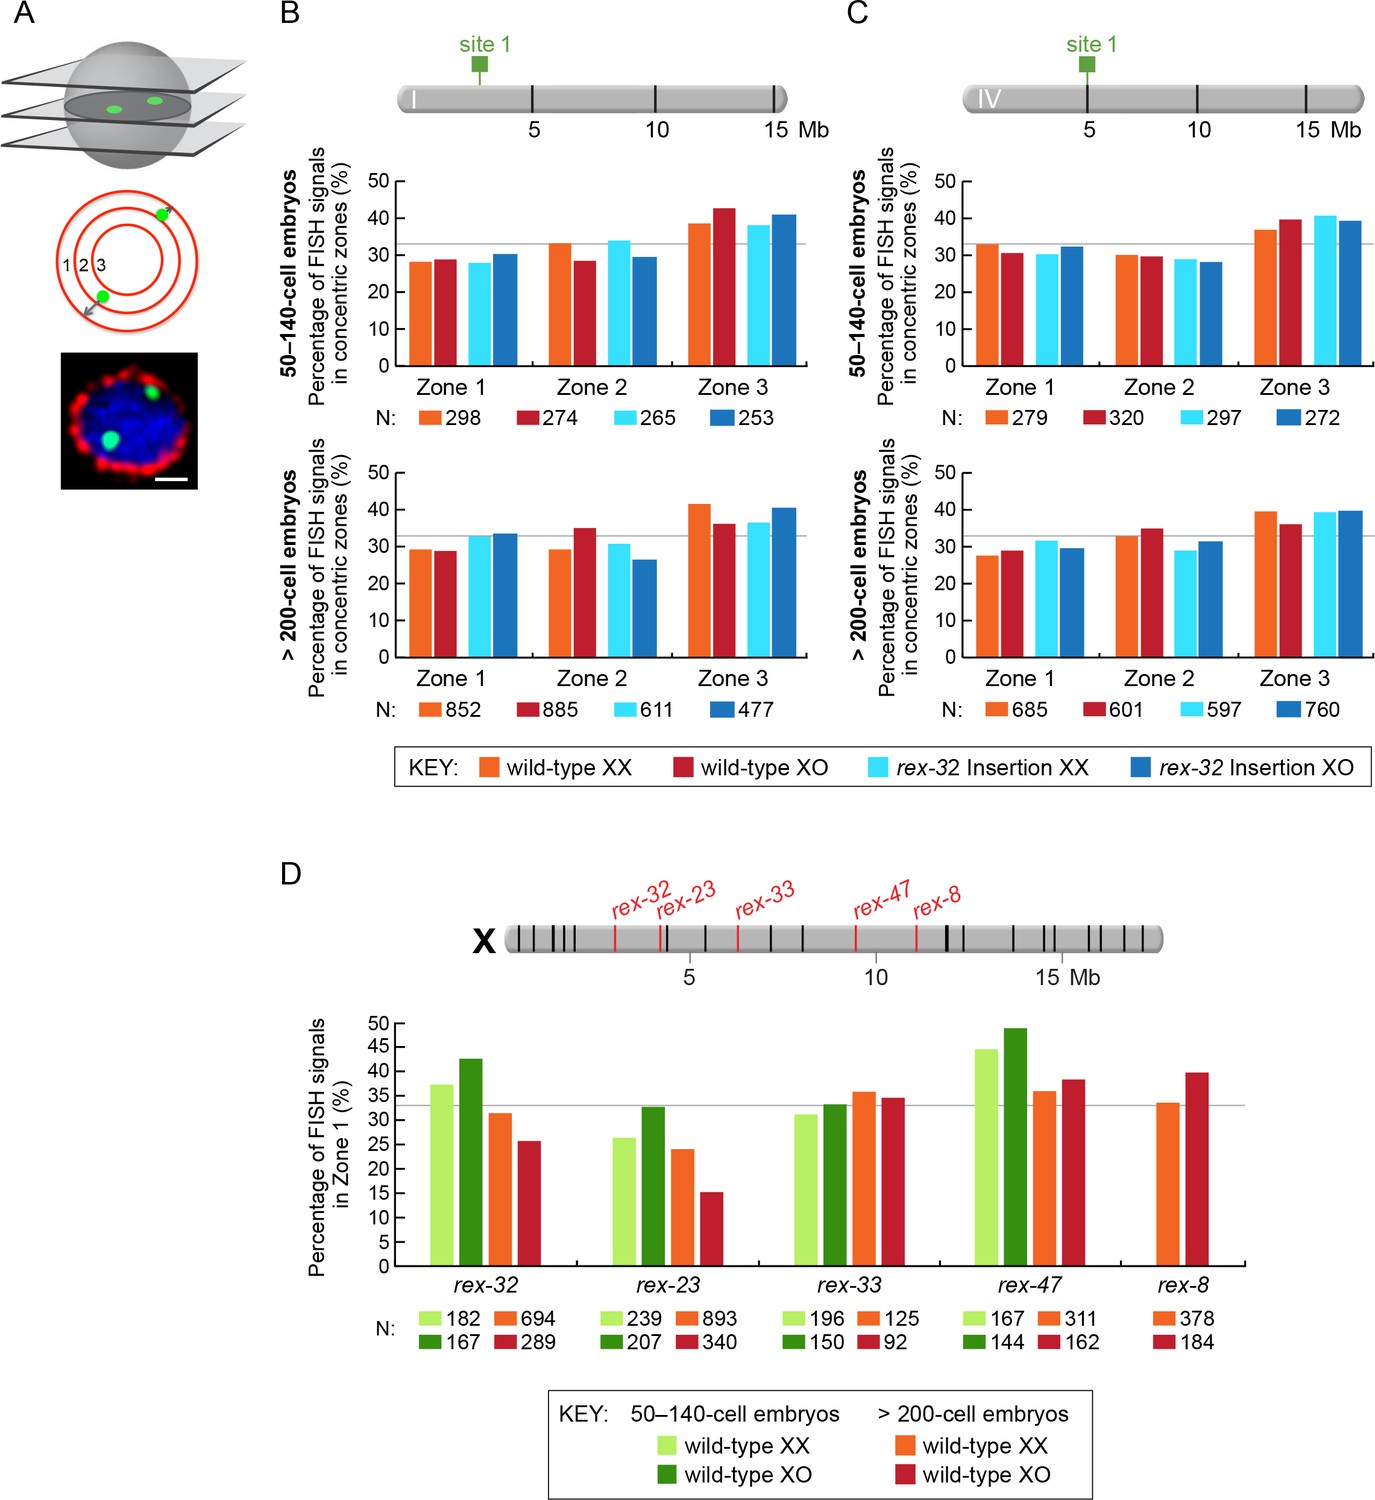
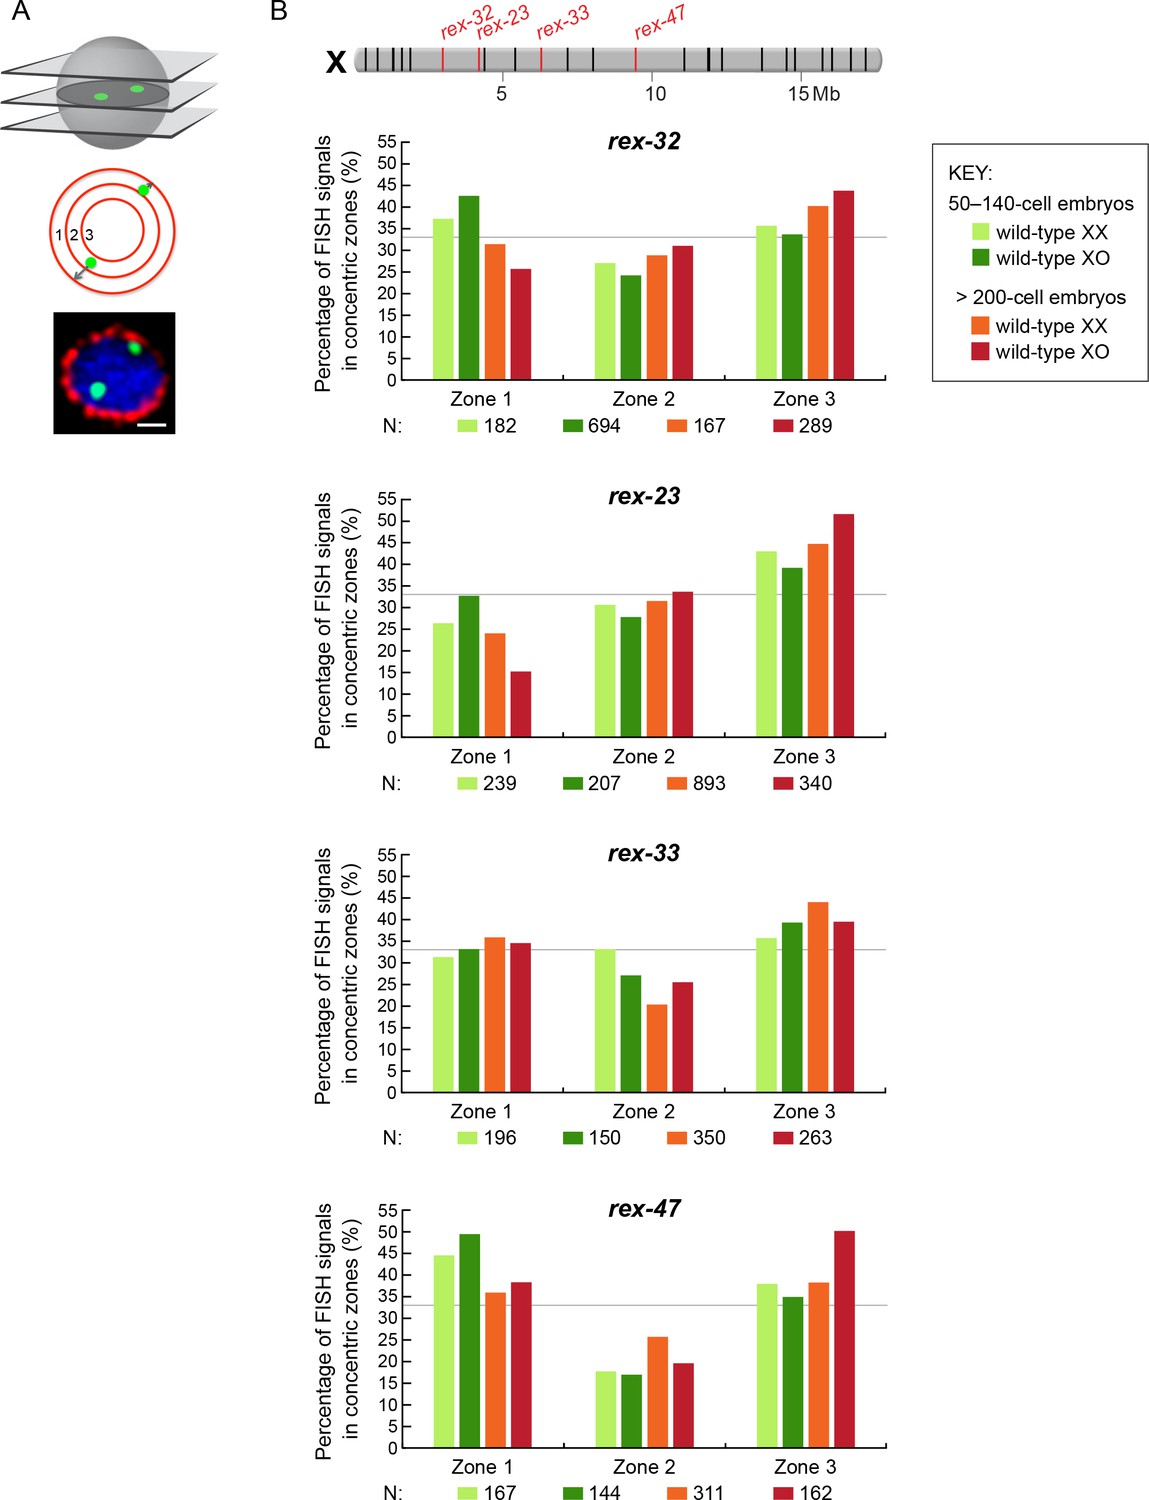
Proximity to an endogenous or ectopic rex sites does not determine the positions of X or autosomal loci relative to the nuclear periphery.
(A) Illustration of approaches for quantifying the radial positions of FISH signals, the same approach as used by Sharma and Meister (2014). (Top) A stack of confocal images determines the location of FISH signals in 3D. The nucleus is divided into three concentric zones with equal area. A random distribution would result in 33% of the FISH signals in each zone, as marked by the gray line in (B–D). (Middle), For each FISH signal, the ratio between its distance to the nuclear periphery and the nuclear radius determines the zone in which the site resides. (Bottom), Representative confocal image showing position of FISH signals in a nucleus. Blue, DAPI; Red, Nuclear Pore Complex; Green, rex FISH; Scale bar, 1 μm. (B, C) Histograms show the fraction of autosomal FISH signals in each of three zones in XX or XO embryos of two age groups (50-140-cell stage or > 200-cell stage) from wild-type strains or ectopic rex-insertion strains. Genomic locations of insertion sites (Chr 1, site 1 at position 2,85,041 Mb or Chr IV, site 1 at position 5,014,698 Mb) for transgenes with and without ectopic rex sites are shown on chromosome maps above the histograms. For both autosomal loci examined, nuclear positioning was not statistically different between (1) XX and XO embryos with an ectopic rex insertion; (2) between XO embryos with or without a rex insertion; (3) between XO embryos with a rex insertion and XX embryos without a rex insertion; or (4) between XX and XO embryos without a rex insertion, regardless of embryo age (p>0.5 for younger embryos and p>0.1 for older embryos, chi-square test). N is the total number of autosomal or rex FISH signals quantified for XX or XO embryos in the two age groups of each genotype. FISH probes were 30 kb. (D) Histograms show the fraction of endogenous rex FISH signals (rex-32, rex-23, rex-33, rex-47, or rex-8) at the nuclear periphery (zone 1) of wild-type XX or XO embryos of two age groups (50-140-cell stage or > 200-cell stage). Genomic locations of the 25 highest DCC-occupied rex sites on X are shown above the histograms (red, rex sites examined; black, all others). The positioning of rex sites at the nuclear periphery (zone 1) was not greater in XO versus XX embryos of either age group (chi-square test, see text).
Figure 7—figure supplement 1
Radial position of rex sites on X relative to the nuclear periphery is not different between XX and XO embryos.
(A) Cartoons illustrate methods for quantifying the radial positions of rex FISH signals as explained in the legend to Figure 7A. (B) Histograms show the fraction of endogenous rex FISH signals (rex-32, rex-23, rex-33, rex-47, or rex-8) in each of three zones in wild-type XX or XO embryos of two age groups (50-140-cell stage or > 200-cell stage). Genomic locations of the 25 highest DCC-occupied rex sites on X are shown above the histograms (red, rex sites examined; black, all others). The nuclear positioning of rex sites in each zone is not statistically different between XO and XX embryos of either age group (chi-square test, see text). Mb, megabases. N is the total number of rex FISH signals quantified for XX or XO embryos in the two age groups. A random distribution would result in 33% of the FISH signals in each zone, as indicated by the gray line.
Figure 7—figure supplement 2
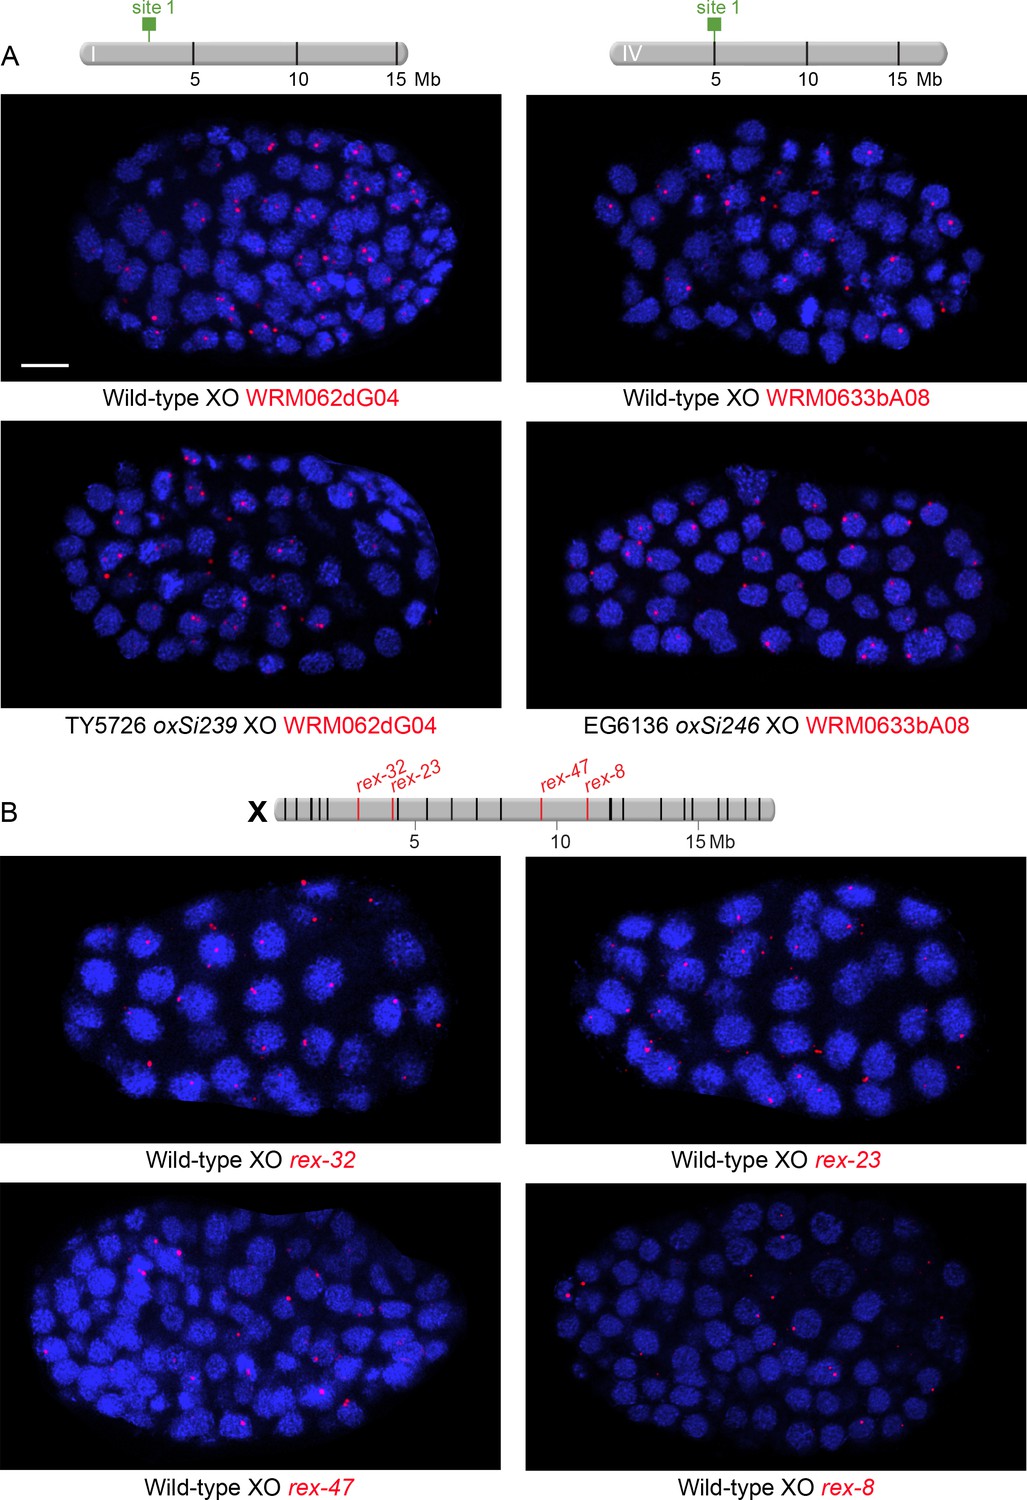
Examples of XO embryos hybridized with FISH probes to assess nuclear positioning of ectopic rex sites integrated onto autosomes and endogenous rex sites on X.
(A and B) Confocal images of wild-type or transgenic XO embryos stained with DAPI (blue) and hybridized with various FISH probes (red) as indicated below each image (red). Each image represents a 1 μm projection of 12 slices. Scale bars, 5 μm (A) Embryos to examine nuclear positioning of ectopic rex sites. Strains TY5726 and EG6136 contain rex sites integrated onto autosomes at locations indicated on the chromosome maps above the images. Probes are 30 kb fosmid probes that are adjacent to or flank the rex insertion sites so that the same probes can be used for wild-type and transgenic embryos. (B) Embryos to examine nuclear positioning of endogenous rex sites. Shown above the images is a map of X with genomic locations of the 25 highest DCC-occupied rex sites. rex sites examined by FISH are shown in red; all other sites are in black. Probes for rex-32 and rex-23 are 30 kb fosmid probes and probes for rex-47 and rex-8 are 5 kb probes.
Figure 7—figure supplement 3

Examples of XO and XX embryos hybridized with FISH probes to assess nuclear positioning of rex-33 on X.
Confocal images of wild-type XO and XX embryos stained with DAPI (blue) and two overlapping 30 kb fosmid probes each labeled with a different fluorescent dye (red or green as indicated). Each image represents a 1 μm projection of 12 slices. Scale bars, 5 μm. Only foci with signals from both fosmid probes (indicated by arrows) were quantified to unambiguously identify bona fide rex-33 FISH signals. Genomic locations of the 25 highest DCC-occupied rex sites on X are shown above the images (rex-33, red; all other rex sites, black).
Additional files
-
Supplementary file 1
Strains used in this study.
- https://doi.org/10.7554/eLife.17365.016
-
Supplementary file 2
Oligos used in this study.
- https://doi.org/10.7554/eLife.17365.017
Download links
A two-part list of links to download the article, or parts of the article, in various formats.
Downloads (link to download the article as PDF)
Open citations (links to open the citations from this article in various online reference manager services)
Cite this article (links to download the citations from this article in formats compatible with various reference manager tools)
Chromosome-wide mechanisms to decouple gene expression from gene dose during sex-chromosome evolution
eLife 5:e17365.
https://doi.org/10.7554/eLife.17365


