The dimerization equilibrium of a ClC Cl−/H+ antiporter in lipid bilayers
- University of Iowa, United States
- University of Bath, United Kingdom
- Brandeis University, United States
Figures
Figure 1 with 3 supplements
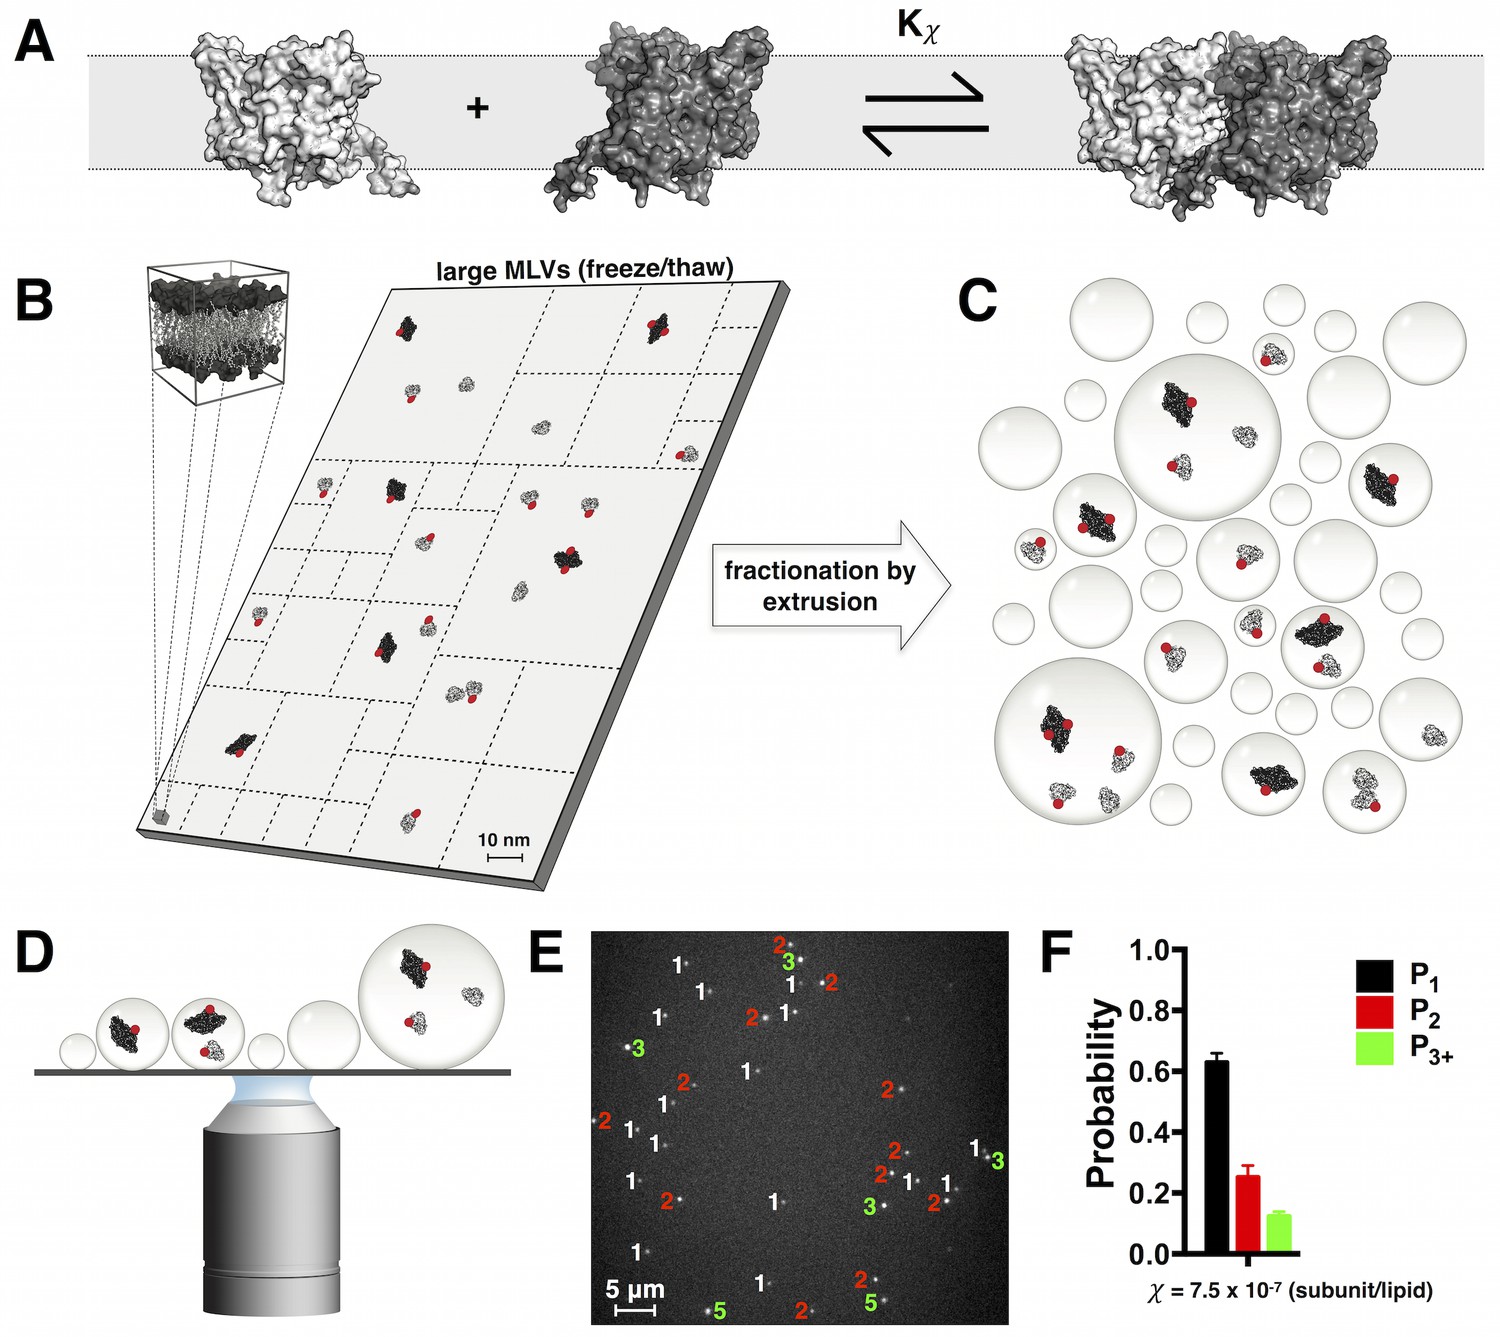
Quantifying ClC-ec1-Cy5 monomers vs. dimers in lipid bilayers by subunit capture into liposomes and single-molecule photo-bleaching analysis.
(A) Cartoon depicting the equilibrium dimerization reaction of ClC-ec1 in lipid bilayers. Kχ is the mole fraction (χ subunit/lipid) equilibrium constant. (B) Scaled cartoon of a 75 nm × 150 nm area of lipid bilayer, depicting the population of ClC-ec1 distributed as monomers (grey) and dimers (black). ClC-ec1 monomers are ~5 nm across. To allow for subunit exchange at low densities, samples are equilibrated in a large membranes obtained by repeated freeze/thaw cycles to form large multilamellar vesicles (MLVs). Red circles represent Cy5 fluorophores conjugated to subunits with PCy5 ~ 70% labeling yield. (C) To quantify the monomer vs. dimer populations in the MLV state, membranes are fractionated (dashed lines in (B)) by extrusion which captures subunits into liposomes. The statistics of subunit capture into liposomes follows a Poisson distribution that depends on the overall density, liposome size distribution and population stoichiometry. (D) Subunit occupancy in liposomes is determined by examining protein-occupied liposomes on a single-molecule TIRF microscope and carrying out photobleaching analysis. (E) Image of Cy5-labeled ClC-ec1 in 2:1 POPE/POPG liposomes. Numbers indicate the observed photobleaching steps for each fluorescent spot (1-white, 2-red, ≧ 3-green). (F) Photobleaching probability distribution for a ClC-ec1 sample reconstituted at = 7.5 × 10⁻⁷ subunits/lipid (0.1 μg/mg ClC-ec1/lipid). P1, P2 and P3+ indicate probabilities of observing single, double and ≧ 3 step photobleaching steps, respectively.
-
Figure 1—source data 1
Excel file including data and statistical analysis presented in Figure 1 and Figure 1—figure supplements 1–3 including Ellman’s cysteine reactivity data, Cy5 labeling yields, Cl− transport rates, functional F0,Cl, subunit/lipid mole fraction quantification, Fraction of protein co-localized with liposomes and F0, the fraction of unoccupied liposomes measured from co-localization microscopy.
- https://doi.org/10.7554/eLife.17438.004
Figure 1—figure supplement 1
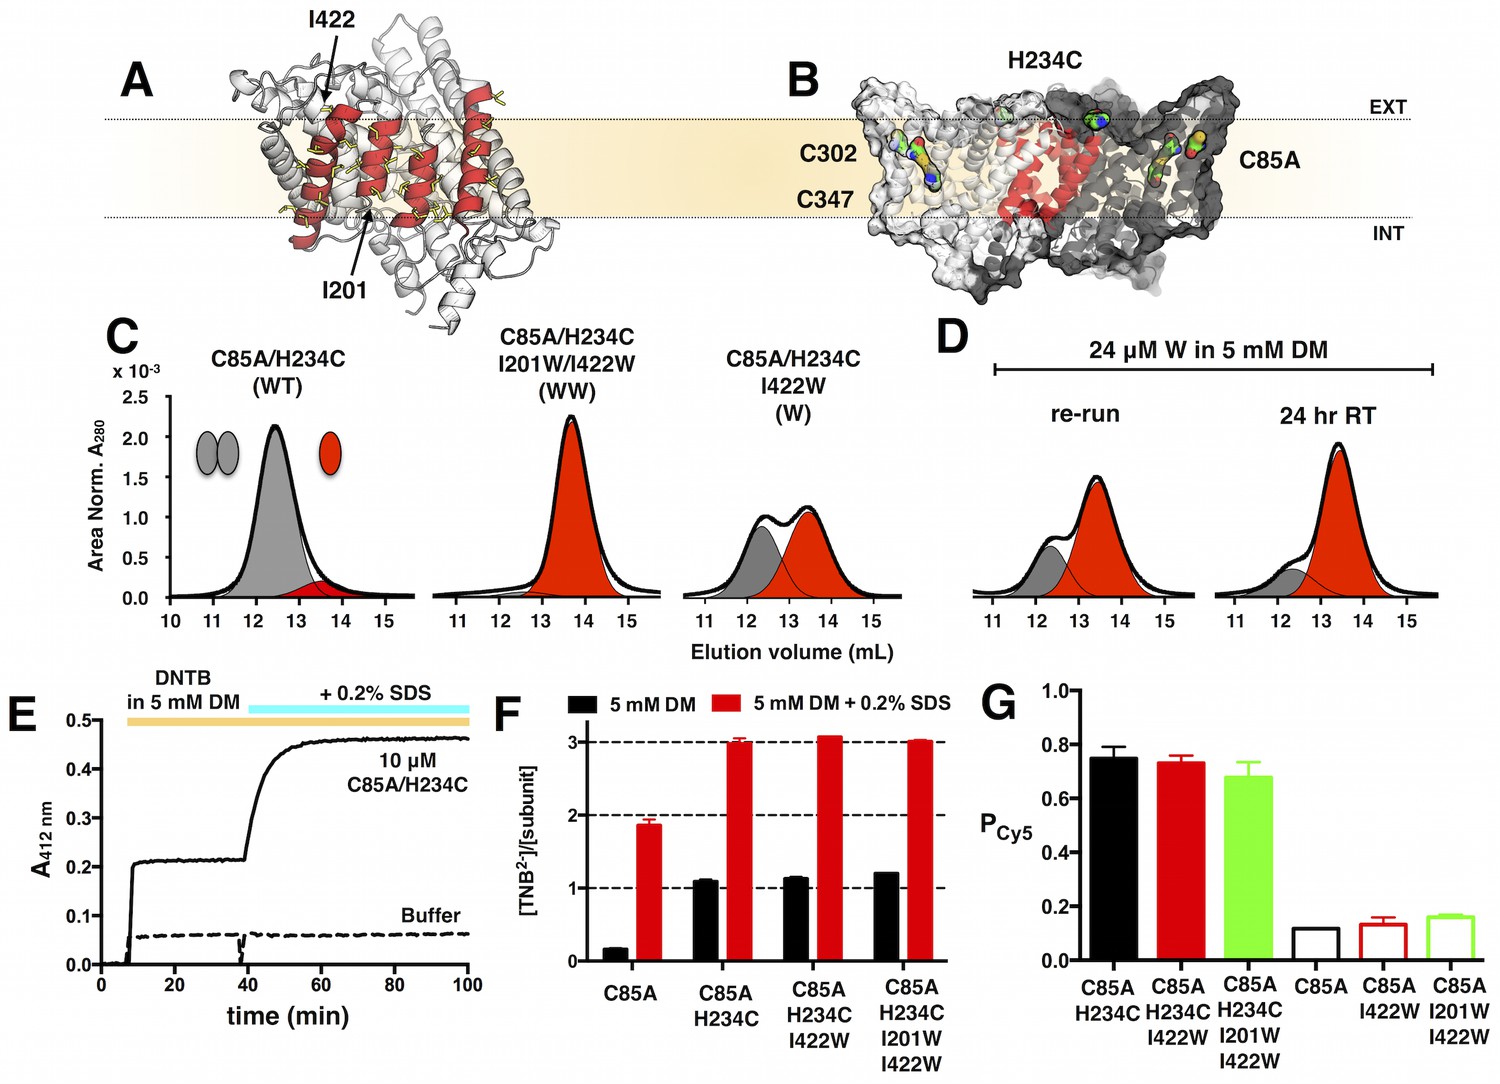
Design of ClC-ec1 constructs for the study of reversible dimerization in membranes by fluorescence methods.
(A) Dimerization interface of ClC-ec1 showing the four interfacial helices (red) lined by non-polar side chains (yellow). Positions of tryptophan substitutions that shift the protein to the monomeric state, I201W and I422W, are indicated (arrows). (B) ClC-ec1 has three endogenous cysteines: the partially exposed C85 and buried C302 & C347. C85A/H234C introduces a single solvent accessible cysteine for rapid maleimide conjugation. (C) Size exclusion chromatography of C85A/H234C (WT), C85A/H234C/I201W/I422W (WW) and C85A/H234C/I422W (W) in 5 mM DM (black - raw chromatogram, grey - dimer, red - monomer). (D) W dissociation into monomers in 5 mM DM over 24 hr at room temperature. The ‘re-run’ sample is the collection of both monomer and dimer elution fractions in (C), diluted to 24 μM and re-loaded onto the size exclusion column. (E) Cysteine accessibility assay showing the increase in A412 reporting on TNB2- production upon reaction of Ellman’s reagent (DNTB) with free thiols on C85A/H234C in DM micelles. Addition of 0.2% SDS denatures the subunit to expose previously buried, reactive cysteines. (F) Molar ratio of TNB2- to ClC-ec1 subunits showing one exposed and two buried cysteines in C85A/H234C. Data represented as mean ± SE, n = 2–3. (G) PCy5 labeling yields for ClC-ec1 constructs, and Pnon-specific = PCy5 for constructs lacking H234C. Data represented as mean ± SE (n = 3–4). There is no significant difference in labeling yields for the three constructs (p > 0.05).
Figure 1—figure supplement 2

Stability and function of Cy5 labeled ClC-ec1.
(A) Size exclusion chromatography profiles of WT, WT-Cy5, W and W-Cy5 in 5 mM DM (black – raw chromatogram, grey - dimer, red - monomer). (B) Normalized chloride efflux from 2:1 POPE/POPG liposomes (0.4 μm extruded vesicles after freeze/thaw) for empty vesicles and WT, WT-Cy5, W or W-Cy5 reconstituted at 1 μg/mg density ( = 7.5 × 10⁻⁶ subunit/lipid). Black triangle – initiation of efflux by valinomycin/FCCP, white triangle – release of trapped chloride from unoccupied vesicles by β-OG. (C) Normalized chloride efflux rates and (D) fraction of chloride trapped in unoccupied liposomes (FCl,0), mean ± SE, n = 4–8. All rates are significantly different from each other (p < 0.05), while there is no significant difference in FCl,0 with and without Cy5 (p > 0.05). (E) Measured mole fraction values of WT-Cy5 samples reconstituted at = 7.5 × 10⁻⁵ subunits/lipid after freeze/thaw and extrusion, mean ± SE, n = 3 (no significant difference, p > 0.05). (F) Measured χ vs. reconstituted χ for all samples (WT-Cy5, W-Cy5 & WW-Cy5) mean ± SE (n = 2–7). Solid line represents the linear fit through (0,0) with slope = 0.50 ± 0.02 (best-fit ± SE). The dotted line represents complete correlation.
Figure 1—figure supplement 3

Co-localization of ClC-ec1-Cy5 and AF488 labeled 2:1 POPE/POPG liposomes measured by single-molecule TIRF microscopy.
(A) Images of AF488-labeled liposomes (left), Cy5-labeled ClC-ec1 (middle) and the merged image using the overlay function in ImageJ (right, liposome only spots in blue, protein only spots in red, co-localized spots in magenta). (B) Fraction of protein spots that co-localize with liposomes as a function of protein density. Data represented as fraction ± SD (n = 1–2 samples, error bars smaller than points). (C) Fraction of unoccupied liposomes (F0) as a function of the protein density for WT (black) and WW (green). Data represents fraction ± SD (n = 1–3 samples, error bars are smaller than points). Dotted lines represent a simulation of liposome occupancy (Figure 2—figure supplement 1) for the monomer accessible liposome population (green) and the dimer accessible liposome population (black). (D) Representative raw integrated intensity traces of ClC-ec1-Cy5 spots as a function of time (acquired at ~1 fps) demonstrating stepwise photo-bleaching behavior.
Figure 2 with 1 supplement
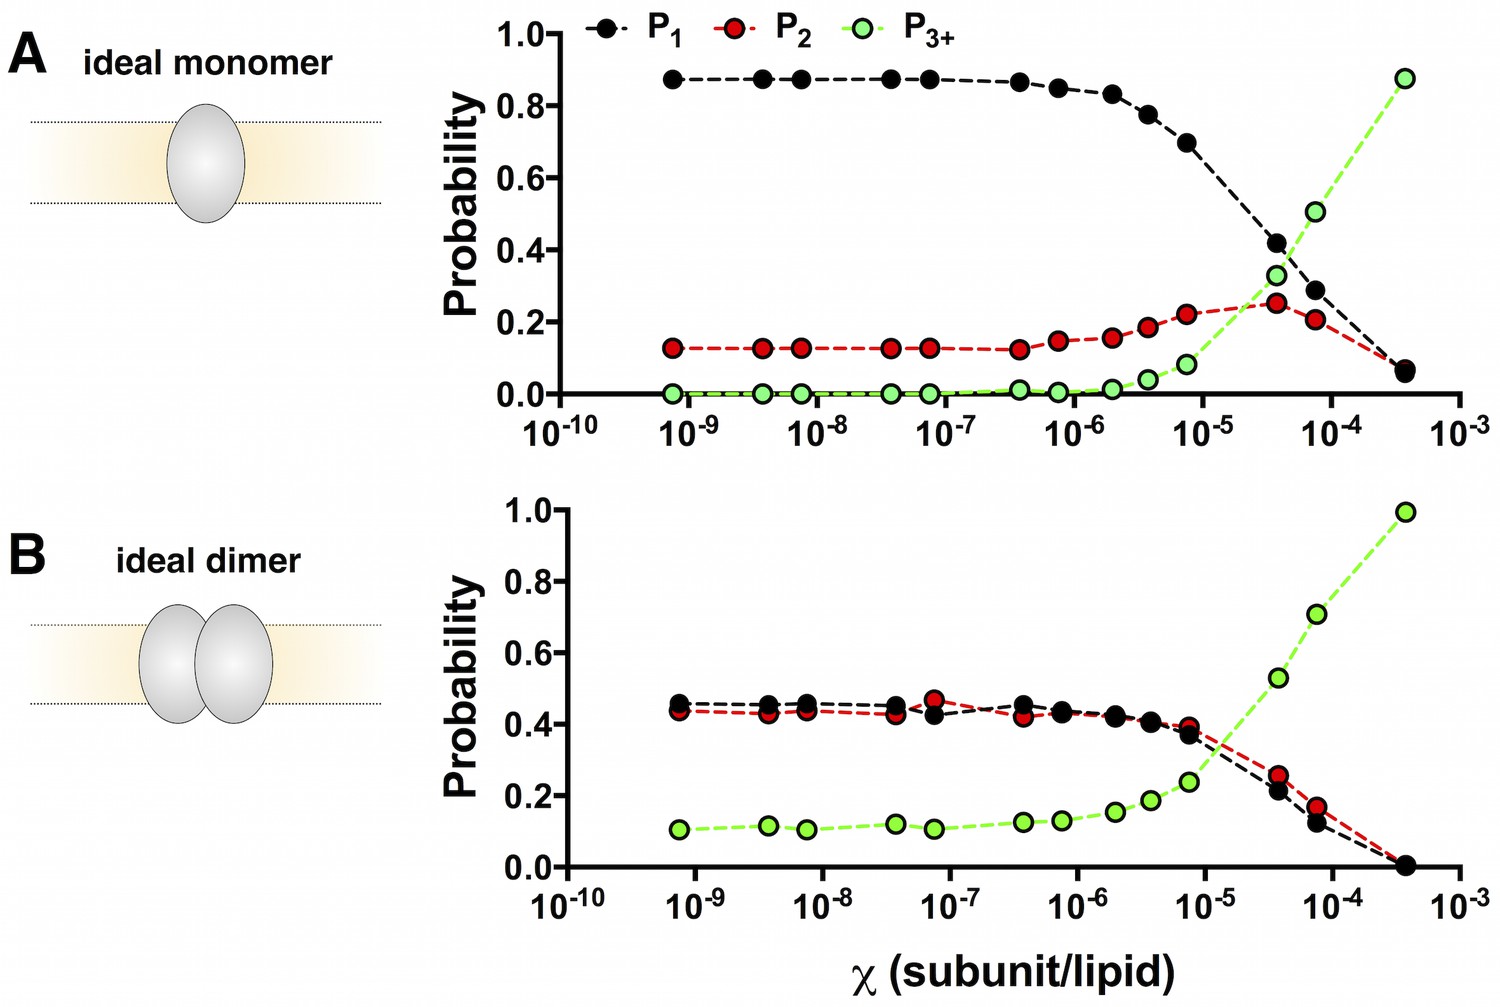
Calculation of the ideal monomer and dimer photobleaching probabilities in 0.4 μm extruded 2:1 POPE/POPG liposomes.
(A) PM1,2,3+ calculated for = 7.5 × 10⁻¹⁰ to 3.8 × 10⁻⁴ subunits/lipid for an ideal, non-interacting monomer. The simulation uses the liposome radius probability distribution from Walden et al. (Walden et al., 2007), and experimental fluorescent labeling yields PCy5 = 0.72 and Pnon-specific = 0.14 (Figure 2—figure supplement 1). The appearance of noise in the simulated curves arises from the stochastic nature of the simulation. (B) The ideal, non-interacting dimer photobleaching probabilities PD1,2,3+ simulated with the additional constraint that dimers (~10 nm) are excluded from liposomes r < 25 nm. The excluded radius was estimated from fitting the calculated fraction of unoccupied liposomes, F0, to the experimental data from co-localization imaging (Figure 1—figure supplement 3). Chi-squared analysis shows that the monomer and dimer distributions are statistically significant for all χ values (p < 0.0001) except for 3.8 × 10⁻⁴subunits/lipid (p = 0.24).
-
Figure 2—source data 1
Excel file including data and statistical analysis presented in Figure 2 and Figure 2—figure supplement 1 including the ideal monomer and ideal dimer photobleaching distributions (walden liposomes, PCy5 = 0.72, Pns = 0.14, bias = 4) distribution, chi-squared analysis, pooled protein labeling data.
- https://doi.org/10.7554/eLife.17438.009
Figure 2—figure supplement 1
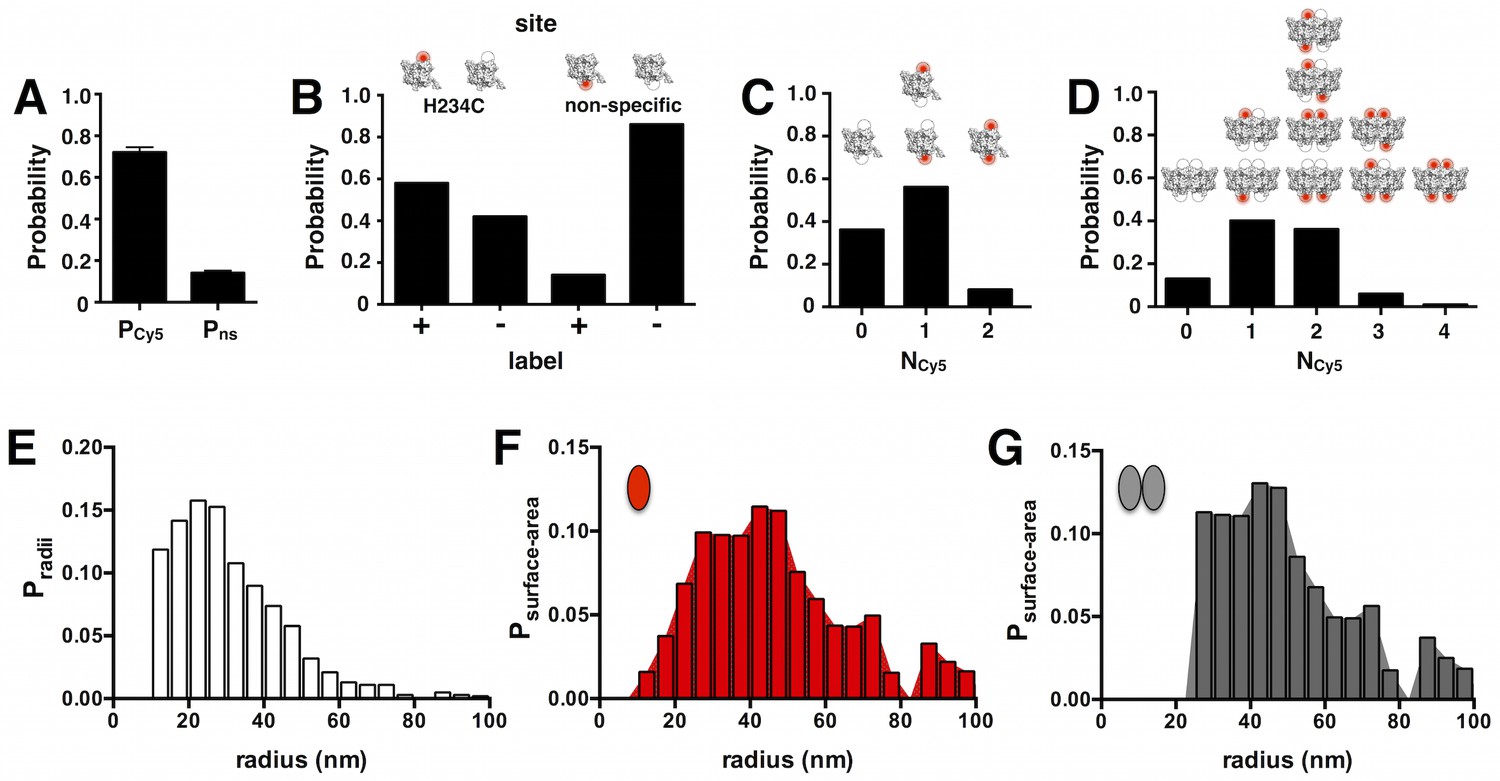
Probability distributions used to calculate PMn and PDn.
(A) Pooled overall labeling yield PCy5 = 0.72 ± 0.08 and non-specific labeling yieldPns = 0.14 ± 0.04, mean ± SE (n = 10–11). (B) Probabilities of labeling in the two-site subunit model: H234C vs. a non-specific site. PH234C = PCy5– Pns = 0.58. (C) Probability that a single subunit is labeled with NCy5 = 0, 1 or 2. (D) Probability that a dimer is labeled with NCy5 = 0, 1, 2, 3 or 4. (E) The cryo-EM liposome radius probability distribution from Walden et al. for E. coli polar lipid membranes extruded through a 0.4-µm filter after freeze/thaw. (F) Surface area probability distribution Psurface-area for the monomer accessible liposome population (i.e. all liposomes). (G) Surface area distribution for the dimer accessible liposome population, where liposomes with radius less than 25 nm are excluded based on F0 co-localization data from Figure 1—figure supplement 3C.
Figure 3 with 1 supplement
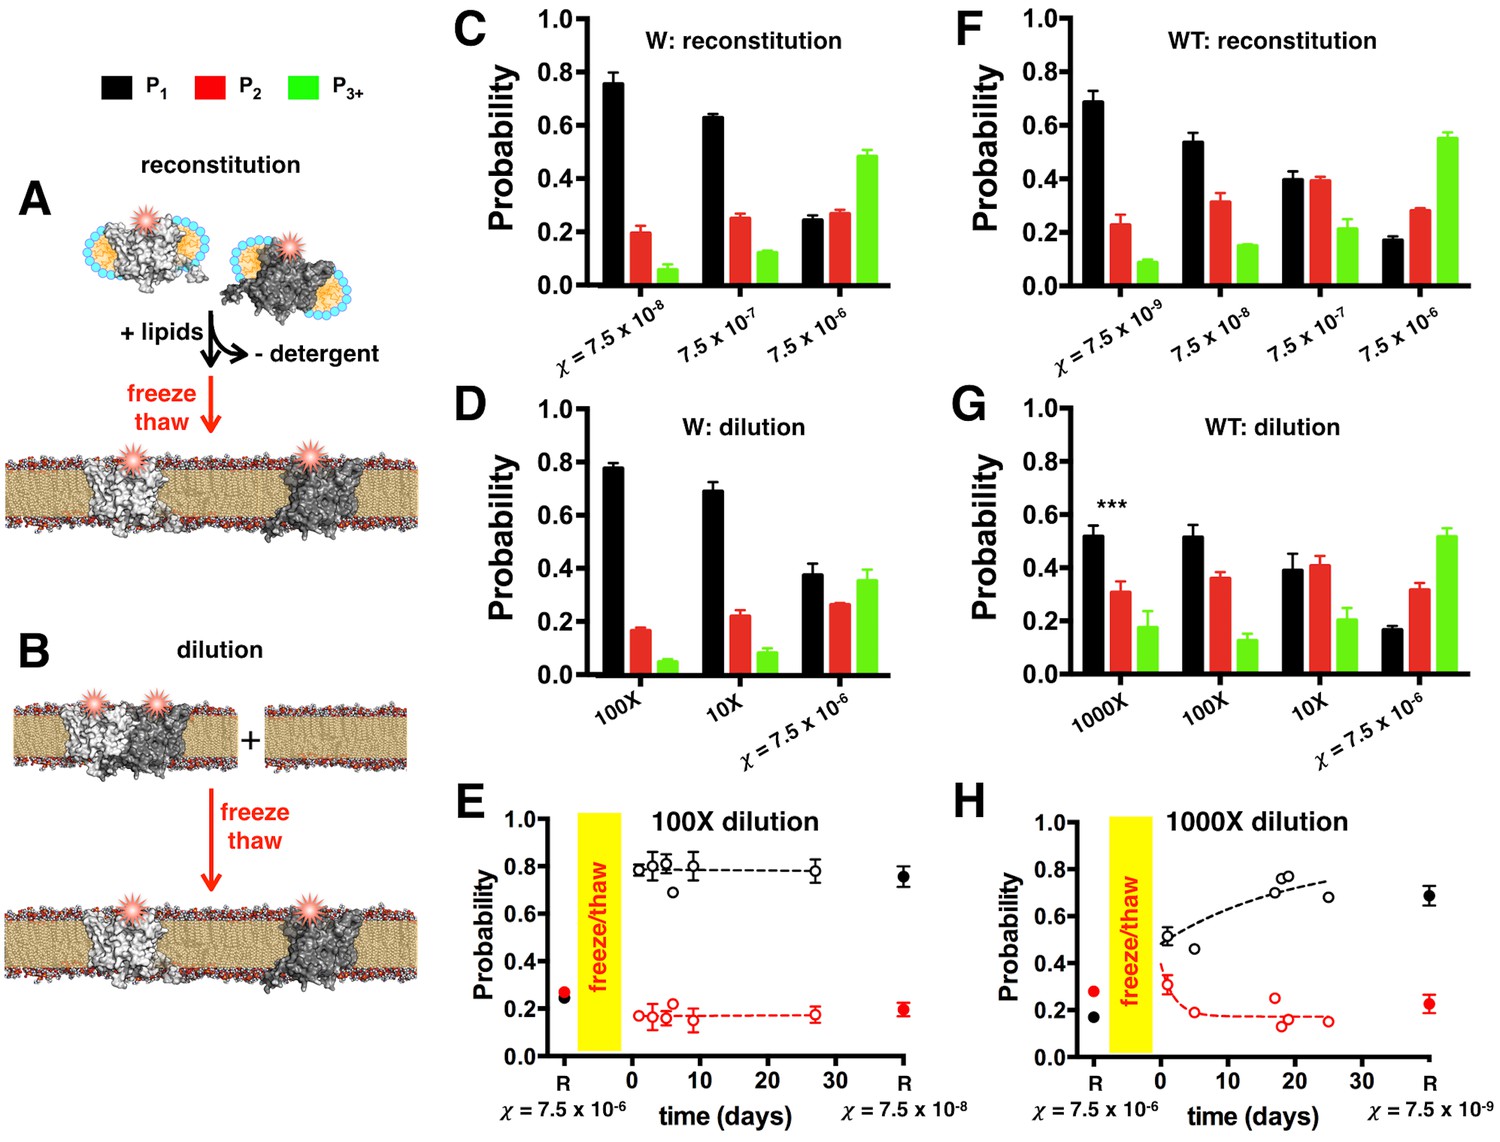
ClC-ec1-Cy5 photobleaching probabilities depend on χ and is path independent.
The mole fraction density can be set by two different methods: (A) Reconstitution of ClC-ec1-Cy5 by mixing detergent solubilized subunits with lipids, followed by dialysis to remove detergent resulting in lipid bilayer formation (black arrow). In this case, bilayers are fused together by freeze/thaw (red arrow) and incubated at room temperature prior to extrusion and imaging. (B) Dilution of high-density proteoliposomes by freeze/thaw fusion with empty vesicles, followed by incubation at room temperature prior to extrusion and imaging. (C) Photobleaching probabilities for W-Cy5 reconstituted at = 7.5 × 10⁻⁸, 7.5 × 10⁻⁷and 7.5 × 10⁻⁶ subunit/lipid. All distributions are statistically significant by chi-squared analysis (p < 0.0001). Data are represented as mean ± SE, n = 3 and 2 counters. (D) Photobleaching probabilities for samples diluted 100X or 10X from samples reconstituted at = 7.5 × 10⁻⁶ subunit/lipid and imaged one day after freeze/thaw fusion. Data are represented as mean ± SE, n = 3 and 2–3 counters. Chi-squared analysis shows no significant difference between = 7.5 × 10⁻⁷ reconstituted vs. 10X diluted samples, or = 7.5 × 10⁻⁸ reconstituted vs. 100X diluted samples (p > 0.05). (E) Post-freeze/thaw time course of PW1-3+ probabilities for the 100X diluted sample as a function of incubation time at room temperature. 'R' at = 7.5 × 10⁻⁶ subunit/lipid represents the original high-density reconstituted sample prior to dilution (mean ± SE, n = 3 and 2 counters, collected at t = 15, 28 and 72 days). The freeze/thaw process is indicated by the yellow bar. Time course data represent fraction ± SE (n = 3 samples and 2–3 counters, points without error bars represent calculated fraction from a single counter). 'R' at = 7.5 × 10⁻⁸ subunit/lipid shows the probabilities for samples reconstituted directly at the corresponding dilution (mean ± SE, n = 2 samples and 2 counters, collected at t = 23 and 71 days). (F) Photobleaching probabilities for WT-Cy5 reconstituted at = 7.5 × 10⁻⁹, 7.5 × 10⁻⁸, 7.5 × 10⁻⁷ and 7.5 × 10⁻⁶ subunit/lipid or (D) diluted 1000X, 100X or 10X from samples reconstituted at = 7.5 × 10⁻⁶ subunit/lipid, imaged 1 day after freeze/thaw fusion. Data are represented as mean ± SE, n = 3–4 samples and 2 counters. Chi-squared analysis shows no significant difference between = 7.5 × 10⁻⁷ reconstituted vs. 10X diluted samples, or = 7.5 × 10⁻⁸ reconstituted vs. 100X diluted samples (p > 0.05); however, the 1000X diluted sample is significantly different from the = 7.5 × 10⁻⁹ reconstituted sample (p < 0.001). (E) Post-freeze/thaw time course of PWT1-3+ probabilities for 1000X dilution as a function of incubation time at room temperature. 'R' at = 7.5 × 10⁻⁶ subunit/lipid designates the high-density sample prior to dilution (mean ± SE, n = 3 and 2 counters, collected at t = 10, 15 and 95 days). Time course data represent mean ± SE (n = 3 samples and 2–3 counters). 'R' at = 7.5 × 10⁻⁹ subunit/lipid represent samples reconstituted directly at the corresponding density, mean ± SE, n = 2 samples and 2 counters, collected at t = 1 and 89 days post-freeze/thaw.
-
Figure 3—source data 1
Excel file including data and statistical analysis presented in Figure 3 and Figure 3—figure supplement 1 including WT and W dilution data, chi-squared analysis between reconstituted and diluted samples, and FRET data.
- https://doi.org/10.7554/eLife.17438.013
Figure 3—figure supplement 1
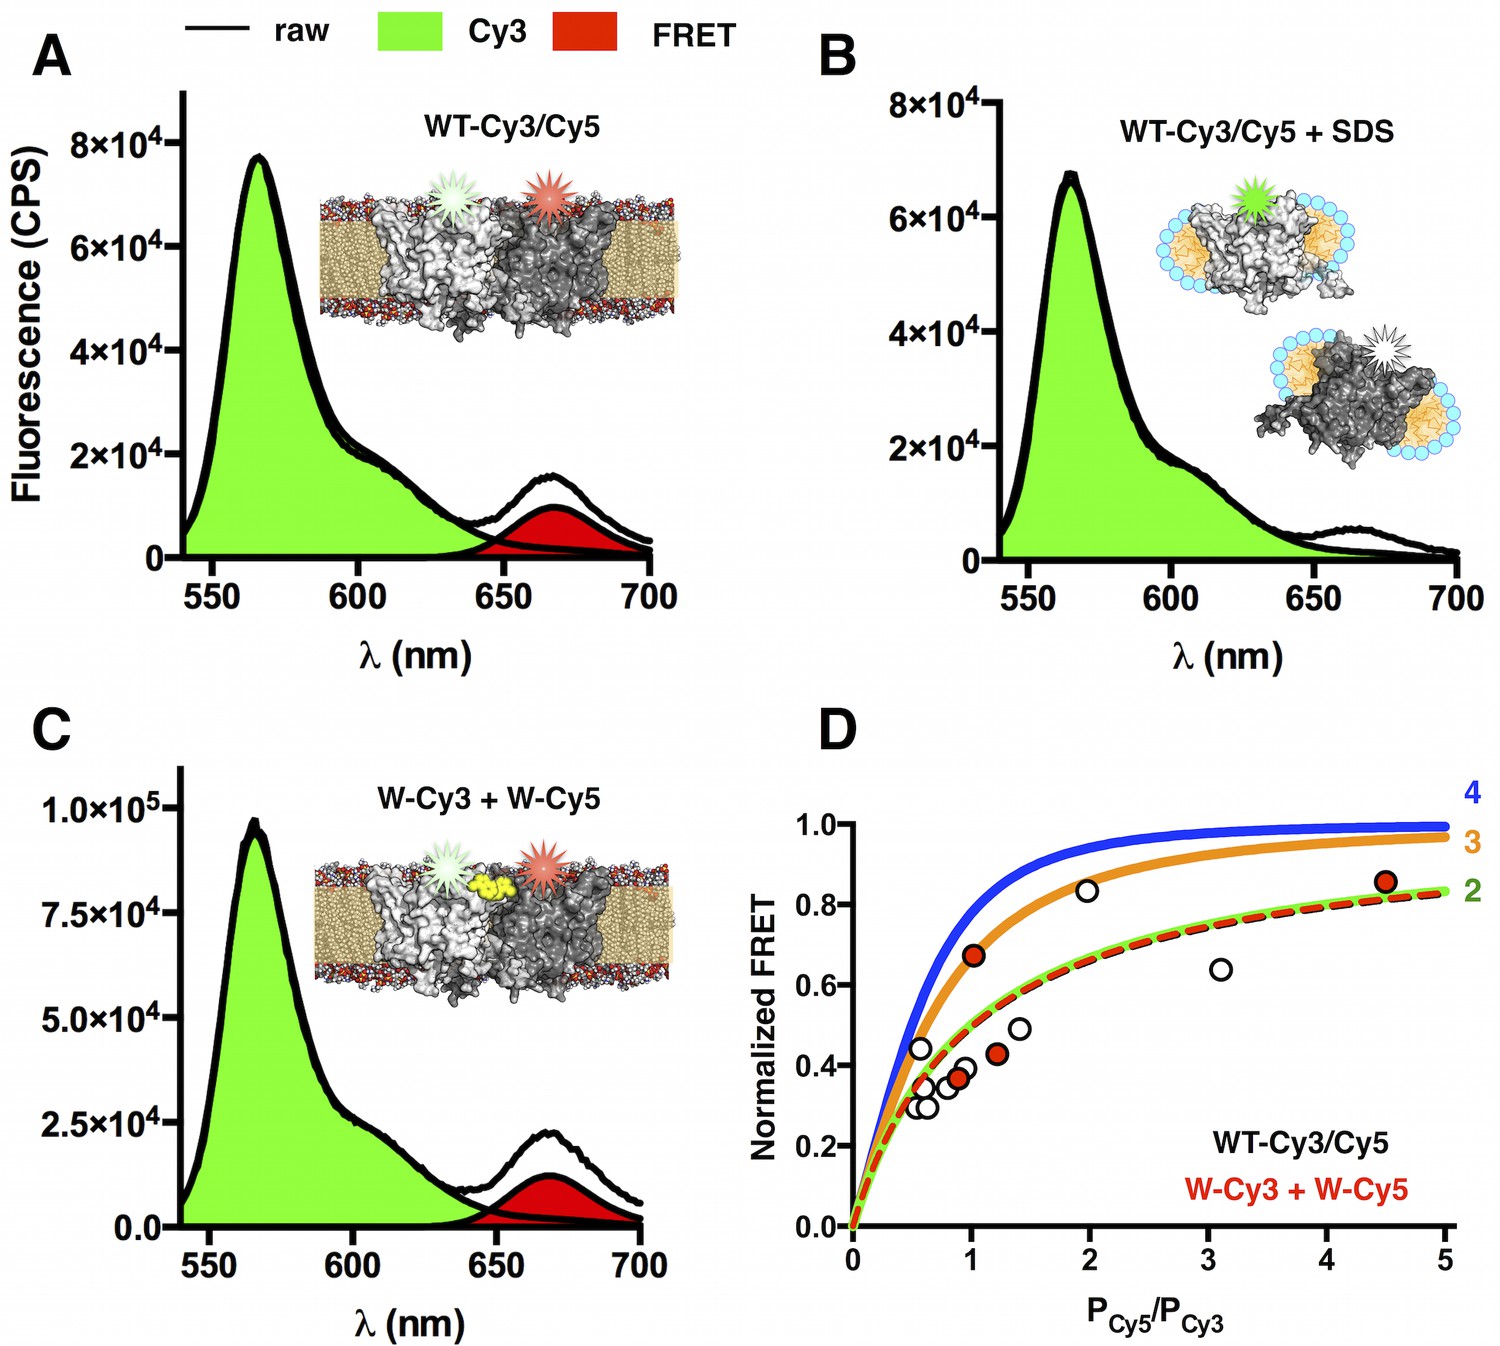
FRET measurements of WT-Cy3/Cy5 and W-Cy3 + W-Cy5 in lipid bilayers at χ = 7.5 × 10⁻⁶ subunit/lipid.
(A) FRET emission spectrum (λEX = 535 nm) of co-labeled WT-Cy3/Cy5 (PCy5/PCy3 = 1.2) in freeze/thawed 2:1 POPE/POPG MLVs. The raw spectrum (black) is decomposed into Cy3 donor emission (green) and FRET-specific Cy5 emission (red). (B) Addition of 0.2% SDS dissociates the dimer resulting in complete loss of the FRET signal. (C) Emission spectrum of separately labeled W-Cy3 + W-Cy5 mixed prior to reconstitution then freeze/thawed to form MLVs (PCy5/PCy3 = 1.4). (D) Saturation of FRET as a function of increasing acceptor/donor ratios fit to theoretical curves for dimer (2 - green), trimer (3 – orange) and tetramer (4 – blue) oligomeric states. WT-Cy3/Cy5 (white circles) and W-Cy3 + W-Cy5 (red circles) data are shown as symbols.
Figure 4 with 1 supplement

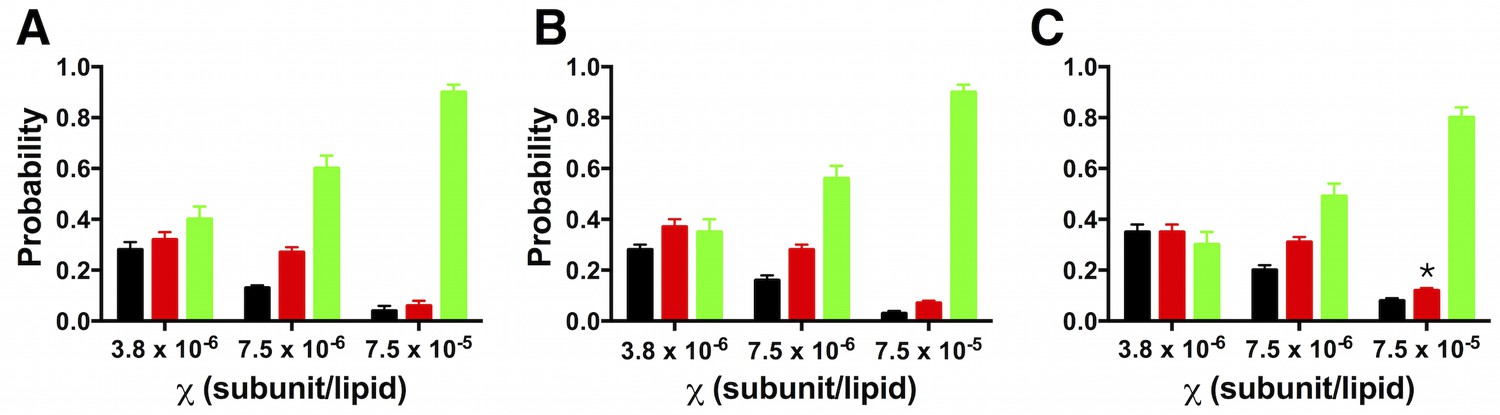
Photobleaching probabilities show a monomer to dimer transition that depends on the number of tryptophan residues at the dimerization interface.
Left, single subunit of (A) WW ClC-ec1, (B) W and (C) WT in the lipid bilayer (beige rectangle, dotted lines) rotated to show the four helices that form the dimerization interface (red) and non-polar residues that line this surface (yellow, licorice). Tryptophan substitutions are shown in yellow VDW representation. Right, experimental Pexpt1-3+ at mole fraction densities = 7.5 × 10⁻¹⁰ to 3.8 × 10⁻⁴ subunit/lipid for (A) WT-Cy5, (B) W-Cy5 and (C) WW-Cy5. Data are reported as mean ± SE (n = 2–3 samples and 2–3 counters).
-
Figure 4—source data 1
Excel file including data and statistical analysis presented in Figure 4 including raw and averaged data for WT, W and WW photobleaching distributions.
- https://doi.org/10.7554/eLife.17438.016
Figure 4—figure supplement 1
Robustness of the photobleaching probability distribution.
Probabilities are shown for Nstep = 1 (black), 2 (red) and >= 3 (green) photobleaching steps. (A) W-Cy5 sample (PCy5 = 0.66) prepared in AF488-labeled lipids. (B) Photobleaching distributions from a sample obtained in a different purification of W-Cy5 (PCy5 = 0.73) prepared in un-labeled lipids. (C) Same data set as in (B) counted by a different, blinded individual. All data are represented as fraction ± binomial SD. Chi-squared analysis shows no significant difference (p > 0.05) in the photobleaching distributions obtained from samples prepared at the same mole fraction, except for (C) = 7.5 × 10⁻⁵ subunits/lipid (p = 0.04).
Figure 5 with 2 supplements
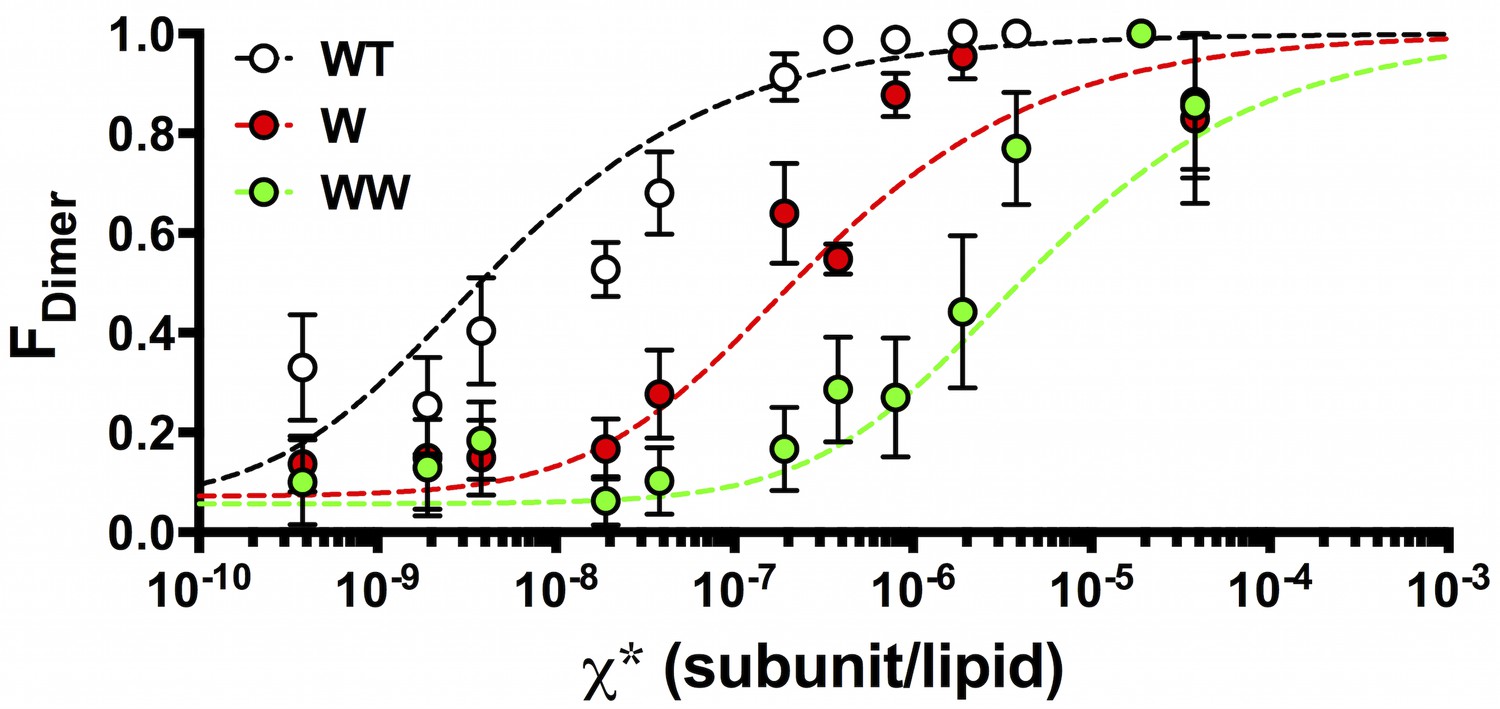
FDimer vs. the reactive mole fraction χ*.
FDimer is estimated by least-squares fitting of the experimental Pexpt1-5+ photobleaching probabilities to (1-FDimer)*PM1-5+ + FDimer*PD1-5+, where PM1-5+ and PD1-5+ are the calculated ideal monomer and dimer distributions. The reactive mole fraction, χ*, is equal to half of the experimental mole fraction (χ/2), assuming that the reaction only occurs between similarly oriented protein in the membrane. Data is shown for WT-Cy5 (black), W-Cy5 (red) and WW-Cy5 (green), with symbols representing mean ± SE (n = 2–3 samples and 2–3 counters). Dotted lines represent best-fits to the equilibrium dimerization isotherm, weighted by the inverse of the minimum residual sum of squares (R2) calculated in the estimation of FDimer (Figure 5—figure supplement 1).
-
Figure 5—source data 1
Excel file including data and statistical analysis presented in Figure 5 including raw and averaged FDimer data, minimum R2 values, standard error of the estimate (SEE) and 1/R2 weights on the fit.
Results from fitting to the dimerization isotherm are presented in Table 2.
- https://doi.org/10.7554/eLife.17438.019
Figure 5—figure supplement 1
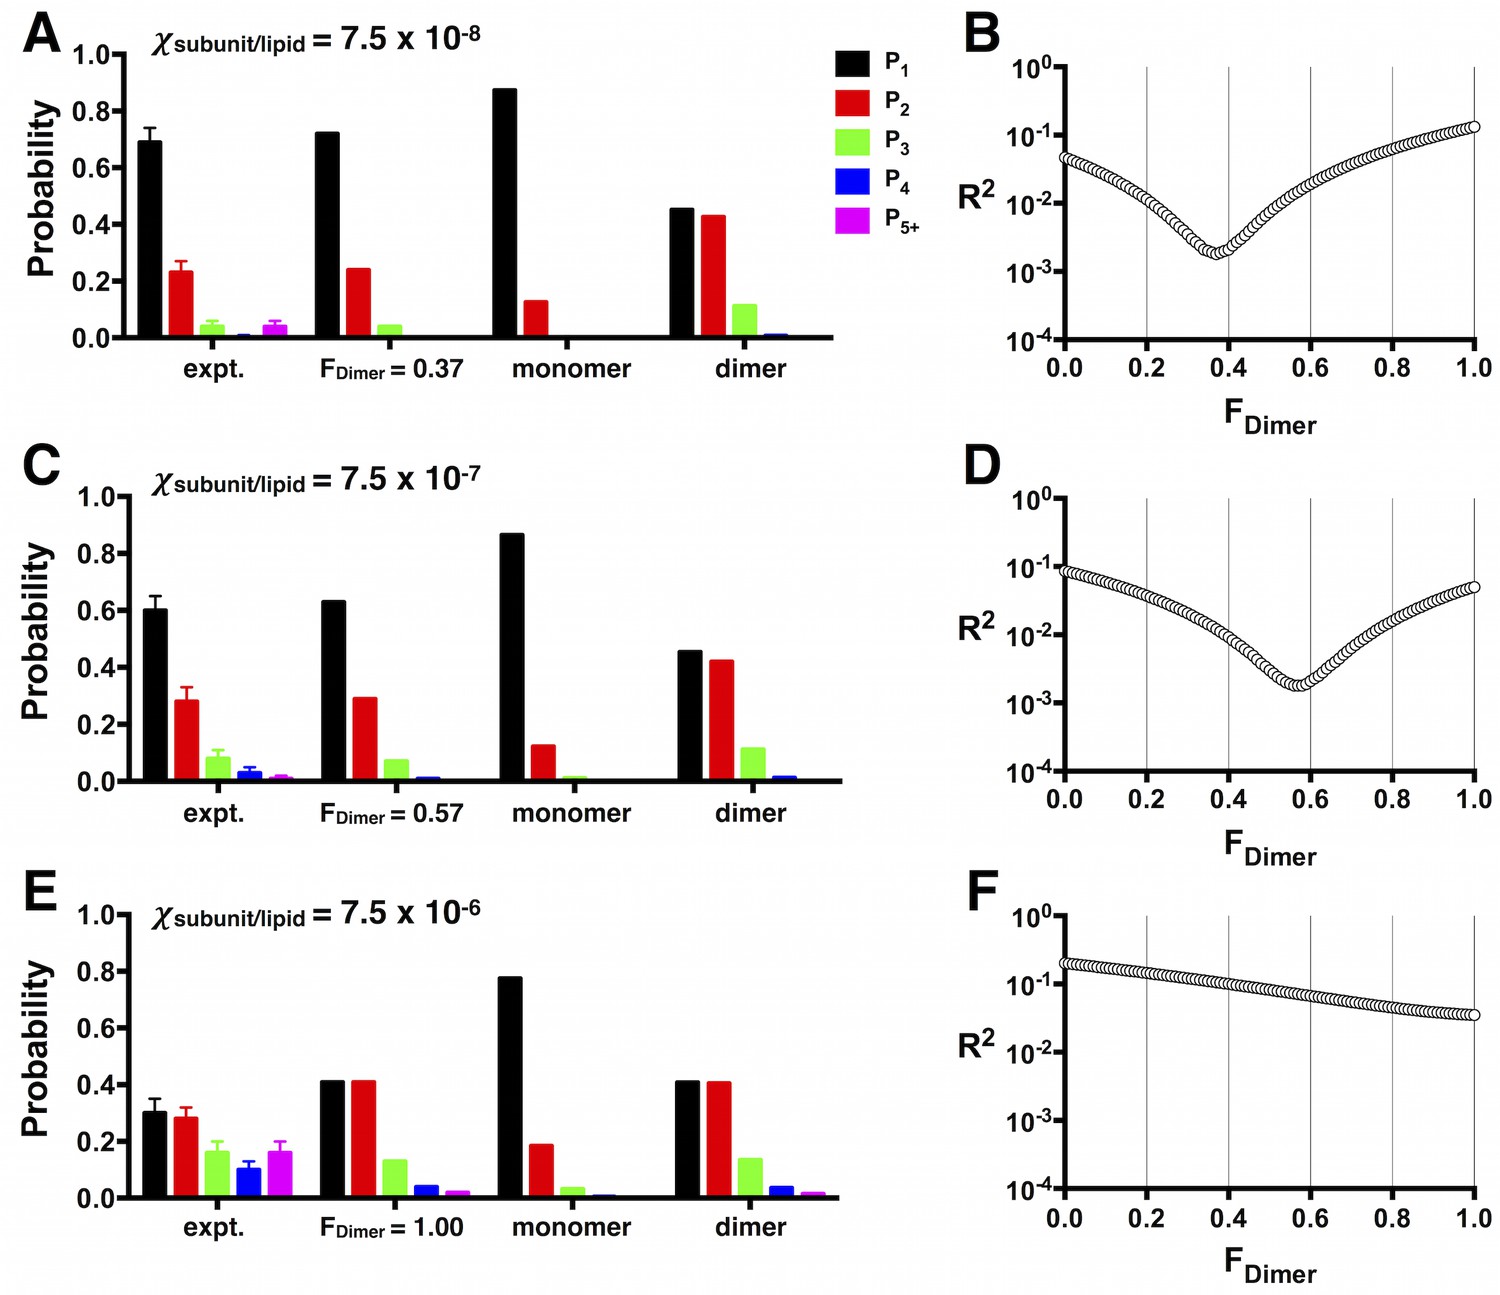
Least-squares estimation of FDimer.
(A) Pexpt1-5+ photobleaching distributions for W-Cy5 reconstituted at χ = 7.5 × 10⁻⁸, (C) 7.5 × 10⁻⁷ and (E) 7.5 × 10⁻⁶ subunits/lipid. Data are represented as fraction ± binomial SD. The least-squares prediction for FDimer is plotted to the right of the experimental distribution, along with the PM, and PD at the given mole fraction values. (B,D,F) The corresponding residual sum of squares function (R2) as a function of FDimer.
Figure 5—figure supplement 2
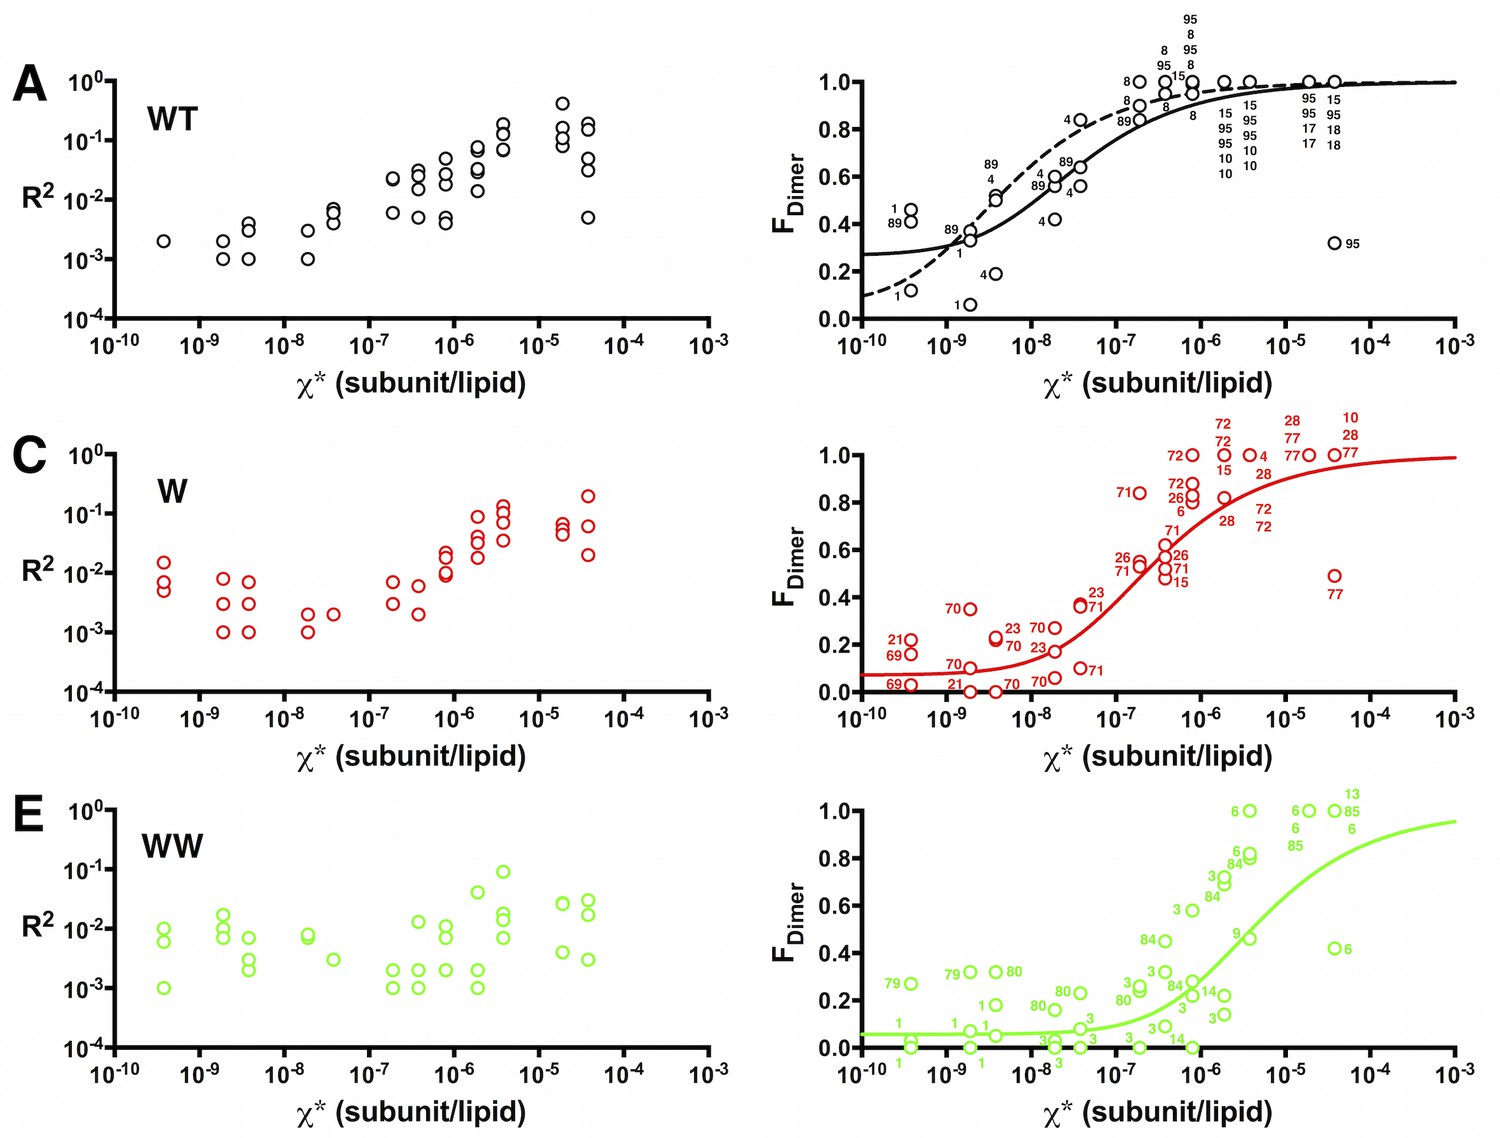
Sum of squared residuals (R2) as a function of the mole fraction density.
Left, R2 and right, FDimer estimates as a function of the reactive mole fraction χ*. (A,B) WT-Cy5, (C,D) W-Cy5, (E,F) WW-Cy5. Solid lines represent best-fits to the equilibrium isotherm weighted by 1/R2. The dotted line in (B) is the fit while constraining the baseline (Y0) to 0.065, as is automatically obtained for W-Cy5 and WW-Cy5 data. Numbers in (B) represent the post freeze/thaw incubation time for that sample.
Tables
Table 1
Lookup table for converting between membrane density units.
| ρ (μg/mg) | χReconstitution (subunits/ lipid) | χObserved (subunits/ lipid) | χ* (subunits/lipid) | (χ*)-1 (lipids/ subunit) | ρ*area (subunits/ nm2 bilayer) | (ρ*area)-1 (nm2 bilayer/ subunit) | Box (nm × nm) |
|---|---|---|---|---|---|---|---|
| 0.0001 | 1.5 × 10⁻⁹ | 7.5 × 10⁻¹⁰ | 3.8 × 10⁻¹⁰ | 2,657,101,103 | 1.3 × 10⁻⁹ | 797,130,331 | 28,233 |
| 0.0005 | 7.5 × 10⁻⁹ | 3.8 × 10⁻⁹ | 1.9 × 10⁻⁹ | 531,420,221 | 6.3 × 10⁻⁹ | 159,426,066 | 12,626 |
| 0.001 | 1.5 × 10⁻⁸ | 7.5 × 10⁻⁹ | 3.8 × 10⁻⁹ | 265,710,110 | 1.3 × 10⁻⁸ | 79,713,033 | 8928 |
| 0.005 | 7.5 × 10⁻⁸ | 3.8 × 10⁻⁸ | 1.9 × 10⁻⁸ | 53,142,022 | 6.3 × 10⁻⁸ | 15,942,607 | 3993 |
| 0.01 | 1.5 × 10⁻⁷ | 7.5 × 10⁻⁸ | 3.8 × 10⁻⁸ | 26,571,011 | 1.3 × 10⁻⁷ | 7,971,303 | 2823 |
| 0.05 | 7.5 × 10⁻⁷ | 3.8 × 10⁻⁷ | 1.9 × 10⁻⁷ | 5,314,202 | 6.3 × 10⁻⁷ | 1,594,261 | 1263 |
| 0.1 | 1.5 × 10⁻⁶ | 7.5 × 10⁻⁷ | 3.8 × 10⁻⁷ | 2,657,101 | 1.3 × 10⁻⁶ | 797,130 | 893 |
| 0.2 | 3.0 × 10⁻⁶ | 2.0 × 10⁻⁶ | 8.0 × 10⁻⁷ | 1,328,551 | 2.5 × 10⁻⁶ | 398,565 | 631 |
| 0.5 | 7.5 × 10⁻⁶ | 3.8 × 10⁻⁶ | 1.9 × 10⁻⁶ | 531,420 | 6.3 × 10⁻⁶ | 159,426 | 399 |
| 1 | 1.5 × 10⁻⁵ | 7.5 × 10⁻⁶ | 3.8 × 10⁻⁶ | 265,710 | 1.3 × 10⁻⁵ | 79,713 | 282 |
| 5 | 7.5 × 10⁻⁵ | 3.8 × 10⁻⁵ | 1.9 × 10⁻⁵ | 53,142 | 6.3 × 10⁻⁵ | 15,943 | 126 |
| 10 | 1.5 × 10⁻⁴ | 7.5 × 10⁻⁵ | 3.8 × 10⁻⁵ | 26,571 | 1.3 × 10⁻⁴ | 7971 | 89 |
| 50 | 7.5 × 10⁻⁴ | 3.8 × 10⁻⁴ | 1.9 × 10⁻⁴ | 5,314 | 6.3 × 10⁻⁴ | 1594 | 40 |
-
ρ is the reconstituted mass density of μg of ClC-ec1 subunits per mg of 2:1 POPE/POPG lipids.
-
χReconstitution is the reconstituted mole fraction of ClC-ec1 subunits per lipid.
-
χObserved = χReconstitution * 0.50, determined from protein to lipid quantification assays.
-
χ* is the reactive mole fraction calculated as χObserved/2, assuming that the reaction occurs between oriented subunits in the membrane.
-
ρ*area is the reactive mole density, subunits per bilayer area, using SAlipid = 0.6 nm2.
-
Box – square root of (ρ*area)-1
-
Bolded values indicate the observed dynamic range of the photobleaching approach.
Table 2
Summary of dissociation constants, equilibrium association constants and standard state free energy based on the best-fit parameters of FDimer vs. the reactive mole fraction, χ* or area density, ρArea*.
| Mole fraction scale (χ*) standard state = 1 subunit/lipid | Area density scale (ρArea*) standard state = 1 subunit/nm2 | |||||||
|---|---|---|---|---|---|---|---|---|
| ClC-ec1 construct | Kd(subunits/lipid) | Kχ (lipids/subunit) | ΔG°χ (kcal/mole) | Kd(subunits/nm2) | Kρ (nm2/subunit) | Eq. Box (nm × nm) | ΔG°ρ (kcal/mole) | |
| WT | mean ± SE | 4.7 ± 1.1 × 10⁻⁹ | 2.1 ± 0.5 × 10⁸ | -11.4 ± 0.1 | 1.6 ± 0.4 × 10⁻⁸ | 6.4 ± 1.4 × 10⁷ | 8002 ± 3794 | -10.7 ± 0.1 |
| Y0const. = 0.07 | 95% CI | 2.6 to 6.8 × 10⁻⁹ | 1.2 to 3.1 × 10⁸ | -11.6 to -11.1 | 8.5 × 10⁻⁹ to 2.3 × 10⁻⁸ | 3.5 to 9.3 × 10⁷ | 5919 to 9644 | -10.9 to -10.4 |
| W | mean ± SE | 2.7 ± 1.1 × 10⁻⁷ | 3.7 ± 1.6 × 10⁶ | -9.0 ± 0.3 | 8.9 ± 3.8 × 10⁻⁷ | 1.1 ± 0.5 × 10⁶ | 1049 ± 707 | -8.3 ± 0.3 |
| Y0 = 0.07 ± 0.06 | 95% CI | 3.5 × 10⁻⁸to 5.0 × 10⁻⁷ | 2.3 to 5.1 × 10⁶ | -9.5 to -8.5 | 1.2 × 10⁻⁷to 1.7 × 10⁻⁶ | 1.5 × 10⁵to 2.1 × 10⁶ | 387 to 1449 | -8.8 to -7.7 |
| WW | mean ± SE | 4.7 ± 1.8 × 10⁻⁶ | 2.1 ± 0.8 × 10⁵ | -7.3 ± 0.2 | 1.6 ± 0.6 × 10⁻⁵ | 6.3 ± 2.4 × 10⁴ | 251 ± 155 | -6.6 ± 0.2 |
| Y0 = 0.06 ± 0.02 | 95% CI | 1.2 to 8.3 × 10⁻⁶ | 5.0 × 10⁴ to 3.7 × 10⁵ | -7.7 to -6.8 | 3.9 × 10⁻⁶to 2.8 × 10⁻⁵ | 1.5 × 10⁴to 1.1 × 10⁵ | 122 to 332 | -7.0 to -6.1 |
-
Best-fit parameters are reported as mean ± standard error (SE) and 95% confidence intervals (CI). The area density scale is calculated by converting the mole fraction scale using SAlipid = 0.6 nm2 per lipid in a single leaflet and is not corrected for differences in the subunit vs. lipid volume. Eq. Box denotes the box size defined by the equilibrium constant Keq. Y0 indicates the baseline offset parameter that is either fitted or constrained.
Additional files
-
Source code 1
DimerizationRobertson2016v1.m – MATLAB script that calculates the theoretical monomer and dimer photobleaching distribution P1-5+.
- https://doi.org/10.7554/eLife.17438.023
Download links
A two-part list of links to download the article, or parts of the article, in various formats.
Downloads (link to download the article as PDF)
Open citations (links to open the citations from this article in various online reference manager services)
Cite this article (links to download the citations from this article in formats compatible with various reference manager tools)
The dimerization equilibrium of a ClC Cl−/H+ antiporter in lipid bilayers
eLife 5:e17438.
https://doi.org/10.7554/eLife.17438


