v-SNARE transmembrane domains function as catalysts for vesicle fusion
- Saarland University, Germany
- Max-Planck-Institute for Biophysical Chemistry, Germany
- Friedrich-Alexander University, Germany
Figures
Figure 1 with 3 supplements
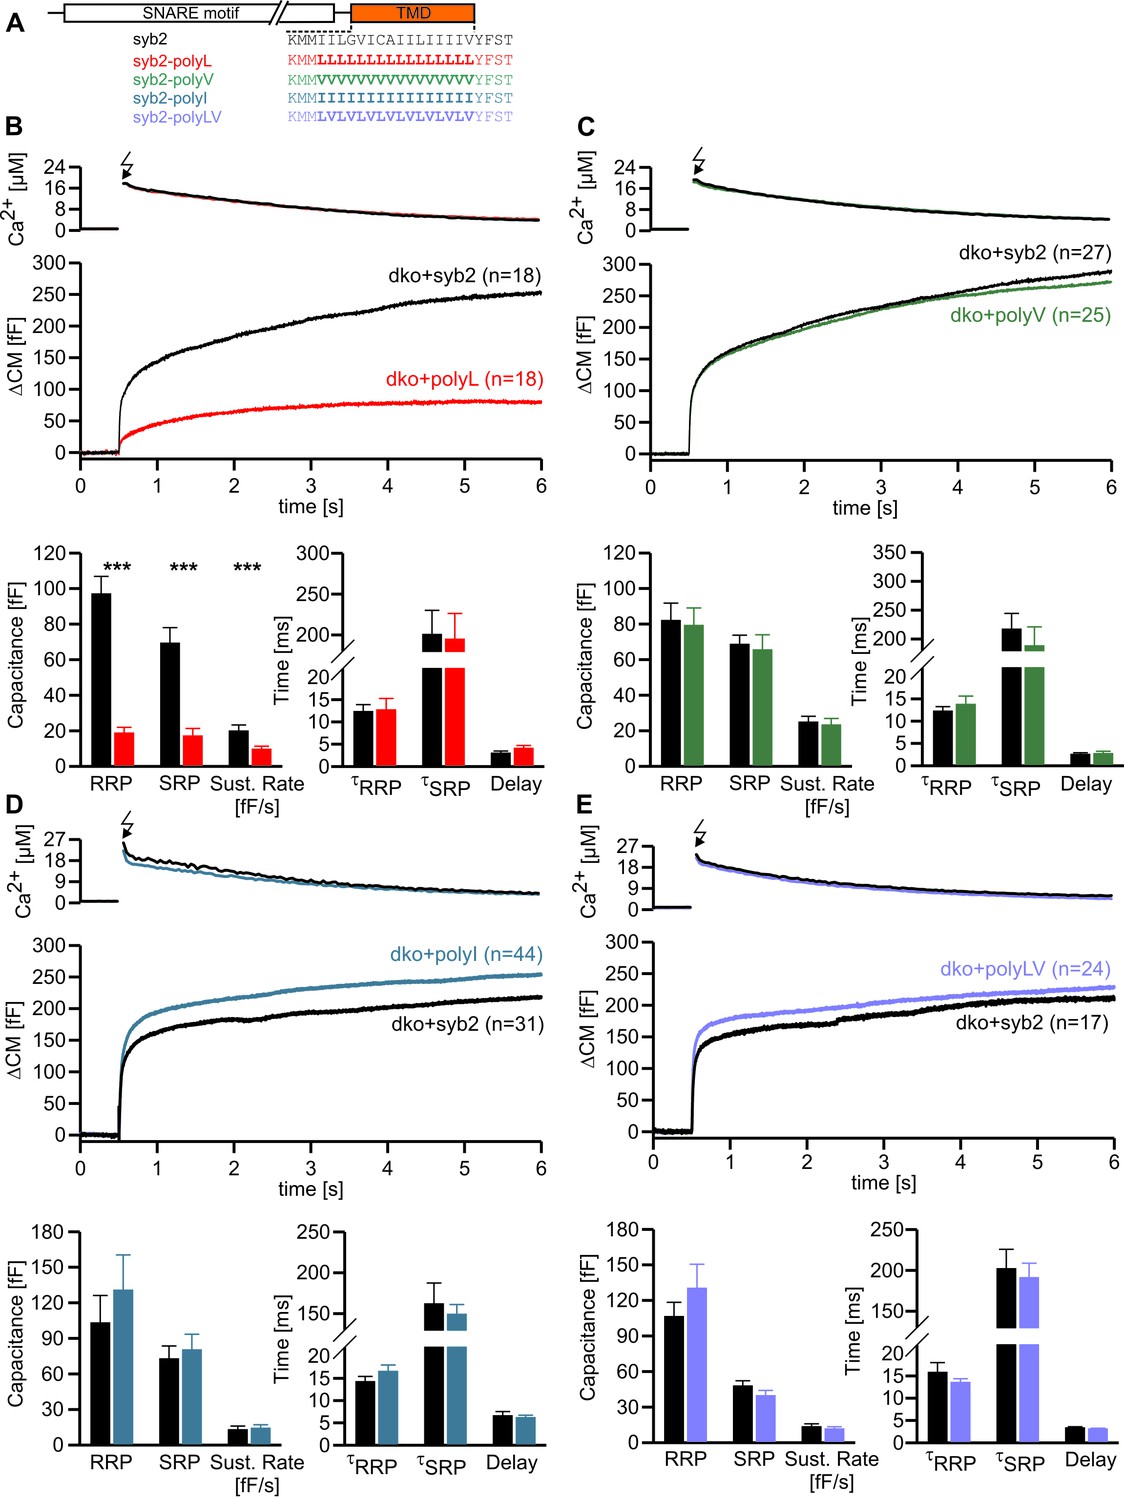
Helix stabilizing amino acids in the syb2 TMD diminish secretion.
(A) Schematic representation of syb2 and corresponding TMD mutants (polyL, polyV, polyI, polyLV). (B–E) Mean flash-induced [Ca2+]i levels (top panels) and corresponding CM responses (middle panels) of dko cells expressing syb2 wt, polyL, polyV, polyI or polyLV mutants. The polyL mutation reduced RRP and SRP size as well as sustained rate of release, whereas other substitutions of the TMD core residues with valine, isoleucine or a combination of leucine and valine fully restored exocytosis (bottom panels). The kinetics of release τRRP, τSRP and the secretory delay are unchanged for all mutants. Arrow indicates flash. Data are represented as mean ± SEM and numbers of cells are indicated within brackets. ***p<0.001, Mann Whitney U test versus syb2.
Figure 1—figure supplement 1
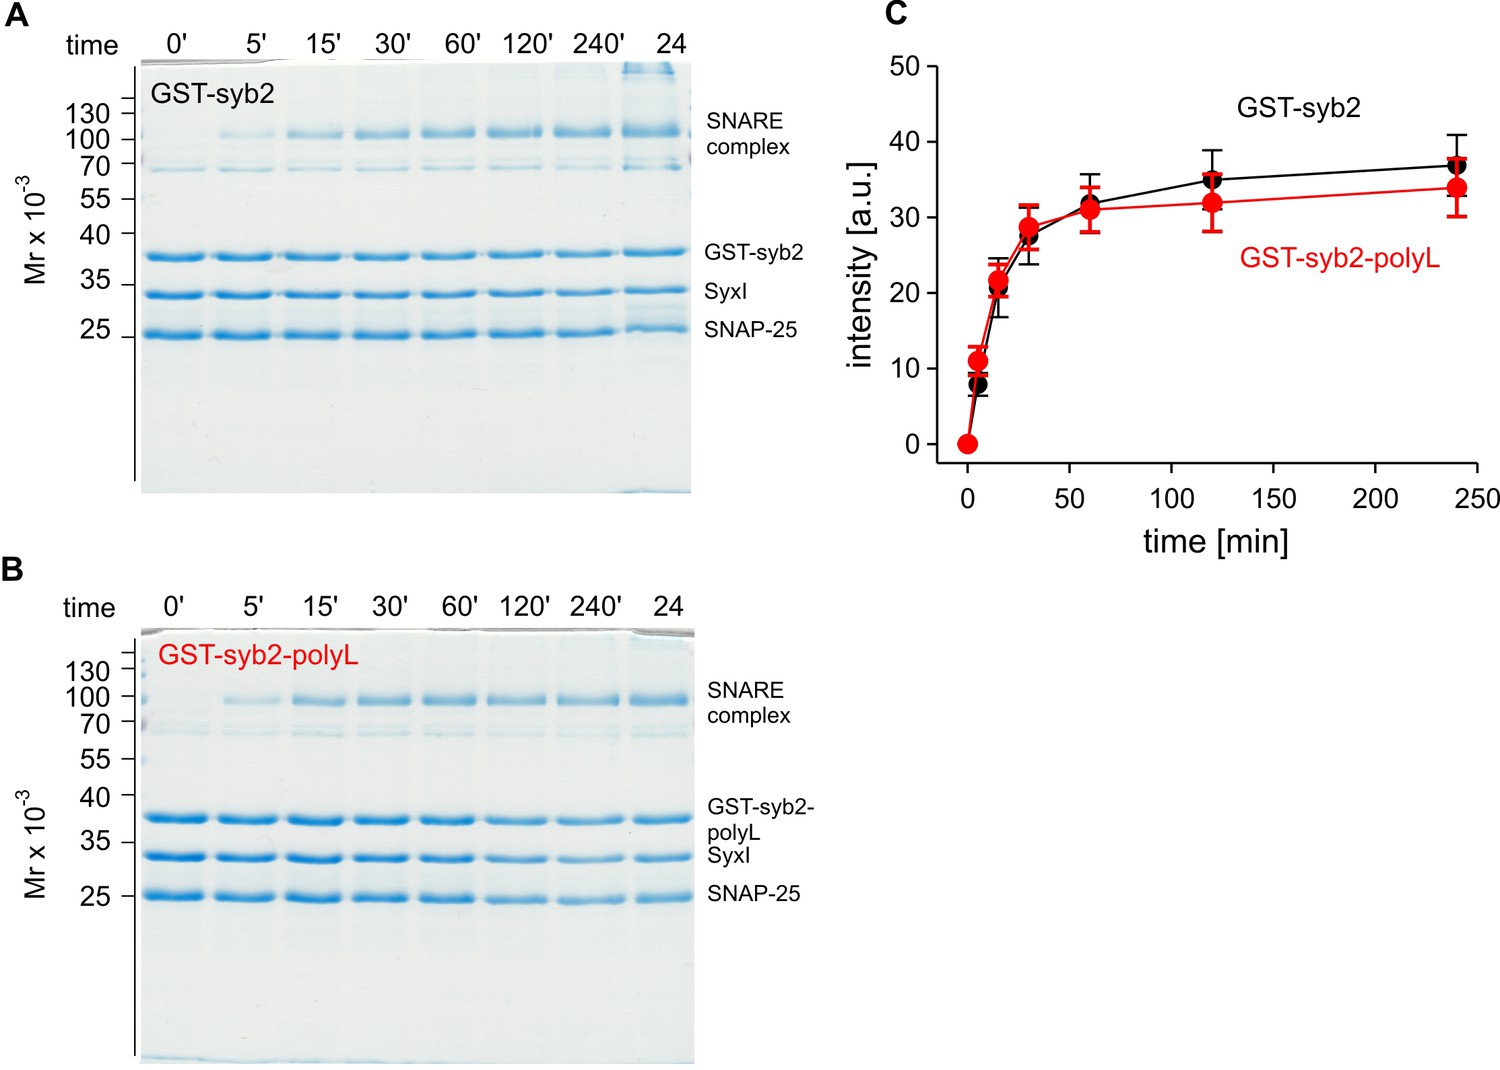
The poly-L mutant forms SDS-resistant SNARE complexes like the wildtype protein.
Time-dependent SNARE complex formation between GST-syb2 (A) or GST-syb2-polyL (B) and their SNARE partners syntaxin 1 (amino acids 1–262) and SNAP25 (amino acids 1–206). SNARE complexes were formed by mixing approximately equal molar amounts (~5 µM) of the proteins and incubating at 25°C for the indicated times. The ability of SNARE proteins to form SDS-resistant complexes was analyzed by SDS-PAGE. Exemplary Coomassie-stained SDS gels are shown. (C) Quantification of SDS-resistant SNARE complex binding at different times after mixing the proteins. The polyL mutation affects neither the rate nor the extent of SNARE complex formation rendering the possibility unlikely that the altered TMD allosterically affects the upstream SNARE motif to interact with its cognate SNARE partners. Data were collected from four independent experiments and are represented as mean ± SEM.
Figure 1—figure supplement 2
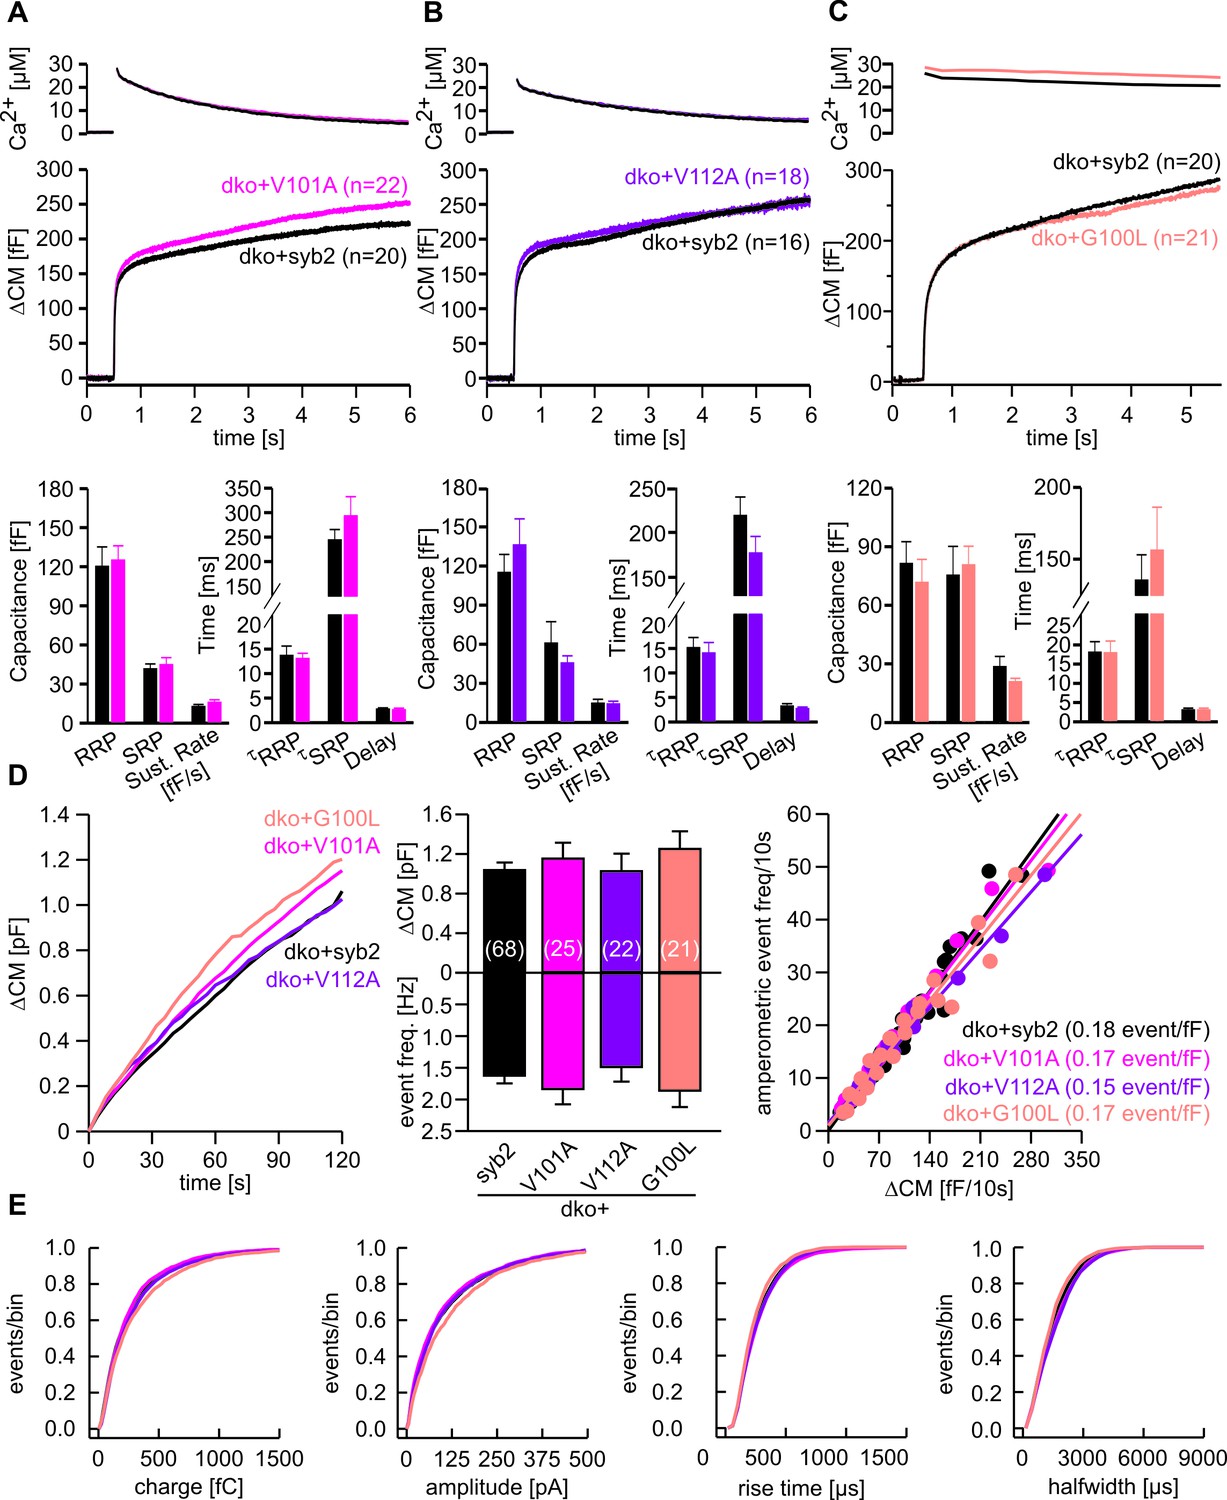
Substitution of conserved amino acids within the syb2-TMD does not affect vesicle fusion.
(A–C) Mean flash-induced [Ca2+]i levels (top panels) and corresponding CM responses (middle panels) of dko cells expressing syb2 or V101A (pink) or V112A (purple) or G100L (light pink) mutants. Numbers of cells analyzed are indicated within the brackets. Neither magnitudes of RRP and SRP nor kinetics of release are changed for the mutant proteins (bottom panel, Mann Whitney U Test versus syb2). (D) Mean capacitance response upon intracellular perfusion with 19 µM free Ca2+ for the indicated groups (left panel). Total ∆CM and amperometric event frequency measured over 120 s (middle panel) from 68 dko+syb2, 25 dko+V101A, 22 dko+V112A and 21 dko+G100L cells. The amperometric event frequency scales proportionally to ΔCM in syb2 or its mutant variants expressing dko cells (right panel), indicating that alterations in CM are due to changes in granule exocytosis and that mutants of syb2 do not cause premature closure of fusion pore. Continuous lines indicate linear regression. (E) Properties of the main amperometric spikes, displayed as cumulative frequency distribution for syb2 (8005 events), V101A (2885 events), V112A (2481 events), G100L (2386 events) show unchanged spike charge, amplitude, rise time and half width in the mutant variants compared to control. Data are represented as mean ± SEM, one-way analysis of variance versus control.
Figure 1—figure supplement 3

Syb2 and its TMD mutants are sorted to chromaffin granules with similar efficiency.
(A) Exemplary immunostainings (imaged with SIM) for ceb (green) and syb2 (red) in littermate control chromaffin cells and syb2 ko cells expressing syb2 or one of the TMD variants (top to bottom: polyL, polyV, polyI, polyL-Ct and polyL-Nt). Cells were imaged within the footprint area to minimize the contribution of ER/Golgi-derived fluorescence in virus-transfected cells. Syb2 fluorescence signals in littermate control cells were excited with five-fold higher laser power than in virus-transfected cells (x5). The merged images and their magnified view display a clear colocalization between ceb and syb2 (or the TMD mutants), as also illustrated in the corresponding line scans (magnified view, dashed lines; pixel size, 40 nm). (B) Mander’s weighted colocalization of syb2 or its TMD mutants to endogenous ceb indicates a similar colocalization coefficient (~80%) for all the tested mutant variants. The total fluorescence intensity of single syb2 immunopositive puncta is similar for syb2 and the TMD mutants and five-fold higher than the littermate control (wt) cells. Images were thresholded to values 6xSD of the background fluorescence to isolate discrete regions of interest (ROIs). Similar-sized ROIs in wildtype cells (0.0558 ± 0.0024 µm²; 9 cells; 1042 ROIs) and dko cells expressing syb2 (0.0552 ± 0.0019 µm²; 10 cells; 1087 ROIs) or the TMD mutants: polyL (0.0517 ± 0.0031 µm²; 10 cells; 2011 ROIs), polyV (0.0527 ± 0.0028 µm²; 15 cells; 2021 ROIs), polyI (0.0562 ± 0.0022 µm²; 12 cells; 1981 ROIs), polyL-Ct (0.0551 ± 0.0026 µm²; 10 cells; 970 ROIs), polyL-Nt (0.0610 ± 0.0019 µm²; 11 cells; 1025 ROIs) were analyzed. (C) Exemplary fluorescence profiles of discrete syb2 immunopositive puncta analyzed by z-stacking reveal singular fluorescence peaks consistent with the vesicular origin of the immunosignals. (D) Exemplary images of a dko+gfp, ceb ko (ctrl, littermate control)+gfp and dko cells overexpressing either syb2 or the mutated v-SNAREs proteins. In dko cells expressing syb2 or its mutant variants, signals are much stronger than in ctrl+gfp cells and are visualized after adjustment of the camera’s exposure time (dko+gfp and ctrl+gfp, 3.9 s; dko+v-SNARE, 0.31 s). (E) Mean total fluorescence intensity of dko+gfp, ctrl+gfp and dko cells expressing syb2 or the indicated mutants (determined 5.5 hr after transfection). Note that expression of syb2 or its mutants in dko cells leads to ~ten fold increase in protein level when compared with the wt signal. Data are normalized to the immunosignal of dko+syb2 cells. Data are represented as mean ± SEM. ***p<0.001, one-way analysis of variance versus control.
Figure 2

Modifying the number of ß-branched residues in the syb2 TMD changes the kinetics of cargo discharge.
(A) Schematic representation of syb2 and its TMD mutants (polyL, polyV, polyI). (B) Exemplary recordings of CM and amperometry for dko cells expressing syb2 or the polyL mutant (dashed lines indicate cell opening initiating intracellular perfusion with 19 µM free Ca2+). (C) Mean capacitance responses over 120 s. (D) Total ∆CM after 120 s (top) and amperometric event frequency (bottom) averaged from the indicated number of cells. (E) Properties of the main amperometric spike, displayed as cumulative frequency distribution for the indicated parameters. Exemplary amperometric events with similar charge for the indicated groups are shown (right). (F) The polyL mutant prolonged and the polyV or polyI mutations accelerated spike kinetics (causing corresponding changes in spike amplitude) without affecting quantal size. Values are given as mean of median determined from the parameter’s frequency distribution for each cell. Data were collected from cells/events measured for syb2 (61/7275), polyL (22/1018), polyV (18/2431), polyI (30/2789). Only cells with >20 events were considered. Data are represented as mean ± SEM. **p<0.01, ***p<0.001, one way analysis of variance versus syb2.
Figure 3
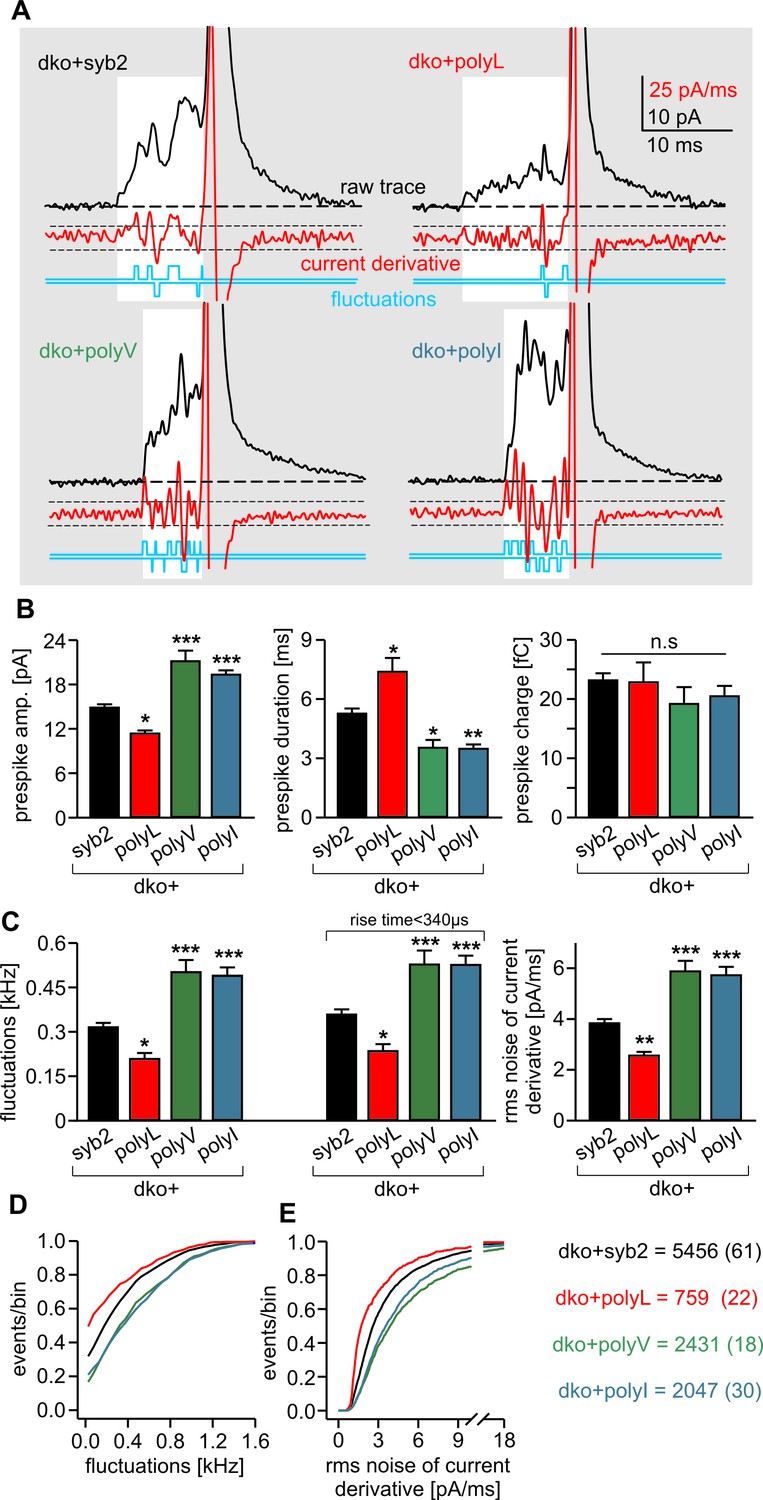
PolyL and polyV (or I) mutations oppositely alter the kinetics of prespike signals.
(A) Exemplary prespike events and analysis of their current fluctuations (highlighted area) during transmitter discharge through a narrow pore. Deflections of the current derivative (red trace) above the threshold (dashed lines = ± 4 SD of base line noise) were counted as fluctuations (blue trace). The displayed events have a similar total charge and 50%–90% rise time (dko+syb2: 477fC, 280 µs; dko+polyL: 458fC, 240 µs; dko+polyV: 462fC, 200 µs; dko+polyI: 483fC, 200 µs), indicating that the different fluctuation behavior is not due to differences in diffusional broadening of the current signals. (B) PolyL mutation and polyV or I mutations oppositely altered the amplitude and kinetics of the prespike event, without changing its charge. (C) The average fluctuation frequency (sum of positive and negative fluctuations) of all events with an amplitude >7 pA as well as of events with spike rise times <340 ms (minimizing a potential distortion of the signal time course by diffusional broadening) decreased for the polyL mutant and increased for the polyV/I mutants. Mean rms noise of the current derivative during the prespike signal, serving as threshold-independent parameter of fusion pore jitter, confirms mutant protein-mediated changes in fusion pore dynamics. (D–E) Cumulative frequency distributions for fluctuation frequency and rms noise of current derivative from dko+syb2 (black), dko+polyL (red), dko+polyV (green) and dko+polyI cells (blue). Data were collected from the indicated number of events (cells) and are represented as mean ± SEM. *p<0.05, **p<0.01, ***p<0.001, one way analysis of variance versus syb2.
Figure 4
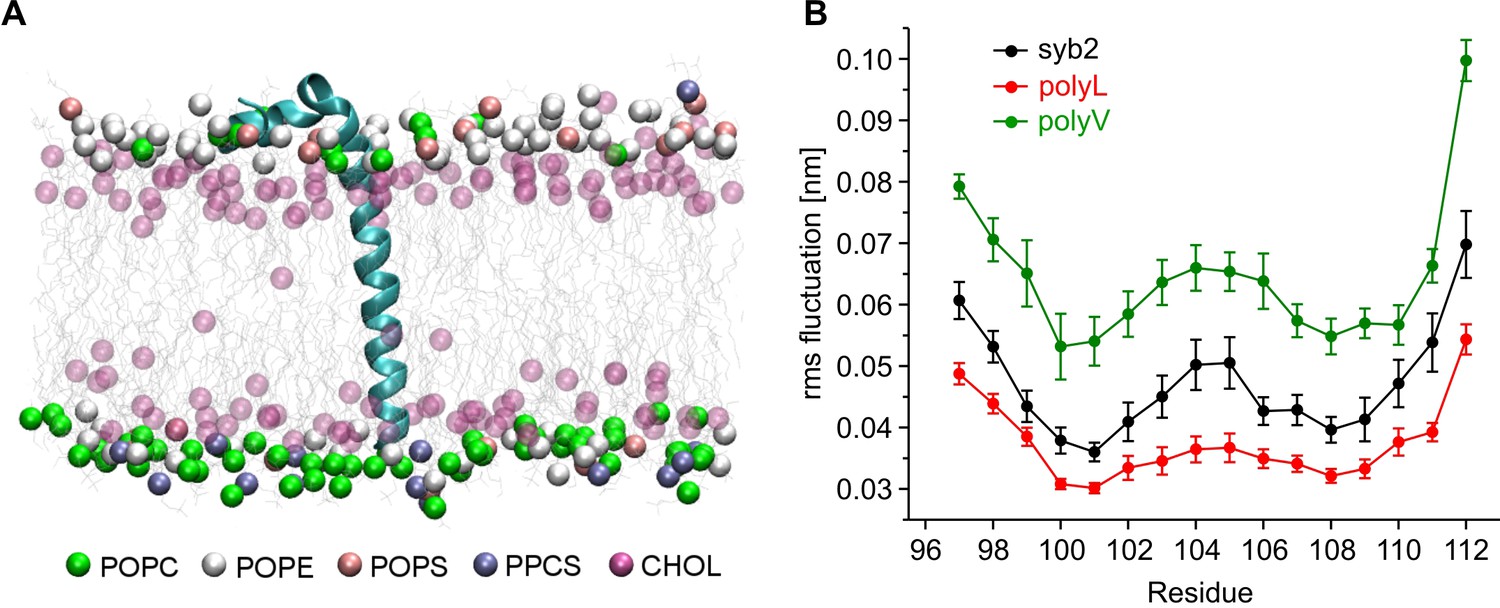
Conformational flexibilities of syb2 and its mutant variants.
(A) Snapshot from the atomistic simulation for inserted syb2 (residues 71–116) in an asymmetric, self-assembled membrane (cytoplasmic leaflet, top; intravesicular leaflet, bottom) with the protein backbone depicted in cartoon representation. The phosphate atoms of lipid and the hydroxyl carbon of cholesterol are shown in the Van der Waals representation. Other atoms of the lipids are shown as grey lines (water molecules are not shown for clarity). Different lipid moieties are depicted according to the colour code shown below. Note the asymmetric lipid composition of the bilayer. (B) Root mean square fluctuations (RMSF) of C-α atoms derived from 40 ns simulation runs for syb2 and the mutants relative to the average structure of the corresponding peptide. Flexibility of the TMD region (residues 97–112) was determined from non-overlapping 10 ns periods during the last 30 ns of the trajectories for each simulation. The polyV region of the mutant showed on average an increased flexibility (0.0644 ± 0.0029 nm, p<0.001), while the polyL region (0.0374 ± 0.0017 nm, p<0.05) showed a decreased jitter when compared with syb2 (0.0472 ± 0.0022 nm, one-way analysis of variance versus syb2). Error bars are s.e.m. of averages calculated from the values of the individual 10 ns windows (n = 9 for wt, n = 6 for mutants).
Figure 5 with 2 supplements
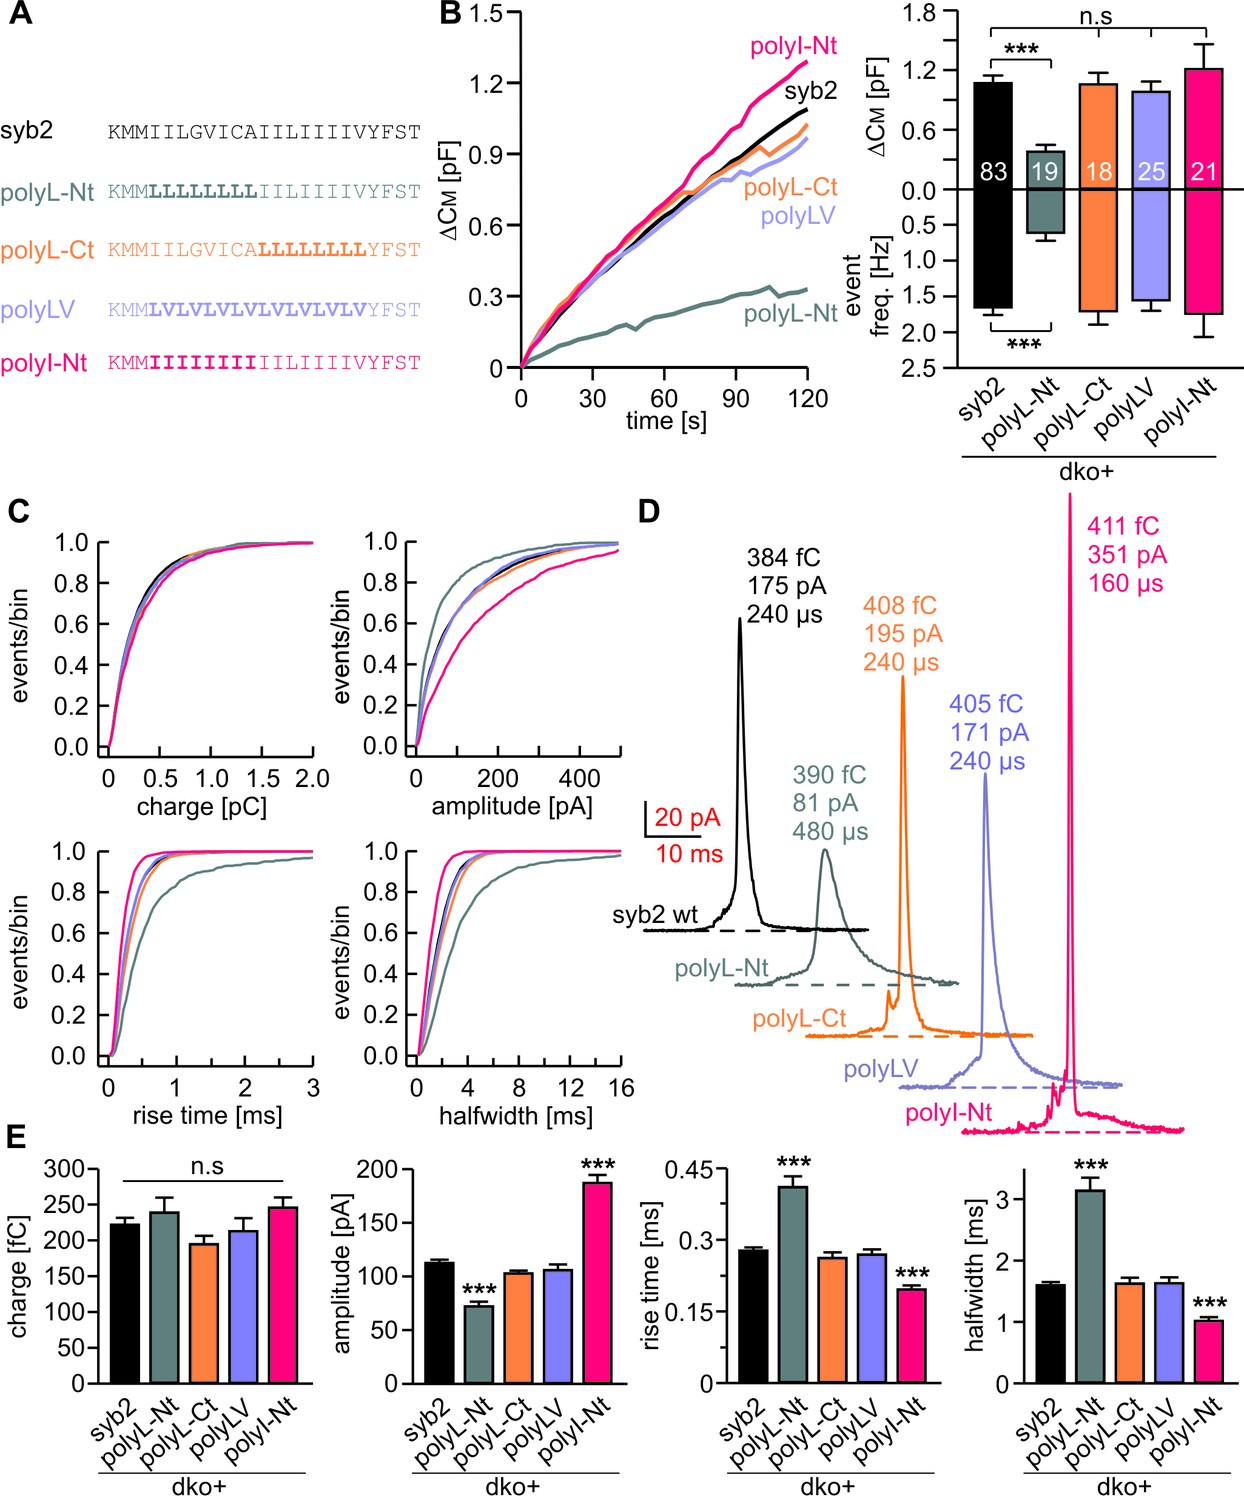
Structural flexibility of the N-terminal TMD region catalyzes fusion initiation and fusion pore dilation.
(A) Schemes of syb2 and corresponding TMD mutants (polyL-Nt, polyL-Ct, polyLV, polyI-Nt). (B) Mean capacitance changes in response to intracellular perfusion with 19 µM free Ca2+ in the indicated groups. Total ∆CM (top) and amperometric event frequency (bottom) measured over 120 s show that only polyL-Nt mutant fails to rescue normal exocytosis. Data are averaged from the indicated number of cells. (C) Properties of the main amperometric spikes displayed as cumulative frequency distribution for the indicated parameters and color coded according to (A). (D) Exemplary amperometric events with similar charge but altered release profile for the indicated syb2 variant. (E) PolyL-Nt mutation slowed the spike waveform (reduced amplitude, increased rise time, and half width) while polyI-Nt increased the amplitude and decreased the rise time and half width. Values are given as mean of median determined from the indicated parameter’s frequency distribution for each cell. Data were collected from cells/events measured for syb2 (83/9054), polyL-Nt (19/951), polyL-Ct (18/2684), polyLV (25/3576), polyI-Nt (21/2057). Only cells with >20 events were considered. Data are represented as mean ± SEM. ***p<0.001, one-way analysis of variance versus syb2.
Figure 5—figure supplement 1

Conformational flexibility of the N-terminal region of syb2 TMD supports LDCV fusion.
(A–C) Mean flash-induced [Ca2+]i levels (top panels) and CM responses (middle panels) of dko+polyL-Nt, dko+polyL-Ct and dko+polyI-Nt versus the corresponding control (dko+syb2). RRP and SRP size as well as sustained rate of release and kinetics of release (τRRP, τSRP and delay) are plotted in the corresponding bottom panels. Evoked secretion is only reduced in the polyL-Nt mutant, while the kinetics of release is unchanged for all mutants (bottom panels). Numbers of cells for each group are indicated within the brackets. Data are represented as mean ± SEM. ***p<0.001, Mann Whitney U test versus syb2.
Figure 5—figure supplement 2
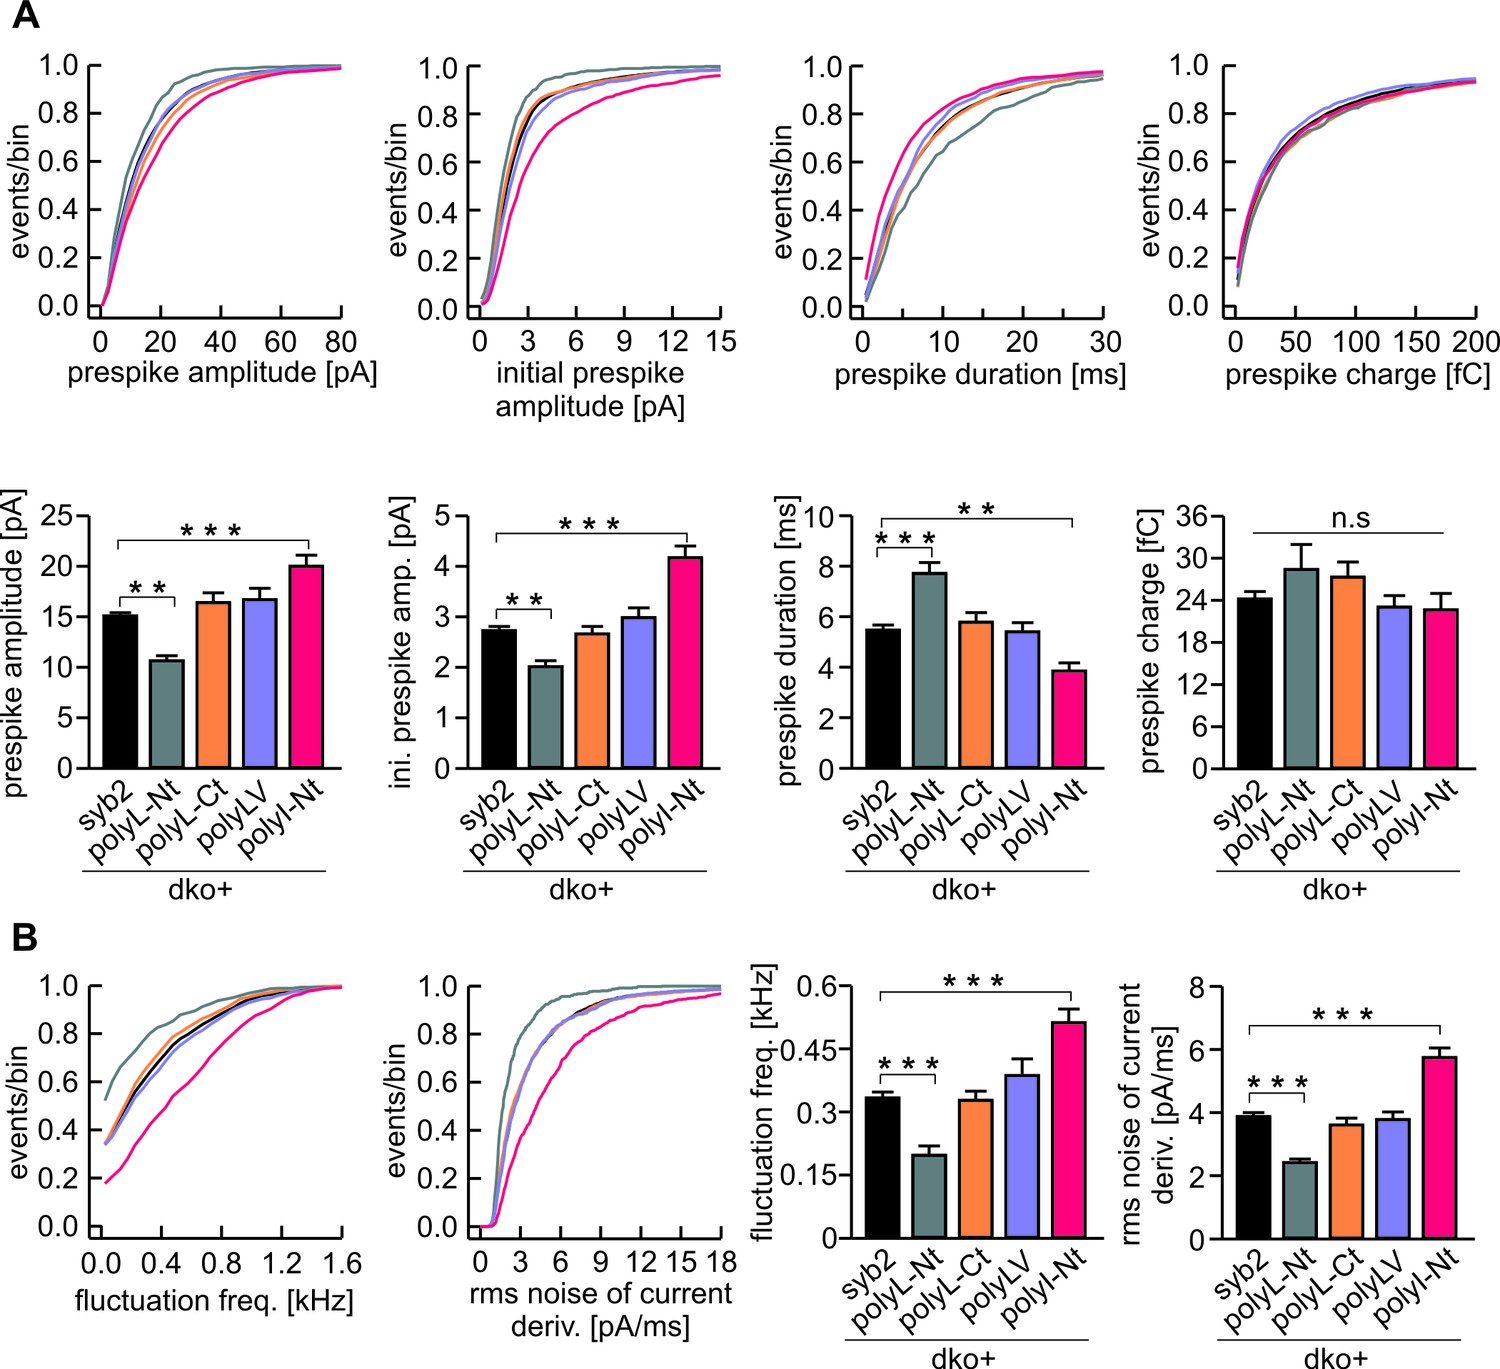
The N-terminal region of syb2 TMD controls kinetics and fluctuations of the early fusion pore.
(A) The polyL-Nt mutant decreases the amplitude and increases the duration of the prespike signal, displayed as cumulative frequency distribution (upper panel) and cell weighted averages (lower panel) for the indicated parameters. polyI-Nt mutant oppositely affects the prespike parameters, whereas the polyL-Ct and the polyLV do not affect fusion pore behavior. None of the mutants changes the prespike charge. (B) The polyL-Nt reduces and the polyI-Nt enhances fusion pore dynamics, measured as fluctuation frequency and rms noise of the current derivative during the prespike signal. Data were collected from cells/events measured for syb2 (83/6517), polyL-Nt (19/625), polyL-Ct (18/2147), polyLV (25/2538), polyI-Nt (21/1613). Data are represented as mean ± SEM. **p<0.01, ***p<0.001, one-way analysis of variance versus syb2.
Figure 6
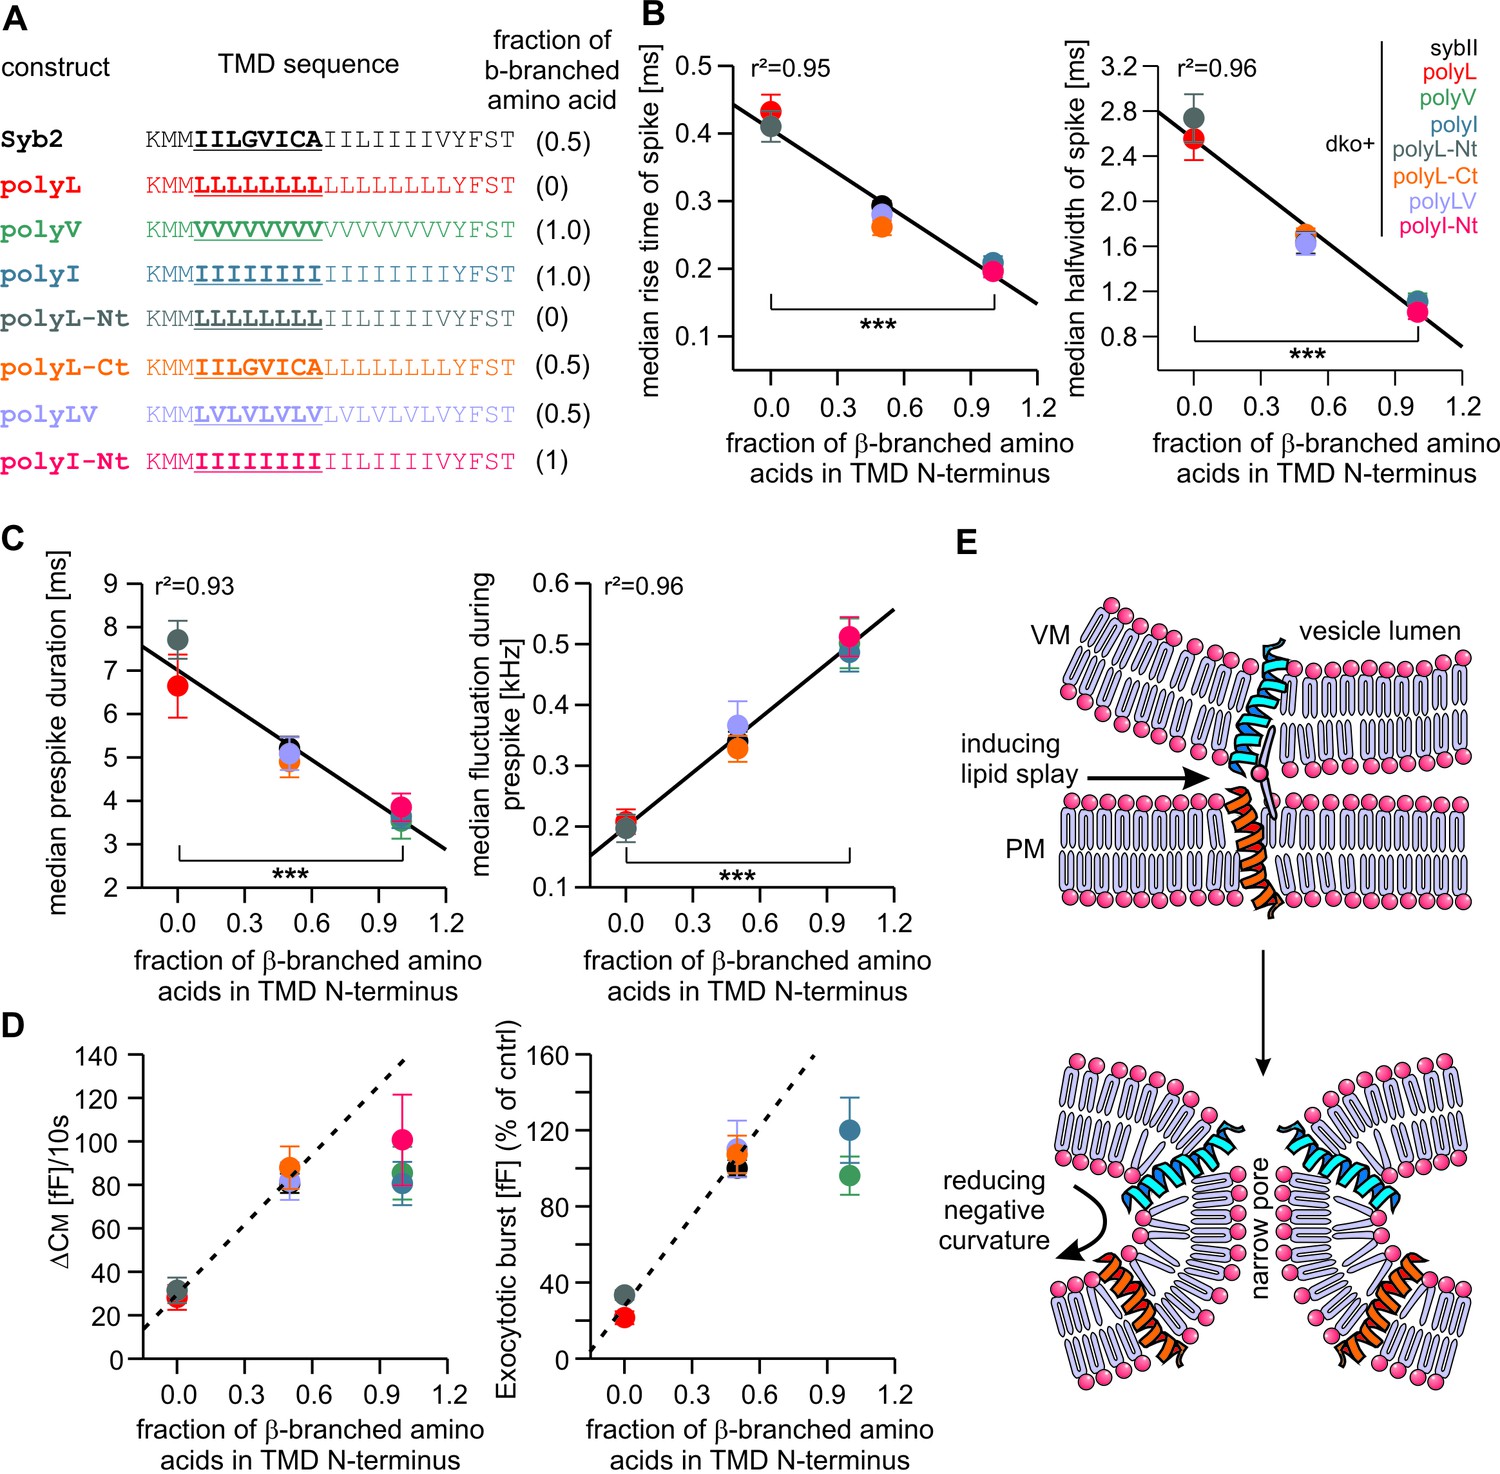
Speed of cargo release is systematically correlated with the number of β-branched amino acids in the N-terminal region of the syb2 TMD.
(A) Schemes of syb2 and corresponding mutants depicting the fraction of β-branched amino acids in the N-terminal region of the TMD (underlined). (B–C) Increasing the fraction of β-branched amino acids accelerates the rate of cargo release (spike) as well as the dynamics of the nascent fusion pore (prespike). (D) Tonic and synchronous secretion are reduced with the loss of ß-branched amino acids but cannot be further potentiated by enriching ß-branched amino acids in the TMD N-terminal region when compared with syb2. (E) Hypothetical models illustrating how conformational flexibility of the syb2 TMD (specifically of the N-terminal region) enhances lipid splay to promote intermembrane contact (PM, plasma membrane, VM, vesicle membrane) during fusion initiation and lowers negative membrane curvature (outer leaflet) to facilitate pore expansion. Data are represented as mean ± SEM. ***p<0.001, one-way analysis of variance between indicated groups.
Figure 7 with 2 supplements
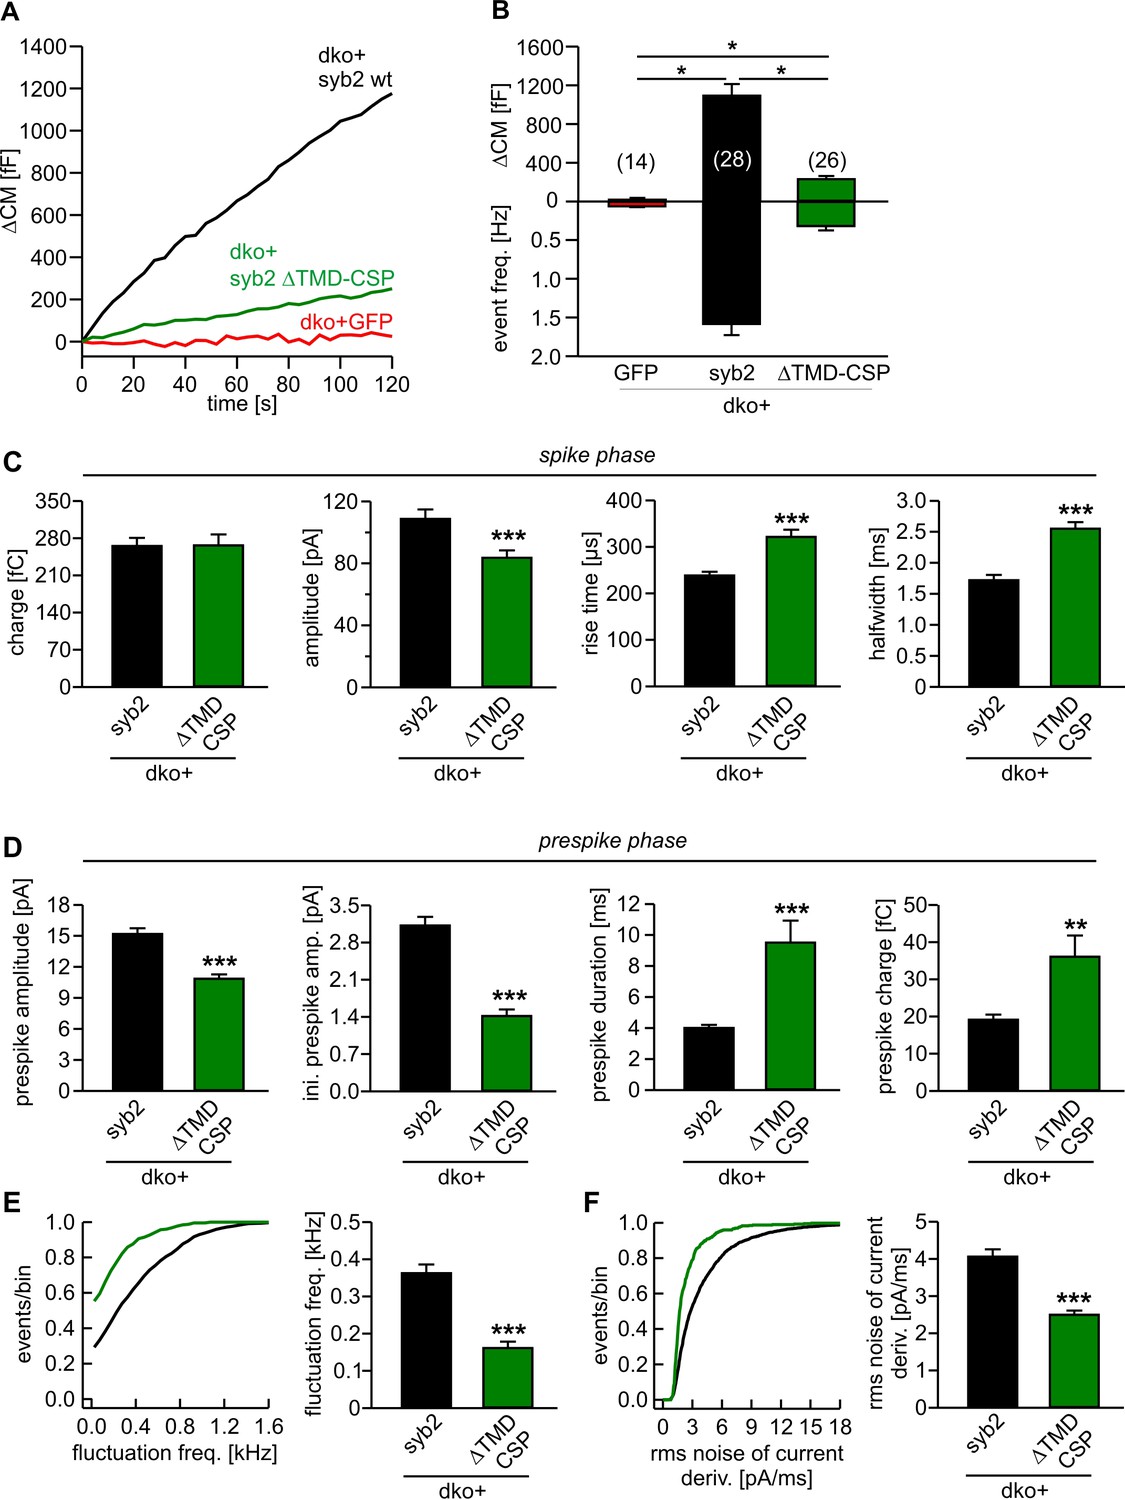
Lipid anchored syb2 failed to support normal secretion from chromaffin cells.
(A) Mean capacitance responses upon intracellular perfusion with 19 µM free Ca2+ in the indicated groups. (B) Total ∆CM as well as amperometric event frequency measured over 120 s show that the lipid-anchored syb2 (ΔTMD-CSP) restored secretion above levels of dko cells but largely failed to support exocytosis like the wildtype protein indicating the functional necessity of a proteinaceous membrane anchor for unperturbed fusion. Data are averaged from the indicated number of cells. ANOVA followed by Kruskal-Wallis post hoc test was performed. (C) Properties of the amperometric spike phase, displayed as cell weighted averages show that the ΔTMD-CSP mutant decreased the spike amplitude while increasing the spike rise time and half width. (D) Effects of the ΔTMD-CSP mutation on the indicated prespike parameters. (E–F) Prespike fluctuations and rms noise of the current derivative are significantly reduced compared to control. Data were collected from events (cells): dko+syb2 4267 (36); dko+ΔTMD-CSP 1078 (34) and are represented as mean ± SEM. ***p<0.001, Mann Whitney U test versus syb2.
Figure 7—figure supplement 1
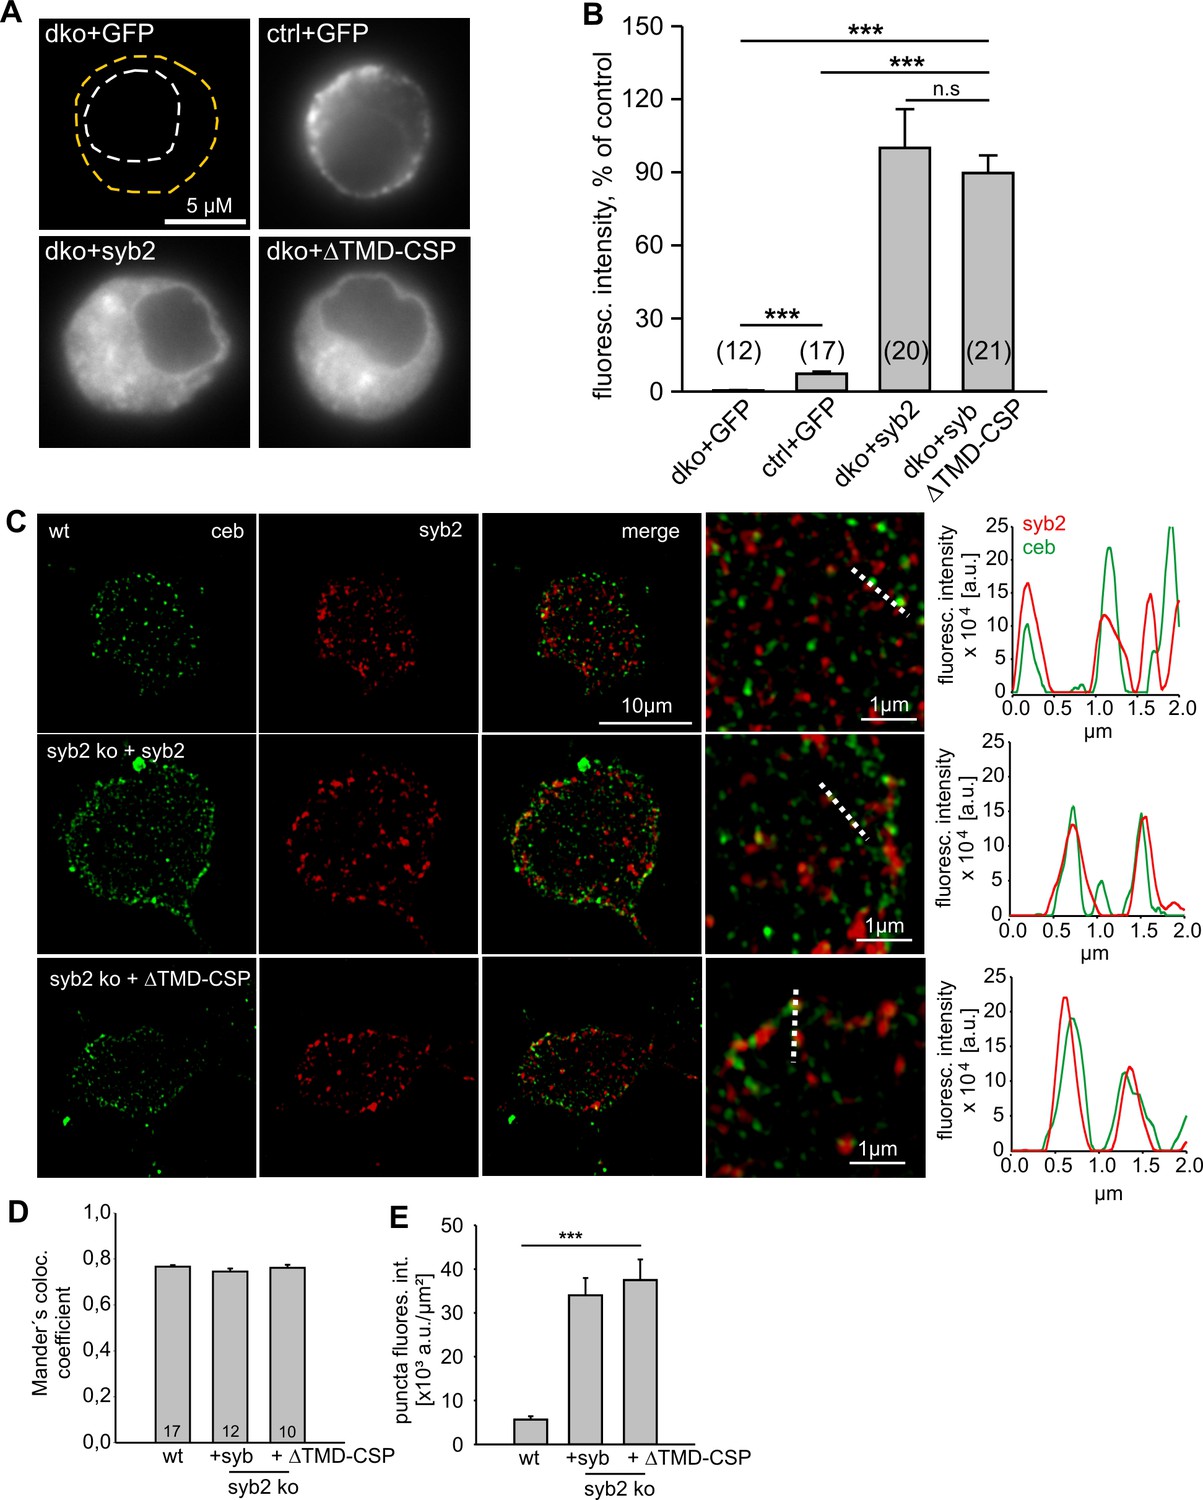
Lipid-anchored syb2 ΔTMD-CSP mutant exhibit similar expression and sorting to granules like the wildtype protein.
(A) Exemplary images of a double knock-out (dko)+gfp, cellubrevin ko (ctrl, littermate control)+gfp and dko cells overexpressing either syb2 (dko+syb2) or mutant protein (dko+ΔTMD-CSP). Immunosignals were visualized after appropriate adjustment of the camera’s exposure time (dko+gfp and cntl+gfp, 4.2 s; dko+v-SNARE, 0.31 s). (B) Mean total fluorescence intensity of dko+gfp, ctrl+gfp, dko+syb2 and dko+ΔTMD-CSP averaged from the indicated number of cells (determined 5.5 hr after transfection). Expression of syb2 or its mutant in dko cells leads to ~ten fold increase in protein level when compared with the control signal (ctrl-GFP). Data are normalized to the immunosignal of dko+syb2 cells. (C) Exemplary SIM images for ceb (green) and syb2 (red) in wildtype chromaffin cells and syb2 ko cells expressing syb2 or ΔTMD-CSP mutant. Syb2 fluorescence signals in wildtype cells were excited with five-fold higher laser power than in virus-transfected cells (x5). The merged images and their magnified inset display a clear colocalization between ceb and syb2 (or the ΔTMD-CSP mutant), as also illustrated in the corresponding line scans (magnified view, dashed lines; pixel size, 40 nm). (D) Mander’s weighted colocalization of syb2 or its TMD mutants to endogenous ceb indicates a similar colocalization coefficient (~77%) for syb2 and ΔTMD-CSP mutant. Numbers of cells analyzed are indicated in the bar. (E) The fluorescence intensity of discrete immunopositive puncta is similar for syb2 and the mutant protein and five-fold higher than the littermate control (wt) cells. For analysis, images were thresholded to values 6xSD of the background fluorescence to isolate discrete regions of interest. Data are represented as mean ± SEM. *p<0.05, ***p<0.001, one-way analysis of variance between indicated groups (B and E).
Figure 7—figure supplement 2
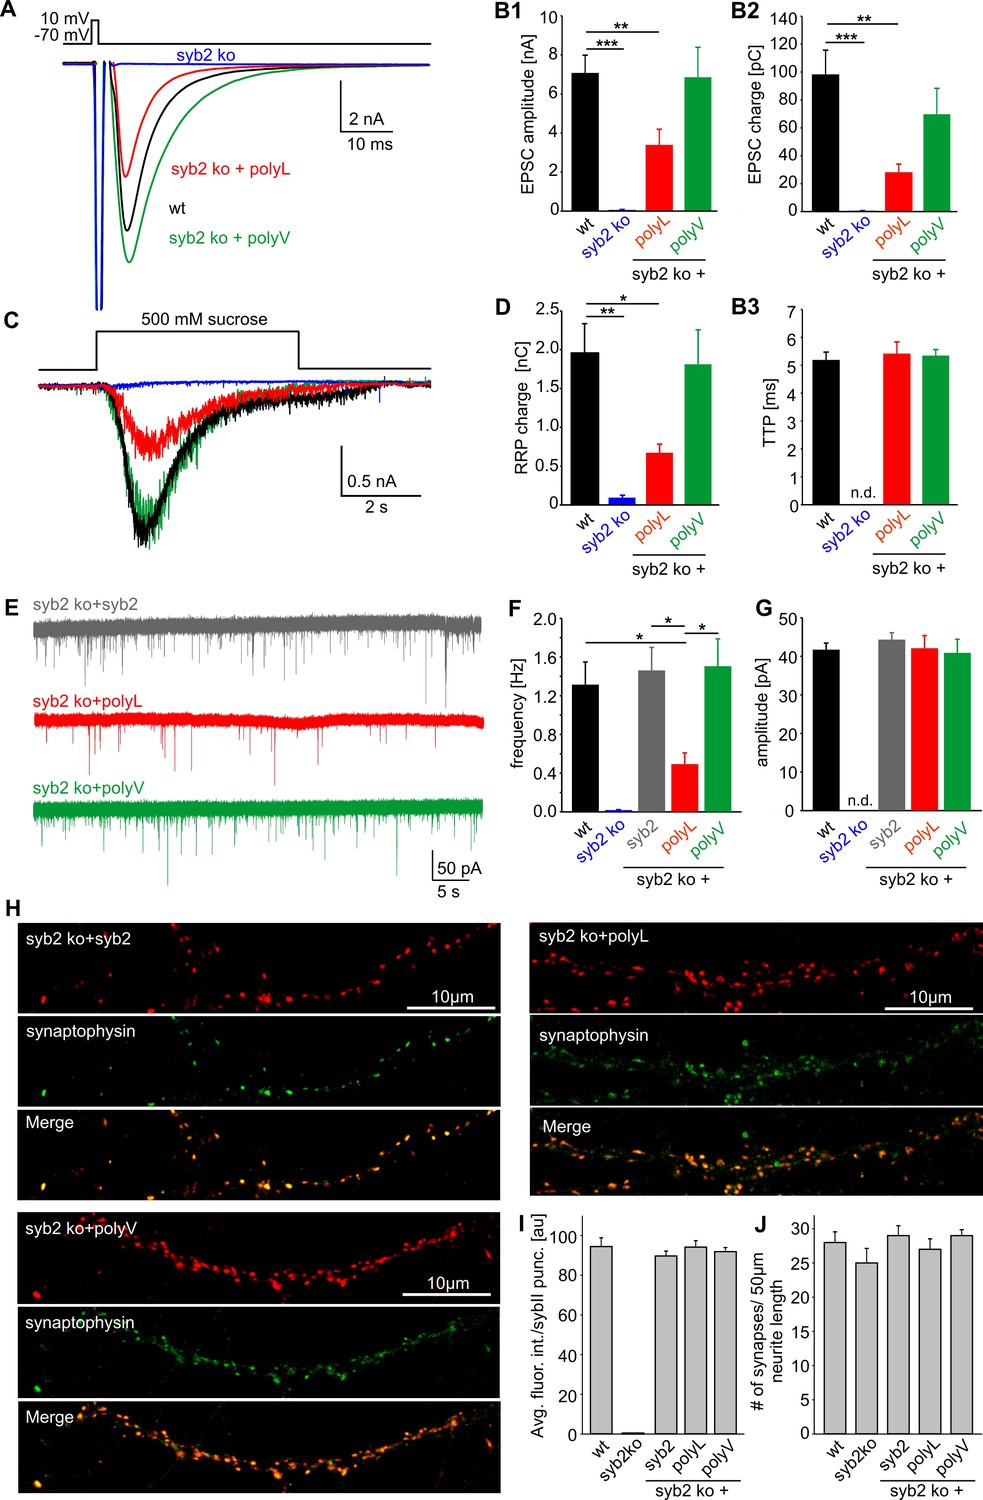
β–branched amino acids in the syb2 TMD regulate synaptic vesicle fusion.
(A) Exemplary AP evoked EPSCs of wildtype hippocampal autaptic neurons (black, n = 23) and syb2 ko neurons (blue, n = 7) or syb2 ko neurons expressing the syb2 mutant variants (polyL, red, n = 13 and polyV, green, n = 12). (B1–B3) Loss of syb2 abolishes evoked release (syb2 ko). Expression of the polyV mutant in syb2ko neurons rescues EPSC amplitude and charge, while the polyL mutant significantly reduces the evoked amplitude and charge compared to control. The time to reach the maximum EPSC amplitude (TTP) is unaffected by the mutants when compared to wt. (C) Whole cell responses from wildtype (black, n = 22), syb2 ko (blue, n = 4), syb2 ko + polyL (red, n = 9) and syb2 ko + polyV (green, n = 11) neurons evoked by application of 500 mM hypertonic sucrose solution. (D) The readily releasable pool charge (RRP, as quantified from hypertonic stimulation shown in C) is fully (polyV) or only partially (polyL) restored to levels of wt cells. (E) Exemplary recordings of mEPSCs activity from syb2 ko neurons expressing syb2, polyL or polyV mutant. (F) The polyL mutant reduces the mEPSC frequency compared to wildtype and ko+syb2 while polyV fully rescues release. (G) Amplitude of the quantal events is not changed in the TMD mutants compared to controls. Data for (E–F) are collected from the following number of cells: wildtype (38), syb2 ko (8), ko+syb2 (52), ko+polyL (23) and ko+polyV (21). ANOVA followed by Kruskal-Wallis post hoc test was performed. (H) Representative confocal images of syb2 ko neurons expressing either syb2 or its mutant variants. To illustrate the synaptic localization of the syb2 signal, neurons were co-stained for the synaptic vesicle marker protein Synaptophysin. (I) Quantification of the immunosignals for syb2 and its mutants. The average fluorescence intensity of syb2 is unchanged for the syb2 variants and reaches the levels observed for wildtype neurons. Note that the syb2 staining is absent in syb2 ko neurons (wt, n = 18; syb2 ko, n = 14; syb2 ko+syb2, n = 16; syb2 ko+polyL, n = 15; syb2ko+polyV, n = 18). (J) The synapse density (determined from the number of synaptophysin positive puncta per 50 µm neurite length) is indistinguishable in wt cells or the syb2ko neurons expressing either syb2 or the mutant variants. Data are represented as mean ± SEM. *p<0.05, **p<0.01, ***p<0.001, one-way analysis of variance versus control.
Tables
Table 1
TMD sequence alignment of exocytotic v-SNARE variants. Amino acid residues comprising the putative TMD regions of the indicated v-SNARE variants are colored red. Note the different number and percentage of ß-branched amino acids (valine or isoleucine, bold) in the N-terminal half of the TMD as quantified on the right. Vesicle diameters are taken from the following references for small synaptic vesicles (Takamori et al., 2006), chromaffin granules (Borisovska et al., 2005), cytotoxic T-cell lytic granules (Ming et al., 2015), insulin granules (Fava et al., 2012), mast cell granules (Alvarez de Toledo et al., 1993), zymogen granules (Nadelhaft, 1973) and sequences were obtained from UniProt database.
| vesicle size | vesicle type (diameter) | v-SNARE isoform (M. musculus) | % | |
|---|---|---|---|---|
| small | small synaptic vesicles (40 nm) | Synaptobrevin 1 | 93KNCK YFFT118 | / 22 |
| inter-mediate | small synaptic vesicles (40 nm) chromaffin (120 nm), lytic (250 nm) and insulin (240 nm) granules | Cellubrevin | 78KNCK WCVS103 | / 33 |
| Synaptobrevin 2 | 91KNLK YFST116 | / 44 | ||
| large | mast cell and zymogen granules (500–800 nm) | VAMP7 | 185KNIK | / 73 |
| VAMP8 | 72KNVK FATG97 | / 77 |
Download links
A two-part list of links to download the article, or parts of the article, in various formats.
Downloads (link to download the article as PDF)
Open citations (links to open the citations from this article in various online reference manager services)
Cite this article (links to download the citations from this article in formats compatible with various reference manager tools)
v-SNARE transmembrane domains function as catalysts for vesicle fusion
eLife 5:e17571.
https://doi.org/10.7554/eLife.17571


