The amyloid-beta forming tripeptide cleavage mechanism of γ-secretase
- Brigham and Women's Hospital, Harvard Medical School, United States
Figures
Figure 1
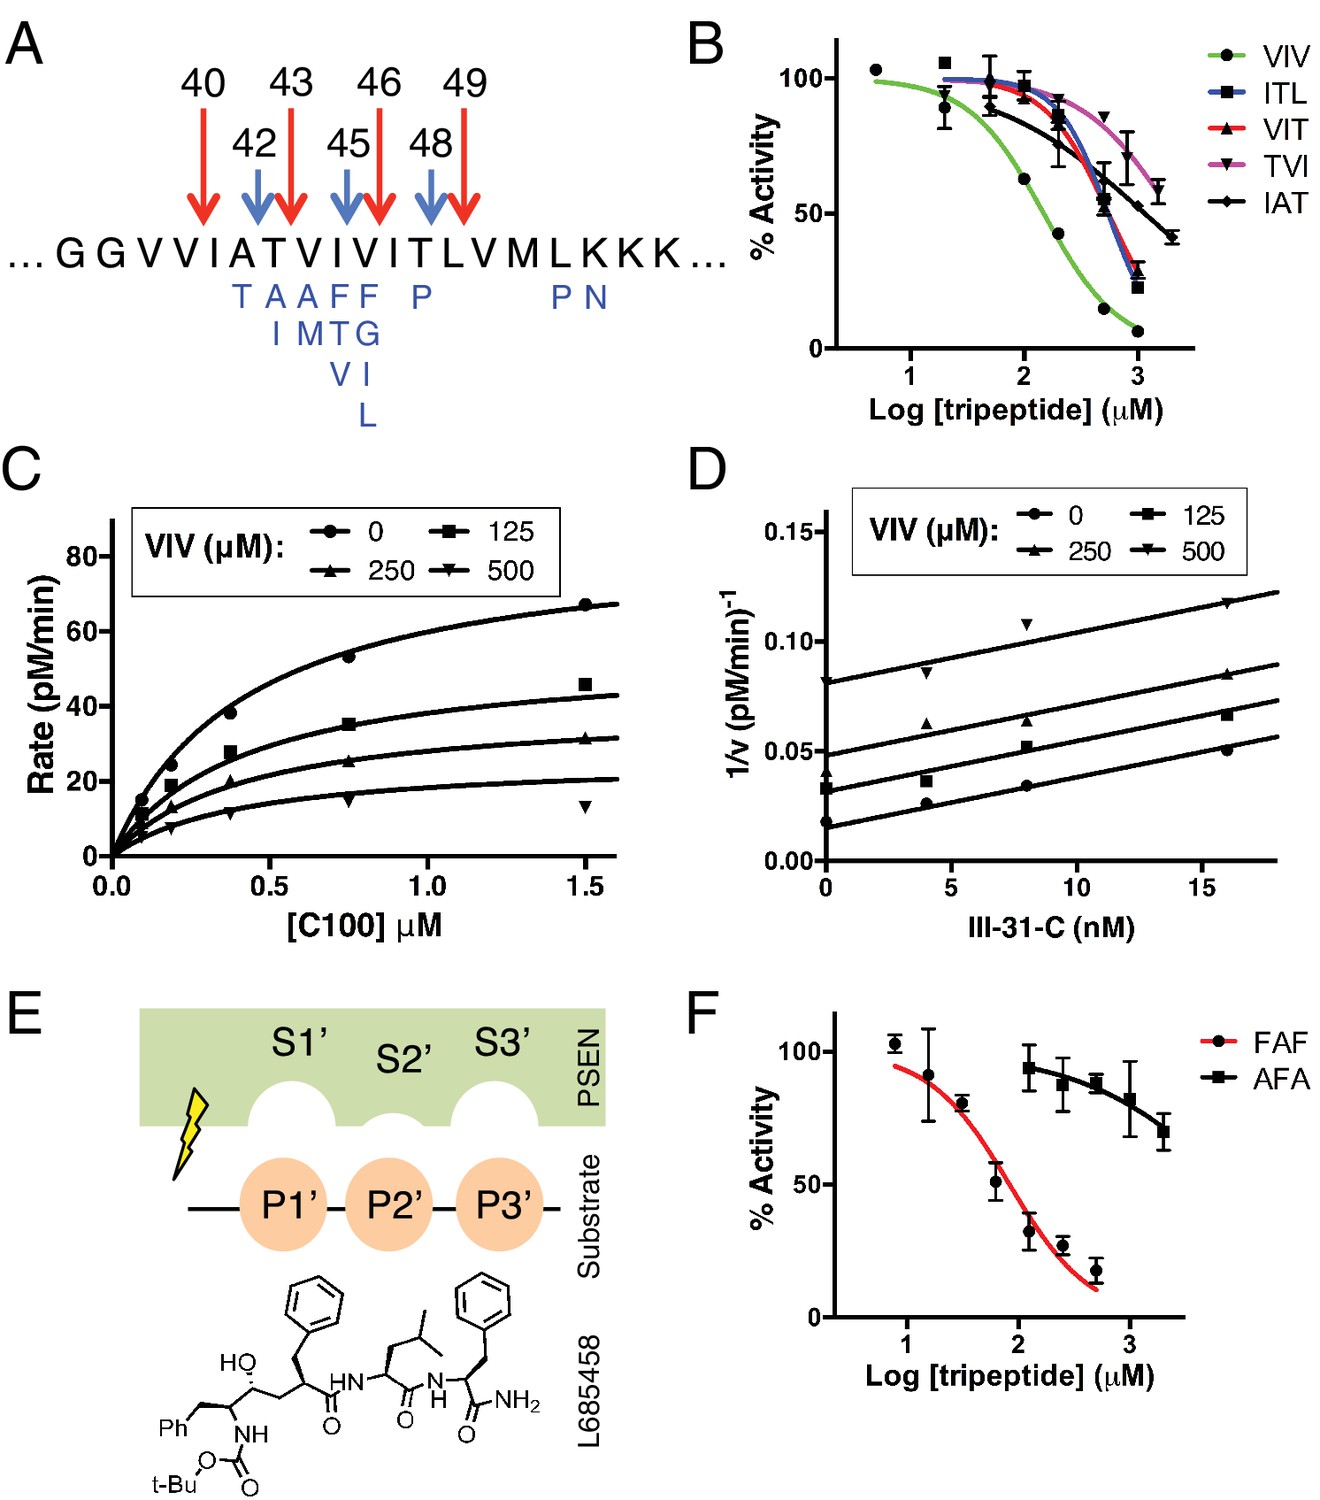
Tripeptide fragments of APP inhibit γ-secretase.
(A) Schematic diagram of the major sequential cleavage pathways of the transmembrane domain of APP (Aβ49 → Aβ46 → Aβ43 → Aβ40 in red and Aβ48 → Aβ45 → Aβ42 in blue). Mutations causing Familial Alzheimer’s disease are below the APP TMD in blue. (B) IC50 curves from the inhibition of γ-secretase activity by APP product tripeptide fragments. Mean ± SD, n = 2. (C) Noncompetitive inhibition of γ-secretase with VIV tripeptide, R2 = 0.98. (D) Yonetani-Theorell plot for the mutually exclusive binding of VIV and the noncompetitive transition-state analog inhibitor III-31-C, R2 = 0.98. (E) Cartoon representation of the three S’ pockets of presenilin (PSEN) along with three P’ amino acids of substrate and the transition-state analog L685,458. (F) IC50 curves from the inhibition of γ-secretase activity with FAF and AFA synthetic tripeptides. Mean ± SD, n = 2.
Figure 2

Selective blocking of the Aβ40 or Aβ42 pathways with aromatic amino acids placed at the P2’ position of ε cleavage.
(A) Schematic diagram of the TMD of APP with pathway blocking aromatic amino acid mutations at the P2’ position for the T48 or L49 ε cleavage. (B) In vitro Aβ42/40 ratios with Phe or Trp mutations at V50 or M51. Aβ measured using Aβ40 and Aβ42 ELISA kits from Invitrogen. Mean ± SD, n = 3, t-test **<0.01, ****<0.0001. (C) MALDI/TOF MS of the AICD fragments generated from in vitro cleavage of C100: WT (AICD 50–99, expected mass: 6905.6, observed mass: 6907.4; AICD 49–99, expected mass: 7018.8, observed mass: 7021.3). V50F (AICD 50–99, expected mass: 6953.8, observed mass: 6949.8; AICD 48–99, expected mass: 7167.9, observed mass: 7163.5). M51F (AICD 49–99, expected mass: 7034.8, observed mass: 7030.1; AICD 48–99, expected mass: 7135.8, observed mass: 7131.8). (D) Aβ42/40 ratios measured from the media of HEK cells transfected with V50 mutants. Aβ levels measured by 6E10 ELISA. Mean ± SD, n = 3, t-test **<0.01, ***<0.001, ****<0.0001. (E) Aβ42/40 ratios measured from the media of HEK cells transfected with M51 mutants. Aβ levels measured by 6E10 ELISA. Mean ± SD, n = 3, t-test ***<0.001, ****<0.0001. (F) Aβ40 and Aβ42 levels for aromatic substitutions at V50 and M51 normalized to WT. Aβ levels measured by 6E10 ELISA. Mean ± SD, n = 3, t-test *<0.05, ***<0.001, ****<0.0001. (G) Total secreted Aβ levels (see Materials and methods) from the aromatic mutations at V50 and M51.
Figure 3 with 1 supplement
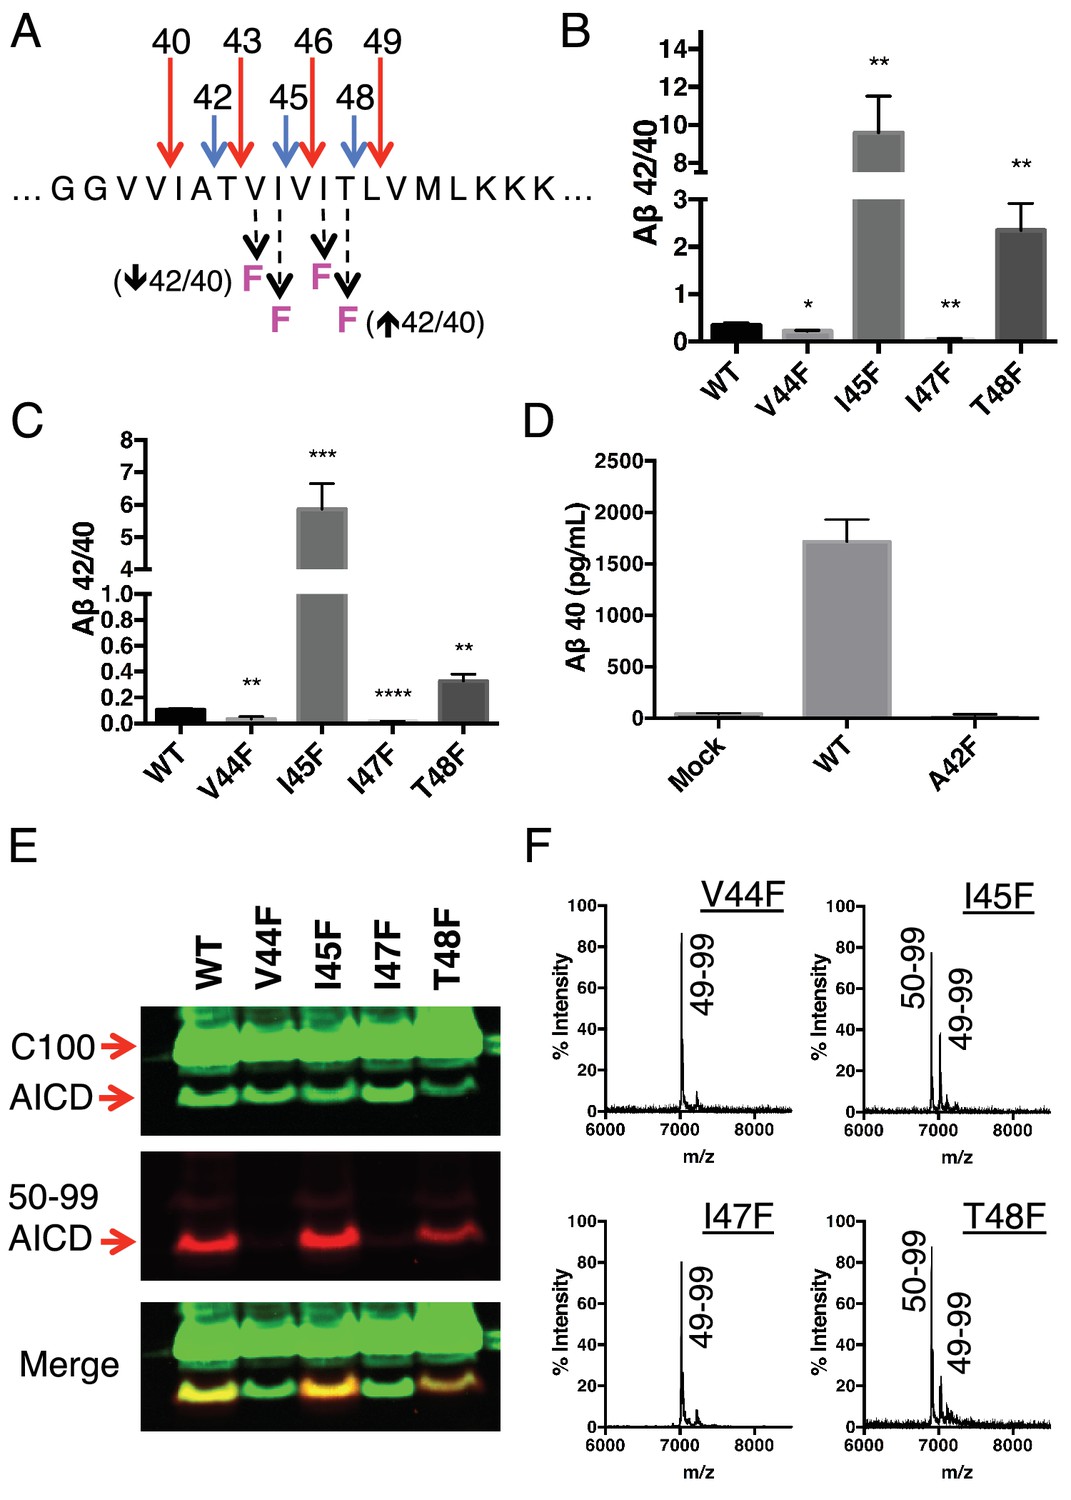
Phenylalanine mutations at P2’ positions predictively shift the Aβ42/40 ratio.
(A) Schematic diagram of Phe mutations at P2’ positions at cut sites within the TMD of APP and the expected Aβ42/40 changes compared to WT. (B) In vitro Aβ42/40 ratios from γ-secretase cleavage of recombinant C100-FLAG substrates. Aβ measured using Aβ40 and Aβ42 ELISA kits from Invitrogen. Mean ± SD, n = 3, t-test *<0.05, **<0.01. (C) Aβ42/40 ratios from Aβ secreted from HEK cells. Aβ levels measured by 6E10 ELISA. Mean ± SD, n = 3, t-test **<0.01, ***<0.001, ****<0.0001. (D) Aβ40 levels measured from the conditioned media of HEK cells transfected with WT or A42F APP. Aβ levels measured by 6E10 ELISA. Mean ± SD, n = 3. (E) Western blot analysis of the AICD fragments generated from V44F, I45F, I47F and T48F in vitro. Total AICD was measured with anti-FLAG M2 antibody (green). Aβ49 → Aβ40 pathway preference was measured with an antibody specifically recognizing the N-terminus of AICD 50–99 fragment (red). (F) MALDI/TOF MS confirmation of the AICD fragments measured in (E): V44F (AICD 49–99, expected mass: 7018.8, observed mass: 7020.8), V45F (AICD 50–99, expected mass: 6905.6, observed mass: 6906.2; AICD 49–99, expected mass: 7018.8, observed mass 7020.1), I47F (AICD 49–99, expected mass: 7018.8, observed mass: 7019.5), T48F (AICD 50–99, expected mass: 6905.6, observed mass: 6907.4; AICD 49–99, expected mass: 7018.8, observed mass: 7019.5).
Figure 3—figure supplement 1
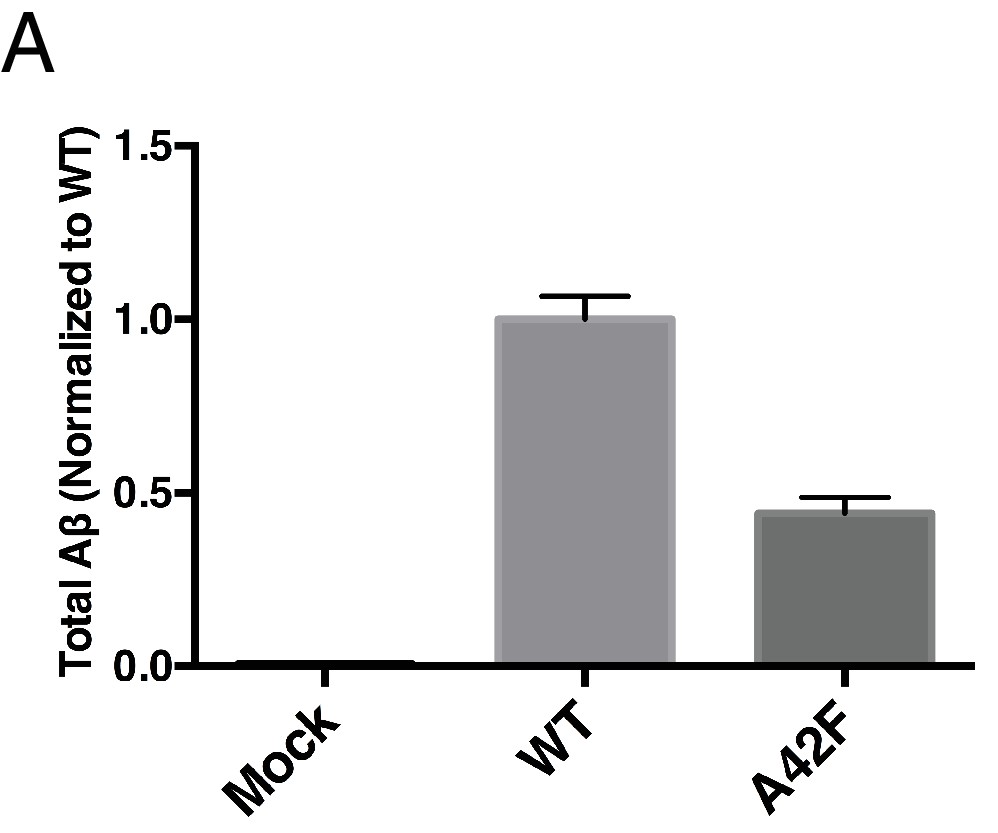
Total Aβ from the A42F mutant.
(A) Total secreted Aβ was measured by ELISA from transiently transfected HEK cells with full length WT and A42F APP. Mean ± SD, n = 3.
Figure 4
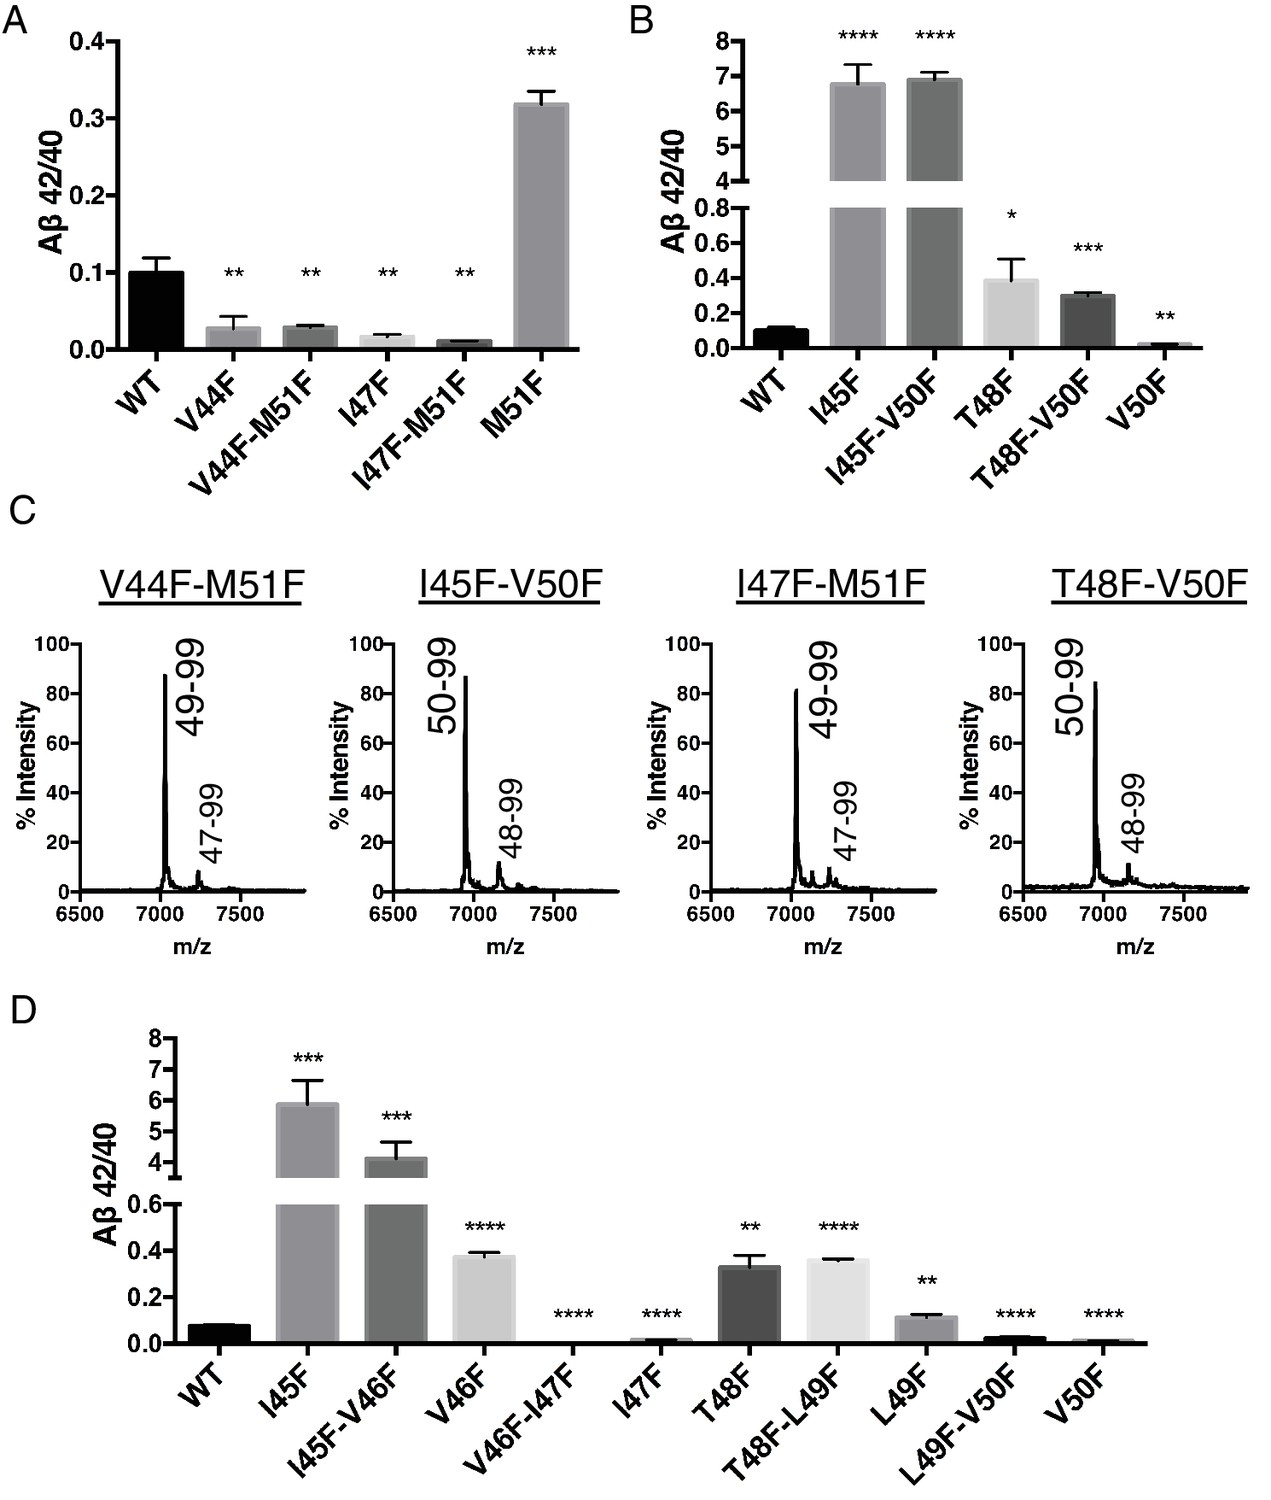
Phenylalanine mutations in the P2’ position of the last read tripeptide segment dictates final pathway preference.
(A) Aβ42/40 ratios from HEK cells of V44F-M51F and I47F-M51F double mutants behave like single Phe mutants V44F and I47F, respectively. Aβ levels measured by 4G8 ELISA. Mean ± SD, n = 3, t-test **<0.01, ***<0.001. (B) Aβ42/40 ratios from HEK cells of I45F-V50F and T48F-V50F double mutants behave like single Phe mutants I45F and T48F, respectively. Aβ levels measured by 4G8 ELISA. Mean ± SD, n = 3, t-test *<0.05, **<0.01, ***<0.001, ****<0.0001. (C) MALDI/TOF MS conformation of the elimination of AICD 49–99 and AICD 50–99 for the V50F and M51F containing double Phe mutants, respectively. V44F-M51F (AICD 49–99, expected mass: 7034.8, observed mass: 7030.7; AICD 47–99 expected mass: 7249.0, observed mass: 7253.7), I45F-V50F (AICD 50–99, expected mass: 6953.8, observed mass: 6950.1; AICD 48–99, expected mass: 7167.9, observed mass: 7164.6), I47F-M51F (AICD 49–99, expected mass: 7034.8, observed mass: 7032.2; AICD 47–99, expected mass: 7283.0, observed mass: 7280.1), T48F-V50F (AICD 50–99, expected mass: 6953.8, observed mass: 6949.4; AICD 48–99, expected mass: 7214.0, observed mass: 7209.4). (D) Aβ42/40 ratios from HEK cells transfected with double Phe mutations in tandem. Aβ levels measured by 6E10 ELISA. Mean ± SD, n = 3, t-test **<0.01, ***<0.001, ****<0.0001.
Figure 5
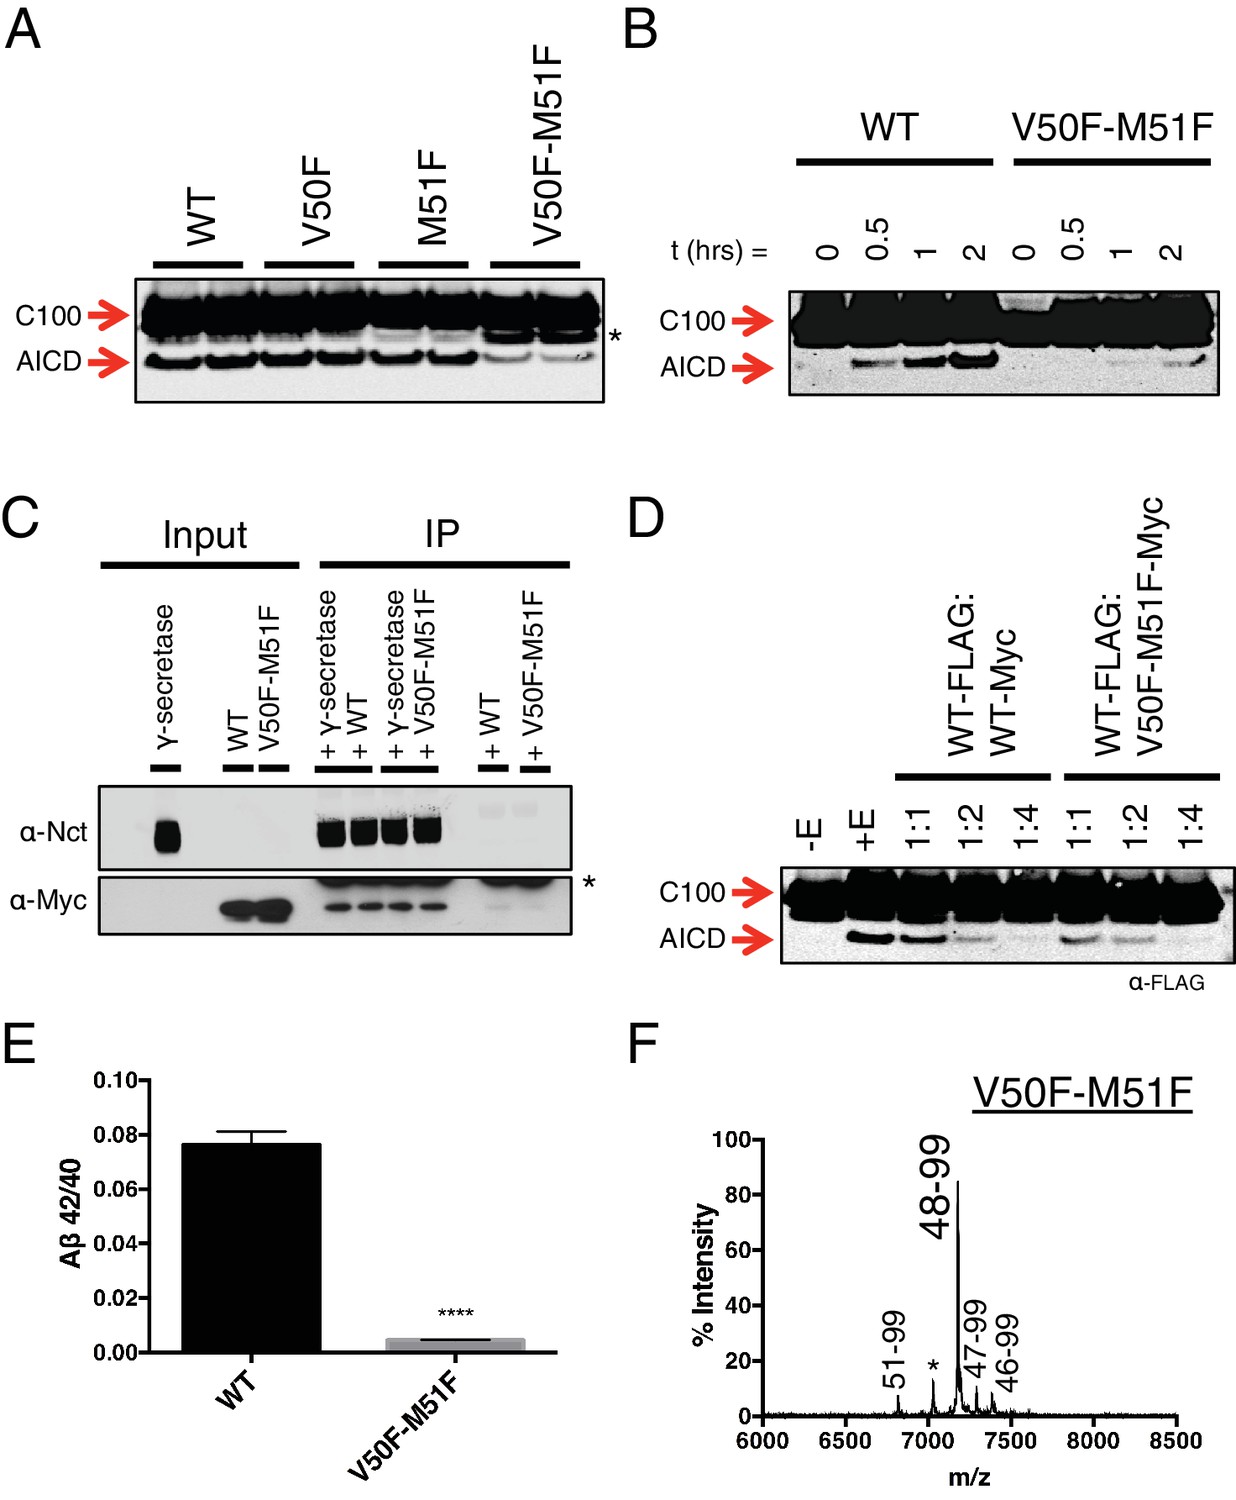
Phenylalanine blocking mutations at both ε cleavage sites reduces APP cleavage but not binding to γ-secretase.
(A) Western blot of γ-secretase cleavage of WT, V50F, M51F and V50F-M51F C100-FLAG. Duplicates from each substrate represent separate independent data points. * denotes a degradation product which co-purified with the substrate. (B) Cleavage of WT and V50F-M51F C100-FLAG over time. (C) Co-immunoprecipitation of Myc-tagged WT or V50F-M51F C100 substrate. Duplicates are from separate pull-down experiments. * antibody light chain. (D) Competitive cleavage of WT C100-FLAG by WT C100-Myc or V50F-M51F C100-Myc. (E) Aβ42/40 ratio of the V50F-M51F double mutant. Mean ± SD, n = 3, t-test, ****<0.0001. (F) MALDI/TOF MS of the AICD fragment from the V50F-M51F mutant: (AICD 51–99, expected mass: 6822.5, observed mass: 6817.1; * unknown peak, observed mass: 7030.4; AICD 48–99, expected mass: 7183.9, observed mass: 7179.2; AICD 47–99, expected mass: 7297.1, observed mass: 7292.5, AICD 46–99, expected mass: 7396.2, observed mass: 7396.1).
Figure 6 with 1 supplement
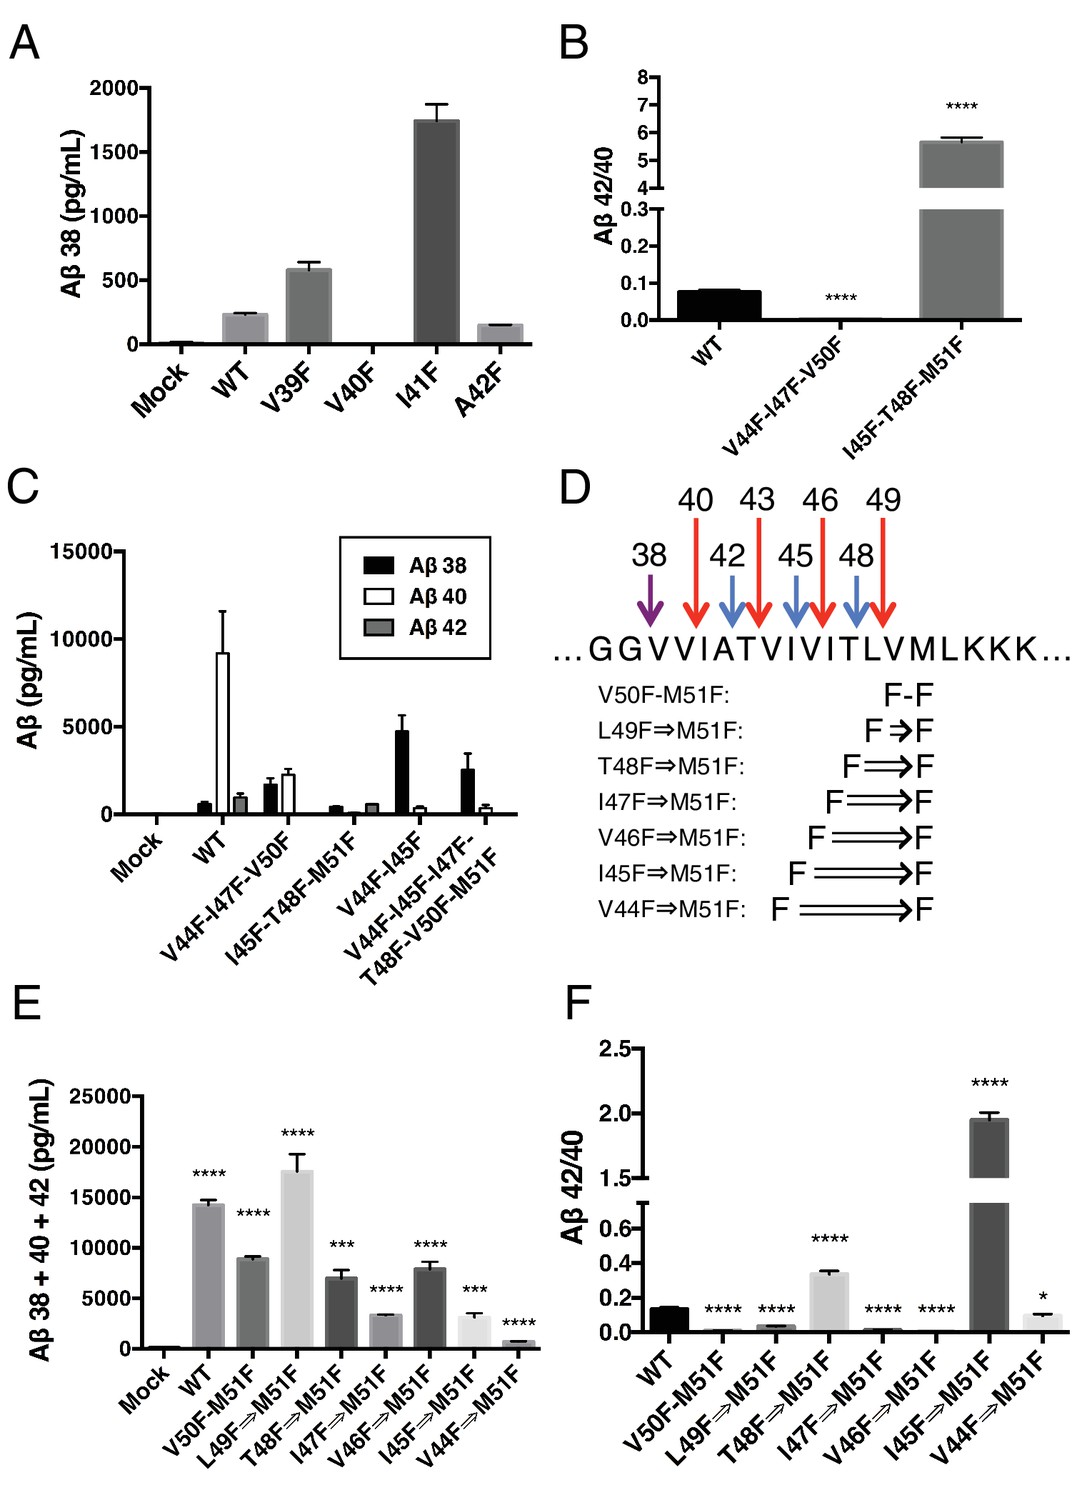
γ-Secretase preferentially cleaves APP near the helix-destabilizing Gly-Gly motif.
(A) Aβ38 levels from HEK cells transiently transfected with V39F, V40F, I41F or A42F APP. Aβ levels measured by 4G8 ELISA. Mean ± SD, n = 3. (B) Aβ42/40 ratios from V44F-I47F-V50F and I45F-T48F-M51F triple mutants from transiently transfected HEK cells. Aβ levels measured by 4G8 ELISA. Mean ± SD, n = 3, t-test, ****<0.0001. (C) Aβ38, Aβ40 and Aβ42 levels from HEK cells transfected with V44F-I47F-V50F and I45F-T48F-M51F triple mutants, the V44F-I45F double mutant and the hexa-mutant V44F-I45F-I47F-T48F-V50F-M51F. Aβ levels measured by 4G8 ELISA. Mean ± SD, n = 3. (D) Schematic diagram of sequential Phe mutants in the TMD of APP. (E) Aβ38 + 40 + 42 secreted from HEK cells transiently transfected with the mutants from (D). Aβ levels measured by 4G8 ELISA. Mean ± SD, n = 3, t-test ***<0.001, ****<0.0001. (F) Aβ42/40 ratios from (E). Aβ levels measured by 4G8 ELISA. Mean ± SD, n = 3, t-test *<0.05, ****<0.0001.
Figure 6—figure supplement 1
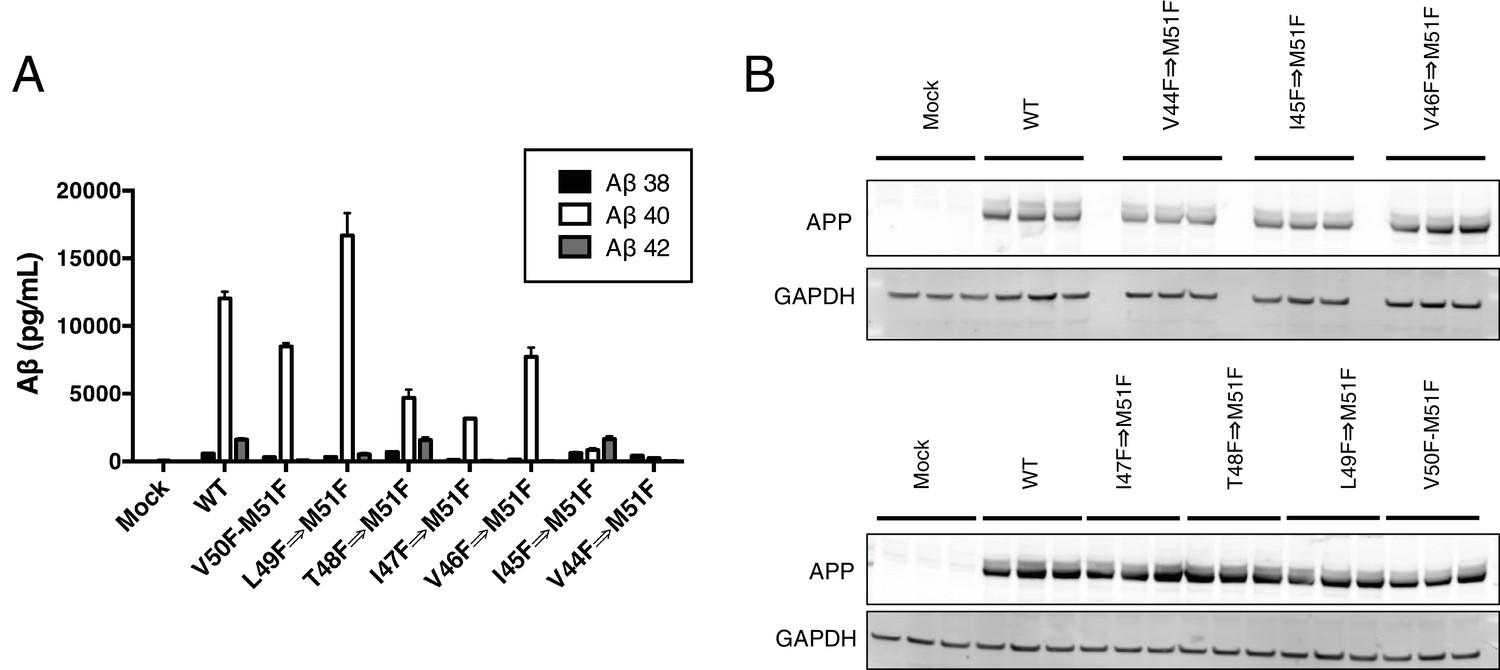
HEK cell expression and Aβ production from consecutive phenylalanine APP mutants.
(A) Aβ38, Aβ40 and Aβ42 levels secreted from HEK cells after transient transfection with APP mutants containing stretches of consecutive phenylalanines (see Figure 6D). Aβ levels measured by 4G8 ELISA. Mean ± SD, n = 3. (B) Expression levels of consecutive phenylalanine APP mutants from Figure 6D.
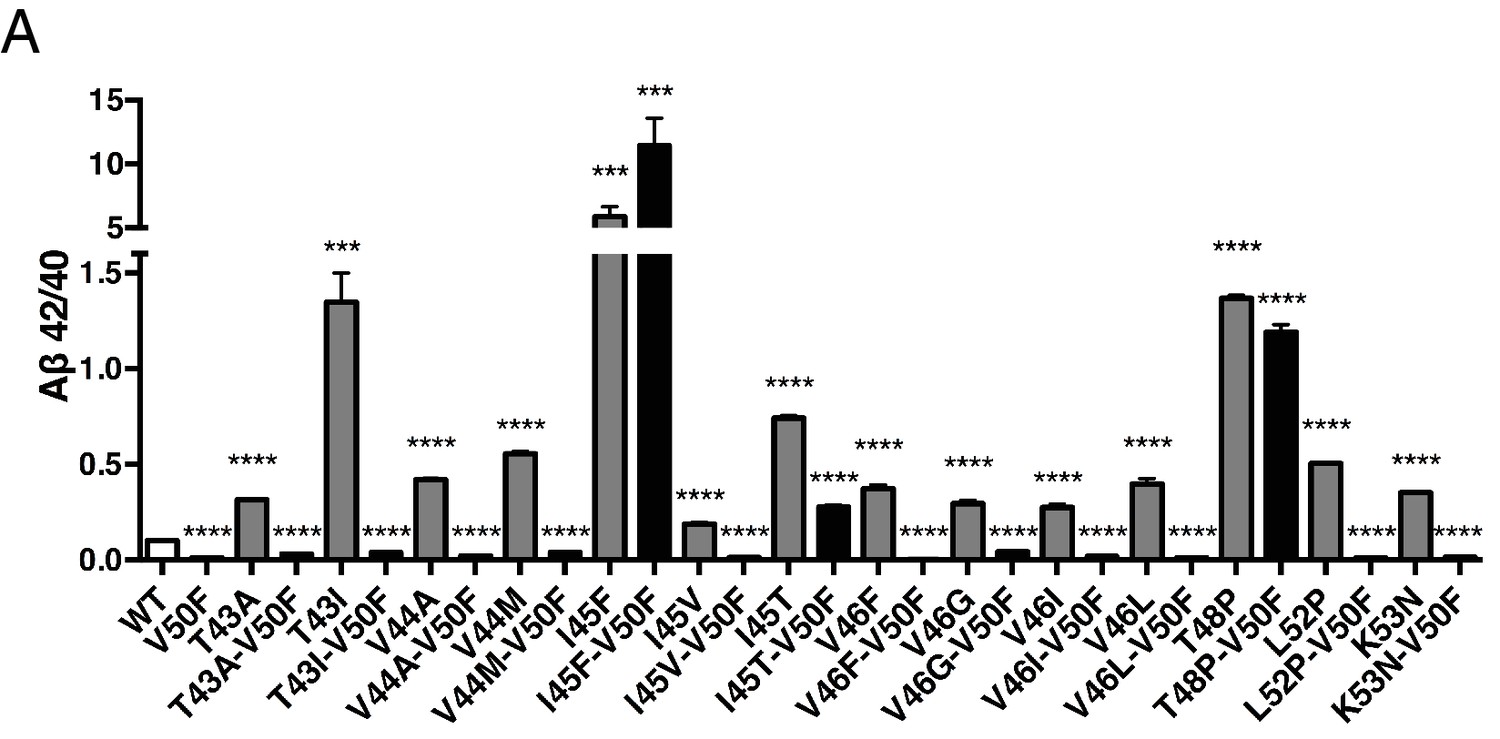
Figure 7 with 3 supplements

The tripeptide cleavage mechanism of γ-secretase and the effect of APP transmembrane domain FAD mutations.
(A) The three mechanisms by which FAD mutations within the TMD of APP increase the Aβ42/40 ratio. 1) Mutations shift initial ε cleavage towards the Aβ42 pathway. 2) Mutations reduce cleavage of the third cleavage event, producing more Aβ42 over the more processed Ab38. 3) Cleavage specific preferences cause switching from the Aβ40 to the Ab42 pathway, as exemplified by the I45F FAD mutant. (B) The Aβ42/40 ratio of each FAD mutation with and without an additional V50F mutation to control the ε cleavage site. The majority of mutations are rescued by the V50F substitution suggesting that these FAD mutations increase the Aβ42/40 ratio by influencing ε cleavage and/or affecting carboxy-trimming. I45F, I45T and T48P retain significantly elevated ratios, indicating these mutants dissociate initial ε and final γ cleavages. Aβ levels measured by 4G8 ELISA. Mean ± SD, n = 3, t-test ***<0.001, ****<0.0001.(C) The tripeptide cleavage mechanism of γ-secretase. After initial substrate binding, we speculate that the helical TMD of substrate unwinds into the active site of presenilin (PSEN) where it is stabilized by the three S’ pockets in the catalytic pocket prior to cleavage. Successive carboxy tripeptide trimming occurs until the eventual release of Aβ peptide. (D) γ-secretase cleavage of the transmembrane domain of Notch from Okochi et al, 2002.
Figure 7—figure supplement 1
APP FAD mutant panel measured by 6E10 ELISA.
(A) The samples from Figure 7B were measured by ELISA with the 6E10 detection antibody, showing similar results to those of the 4G8 ELISA. Mean ± SD, n = 3.
Figure 7—figure supplement 2
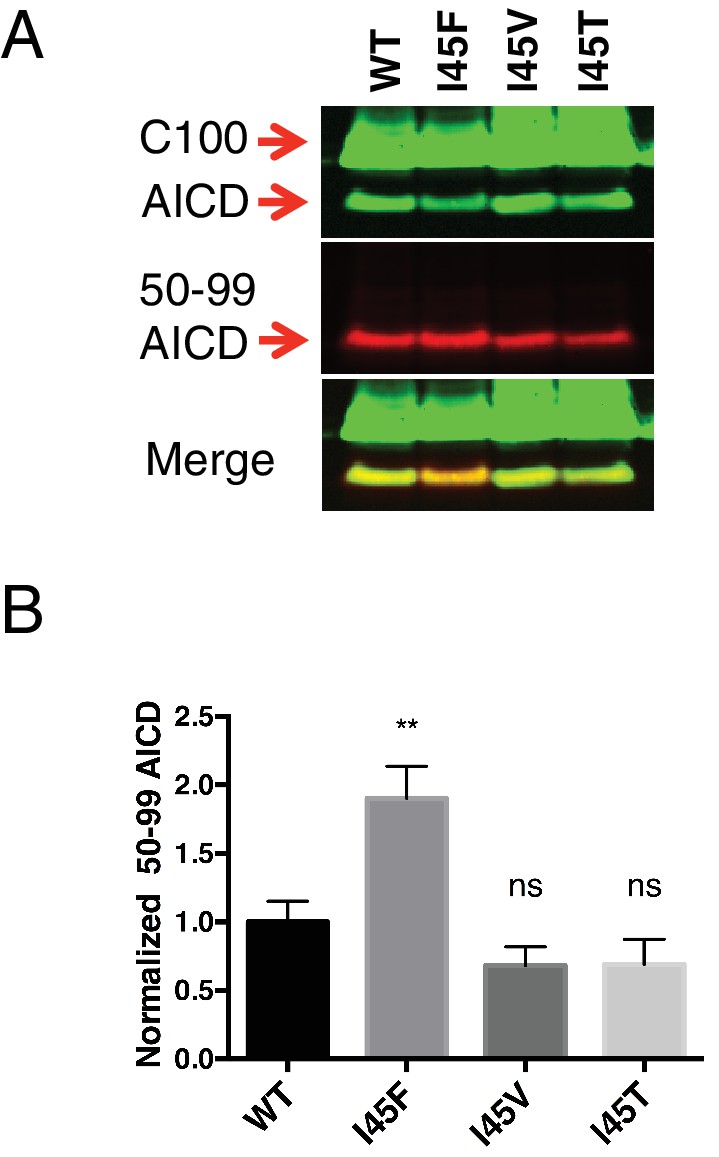
AICD fragments for the three I45 FAD mutants determined by western blot using the AICD 50–99 specific antibody.
(A) Western blot of the AICD 50–99 fragment for I45F, I45V and I45T FAD mutations. (B) Quantification of western blot bands from (A). Mean ± SD, n = 3, t-test **<0.01.
Figure 7—figure supplement 3
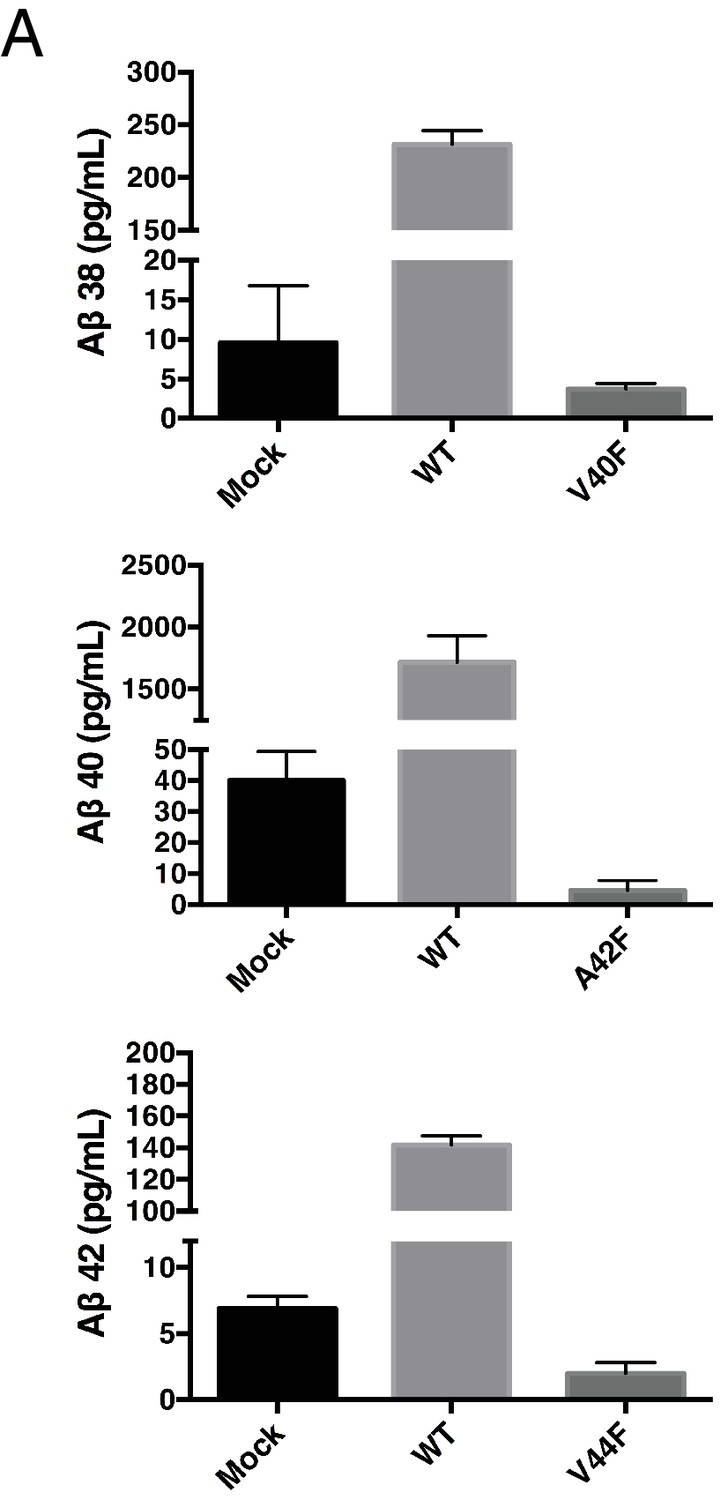
Secreted Aβ levels from V40F, A42F and V44F.
(A) Aβ38, Aβ40 and Aβ42 levels measured from V40F, A42F and V44F transfected HEK cells respectively, as well as mock transfected and WT. Aβ levels measured by 6E10 ELISA. Mean ± SD, n = 3.
Download links
A two-part list of links to download the article, or parts of the article, in various formats.
Downloads (link to download the article as PDF)
Open citations (links to open the citations from this article in various online reference manager services)
Cite this article (links to download the citations from this article in formats compatible with various reference manager tools)
The amyloid-beta forming tripeptide cleavage mechanism of γ-secretase
eLife 5:e17578.
https://doi.org/10.7554/eLife.17578


