The proposed channel-enzyme transient receptor potential melastatin 2 does not possess ADP ribose hydrolase activity
- Semmelweis University, Hungary
Figures
Figure 1
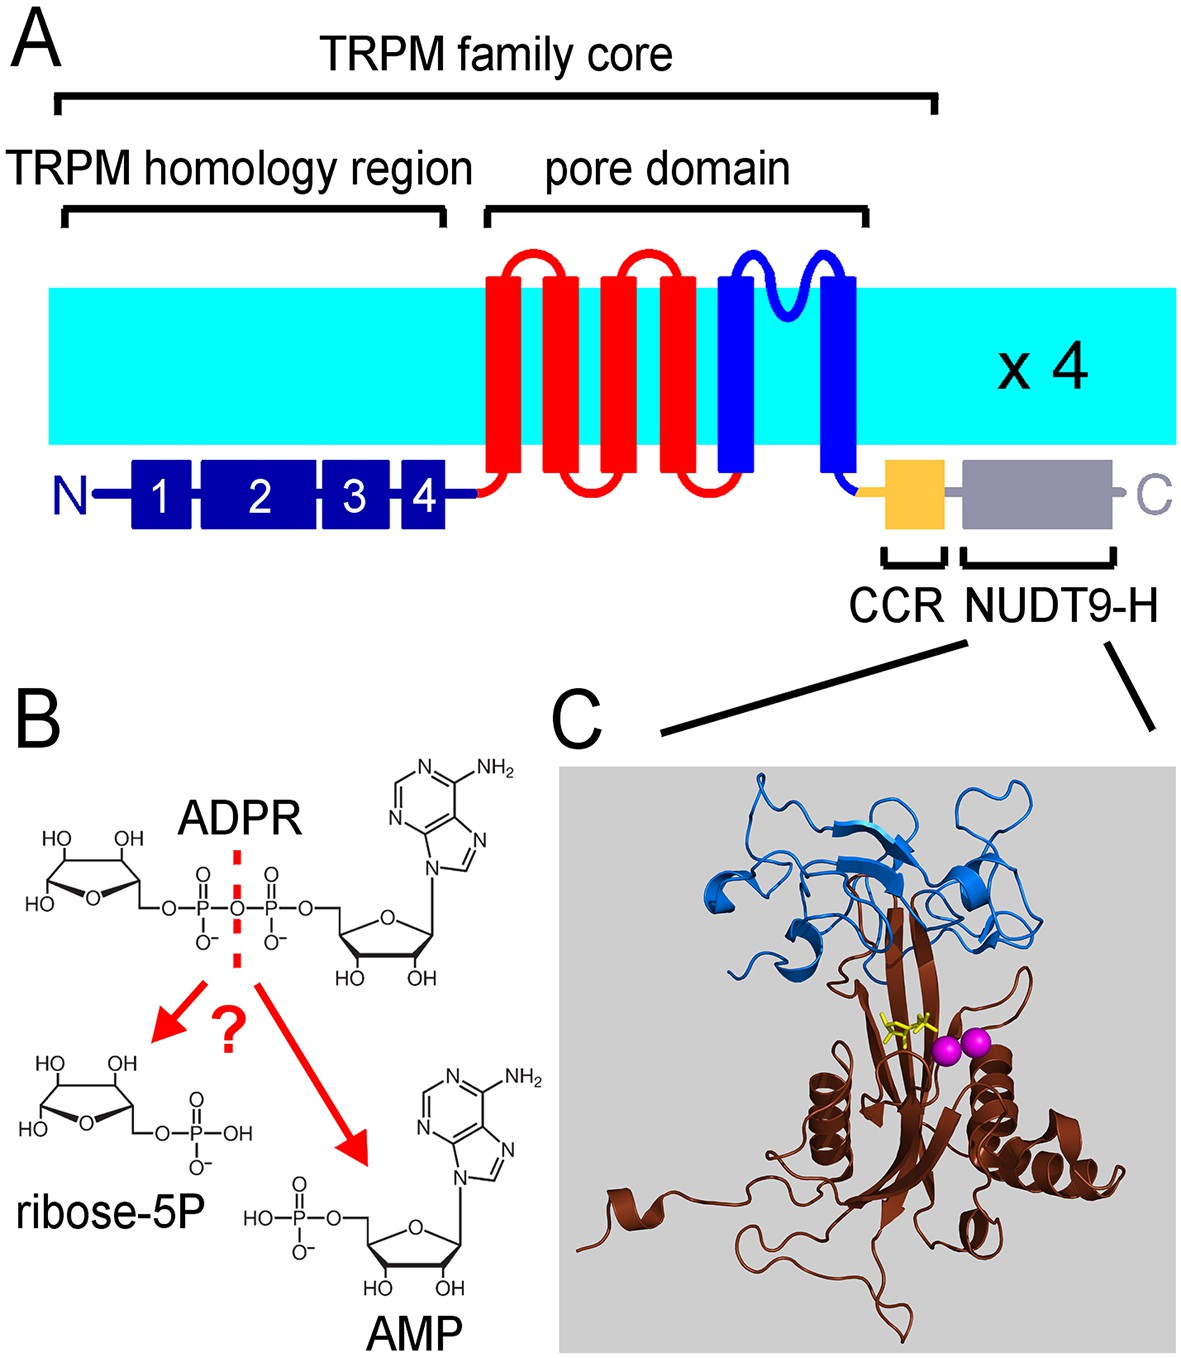
The ligand-binding NUDT9H domain in the context of TRPM2.
(A) Topology map of a TRPM2 monomer, showing the N-terminal TRPM homology region (dark blue), the six transmembrane helices which form the pore domain (red and blue), and a C-terminal short coiled-coil region (CCR, yellow) followed by the NUDT9H domain (gray) which is homologous to the soluble mitochondrial ADPRase NUDT9. (B) Hydrolysis of ADPR to AMP and R5P: reaction catalyzed by mitochondrial NUDT9 and reportedly also by the TRPM2 NUDT9H domain. (C) Crystal structure of mitochondrial NUDT9 (PDB ID: 1QVJ) illustrating Cap (blue) and Core (brown) subdomains of the protein, with the hydrolysis product R5P (yellow) and two Mg2+ ions (magenta) bound.
Figure 2
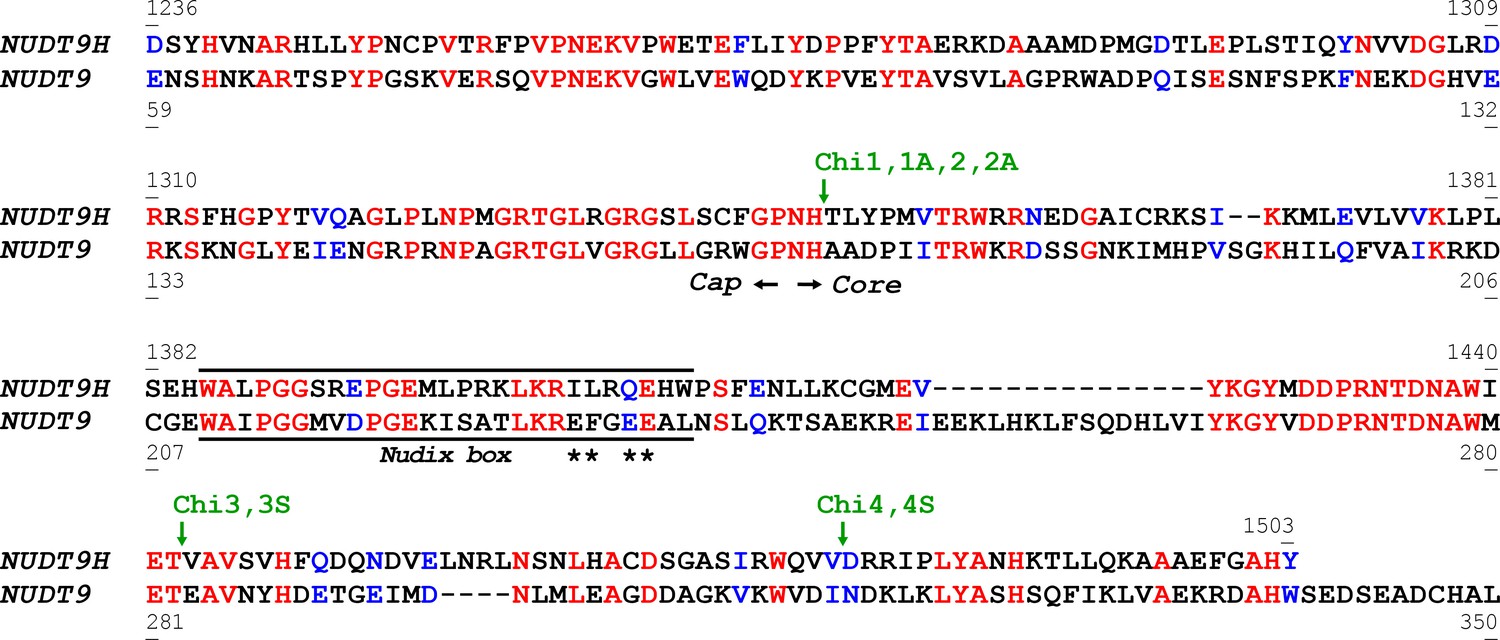
Alignment of NUDT9H and NUDT9 sequences.
Aligned (Corpet, 1988) sequences of NUDT9H and NUDT9, highlighting identical (red) and similar (blue) residues. The approximate border between Cap and Core subdomains of the proteins is indicated by two black arrows. Black line identifies the Nudix box, asterisks denote residues critical for the catalytic activity of NUDT9. Green arrows and labels indicate transition points for sequence swapping in each chimera (see also Figure 3).
Figure 3 with 1 supplement
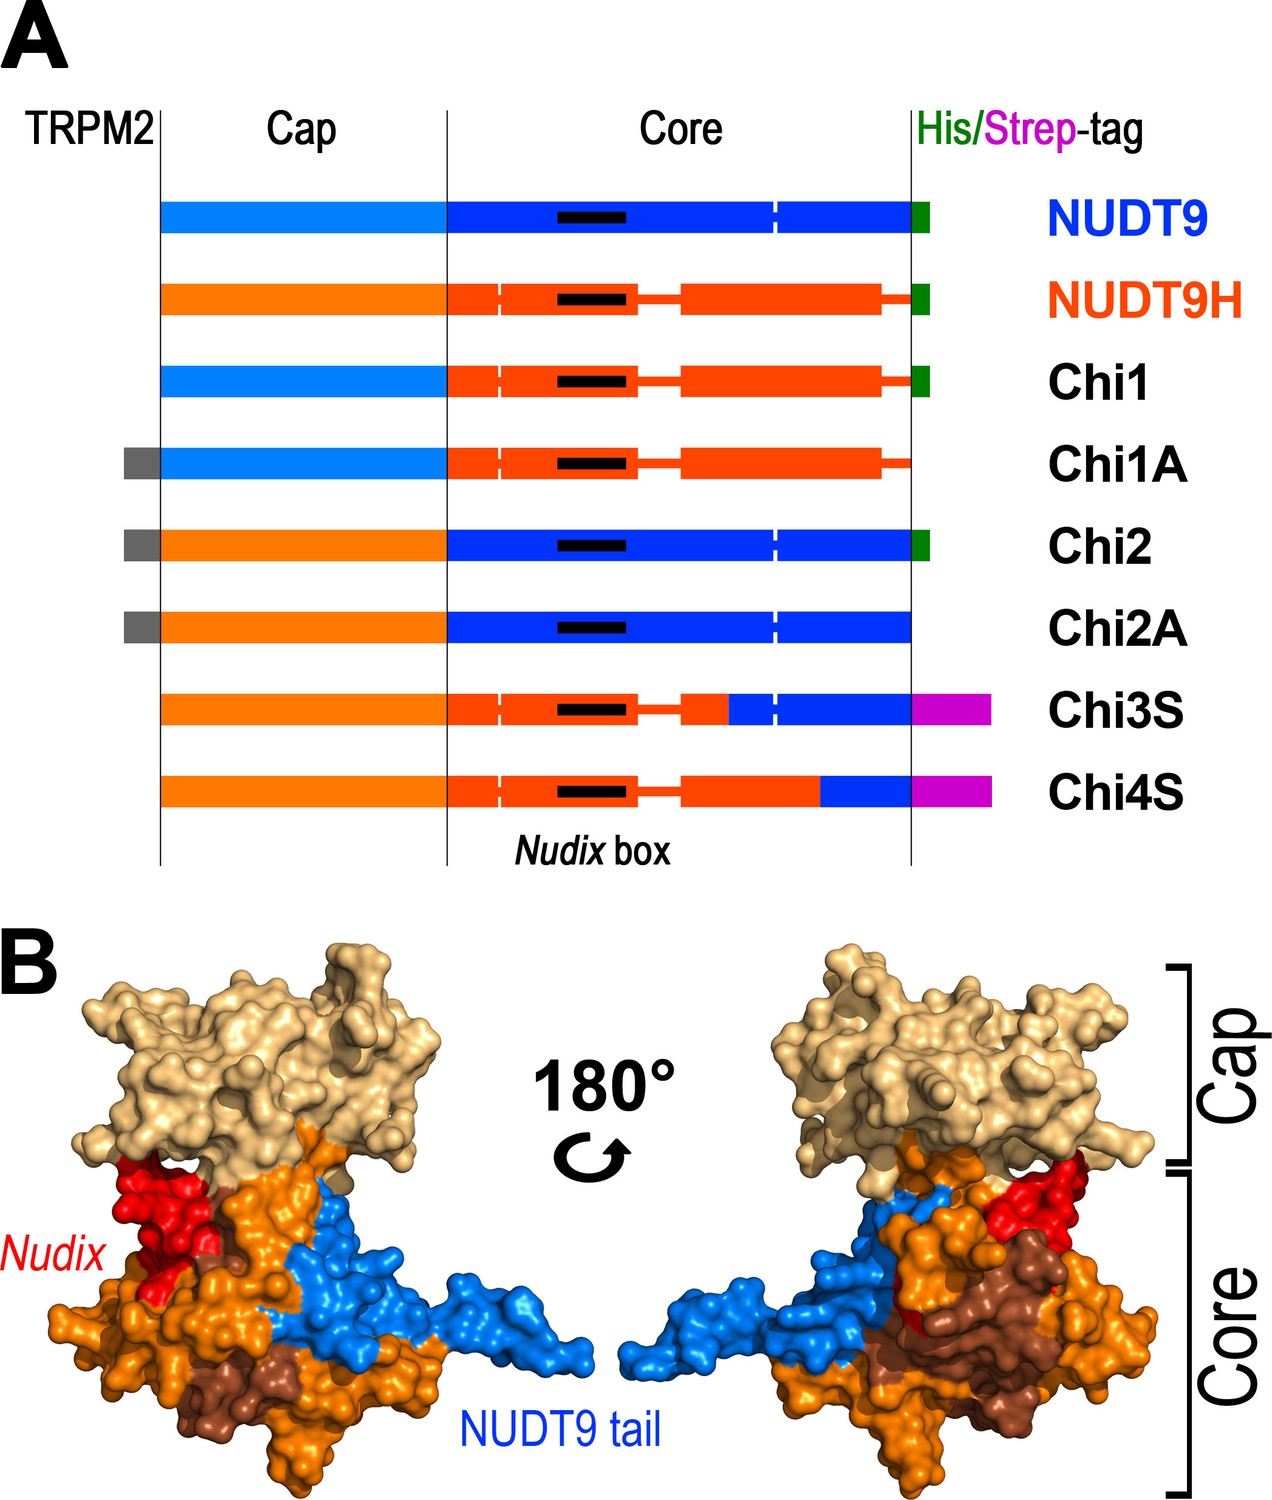
Representation of the various recombinant proteins used in this study.
(A) Aligned block diagrams of recombinant constructs with segment lengths realistically scaled to reflect their actual sizes (numbers of residues). The Cap and Core segments of NUDT9 (blue) and NUDT9H (orange) are separated by a vertical black line. Gaps emerging from the alignment of the two sequences (Figure 2) are presented as thick lines with the respective color. The 15 amino-acid stretch from the upstream cytosolic linker sequence of TRPM2 (gray), present in some chimeras, contains a native BlpI-site which allows subcloning the domain into full-length TRPM2. Some constructs contain a C-terminal hexahistidine tag (green) or Twin-Strep tag (magenta). Nudix boxes within Core segments are indicated as black lines (see also Table 1). (B) NUDT9 fragments replaced in the chimeras by NUDT9H sequence, mapped onto surface representation of NUDT9 crystal structure (PDB ID: 1Q33). Coloring highlights progressive replacement of NUDT9 sequence with NUDT9H sequence in chimeric constructs. The Cap subdomain (light brown) is replaced in Chi2 and Chi2A. A fragment from the Core (orange), containing the Nudix box (red), is also replaced in Chi3S. Additional Core fragment (dark brown) further extends the NUDT9H sequence in Chi4S, leaving only 36 C-terminal amino acids from NUDT9 (blue).
Figure 3—figure supplement 1
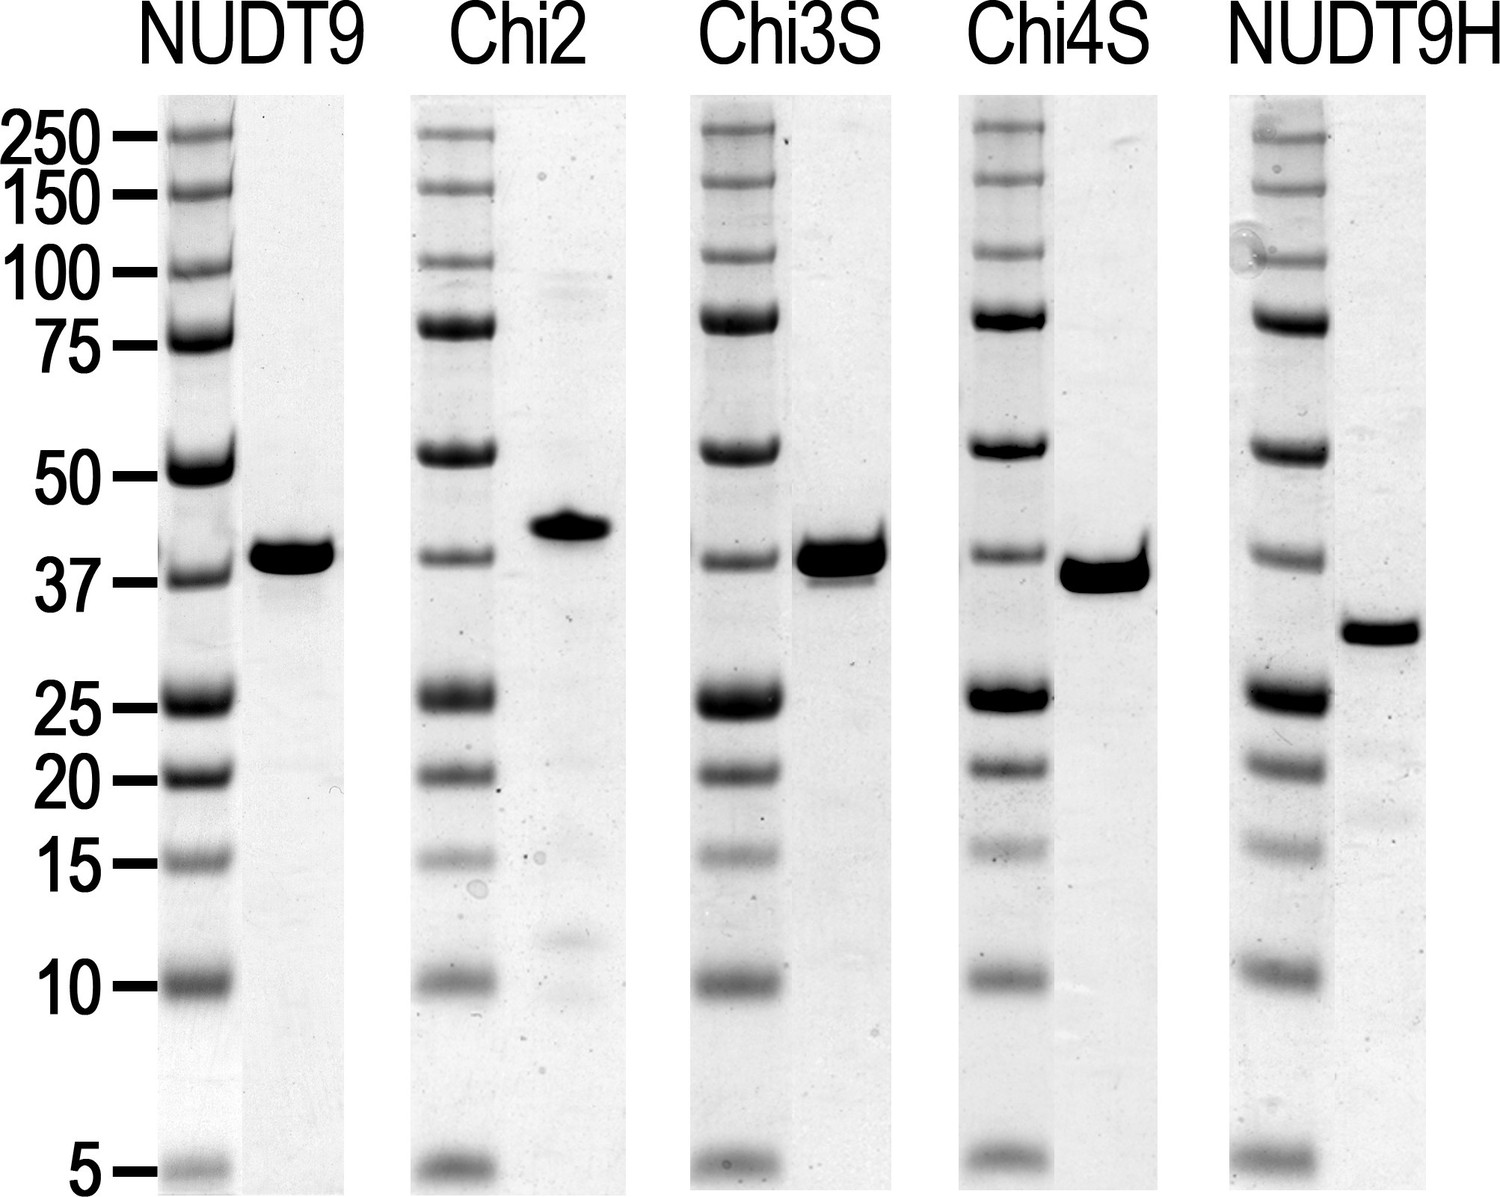
Purified recombinant proteins.
Coomassie-stained SDS PAGE gels of the five purified recombinant proteins (mitochondrial NUDT9, three soluble chimeric constructs, and the NUDT9H domain of TRPM2), as indicated above each gel slice. Molecular weights for marker ladder bands (Precision, Bio-Rad) are labeled in kDa.
Figure 4 with 2 supplements
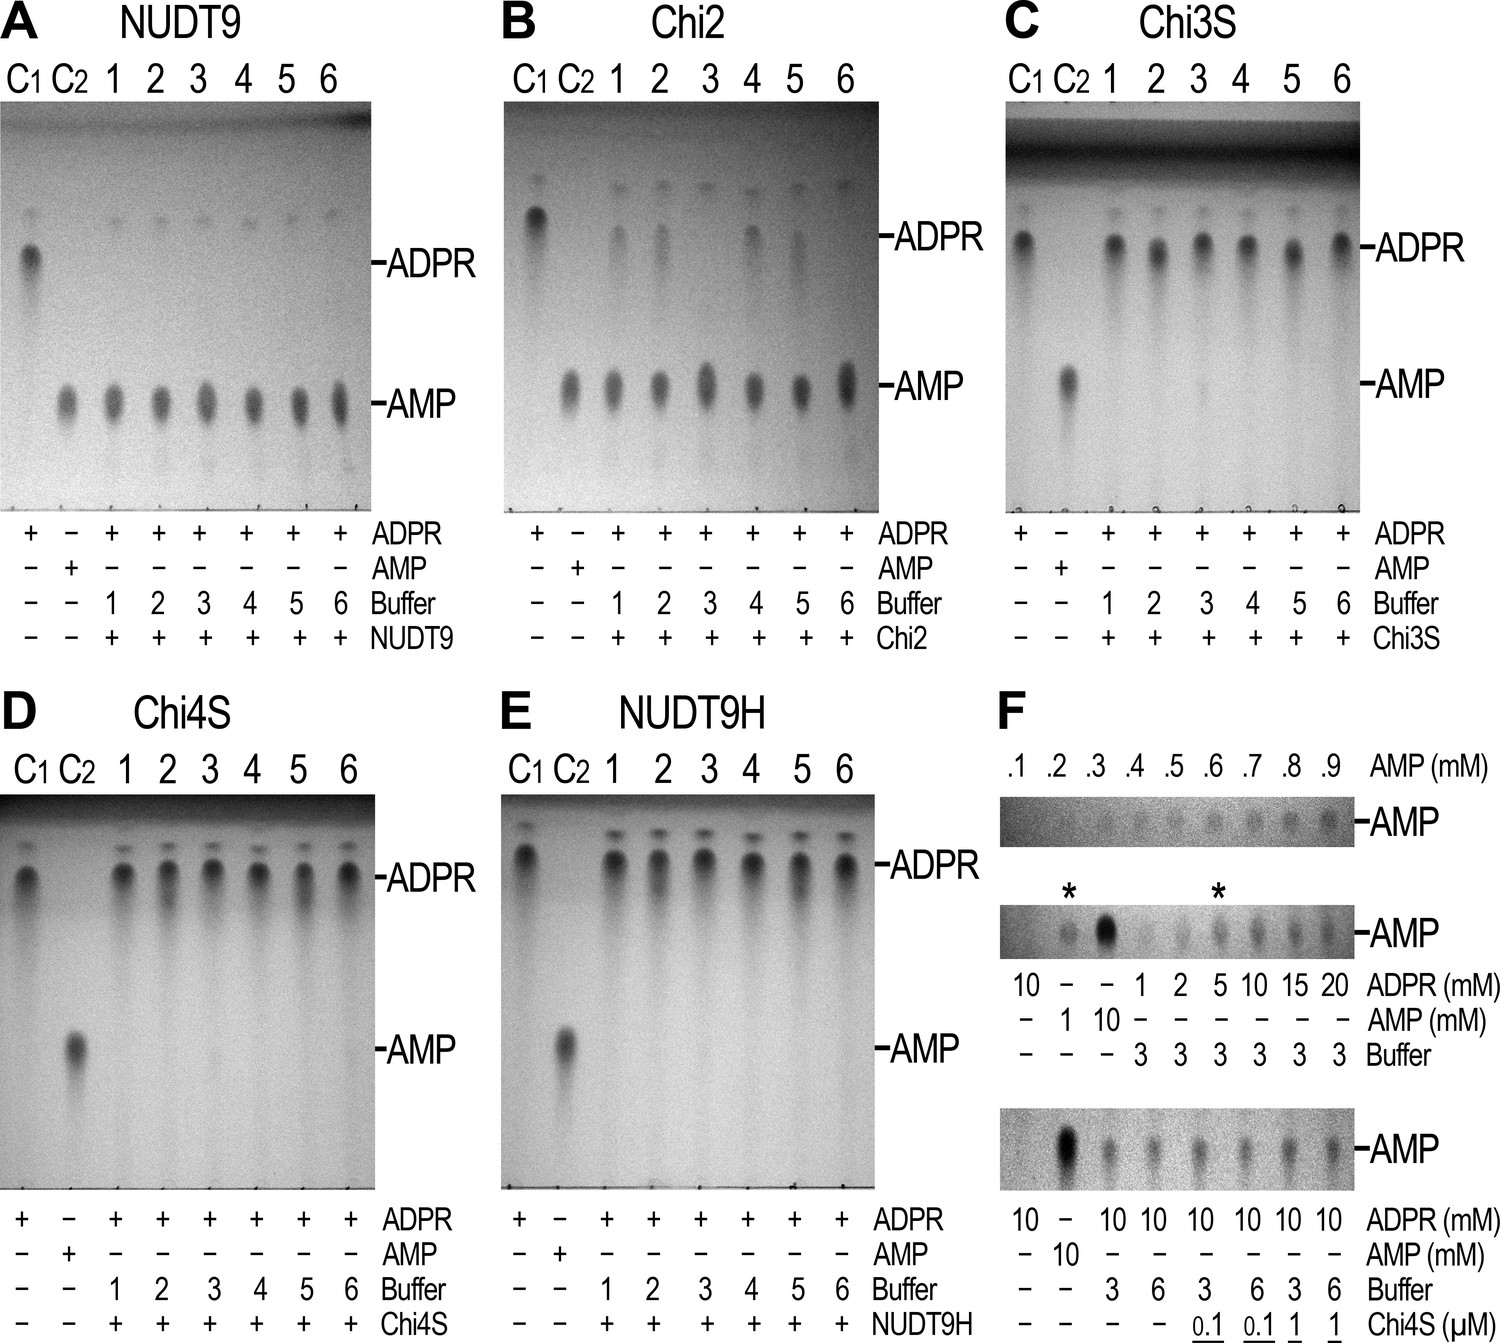
Enzymatic activity of NUDT9, NUDT9H, and chimeras.
(A–E) 10 mM ADPR (lane C1) and 10 mM AMP (lane C2) controls in water. Lanes 1–6 show reaction mixtures of 1 μM purified NUDT9 (A), Chi2 (B), Chi3S (C), Chi4S (D), or NUDT9H (E), incubated with 10 mM ADPR and 16 mM MgCl2 in 50 mM RB1-6, respectively, for 2 hr at room temperature. (F) Top slice: TLC-detection limit for AMP: 0.1–0.9 mM water-dissolved AMP in 0.1-mM incrementing steps. Middle slice: ADPR self-degradation. The slice shows only the AMP position of (from left to right): 10 mM ADPR control (in water), 1 mM AMP control (in water), 10 mM AMP control (in water), and 1, 2, 5, 10, 15 and 20 mM ADPR incubated for 24 hr at room temperature in RB3 (pH 8.5) (last six lanes). Bottom slice: ADPR self-degradation in the absence and presence of Chi4S, showing only the AMP position. From left to right: 10 mM ADPR control (in water); 10 mM AMP control (in water); 10 mM ADPR in RB3 (pH 8.5); 10 mM ADPR in RB6 (pH 8.5/NaCl); 0.1 μM Chi4S + 10 mM ADPR in RB3; 0.1 μM Chi4S + 10 mM ADPR in RB6; 1 μM Chi4S + 10 mM ADPR in RB3; 1 μM Chi4S + 10 mM ADPR in RB6. Except for the controls in lanes 1–2, all samples also contained 16 mM MgCl2, and were incubated for 24 hr at room temperature. In all Panels 1-μl aliquots were loaded for each sample. The three slices of Panel F can be seen as full-scale TLC plates in Figure 4—figure supplement 1.
Figure 4—figure supplement 1
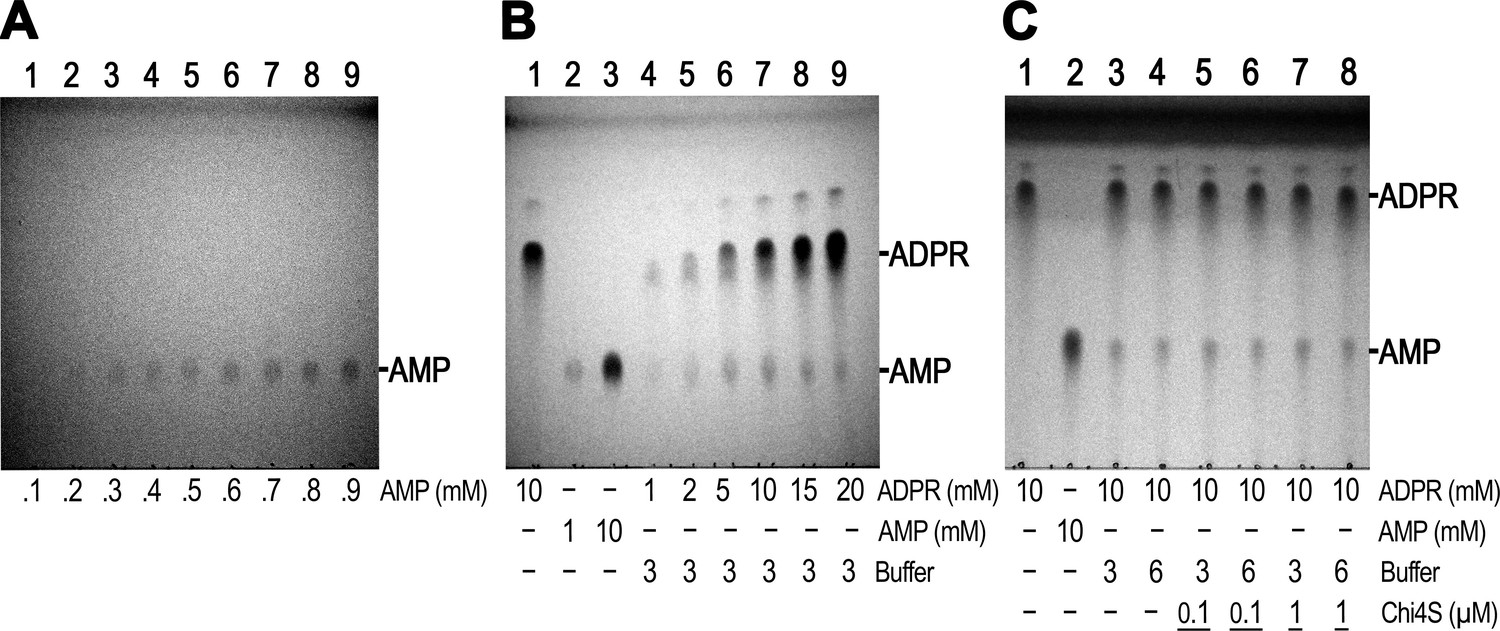
Full-scale TLC images of the slices shown in Panel F on Figure 4.
(A) Image of entire TLC plate from which the top slice in Figure 4F was excised: TLC-detection limit for AMP. Lanes 1–9 show 0.1–0.9 mM water-dissolved AMP, respectively, in 0.1-mM incrementing steps. (B) Image of entire TLC plate from which the middle slice in Figure 4F was excised: ADPR self-degradation. Lane 1: 10 mM ADPR control (in water); lane 2: 1 mM AMP control (in water); lane 3: 10 mM AMP control (in water); lanes 4–9: 1, 2, 5, 10, 15 and 20 mM ADPR, respectively, incubated for 24 hr at room temperature in RB3 (pH 8.5). (C) Image of entire TLC plate from which the bottom slice in Figure 4F was excised. ADPR self-degradation in the absence and presence of Chi4S. Lane 1: 10 mM ADPR control (in water); lane 2: 10 mM AMP control (in water); lane 3: 10 mM ADPR in RB3 (pH 8.5); lane 4: 10 mM ADPR in RB6 (pH 8.5/NaCl); lane 5: 0.1 µM Chi4S + 10 mM ADPR in RB3; lane 6: 0.1 µM Chi4S + 10 mM ADPR in RB6; lane 7: 1 µM Chi4S + 10 mM ADPR in RB3; lane 8: 1 µM Chi4S + 10 mM ADPR in RB6. Except for the controls in lanes 1–2, all samples also contained 16 mM MgCl2, and were incubated for 24 hr at room temperature. In all Panels 1-μl aliquots were loaded for each sample.
Figure 4—figure supplement 2

Spontaneous ADPR degradation at basic pH, monitored with TLC.
The six TLC slices show only the AMP position of 10 mM ADPR control in water (lane 1), 1 mM AMP control in water (lane 2), 10 mM AMP control in water (lane 3), and 1, 2, 5, 10, 15 and 20 mM ADPR, respectively, in RB3 (pH 8.5) (lanes 4–9). The ADPR samples were incubated at room temperature for different time durations, as indicated to the right of each slice. In all slices 1-μl aliquots were loaded for each sample. The 24h-slice is the same experiment shown in Figure 4F, middle slice (and in Figure 4—figure supplement 1B).
Figure 5
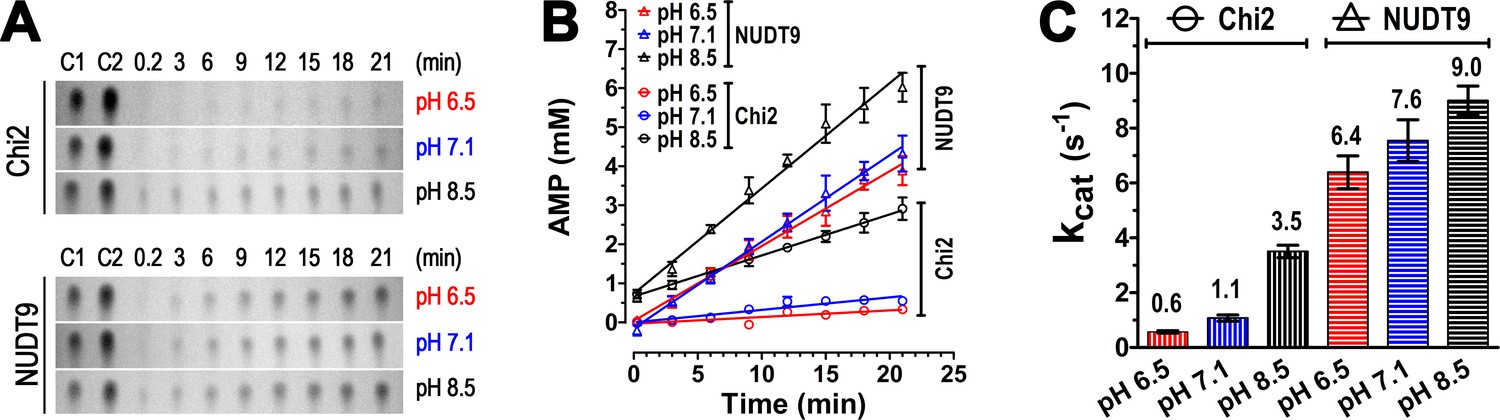
Enzyme kinetics of Chi2 and NUDT9.
(A) Representative TLC images showing the time courses (in minutes) of hydrolysis of ADPR (10 mM) by 0.5 μM Chi2 (top) or NUDT9 (bottom) at 3 different pH values (RB1, RB2 and RB3). The slices show only the position of the AMP spots. Control 1 (C1): 5 mM AMP in water. Control 2 (C2): 10 mM AMP in water. (B) AMP accumulation during ADPR hydrolysis by Chi2 (circles) and NUDT9 (triangles) at 3 different pH values. Densities of AMP spots (such as those shown in Panel A) were normalized to the density of the control AMP spot (5 mM) on the same TLC sheet. For each time point mean ± SEM from 3 experiments is shown. Straight lines are linear regression fits to the averaged data points. (C) Estimates of kcat (s−1) for both proteins at each pH, calculated from the fitted slopes in B (mean ± SEM; mean values are also printed above each bar).
Figure 6 with 2 supplements
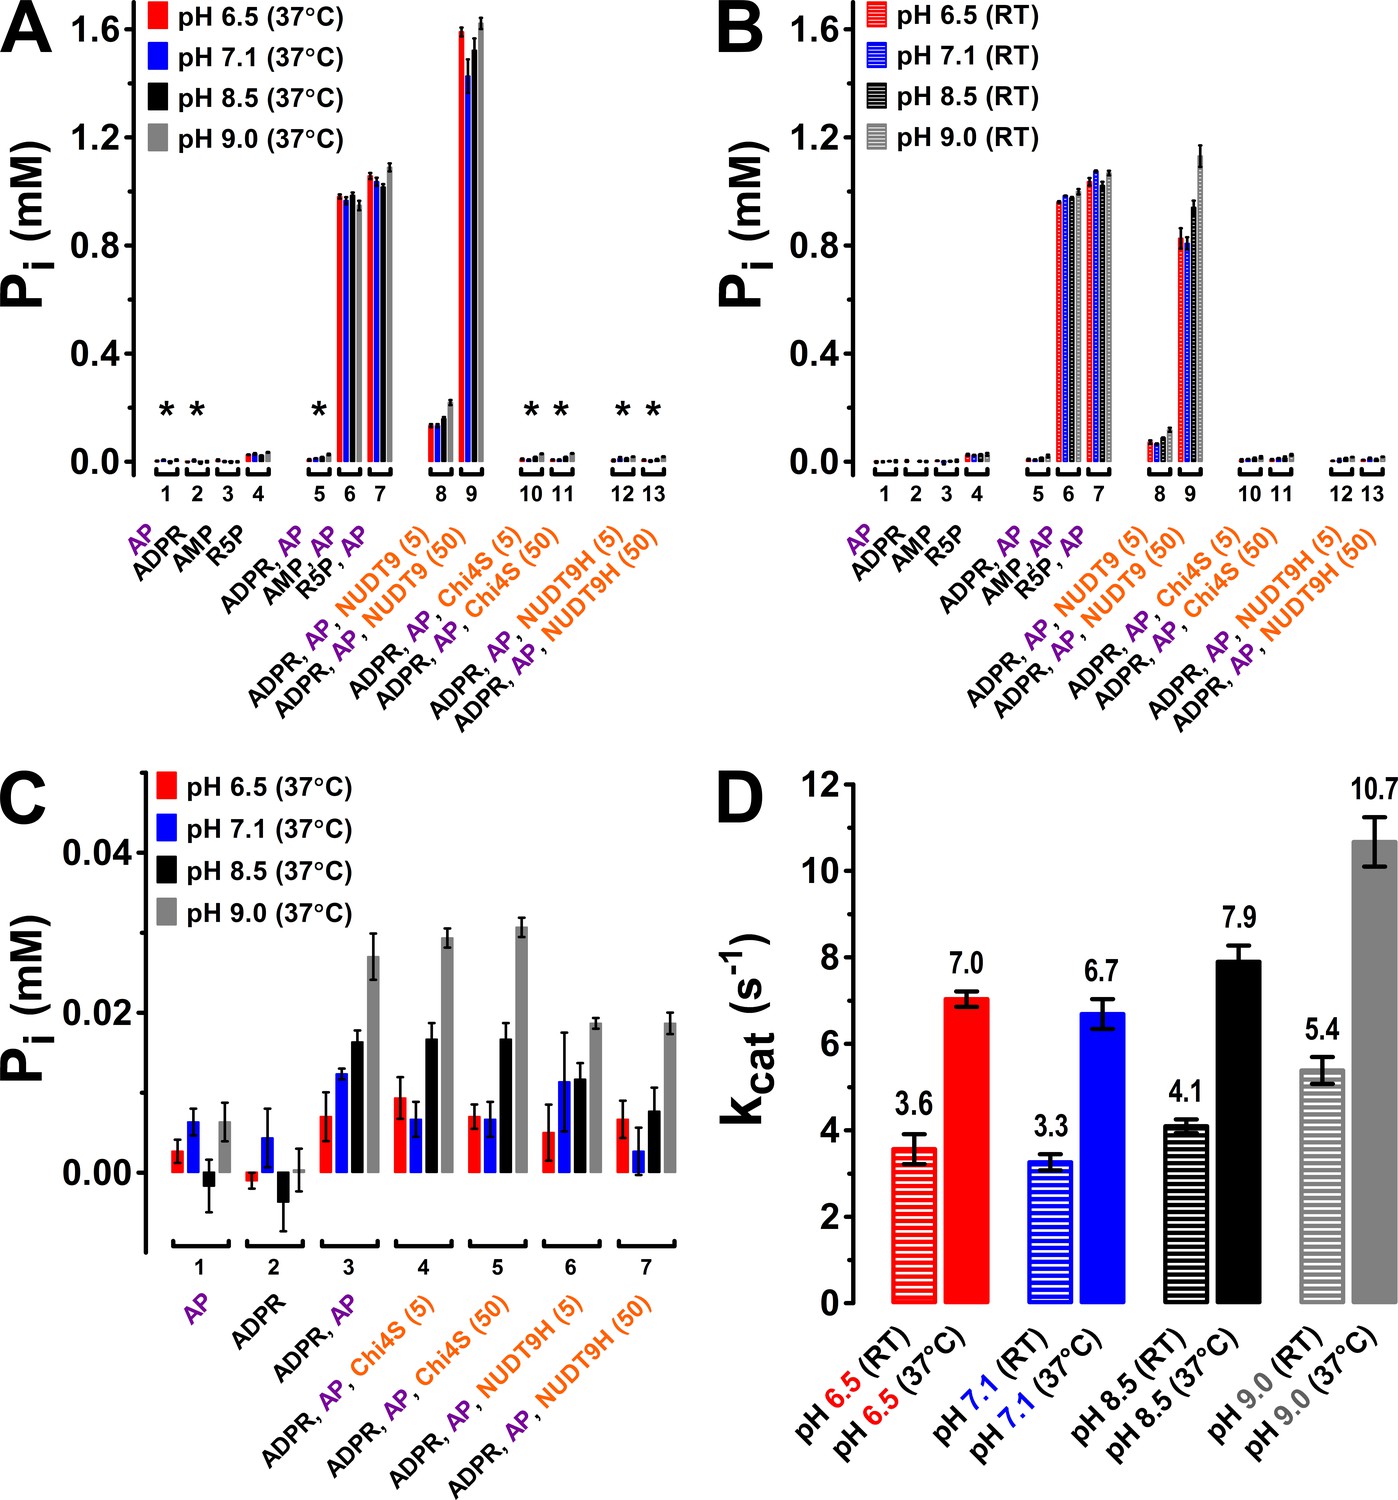
Enzymatic activity of NUDT9, Chi4S, and NUDT9H measured with the Pi assay.
(A–B) Pi (in mM) liberated in sample mixtures containing, as indicated, AP (5–6 U alkaline phosphatase), ADPR (1 mM), AMP (1 mM), R5P (1 mM), and either 5 or 50 nM protein (NUDT9, Chi4S, or NUDT9H), and incubated for 30 min at pH 6.5, 7.1, 8.5, or 9.0 (color coded) at either 37°C (A) or room temperature (RT) (B). Asterisks in A denote samples replotted with an expanded ordinate in Panel C. Bars represent mean ± SEM from 3 independent experiments. (C) Expanded display of samples denoted with asterisks in Panel A. (D) Estimated kcat values (in s−1) for NUDT9 under each experimental condition (pH and temperature), calculated (see Materials and methods) from [Pi] liberated in the samples containing 5 nM NUDT9 (group 8) in Panels A and B.
Figure 6—figure supplement 1

Spontaneous ADPR degradation at basic pH, monitored with Pi assay.
Pi assay (see Materials and methods) for 2 mM ADPR in the absence of an ADPRase, incubated at various pH and temperatures (as labeled) for the indicated time (in minutes). 'No AP' – Alkaline phosphatase was not added, and incubation time was 120 min. The two ordinates represent the concentration of liberated Pi (in mM) (left), and the corresponding mol% of degraded ADPR (right). Bars represent mean ± SEM from 3 independent experiments.
Figure 6—figure supplement 2
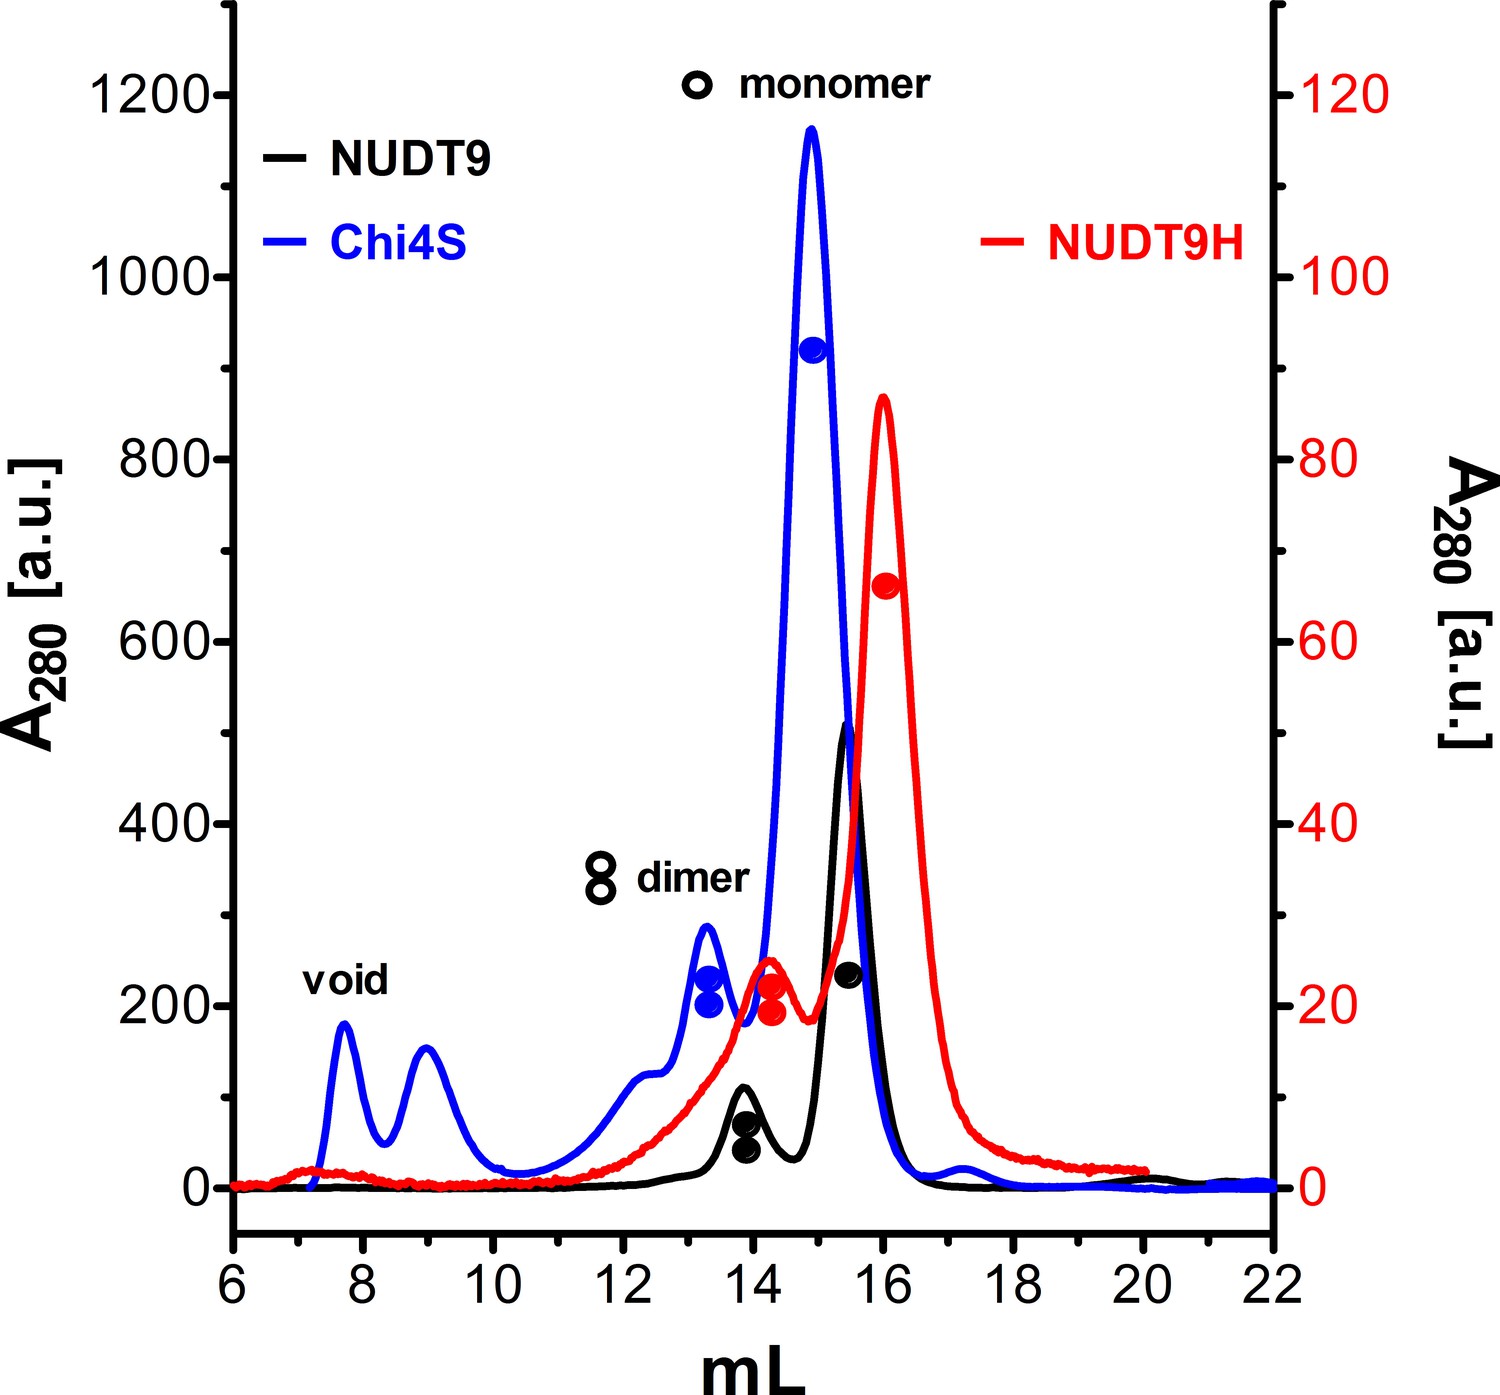
Size exclusion chromatograms of NUDT9, HUDT9H, and Chi4S.
Size exclusion chromatography elution profiles, detected as absorbance at 280 nm, of affinity-purified NUDT9 (black), Chi4S (blue), and NUDT9H (red; note 10-fold expanded ordinate on the right). Peaks corresponding to monomers and dimers are labeled
Figure 7
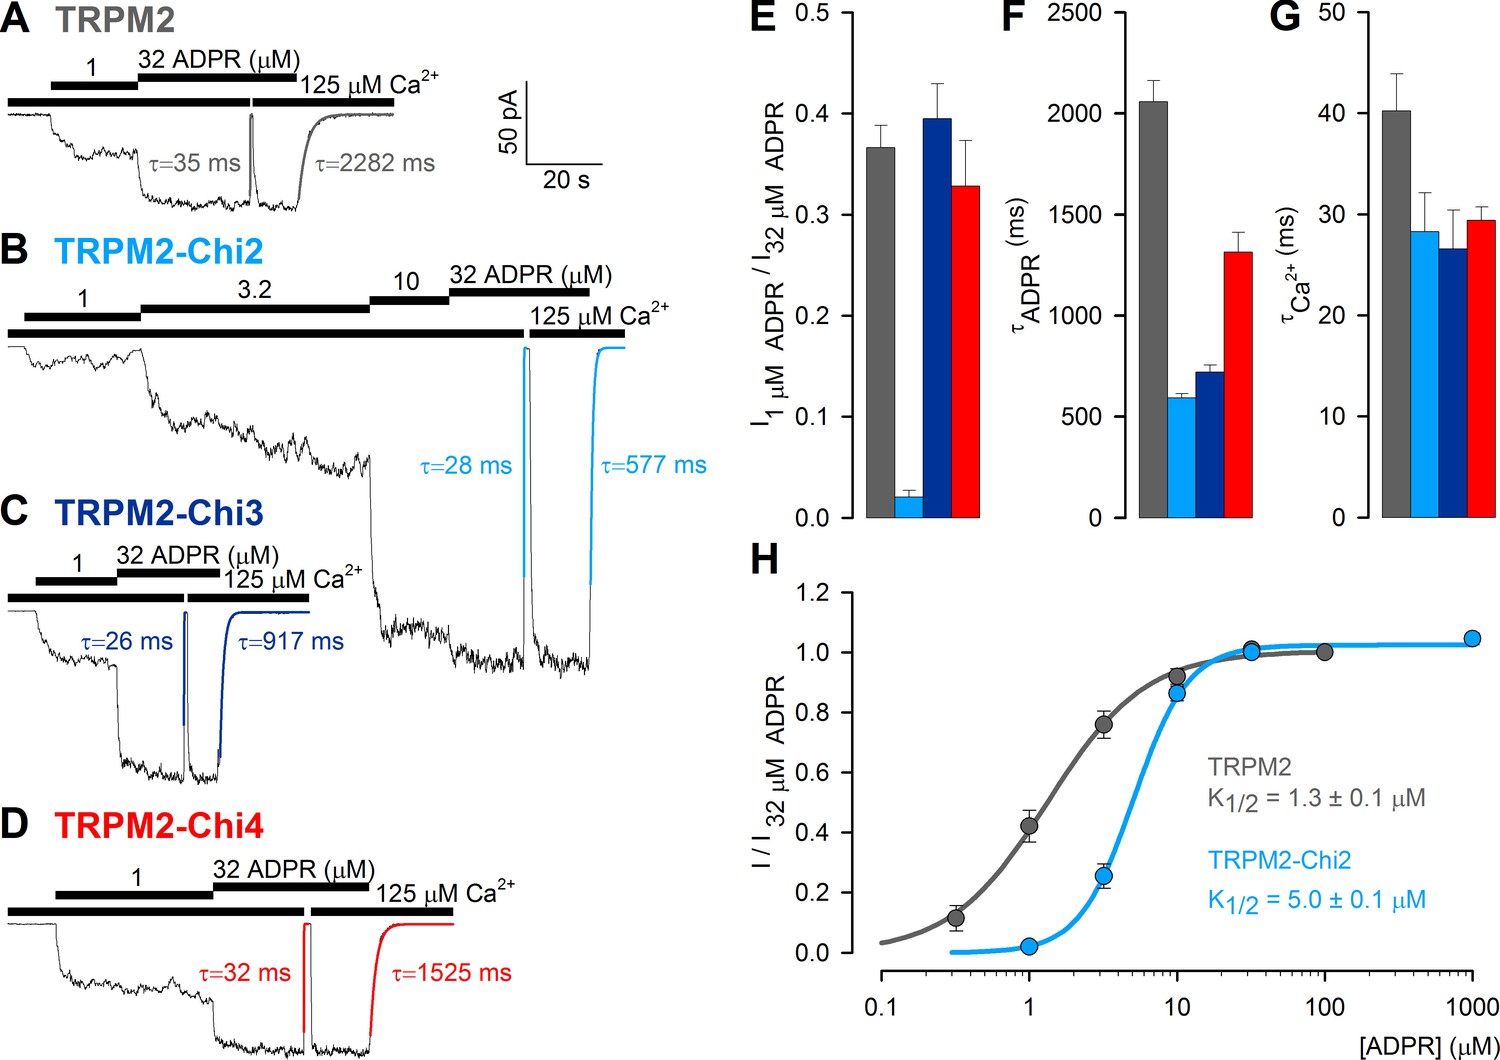
ADPR-induced channel activity of full-length TRPM2 chimeras.
(A–D) Macroscopic currents in inside-out patches excised from Xenopus laevis oocytes expressing (A) T5L-TRPM2, (B) T5L-TRPM2-Chi2, (C) T5L-TRPM2-Chi3, and (D) T5L-TRPM2-Chi4, elicited by superfusion with increasing concentrations of ADPR in the presence of saturating Ca2+ (black bars). Membrane potential was −20 mV; current relaxation time courses following removal of either Ca2+ or ADPR were fitted by single exponentials (colored lines) with time constants indicated. (E) Fractional current activation of the constructs in A–D by 1 μM ADPR; mean steady currents in 1 μM ADPR were divided by those in 32 μM ADPR in the same patch (mean ± SEM, n≥8). (F–G) Time constants of current relaxation upon sudden removal of ADPR (F) or Ca2+ (G) for the constructs in A–D, obtained from single-exponential fits (mean ± SEM, n≥5). (H) Dose response curve of fractional current activation for T5L-TRPM2 (gray) and T5L-TRPM2-Chi2 (light blue); mean steady currents in various test [ADPR] were divided by those in 32 μM ADPR in the same patch. Symbols represent mean ± SEM (n≥5), solid lines are fits to the Hill equation with midpoints printed in the panel.
Figure 8 with 1 supplement
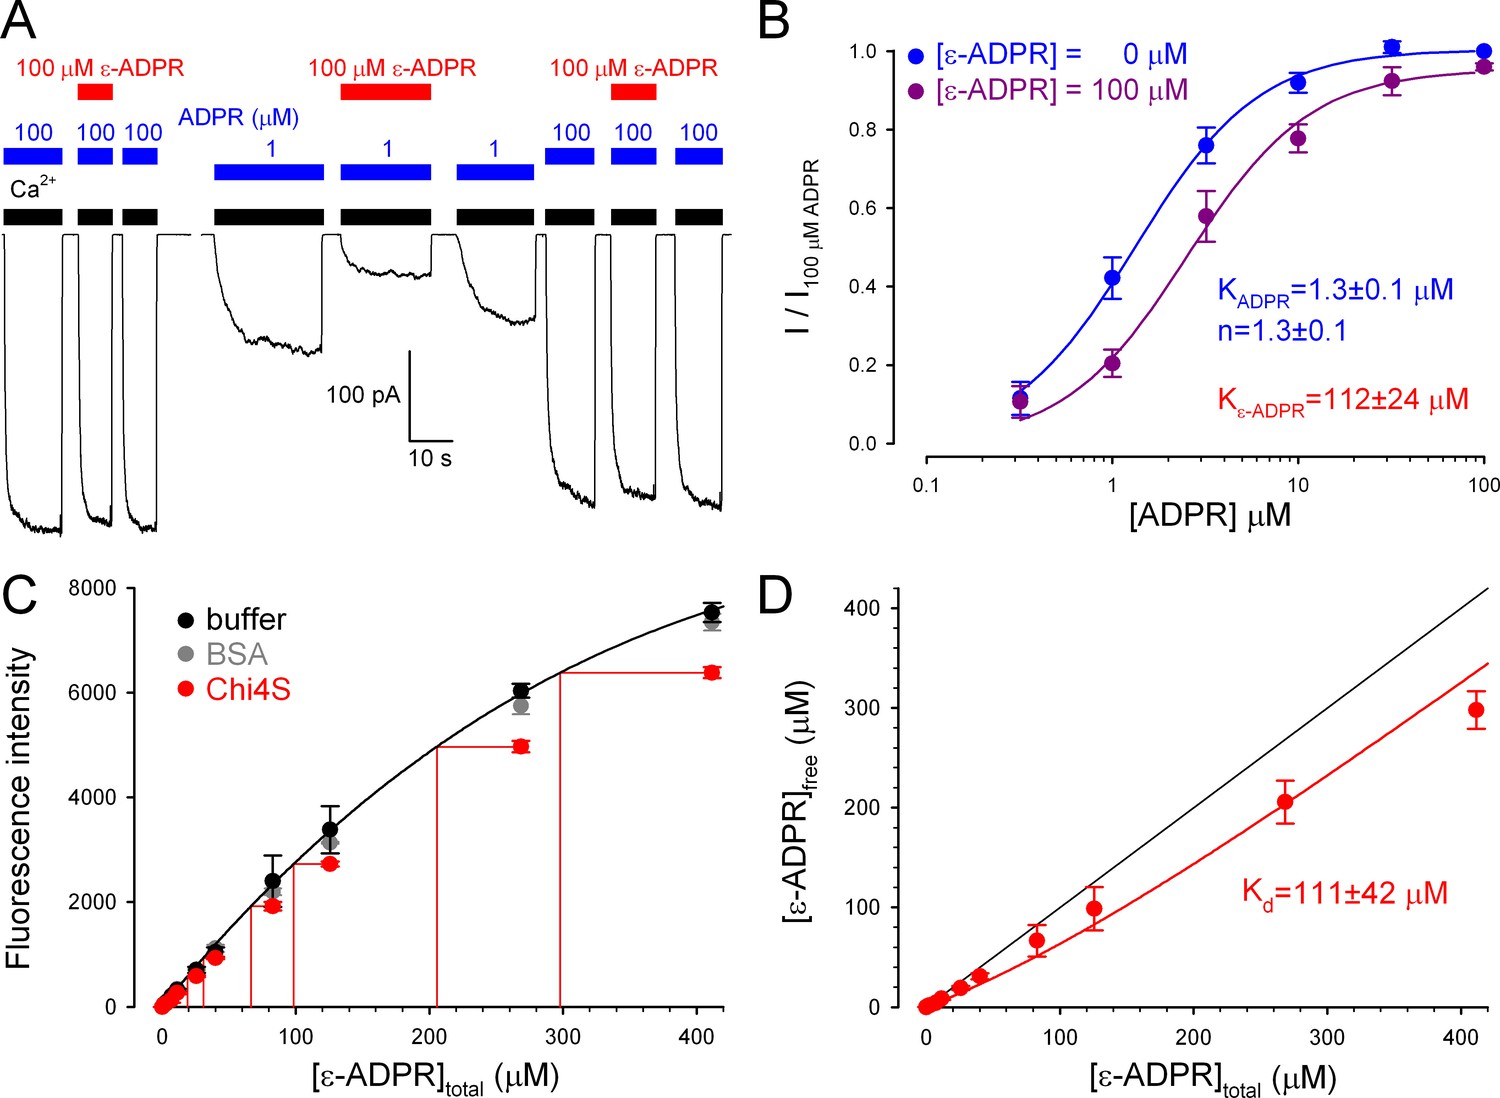
Full-length TRPM2 and the isolated Chi4S protein bind ε-ADPR with similar affinities.
(A) Macroscopic inward T5L-TRPM2 current in inside-out patch excised from Xenopus laevis oocyte, elicited at -20 mV by repeated exposures to saturating Ca2+ (black bars) and 1 or 100 μM ADPR (blue bars), in the absence or presence of 100 μM ε-ADPR (red bars). (B) Dose-dependence of TRPM2 activation by ADPR in the absence (blue symbols and fit line) and presence (violet symbols and fit line) of 100 μM ε-ADPR (mean ± SEM, n≥7). Printed parameters KADPR, n, and Kε-ADPR reflect the apparent affinity and Hill slope for ADPR binding, and KI for ε-ADPR binding, respectively, obtained from the fits (see Materials and methods). (C) Fluorescence intensity (arbitrary units, Ex: 310 nm, Em: 420 nm) of ε-ADPR at various total concentrations in the absence of protein (black symbols), or in the presence of 100 μM of either BSA (gray symbols) or Chi4S (red symbols). Symbols plot mean ± SD from four, two, and two independent titrations, respectively, for buffer (black), BSA (gray), and Chi4S (red). Black line is a smooth fit of the black symbols by a three-parameter empirical mathematical function, and was used as a calibration curve to determine free [ε-ADPR] in the presence of Chi4S, assuming negligible fluorescence of the bound analog (red projection lines). (D) Plot of upper estimate of free [ε-ADPR] as a function of total [ε-ADPR] in the presence of 100 μM Chi4S (red symbols), fitted (red line) to a simple binding equation (see Materials and methods) to obtain an upper estimate of Kd (see panel). Black line illustrates free [ε-ADPR] expected in the absence of binding.
Figure 8—figure supplement 1
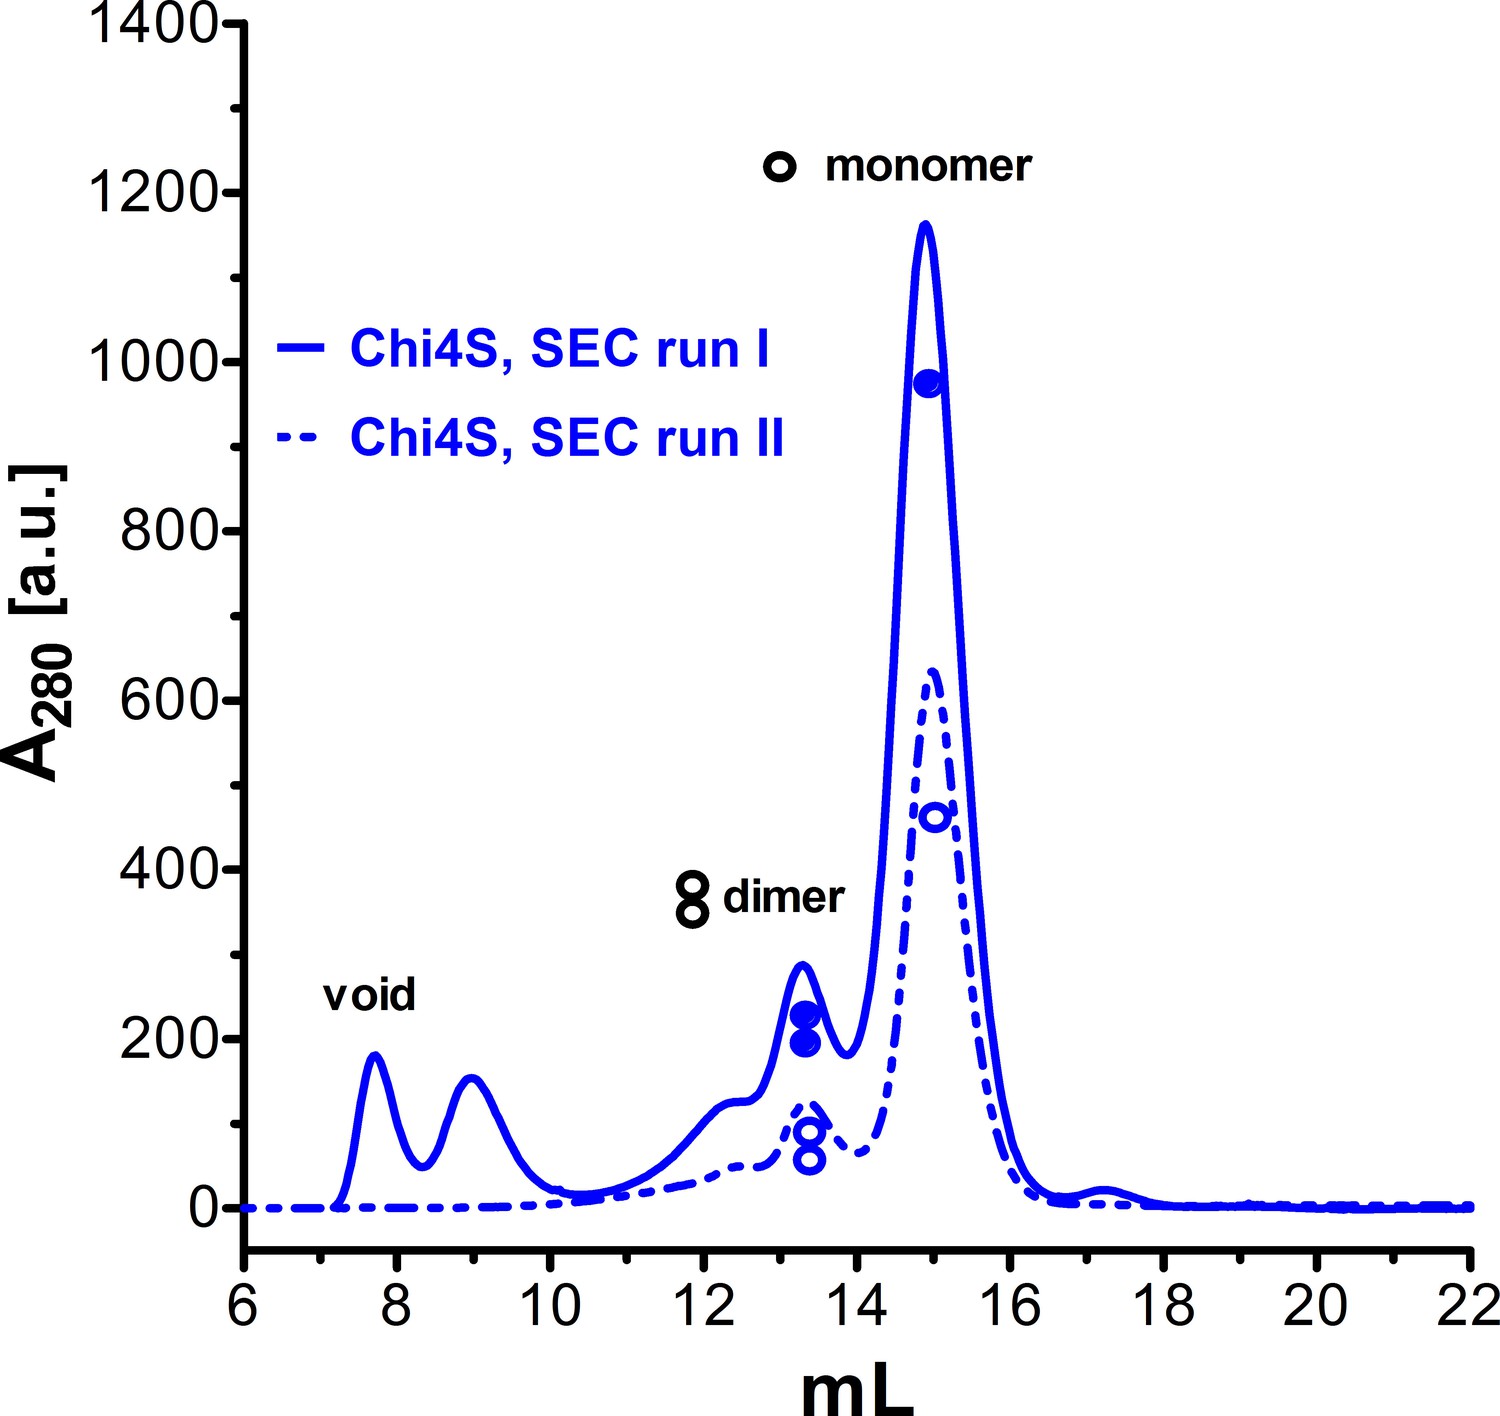
Lack of effect of five-fold concentration on Chi4S solubility.
Size exclusion chromatography elution profiles, detected as absorbance at 280 nm. Chi4S was expressed and purified as described in Materials and methods, using Steptactin affinity chromatography followed by size exclusion chromatography (solid blue profile). The pooled monomeric fraction was left overnight at 4°C, and then concentrated five-fold, to ~100 μM, using a 10 kDa molecular weight cutoff Vivaspin column (Sartorius). This concentrated protein was then subjected to a second round of size exclusion chromatography (dashed blue profile).
Tables
Table 1
Properties of the recombinant proteins.
| Construct | M.W. (kDa) | Theor. pI* | % NUDT9H† | ecOpt‡ | Nudix§ | Soluble | Enzyme |
|---|---|---|---|---|---|---|---|
| NUDT9 | 34.0 | 6.88 | 0 | Yes | NUDT9 | Yes | Yes |
| NUDT9H | 31.5 | 8.34 | 100 | Yes | NUDT9H | No¶ | No |
| Chi1 | 31.7 | 9.30 | 59 | Yes | NUDT9H | No | N/A†† |
| Chi1A | 32.3 | 9.16 | 59 | No | NUDT9H | No | N/A |
| Chi2 | 35.7 | 6.27 | 41 | No | NUDT9 | Yes | Yes |
| Chi2A | 34.6 | 5.91 | 41 | No | NUDT9 | Yes | N/A |
| Chi3S | 35.4 | 6.40 | 77 | Yes | NUDT9H | Yes (25°C)** | No |
| Chi4S | 35.8 | 7.16 | 91 | Yes | NUDT9H | Yes (25°C)** | No |
-
* - Theoretical pI of the construct (Protein Calculator v3.4).
-
† - Percentage of NUDT9H sequence (TRPM2 residues 1236-1503) contained in the construct. (The segment in brackets does not include the 15 amino-acid upstream stretch from TRPM2).
-
‡ - Gene sequence optimized for expression in E.coli. ‘No’ denotes that the original, human nucleotide sequence (Nagamine et al., 1998) was used.
-
§ - Denotes the origin (NUDT9 or NUDT9H) of the Nudix box sequence in the construct.
-
¶ - Small fraction of the protein is soluble when expressed at 25°C.
-
** - Small fraction of the protein is soluble when expressed at 37°C, reasonably soluble when expressed at 25°C.
-
†† - Not Available
Download links
A two-part list of links to download the article, or parts of the article, in various formats.
Downloads (link to download the article as PDF)
Open citations (links to open the citations from this article in various online reference manager services)
Cite this article (links to download the citations from this article in formats compatible with various reference manager tools)
The proposed channel-enzyme transient receptor potential melastatin 2 does not possess ADP ribose hydrolase activity
eLife 5:e17600.
https://doi.org/10.7554/eLife.17600


