A near atomic structure of the active human apoptosome
- Boston University School of Medicine, United States
- Janelia Research Campus, Howard Hughes Medical Institute, United States
- U.S. Innovation Center, Bayer Healthcare, United States
Figures
Figure 1 with 1 supplement
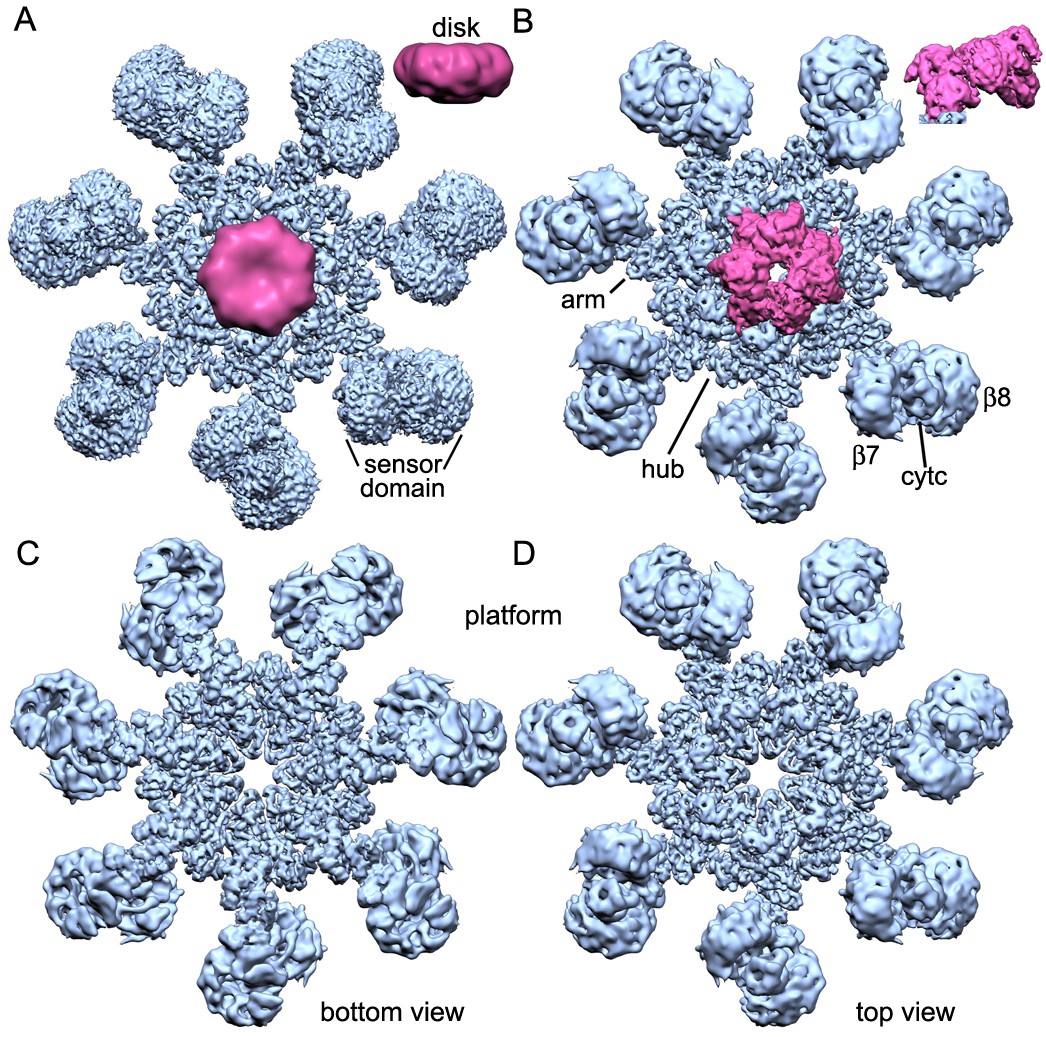
Overview of 3D density maps for the active apoptosome.
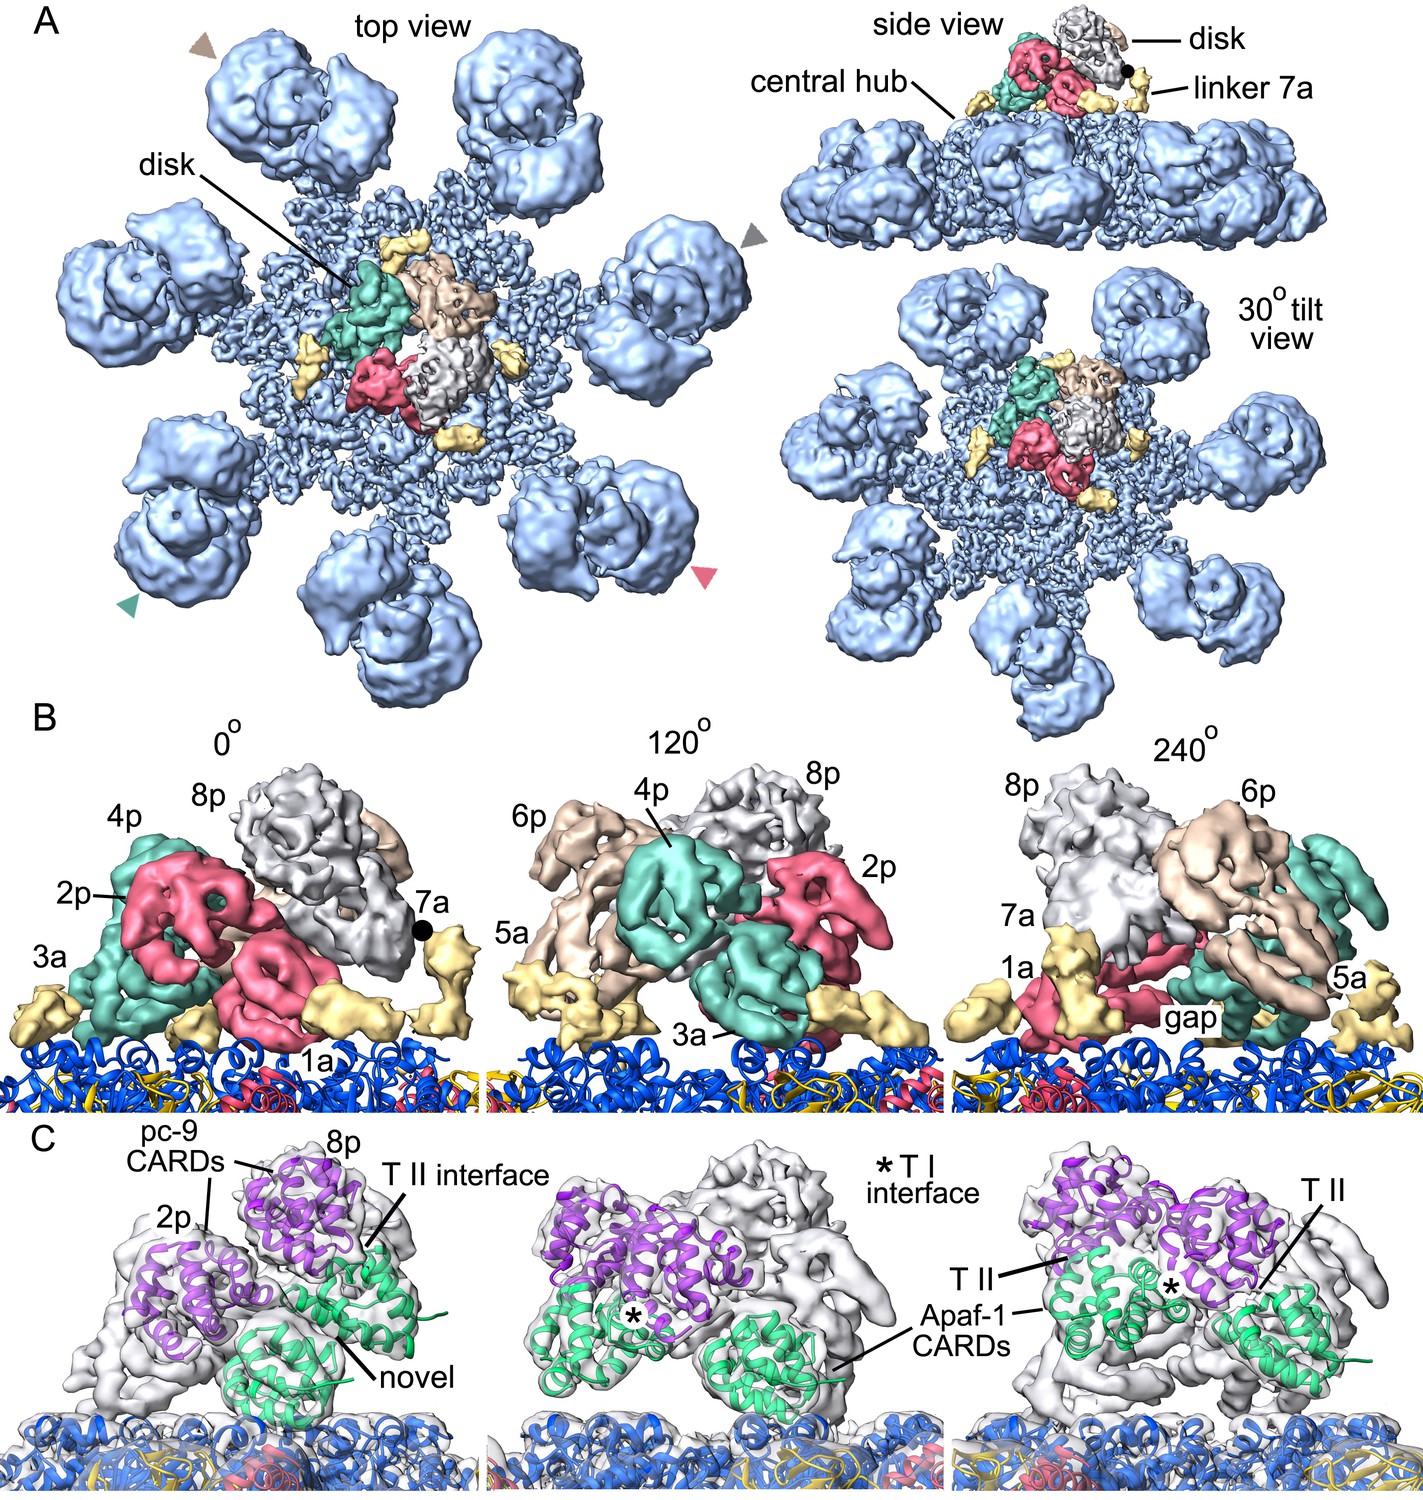
(A) A top view of the global 3D density map is shown with the platform in blue and the blurred CARD disk in magenta. Inset: The CARD disk was low pass filtered to ~14 Å resolution and is shown from the side. (B) Top view of the composite 3D density map. The sensor domain (with β-propellers (β7, β8) and cytochrome c) and the CARD disk are from maps obtained with focused 3D classification at ~6 Å resolution. The strong tilt of the acentric disk is shown in the inset. (C, D) Bottom and top views of the platform. See also Figure 1 — table and figure supplement 1.
-
Figure 1—source data 1
Data collection and refinement statistics.
Model statistics in the table were derived from an analysis with Molprobity (Davis et al., 2007).
- https://doi.org/10.7554/eLife.17755.004
Figure 1—figure supplement 1
Sample and structure characterization for the active apoptosome.
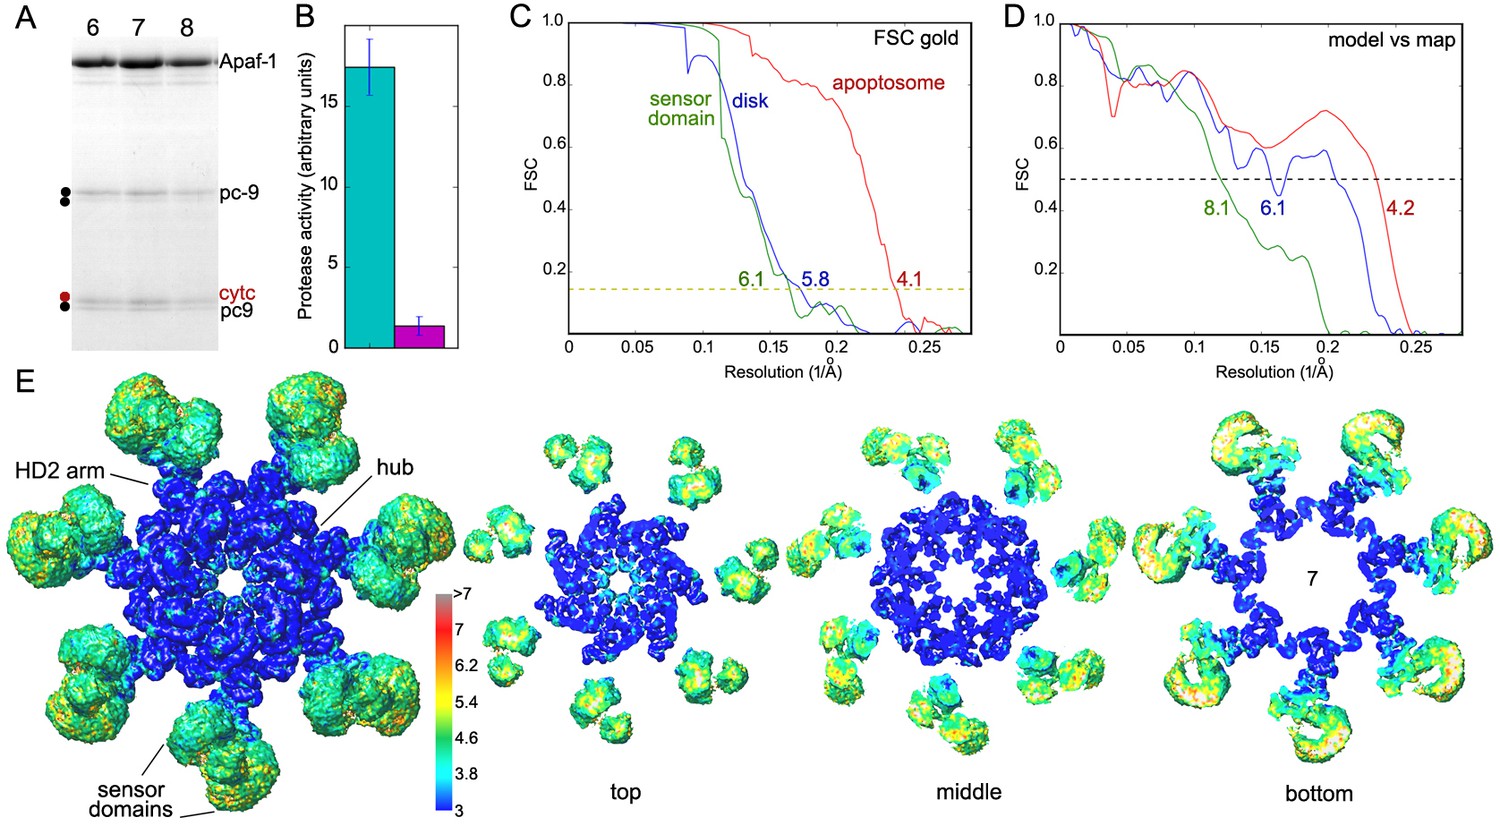
(A) SDS PAGE of peak fractions (6–8) that contain the pc-9 apoptosome from a glycerol gradient. A two-chain pc-9 was used in the experiments. (B) Histogram of LEHD protease activity for the pc-9 apoptosome (green bar) relative to a pc-9 control (magenta bar). Measurements were done in triplicate. (C) Gold standard FSC curves were calculated from half-data sets for the full apoptosome, the unblurred CARD disk and the sensor domain maps, as indicated. (D) Model versus map FSC curves are shown for the central hub with HD2 arms, the unblurred CARD disk and the sensor region with cytochrome c. (E) Local resolution was estimated with Resmap (Kucukelbir et al., 2014; see color scale) and is displayed as a graduated color scale on the entire platform and thick slices from the global map, as viewed along the seven-fold axis. The thick slices are shown at a reduced scale.
Figure 2 with 4 supplements
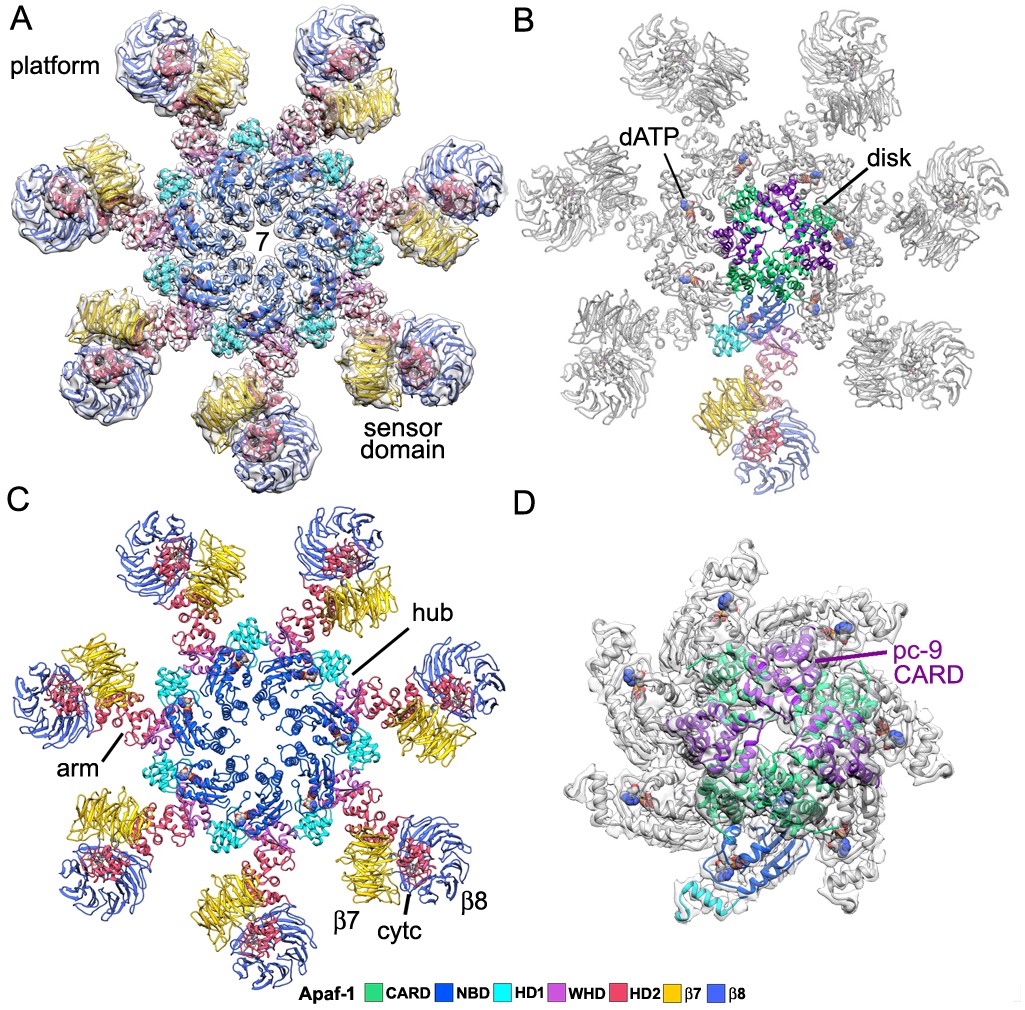
Model of the active apoptosome.
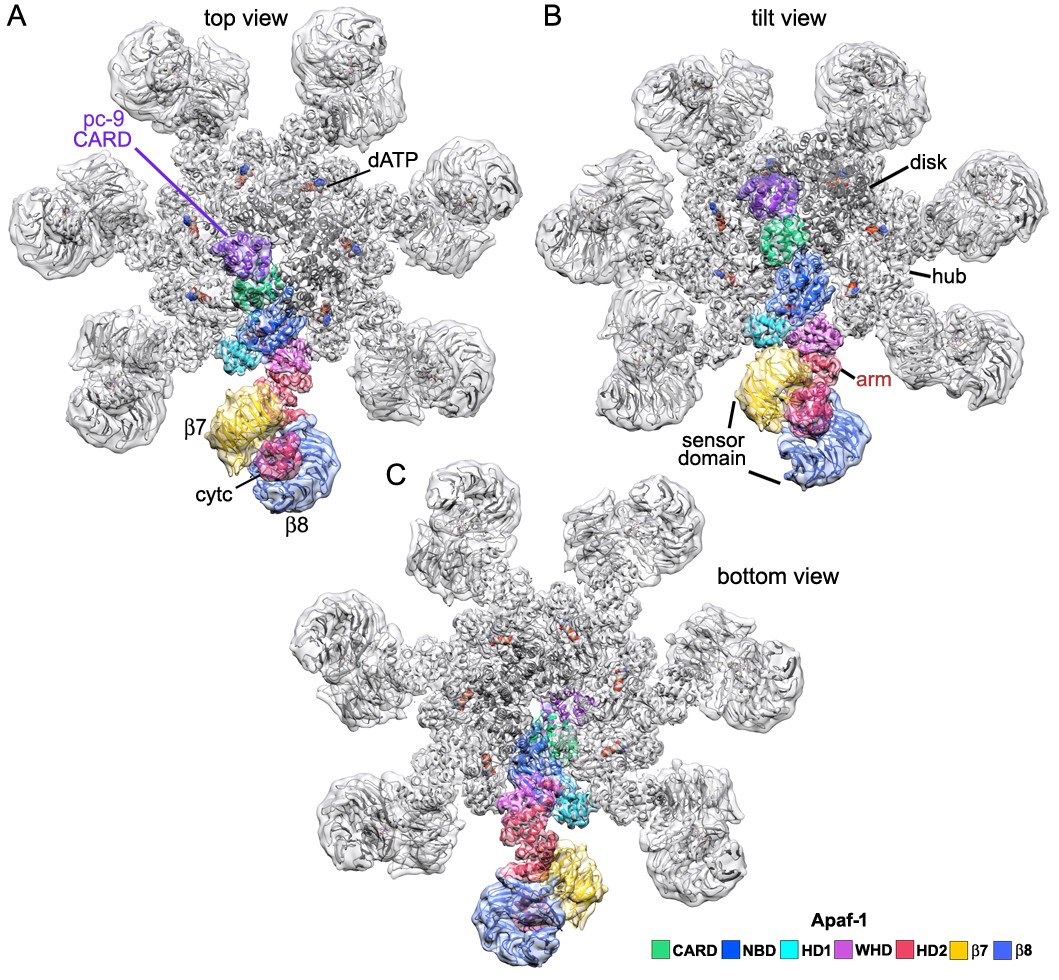
(A, C) Top views are shown of the heptameric platform from the apoptosome model, with and without the composite 3D map. Apaf-1 domains are highlighted in color (see color key). (B, D) A top view is shown of the complete model of the active apoptosome without the 3D map. In addition, a close-up of the acentric disk and part of the NBD ring is shown within the composite map (panel D). Domains in a single Apaf-1 and the acentric CARD disk are color-coded, relative to the remaining Apaf-1 subunits, which are shown in grey. See also Figure 2—figure supplements 1–4.
Figure 2—figure supplement 1
An Apaf-1 subunit with a bound pc-9 CARD within the active apoptosome.
(A–C) Top, tilted and bottom views are shown of a color-coded Apaf-1 subunit along with the associated Apaf-1/pc-9 CARD pair, docked within the composite density map. The pc-9 CARD is shown in purple and the Apaf-1 CARD is at position 1a in the disk. The remaining CARDs are colored dark grey.
Figure 2—figure supplement 2
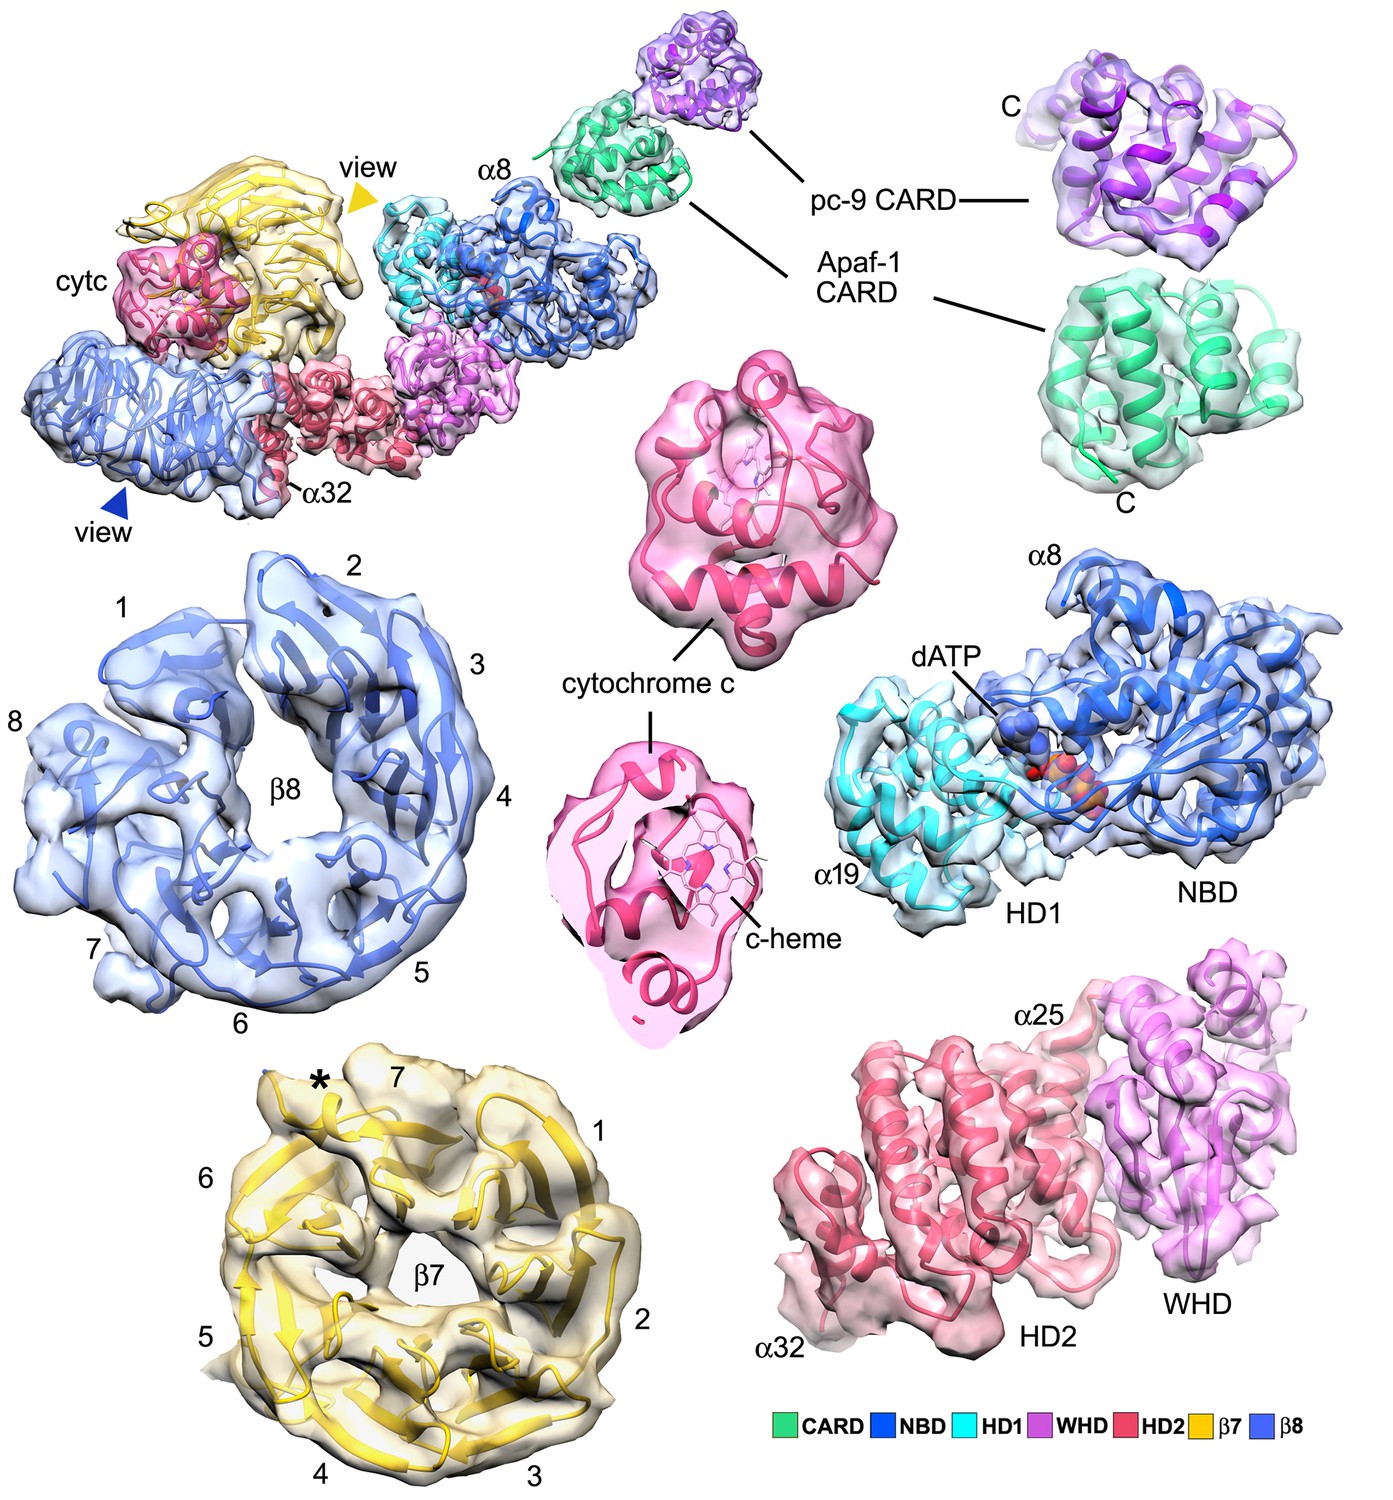
Segmented domain maps for the Apaf-1 subunit with a bound pc-9 CARD.
Domains and their maps are color-coded and show a clear demarcation of α-helices and β-sheets. At this resolution all helices in cytochrome c are visible at a higher threshold (not shown). The view direction for the β-propellers is indicated by colored arrow heads.
Figure 2—figure supplement 3
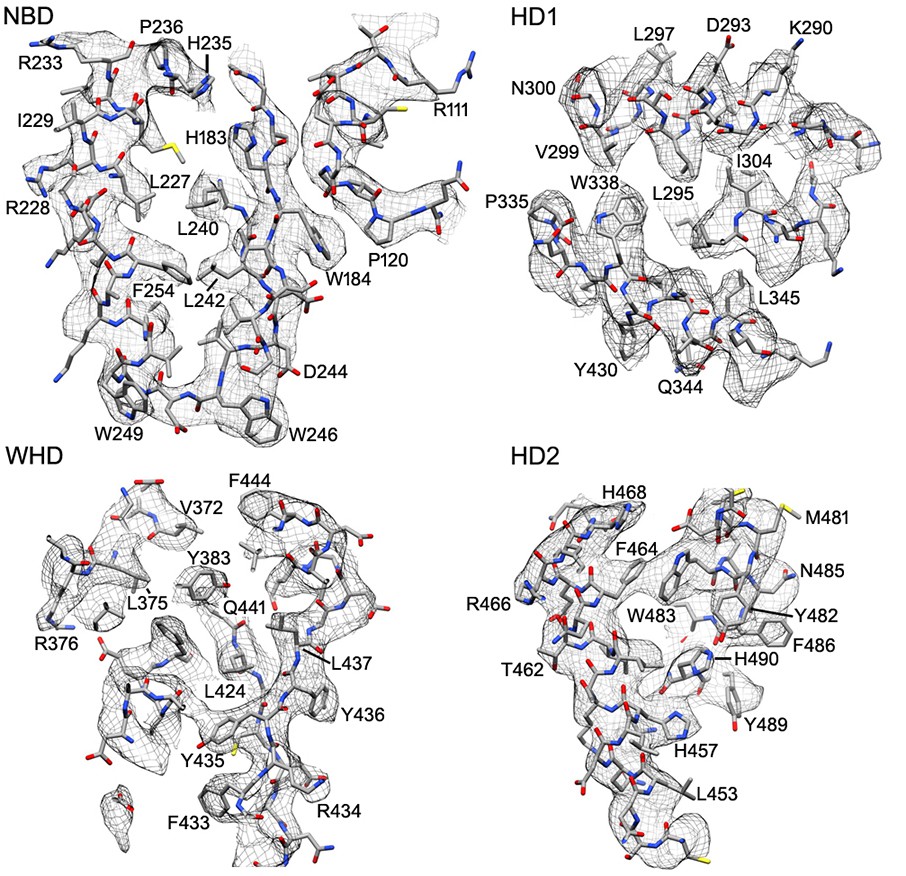
Representative electron density is shown for the four domains of the central hub and HD2 arm.
At the nominal resolution of 3–4 Å, side chains are visible throughout the map for the platform region, although the quality falls off in the HD2 arm, due to local motions and effects of alignment errors at higher radius.
Figure 2—figure supplement 4
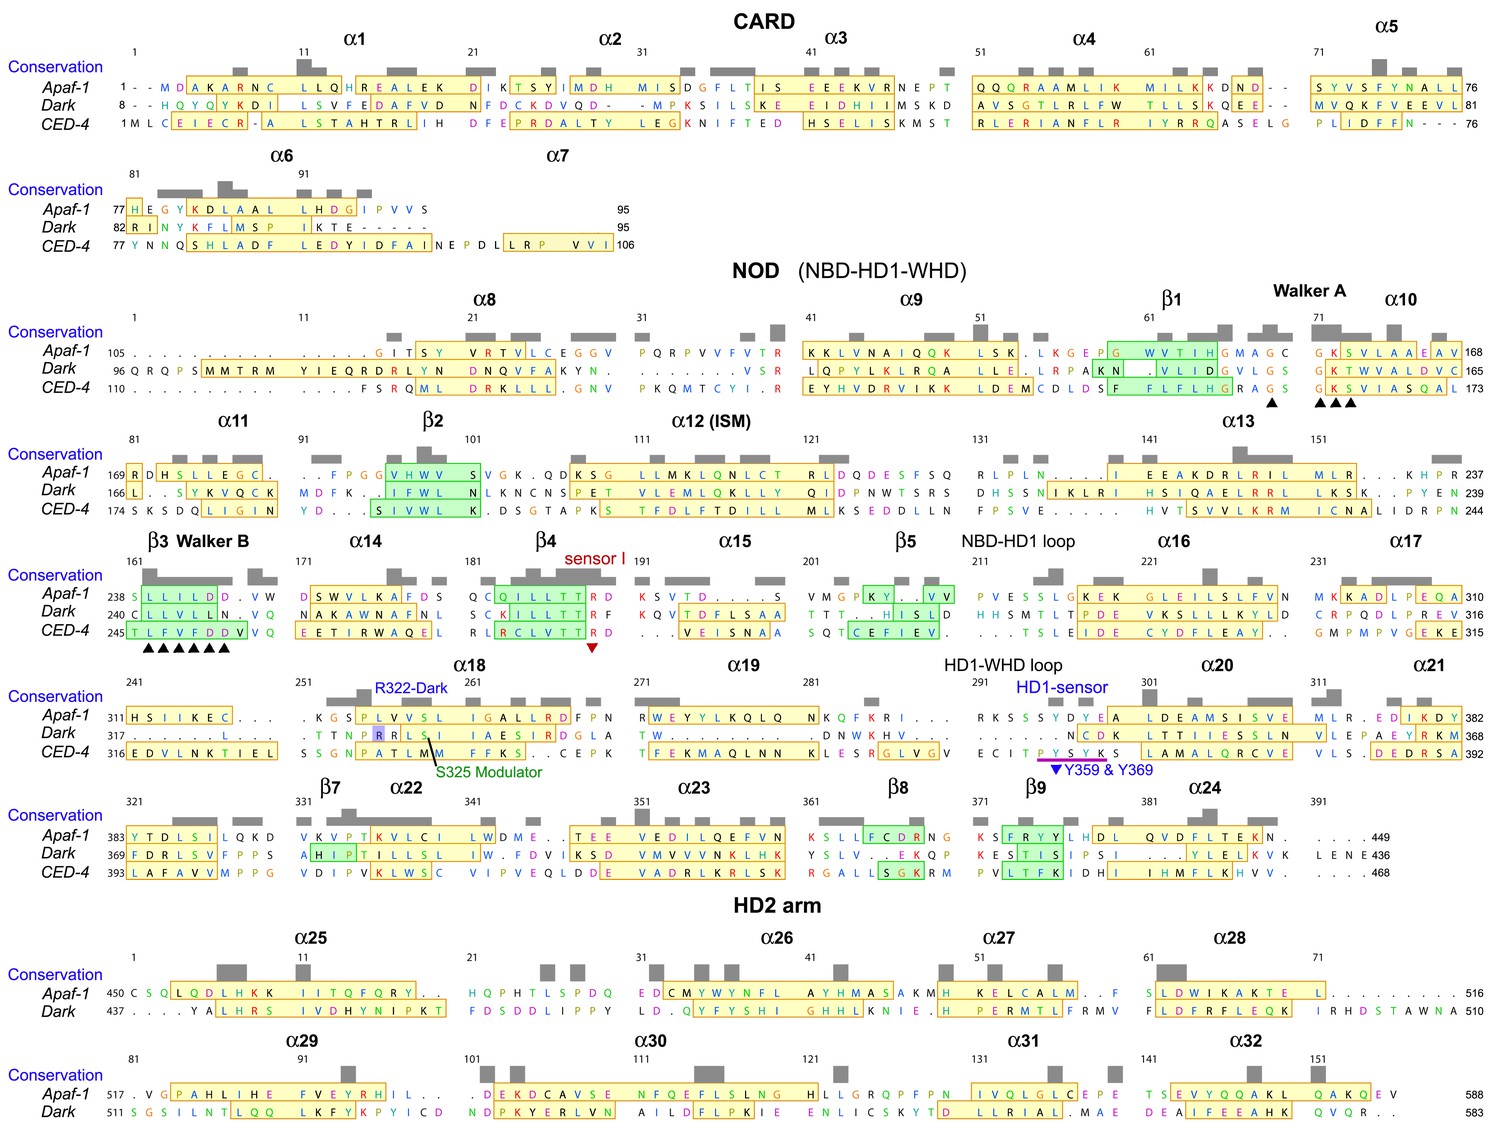
Sequence alignment for Apaf-1, Dark and CED-4 subunits from their respective apoptosomes, prepared in Chimera (Pettersen et al., 2004).
The truncated HD2 in CED-4 has been omitted. Note that helix α7 is only present in one subunit of the AB pair in the CED-4 crystal structure and creates a more compact CARD-NBD linker.
Figure 3

Interactions within the central hub.
(A) The central NBD ring and the outer HD1-WHD ring are shown as ribbons in a segmented map of the hub. (B, C) The α12-α13 helices and linker between them interact with other copies of this motif to form a cylindrical picket fence that lines the central pore (see pink dashed circle, ISM-ring). These features are shown with atomic interactions in the map. (D, E) The α12-loop-α13 motif is stabilized by an extended hydrophobic core and interacts with adjacent motifs in the ring through numerous hydrogen bonds and salt bridges. (F) An overview is shown of the outer HD1-WHD ring. (G, H) The HD1-WHD loop forms part of the dATP binding pocket and interacts with an extended region that replaces helix α15 in the NBD of an adjacent subunit. Possible interactions are indicated by dashed lines.
Figure 4 with 1 supplement
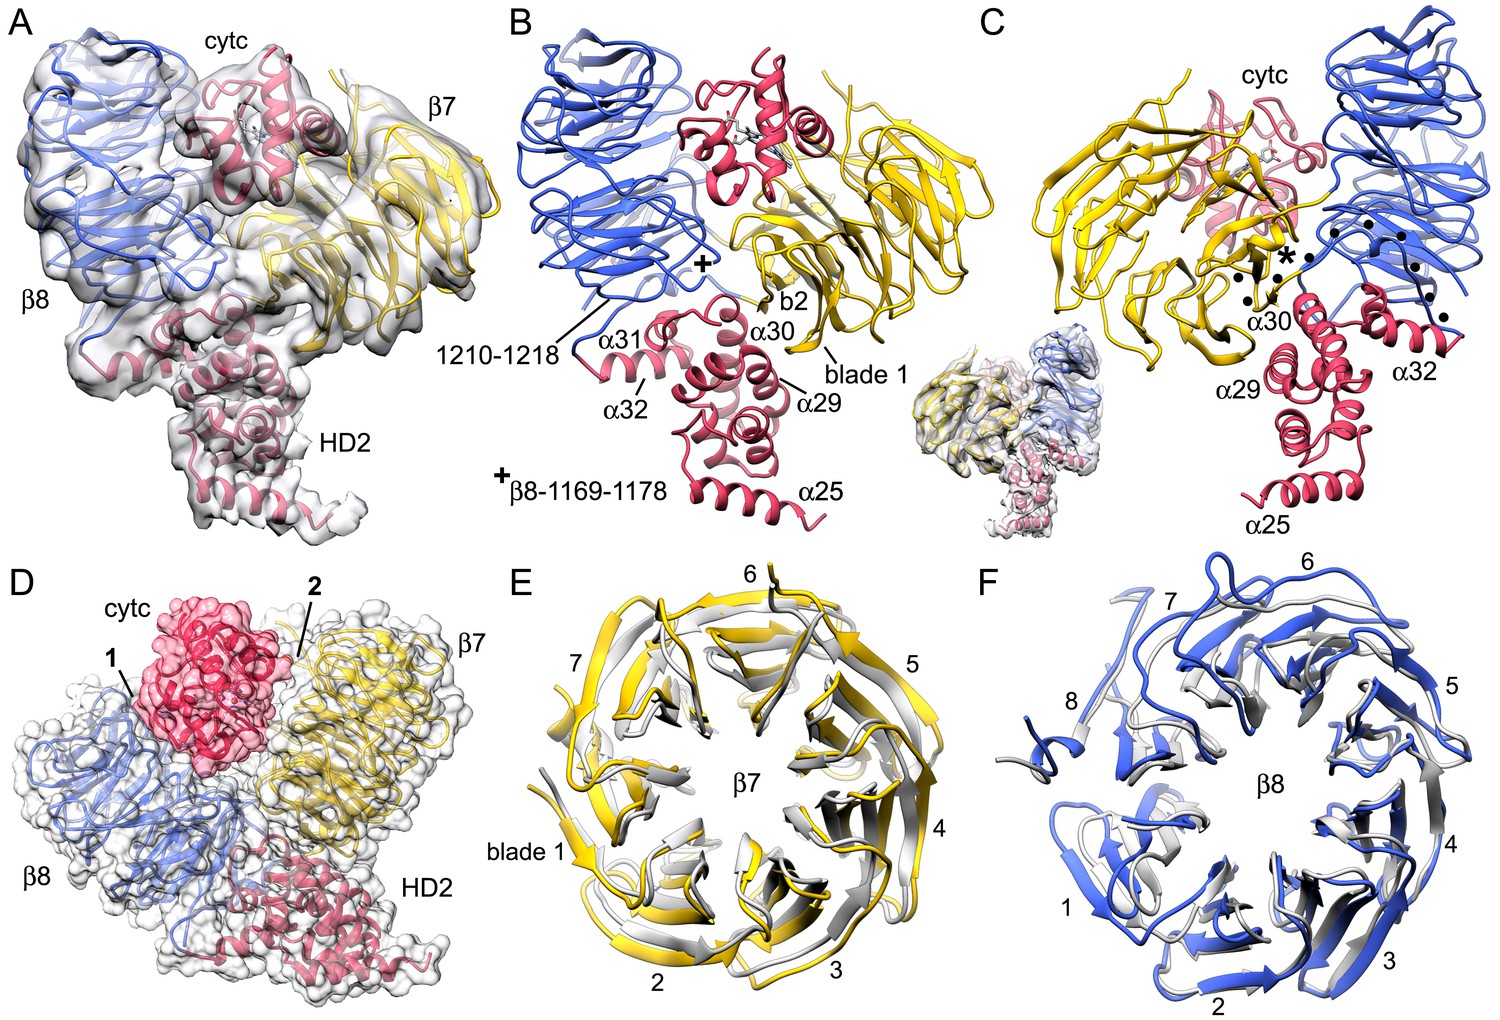
The sensor domain and interactions of β-propellers with cytochrome c.
(A, B) An overview of β-propellers, cytochrome c and HD2 arm is shown with and without the density map. This view is from the central hub. (C) A reverse view is shown of the sensor domain. The linker from HD2 to the 7-blade β-propeller is indicated with black dots. (D) A calculated molecular surface is shown for the sensor domain super-imposed on color coded ribbon models. Interfaces between cytochrome c and the β-propellers are marked 1 and 2. (E, F) The β-propellers are viewed along their pseudo-symmetry axes from within the V-shaped cleft. The β-propellers are overlayed with their counterparts (in grey) from the crystal structure of mouse Apaf-1. See also Figure 4—figure supplement 1.
Figure 4—figure supplement 1
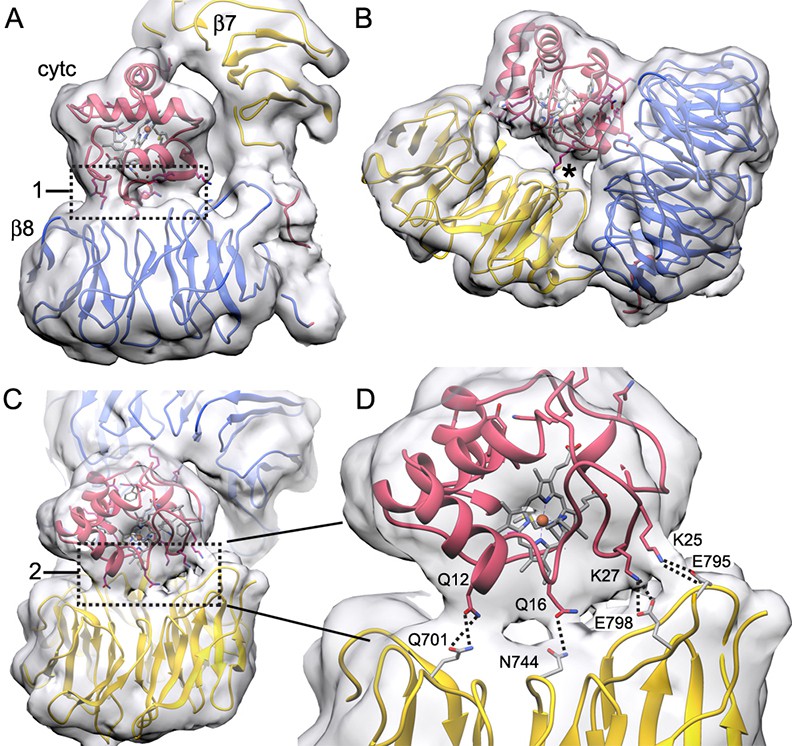
Connections between cytochrome c and the β-propellers.
(A–C) Contact regions are apparent at a lower density threshold and are indicated by boxed areas labeled with '1' and '2' respectively, while a smaller contact is marked with an asterisk (*). These regions contain lysine residues in cytochrome c that may extend outwards to help form these contacts. They include: Lys39, Lys55 and Lys73 in box 1; Lys72 and Lys79 (along with Trp884) in the smaller contact (*) and Lys25 and Lys27 in box 2. (D) An expanded view of box 2 shows four possible connections that can be modeled by hydrogen bonds and salt bridges between extended side chains, which cross the gap between cytochrome c and the 7-blade β-propeller. Higher resolution will be required to verify these interaction pairs.
Figure 5 with 2 supplements

dATP binding by Apaf-1 in the apoptosome.
(A) The dATP binding pocket lies between the NBD and HD1 and is formed in part by the Walker A loop and HD1-WHD loop. dATP is shown in ball and stick representation. (B) dATP is shown within the binding pocket overlayed with the density map. A few hydrogen bond and salt bridge indications are indicated by dashed lines. The HD1-WHD loop forms the bottom of the dATP binding pocket. (C) The binding pocket for the adenine base is formed mainly by hydrophobic residues, whose side chains are shown in ball and stick representation. (D) Interactions of dATP within the binding pocket are summarized in a schematic (see text for details). See also Figure 5—figure supplements 1, 2.
Figure 5—figure supplement 1
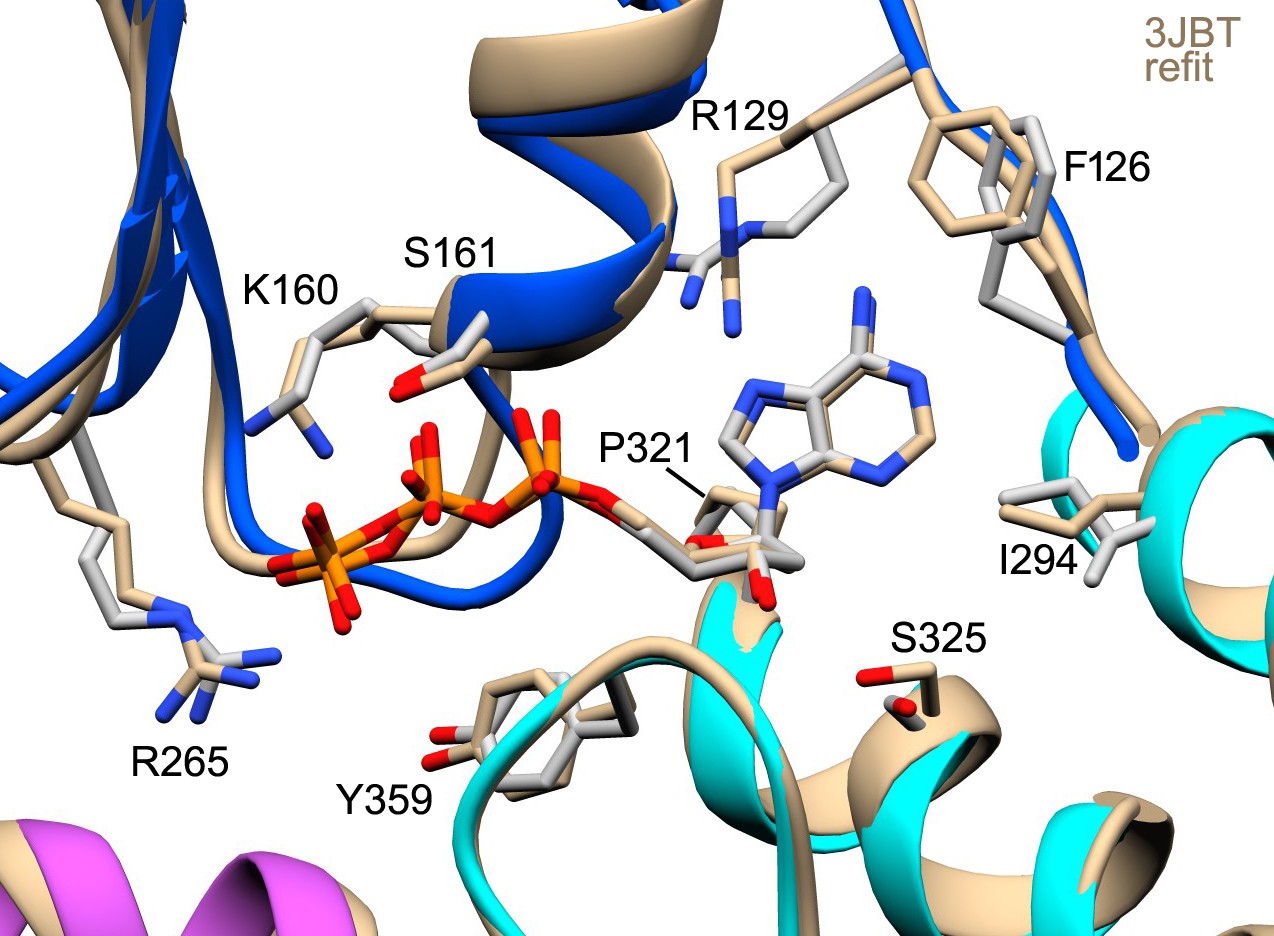
The anti conformer of dATP and the Apaf-1 subunit (PDB 3JBT; Zhou et al., 2015) were fit into the published apoptosome density map (EMD-6480) without a Mg+2 ion using real-space refinement with Phenix.
This produced a well fit structure (in tan) that overlays with our model for dATP. This suggests that the lower energy anti conformer is correct and supports a possible role for Ser325 as a modulator of nucleotide binding affinity.
Figure 5—figure supplement 2
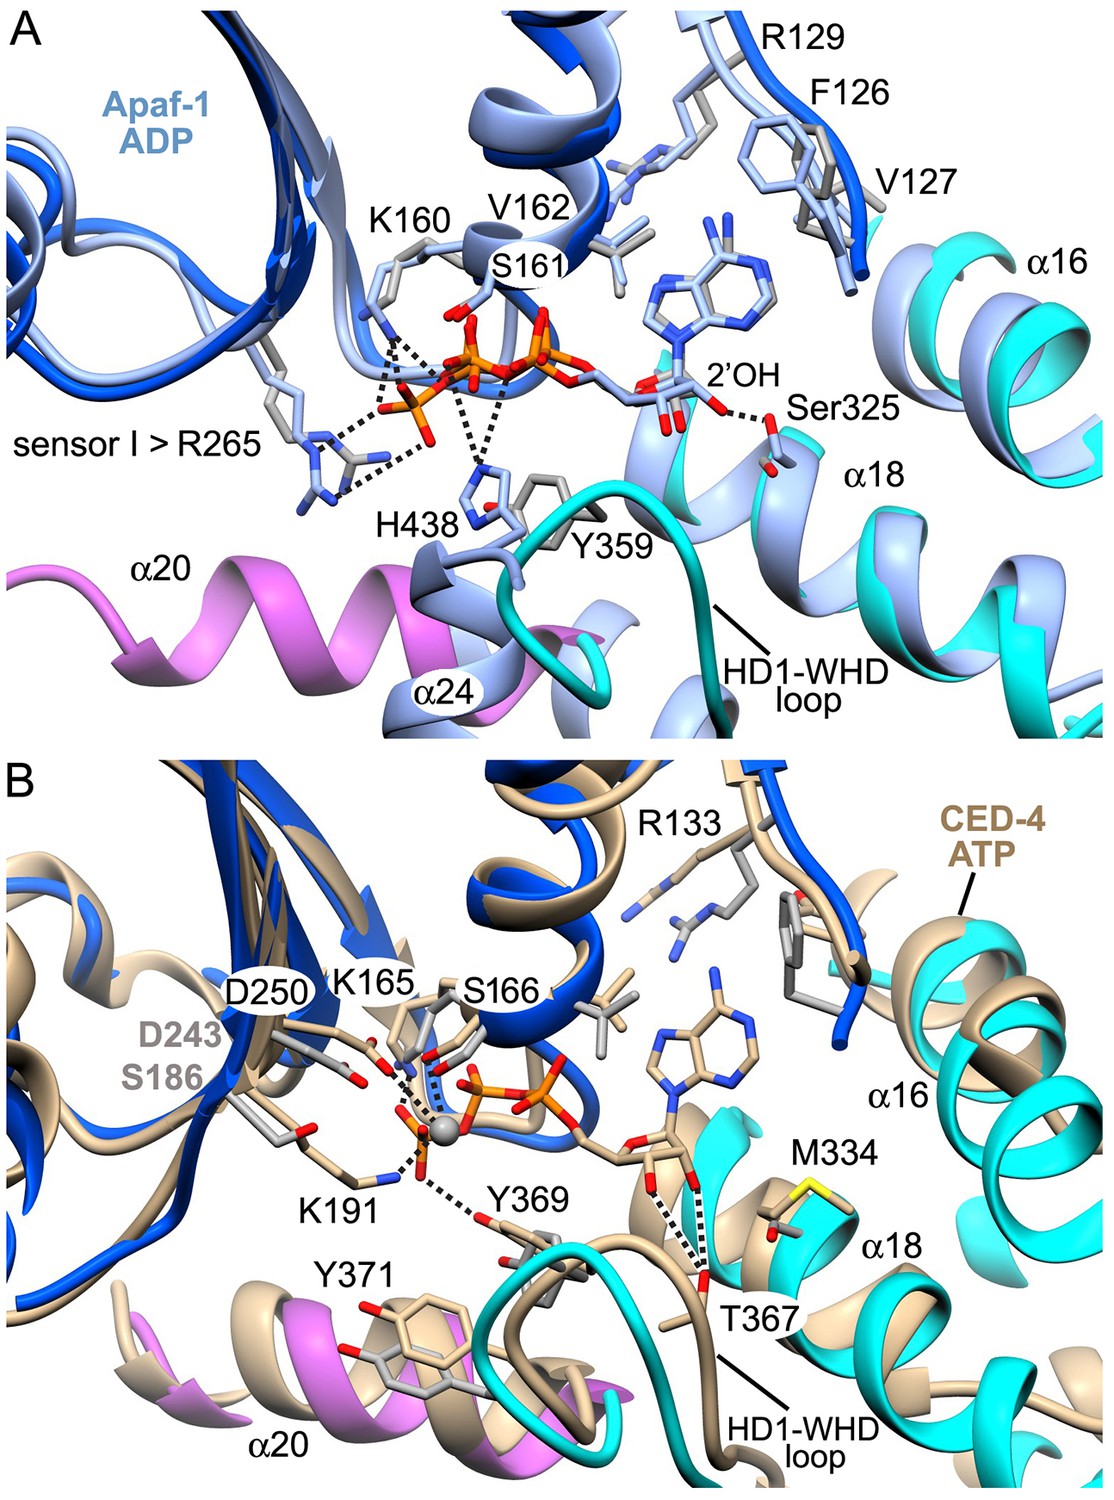
A comparison of nucleotide binding pockets.
(A) An overlay is shown for the Apaf-1 monomer with bound ADP (PDB 3SFZ; in light blue), aligned to Apaf-1 with dATP in the active apoptosome. An anti conformation is adopted by the adenine base in both structures. When ADP is bound Ser325 (the modulator) hydrogen bonds with the 2' OH on the ribose ring, whereas this residue interacts with the 3' OH when dATP is present. Intriguingly, the role of Tyr359 (in the HD1-WHD loop) in recognizing the γ-phosphate of dATP (and its relative position) are subsumed by His438 (in the WHD), which interacts with the β-phosphate of ADP in the closed configuration of Apaf-1. (B) The A-subunit from the crystal structure of the octameric CED-4 apoptosome (PDB 3LQQ) is overlayed with the Apaf-1 subunit with bound dATP. For clarity only the ATP molecule for CED-4 is shown in the binding site. In CED-4, a Mg+2 ion is bound and one ligand (Lys191) is replaced by Ser186 in Apaf-1 to weaken and possibly eliminate the binding site for this ion in the human complex. In addition, Met334 is present on helix α18 in CED-4; hence, Thr367 functionally replaces Ser325 and makes hydrogen bonds to both the 2' and 3' OH's of the ribose ring. A small repositioning of the HD1-WHD loop in CED-4 does not prevent Tyr369 (equivalent to Tyr359 in Apaf-1) from interacting with the γ-phosphate of ATP as an HD1 sensor.
Figure 6 with 1 supplement
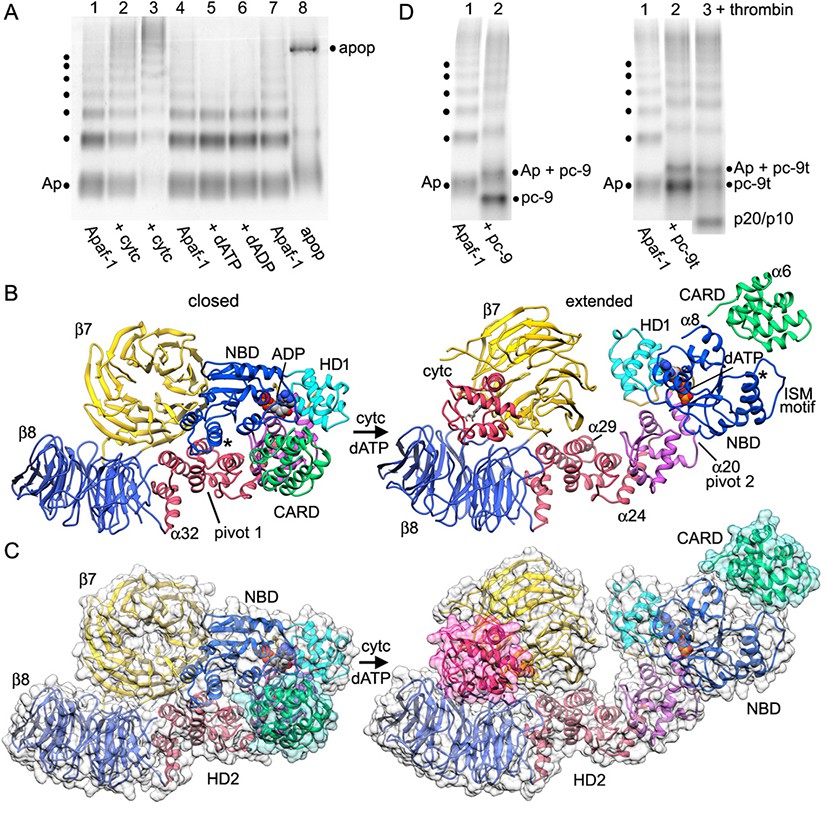
Apoptosome assembly.
(A) Band shift native gels: (lanes 1–4) interactions of cytochrome c with Apaf-1 create a shifted ladder and higher order aggregation (lane 3) in the absence of dATP; (lanes 4–7) dATP and dADP addition to Apaf-1 do not induce band shifts. The apoptosome is assembled when cytochrome c and dATP are both present (lane 8). (B) Ribbons cartoon showing the closed to extended transition for an Apaf-1 monomer triggered by cytochrome c and dATP binding during assembly. (C) Apaf-1 domains are shown enclosed within calculated surfaces for closed and extended conformations. Reorganization of the NOD creates an HD1-NBD-WHD triad that promotes lateral dimer and ring formation, while the CARD is repositioned to bind pc-9. (D) Band shift native gels demonstrate the accessibility of the Apaf-1 CARD to pc-9. Left panel (lanes 1,2): wild type pc-9 induces a band shift relative to Apaf-1 alone. Right panel (lanes 1–3): a pc-9 mutant with a thrombin site in the CARD-NBD linker also induces a band shift for Apaf-1 and thrombin cleavage releases the catalytic domain (p20/p10) to shift the bands backwards. However, the pc-9 CARD/Apaf-1 bands are still shifted relative to Apaf-1. See also Figure 6—figure supplement 1.
Figure 6—figure supplement 1
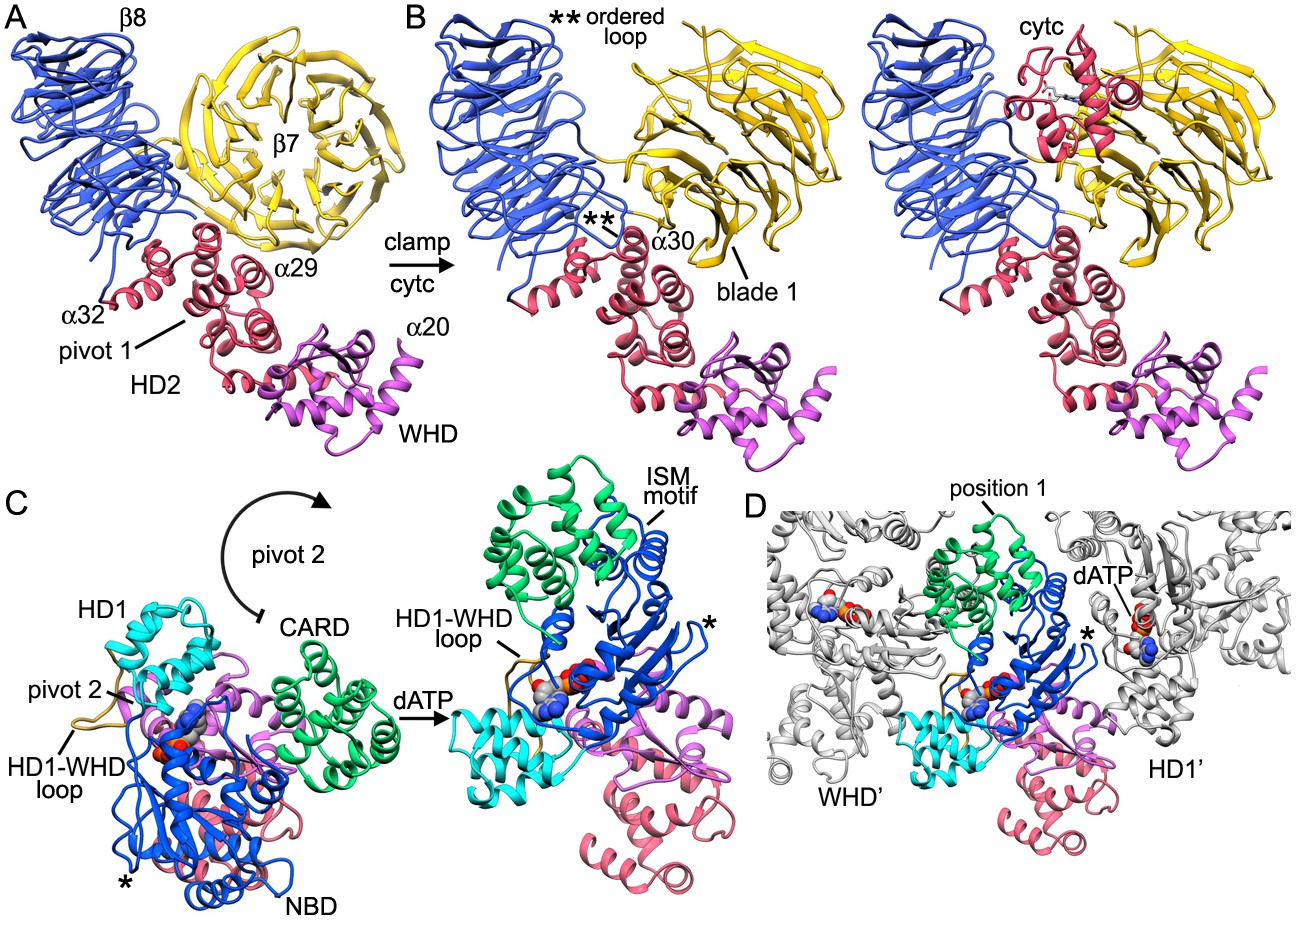
The V-shaped sensor domain undergoes a large conformational change upon cytochrome c binding.
(A,B) The 8-bladeb-propeller rotates in the plane and 4 helices of HD2 at the base of the sensor domain rotate slightly about pivot point 1 towards the V-shaped cleft, while the 7-bladeb-propeller swings about in a clamping motion to bind cytochrome c. (C) Concurrent with cytochrome c binding, theNBD, HD1 andCARDmust rotate about pivot point 2 near helixa20 to invert their orientations relative to the WHD. This large scale motion avoids a steric clash with the sensor domain and creates a more extended Apaf-1 molecule that may exchange boundADPmore readily. (D) The open conformation of the HD1-NBD-WHD triad creates an extended Apaf-1 that can form lateral dimers and rings. In panels C and D, an asterisk marks the position of a loop that replaces helixa15 in the NBD. During the transition from a closed to an extended conformation this loop undergoes a large scale movement and forms contacts with the HD1-WHD loop in an adjacent subunit (see also Figure 3G,H).
Figure 7
Formation of a CARD disk on the active apoptosome.
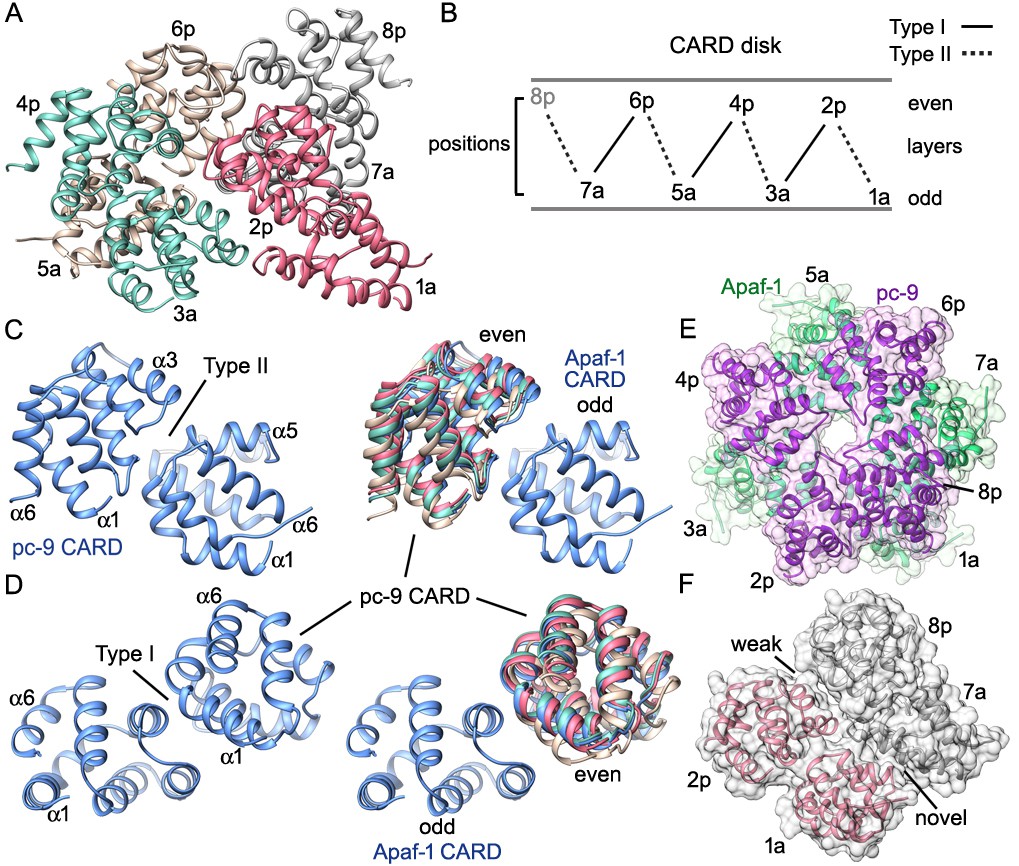
(A) A composite map of the active apoptosome reveals density for eight CARDs in the acentric disk shown in top, tilted and side views. Density for the pc-9 CARD in position 8p has been included, although it is present at lower occupancy. Apaf-1/pc-9 CARD pairs that share a Type II interface have been color-coded and Apaf-1 subunits that contribute an ordered CARD to the disk are indicated by color-coded arrow heads. Apaf-1 CARD-NBD linkers are shown in gold and the linker to CARD 7a is marked with a black dot. (B) Close-up views are shown of the CARD disk, viewed in three equi-spaced angular orientations about the center of the apoptosome. The α-helical nature of the CARDs is clearly visible along with the progressive tilt of the pairs as they spiral about the center of the disk. CARD pairs are rendered as surfaces and individual CARD positions are indicated (1a, 3a, 5a and 7a for Apaf-1; 2p, 4p, 6p and 8p for pc-9). Individual linkers are shown as segmented density in gold for the four Apaf-1 CARDs. (C) Similar views to panel B are shown, but as transparent surfaces with docked ribbon CARD models color-coded green for Apaf-1 and purple for pc-9. Only two CARD pairs are shown with ribbons in each panel to highlight their interactions. Some Type I and II interfaces are indicated. CARD-NBD linkers have been omitted for clarity.
Figure 8 with 1 supplement
CARD packing in the disk.
(A) A ribbons diagram of the disk is shown with color coded Apaf-1/pc-9 CARD pairs and individual positions labeled. (B) Schematic of CARD positions in the disk with Type I and II interfaces indicated. (C, D) Alignment of pc-9 CARDs relative to their respective Apaf-1 CARD in Type II and Type I interface pairs. The crystal structure pair (PDB 4RHW) is in blue. (E) Top view of the disk with a calculated surface. Individual CARD positions are indicated. (F) A side view of CARD pairs is shown at the junction between the first and fourth pair, where a dislocation is present in the spiral disk. A weak and quite open interface is present between adjacent pc-9 CARDs (2p, 8p) while adjacent Apaf-1 CARDs (1a, 7a) form a novel interface. See also Figure 8—figure supplement 1.
Figure 8—figure supplement 1
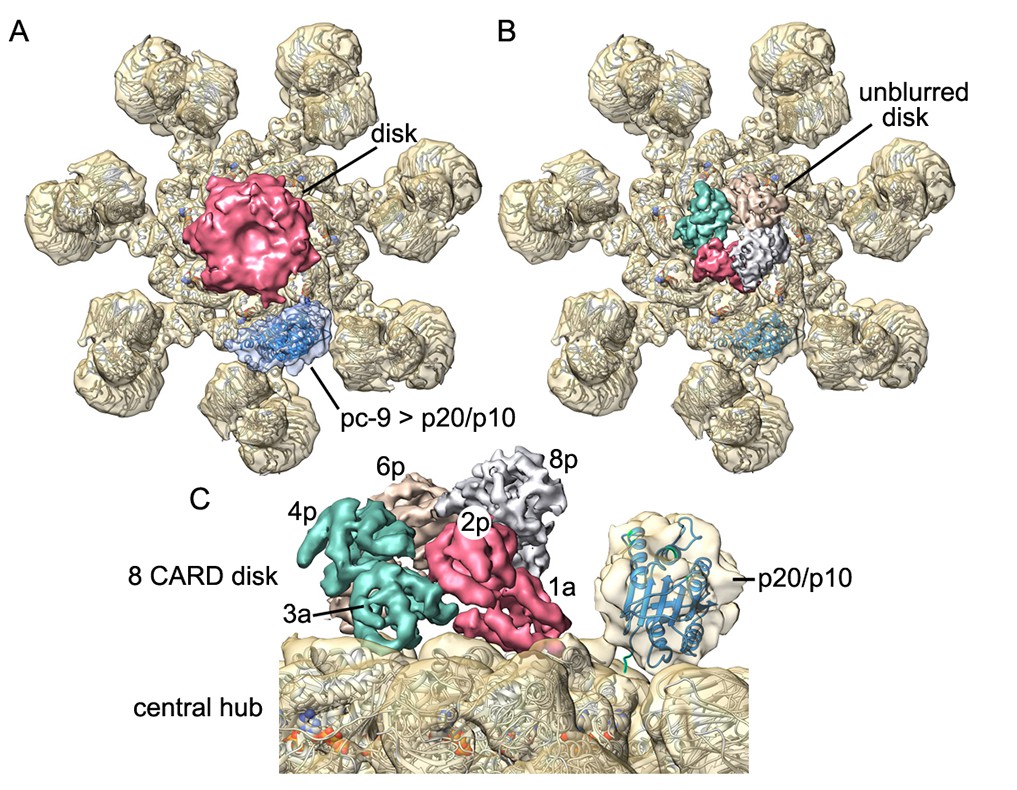
Catalytic domains of pc-9 are parked on the central hub of the active apoptosome.
(A) A top view is shown of the active apoptosome after c1 refinement in EMAN2. A blurred, yet acentric and tilted disk is resolved (magenta), along with density for catalytic domains of a single pc-9 (in blue). The final model for the platform (grey ribbons) is docked into the semi-transparent map. (B) A view similar to panel B is shown with the unblurred 8-CARD disk superimposed onto the platform of the aligned c1 density map after aligning with the composite 3D map. Catalytic domains of pc-9 are docked on the NBD ring of the central hub, at a position with the most lateral room created by acentric positioning of the disk. (C) A close-up is shown of the acentric and tilted 8-CARD disk and catalytic domains of a single pc-9 are docked into the density. The most favored position for the catalytic domains is adjacent to the pc-9 CARD at position 2p (but see text). For this depiction, five pc-9 molecules would be bound to the apoptosome with four pc-9 and four Apaf-1 CARDs in the 8 CARD disk. Apaf-1 CARD-NBD linkers are not shown.
Figure 9
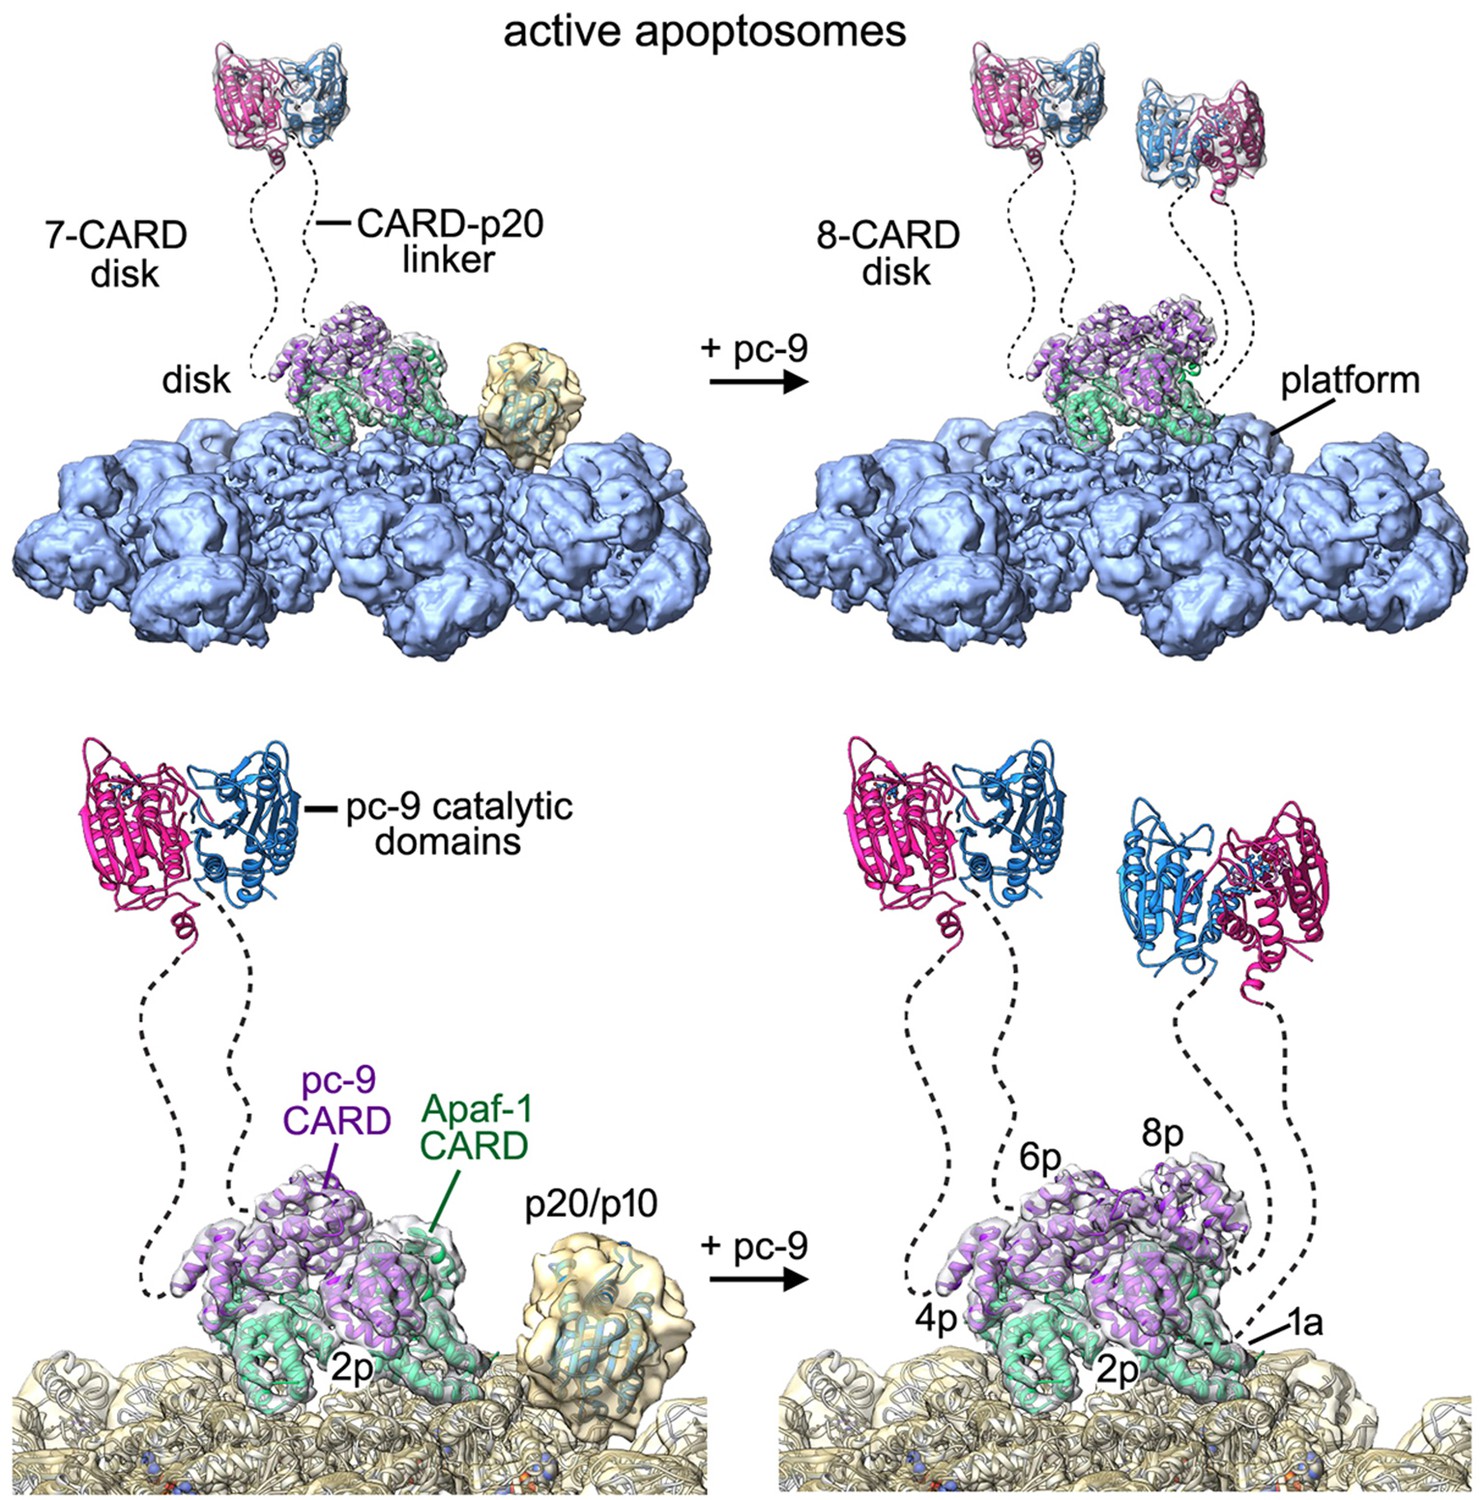
Models of the active apoptosome.
In these models, procaspase-9 dimers (PDB 1JXQ) are flexibly-tethered to the CARD disk and may represent the activated enzyme. CARD-p20/p10 linkers are shown as dashed lines, and are drawn roughly to scale for their length. The number of possible pc-9 dimers in the active apoptosome may vary as a function of the number of pc-9 molecules tethered to the disk, with an odd number of zymogens creating parked catalytic domains for a single pc-9. For each panel, the top figure shows the entire active complex while the bottom figure shows a zoomed in view of the disk and central hub. Left panels: apoptosome with 3 bound pc-9 molecules and a 7 CARD disk; right panels: an active complex with 4 bound pc-9 molecules and an 8 CARD disk. Note that 4 Apaf-1 CARDs are always present in the CARD disk. For clarity the Apaf-1 CARD-NBD linkers are not shown.
Videos
Video 1
Conformational change of the Apaf-1 monomer during assembly.
This video shows a morph between a model of the closed Apaf-1 molecule and the extended conformation that forms the apoptosome. During this process cytochrome c is bound between the β-propellers and dATP is then exchanged for bound ADP.
Video 2
Structure and assembly of the c7 platform and spiral CARD disk in the human apoptosome.
This video documents a model for the stepwise assembly of a c7 platform from Apaf-1 subunits containing the NOD, HD2 arm and β-propellers. The presentation then focuses on the structure and molecular docking of Apaf-1 and pc-9 CARDs within the acentric, quasi-helical disk, which sits atop the platform.
Download links
A two-part list of links to download the article, or parts of the article, in various formats.
Downloads (link to download the article as PDF)
Open citations (links to open the citations from this article in various online reference manager services)
Cite this article (links to download the citations from this article in formats compatible with various reference manager tools)
A near atomic structure of the active human apoptosome
eLife 5:e17755.
https://doi.org/10.7554/eLife.17755


