Exosome complex orchestrates developmental signaling to balance proliferation and differentiation during erythropoiesis
- University of Wisconsin School of Medicine and Public Health, United States
Figures
Figure 1 with 1 supplement
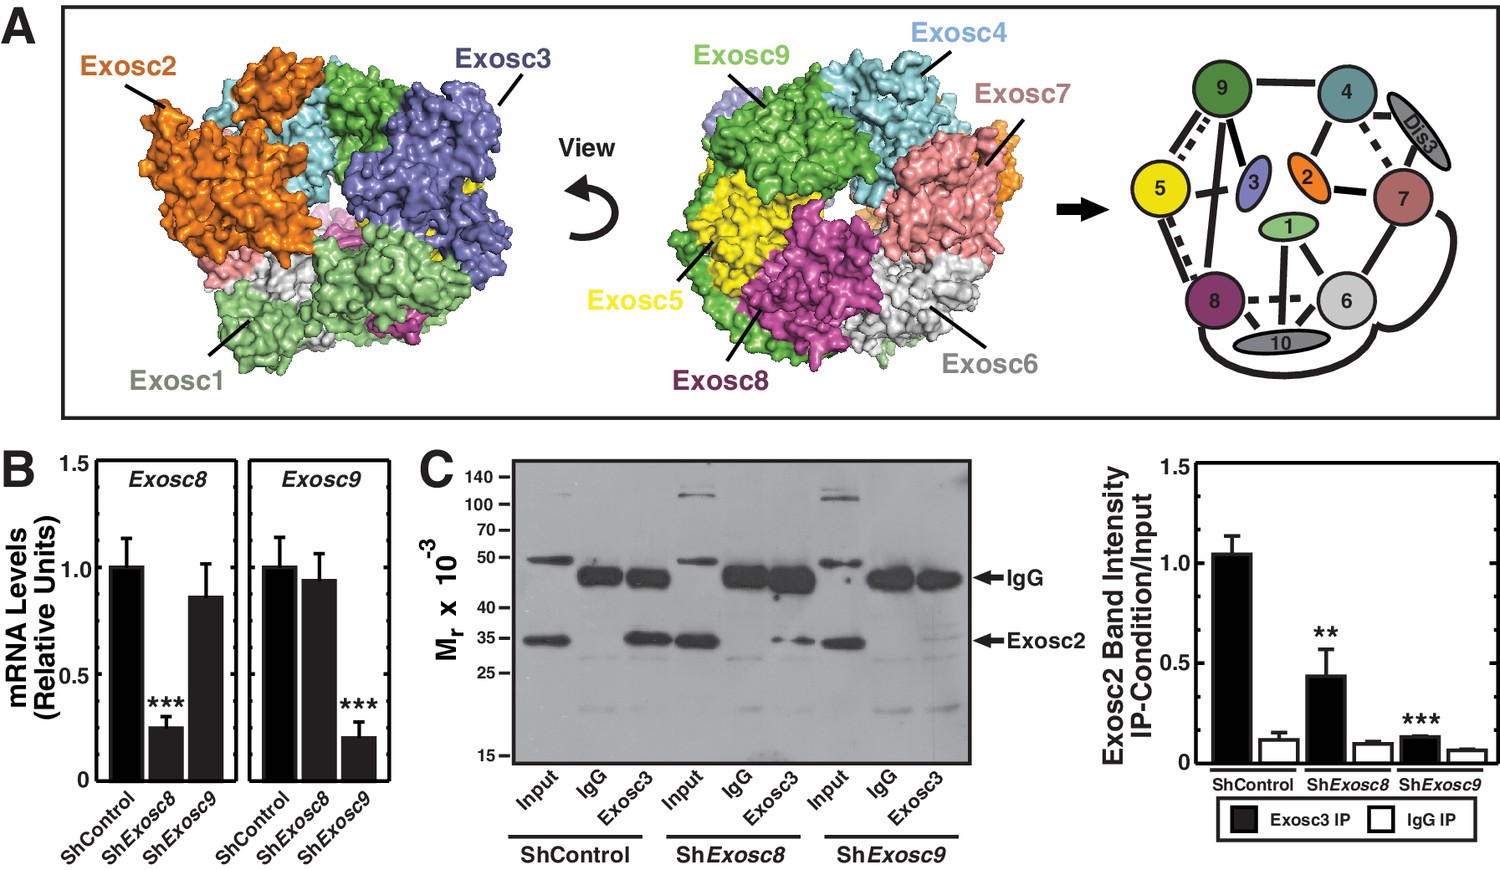
Exosc8 or Exosc9 downregulation disrupts protein-protein interactions within the exosome complex.
(A) Crystal structure and model of the human exosome complex (Liu et al., 2006). Solid line, direct interactions; Dashed line, indirect interactions. (B) Real-time RT-PCR analysis of mRNA expression (mean ± SE, 3 independent replicates) in G1E-ER-GATA-1 cells 48 hr post-infection with either Exosc8 or Exosc9 shRNA expressing retrovirus. Values normalized to 18S expression and relative to the control. (C) Left: representative image of a semi-quantitative Western blot of Exosc2 co-immunoprecipitated with anti-Exosc3 antibody in G1E-ER-GATA-1 whole cell lysates prepared 48 hr post-Exosc8 or Exosc9 knockdown. Right: densitometric analysis of band intensity relative to the input for each knockdown condition (mean ± SE, 3 independent replicates). Statistical analysis of control and treatment conditions was conducted with the Student’s T-test. *p<0.05, **p<0.01, ***p<0.001. Source data is available in Figure 1—source data 1.
-
Figure 1—source data 1
This Excel spreadsheet contains the values of each independent replicate for data presented as histograms (mean ± SE) in Figure 1.
- https://doi.org/10.7554/eLife.17877.004
Figure 1—figure supplement 1
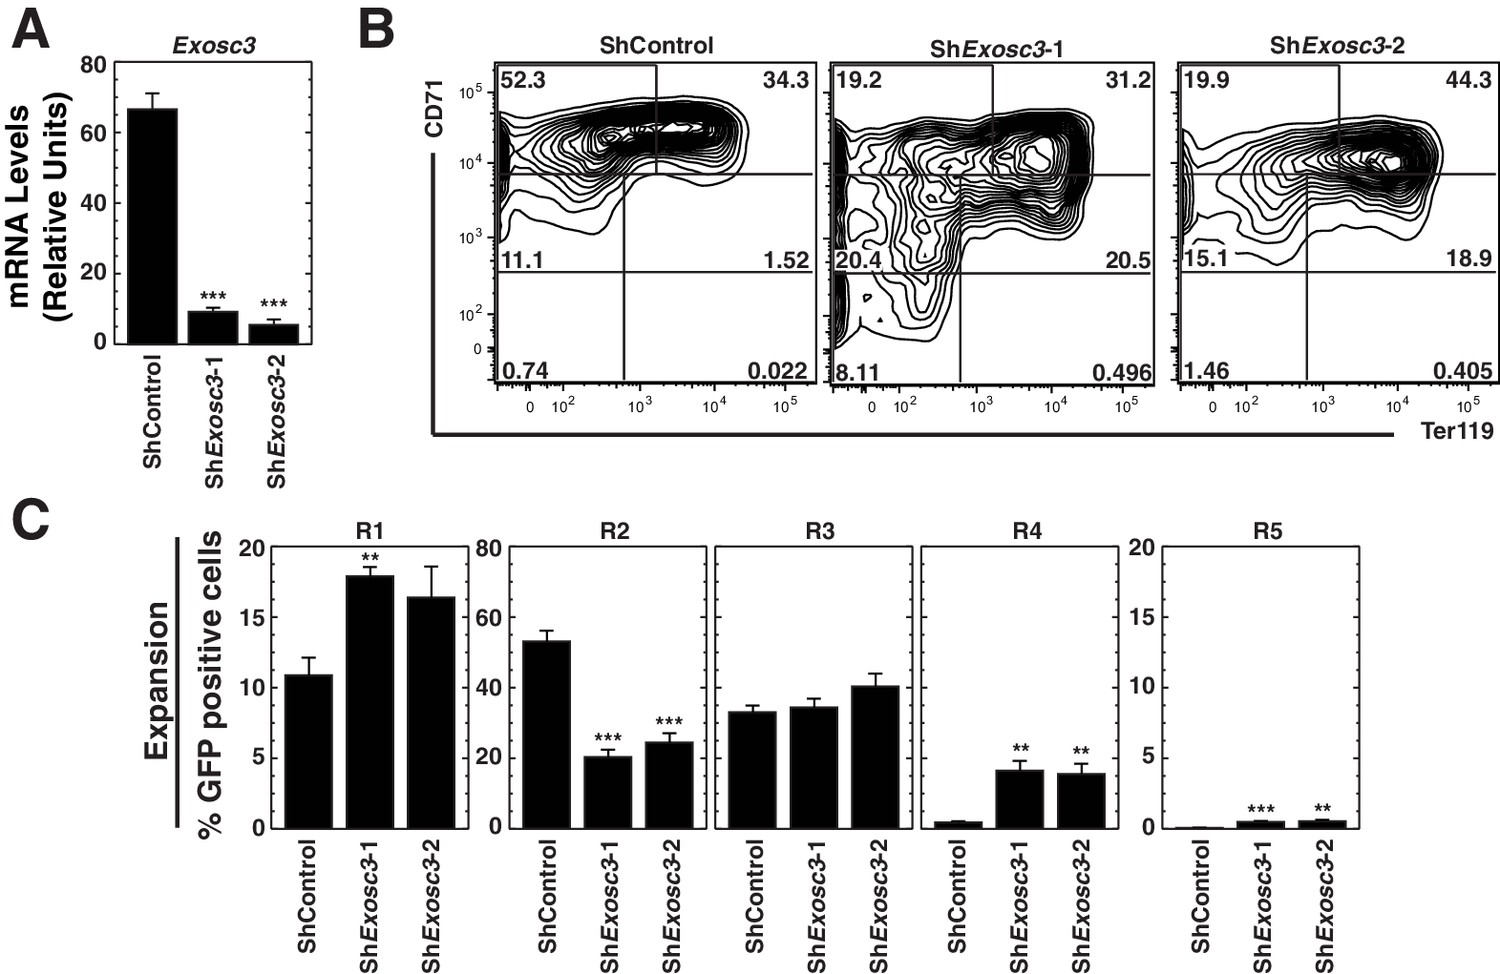
The RNA binding exosome complex component Exosc3 suppresses erythroid maturation.
(A) qRT-PCR analysis of Exosc3 mRNA in primary erythroid precursor cells 72 hr post-infection with shRNA-expressing retrovirus (mean ± SE, 5 biological replicates). Values are normalized to 18S expression and relative to the control. (B) Erythroid maturation analyzed by flow cytometric quantitation CD71 and Ter119 staining 72 hr post-Exosc3 knockdown in primary erythroid precursor cells. Representative flow cytometry plots, with the R1-R5 gates denoted (5 biological replicates). (C) Percentage of primary erythroid precursor cells in R1-R5 populations 72 hr after Exosc3 knockdown (mean ± SE, 5 biological replicates). Statistical analysis of control and treatment conditions was conducted with the Student’s T-test. *p<0.05, **p<0.01, ***p<0.001.
Figure 2
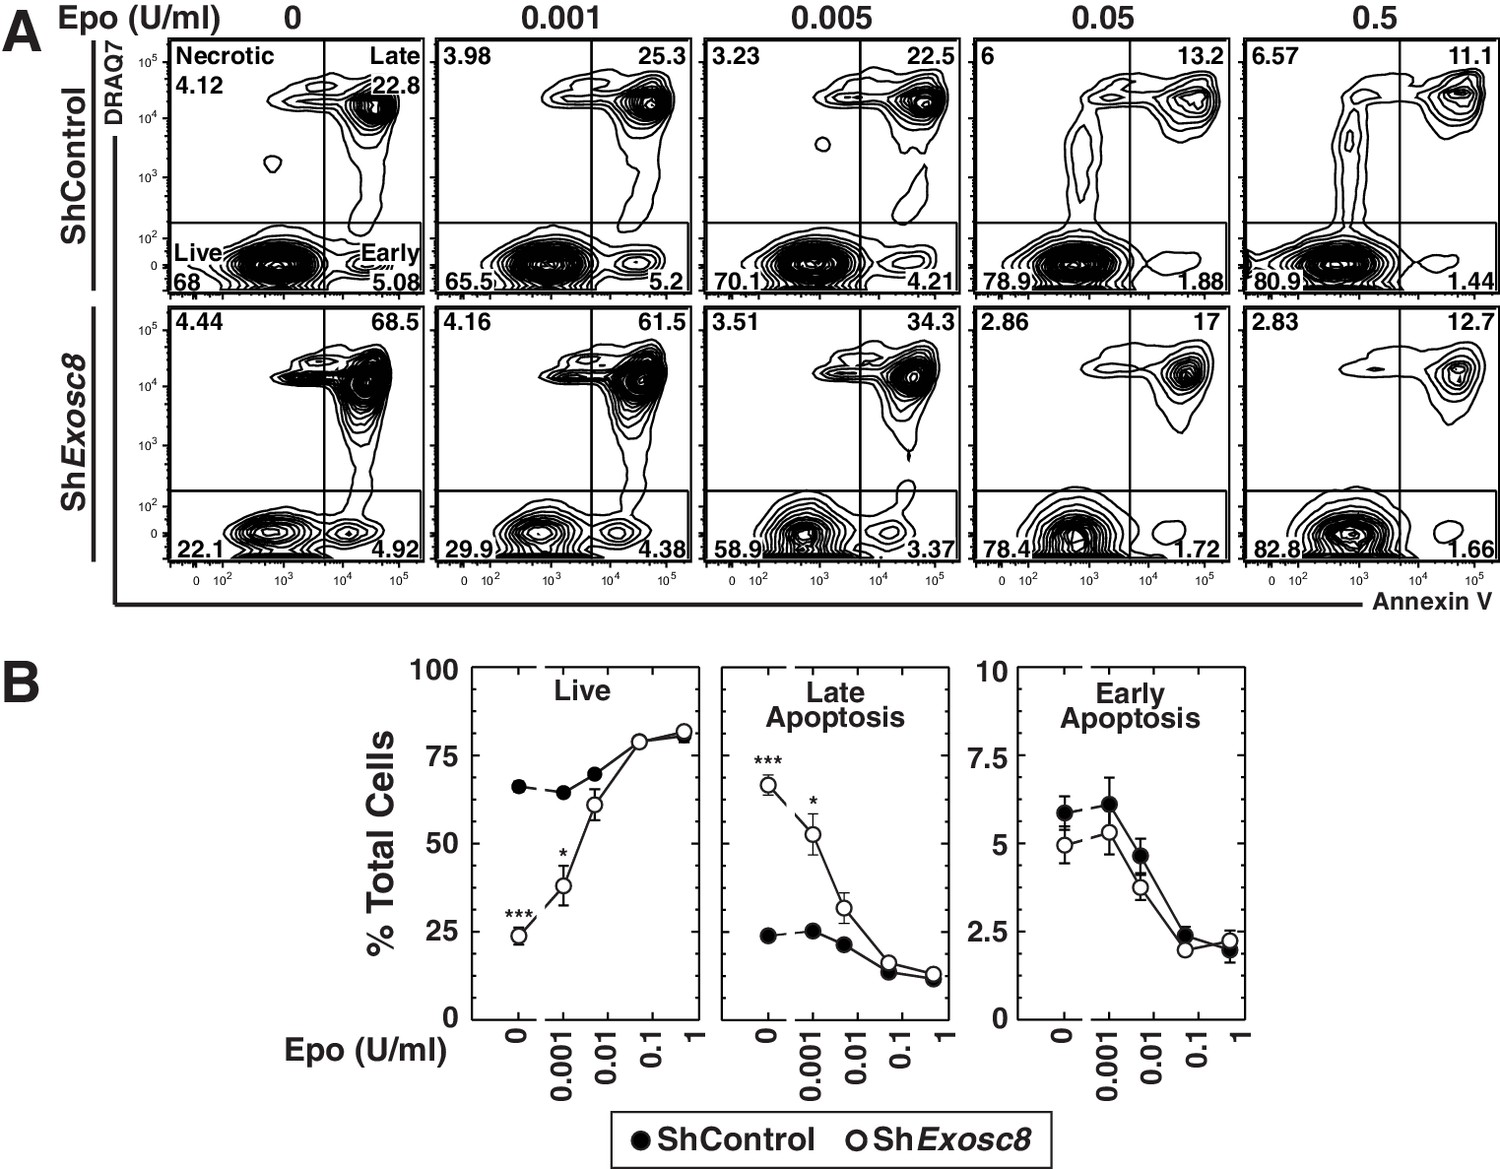
Exosome complex disruption renders primary erythroid cells hypersensitive to limiting erythropoietin concentrations.
(A) Flow cytometric analysis with Annexin V and the membrane-impermeable dye DRAQ7 to quantitate apoptosis with control and Exosc8-knockdown primary erythroid cells expanded for 48 hr under Epo-limiting conditions. (B) Quantification of the percentage of primary erythroid cells in live, late and early apoptotic populations (mean ± SE, 4 biological replicates). Statistical analysis of control and treatment conditions was conducted with the Student’s T-test. *p<0.05, **p<0.01, ***p<0.001. Source data is available in Figure 2—source data 1.
-
Figure 2—source data 1
This Excel spreadsheet contains the values of each biological replicate for data presented as line graphs (mean ± SE) in Figure 2.
Sheet 1: Figure 2B percentage of cells from each biological replicate found in the live, early apoptotic, late apoptotic and necrotic flow cytometry gates in control and Exosc8 knockdown cells after 48 hr culture under Epo-limiting conditions.
- https://doi.org/10.7554/eLife.17877.007
Figure 3 with 1 supplement
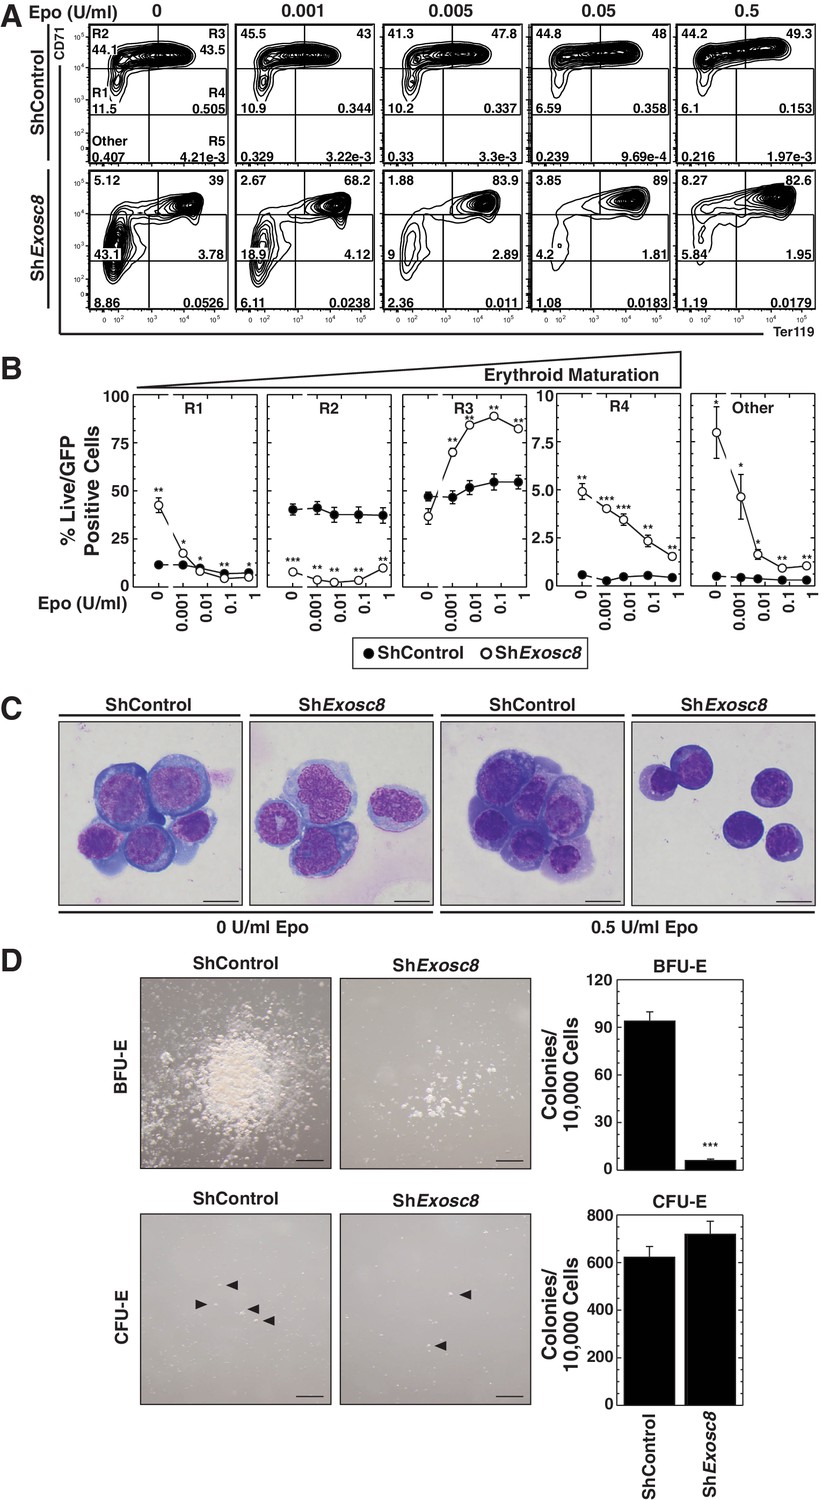
Erythropoietin is required for erythroid differentiation induced by disrupting the exosome complex.
(A) Flow cytometric quantification of erythroid markers CD71 and Ter119 in live control and Exosc8-knockdown erythroid precursor cells cultured for 48 hr in Epo-limiting media. Representative plots with R1-R5 gates denoted. (B) Quantitation of the percentage of live cells in control and Exosc8-knockdown conditions from the R1-R4 and non erythroid gates (mean ± SE, 4 biological replicates). (C) Representative images of Wright-Giemsa-stained, DRAQ7-negative erythroid precursor cells, infected with control or ShExosc8 retrovirus. Cells were cultured with or without Epo for 48 hr (Scale bar, 10 μm). (D) Representative images (left) and quantitation (right) of erythroid colony forming unit activity with FACS-sorted R1 cells 24 hr after Exosc8 knockdown (mean ± SE, 6 biological replicates) (Scale bar 200 μm). Statistical analysis of control and treatment conditions was conducted with the Student’s T-test. *p<0.05, **p<0.01, ***p<0.001. Source data is available in Figure 3—source data 1.
-
Figure 3—source data 1
This Excel spreadsheet contains the values for each biological replicate for data presented as either line graphs or histograms (mean ± SE) in Figure 3.
- https://doi.org/10.7554/eLife.17877.009
Figure 3—figure supplement 1
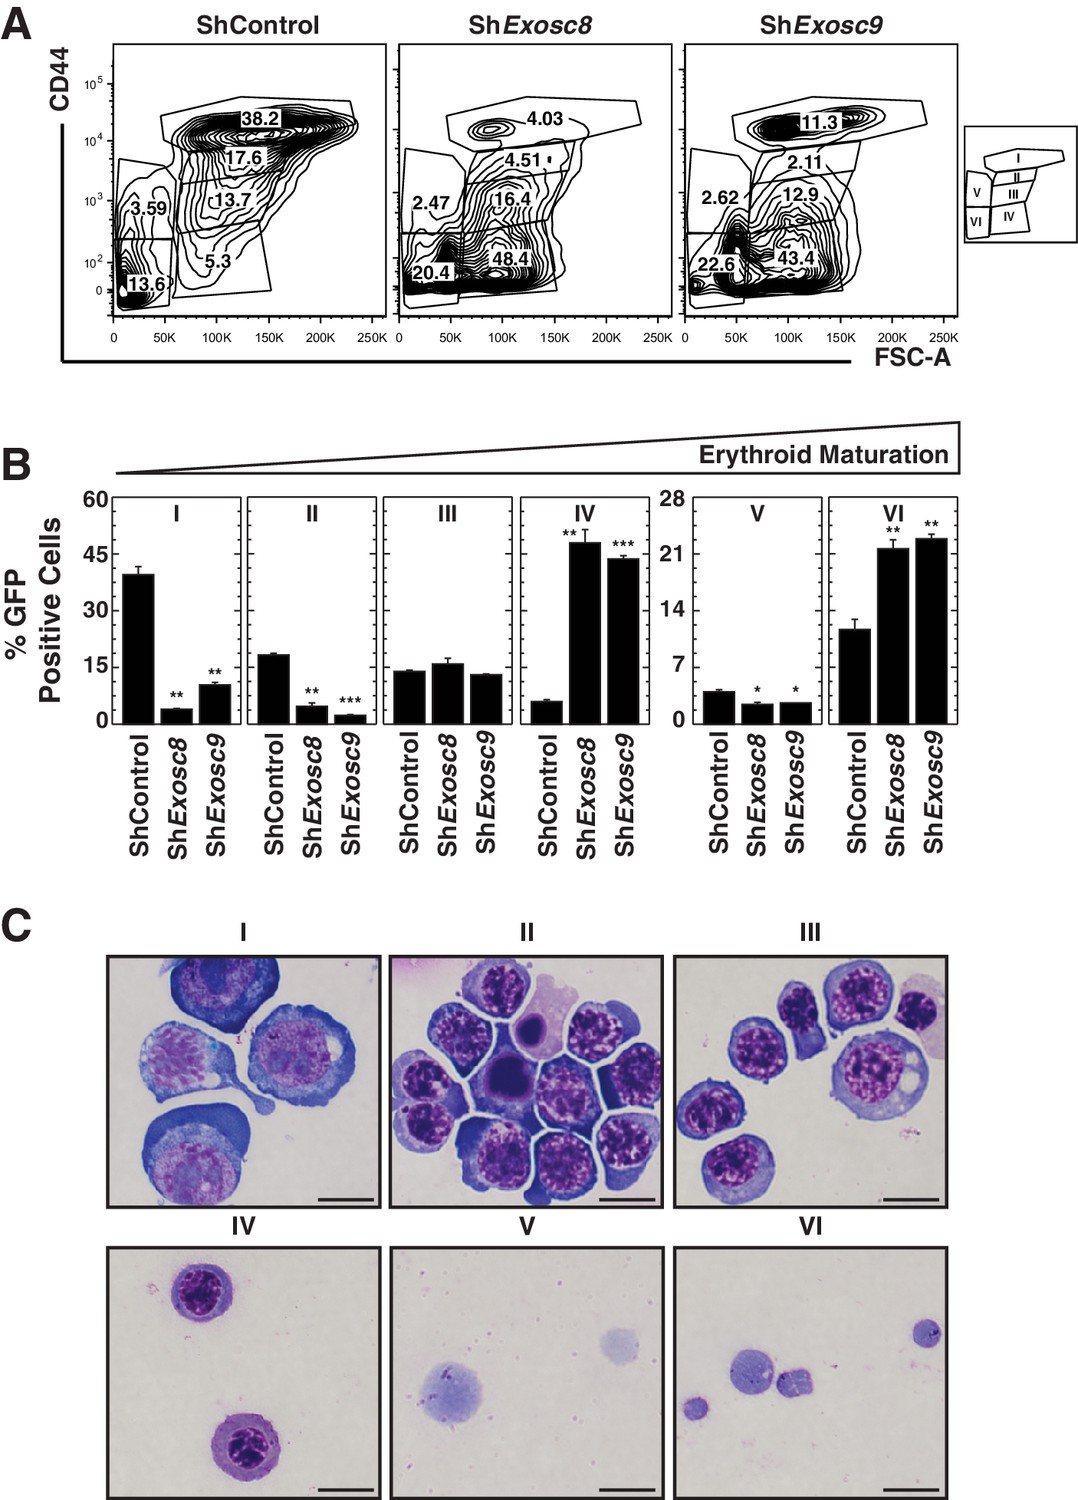
Analysis of the exosome complex-mediated erythroid maturation barricade using a distinct flow cytometric assay.
(A) Erythroid maturation of primary erythroid precursor cells 72 hr post-infection with shExosc8- or shExosc9-expressing retroviruses analyzed by flow cytometric quantification of CD44 and side scatter (SSC). Representative flow cytometry plots with gates I to VI are depicted. (B) Percentage of erythroid cells detected in gates I through VI (3 biological replicates, mean ± SE). (C) Representative images of Wright-Giemsa-stained erythroid cells from the sorted, gated (I-IV) populations under control conditions (Scale bar, 10 μm). Statistical analysis of control and treatment conditions was conducted with the Student’s T-test. *p<0.05, **p<0.01, ***p<0.001.
Figure 4 with 1 supplement
Exosome complex sustains proliferation signaling, while suppressing pro-differentiation signaling.
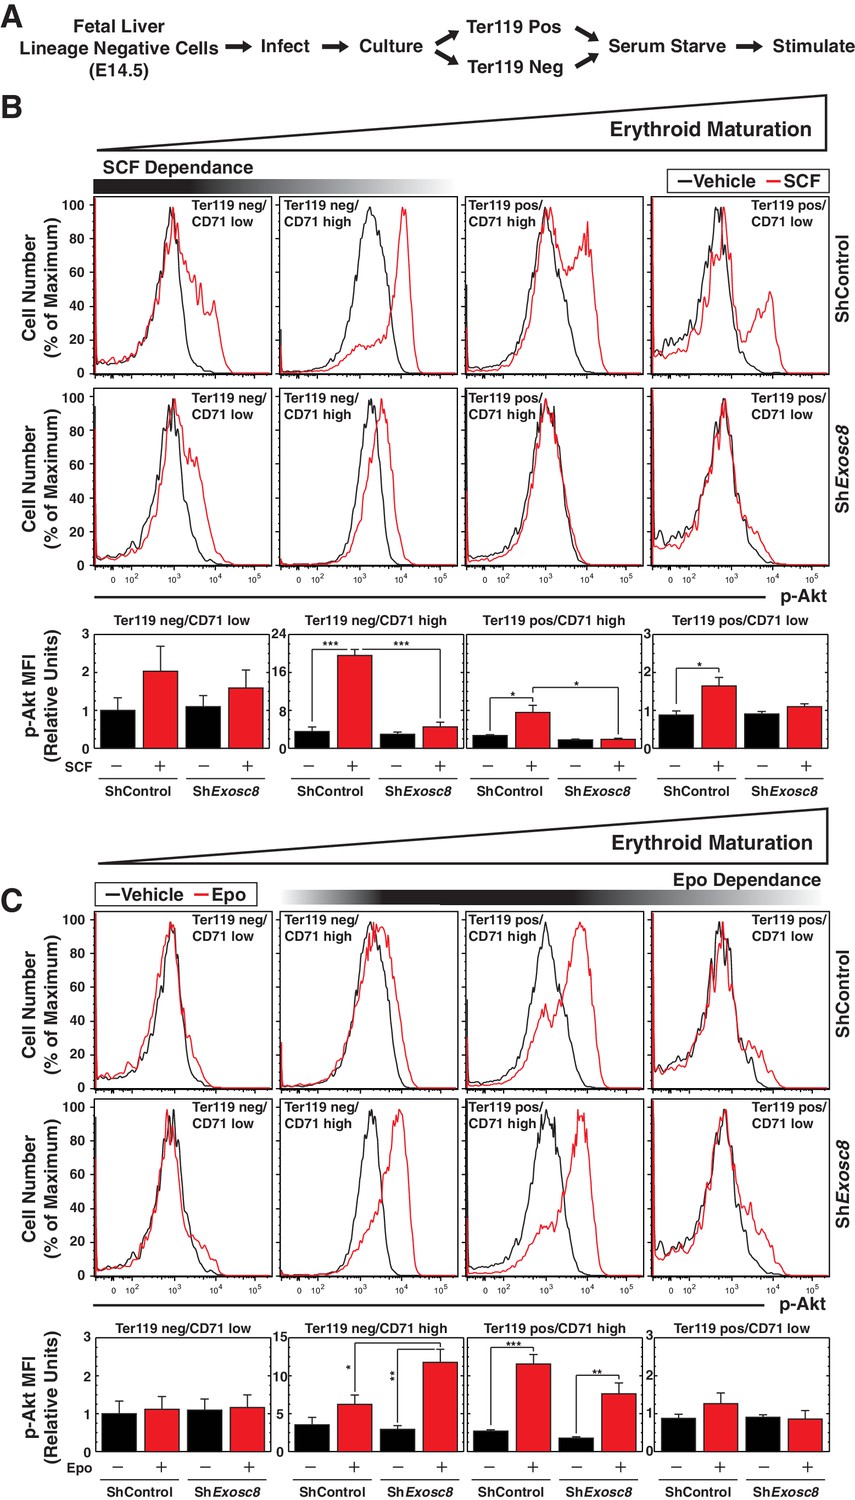
(A) Experimental scheme: lineage-negative cells were isolated from E14.5 fetal livers, and infected with luciferase or Exosc8 shRNAs. Cells were cultured for 48 hr and sorted into Ter119+ and Ter119- populations using beads. After 1 hr of serum-starvation, cells were stimulated for 10 min with 10 ng/ml SCF or 2 U/ml Epo and fixed/permeabilized before staining for CD71 and p-Akt. (B) Top: p-Akt staining after stimulation with 10 ng/ml SCF in control and Exosc8-knockdown cells (6 biological replicates). Bottom: Relative p-Akt MFI after stimulation with 10 ng/ml SCF in control and Exosc8-knockdown cells. MFI expressed relative to unstimulated Ter119-/CD71low control (mean ± SE, 6 biological replicates). (C) Top: p-Akt staining after stimulation with 2 U/ml EPO in control and Exosc8-knockdown cells (6 biological replicates). Bottom: Relative p-Akt MFI after stimulation with 2 U/ml Epo in control and Exosc8-knockdown cells. MFI expressed relative to unstimulated Ter119-/CD71low control (mean ± SE, 6 biological replicates). ANOVA identified any significant variation within the experiment, and a Tukey-Kramer test identified the statistical relationship between each pair of samples. *p<0.05, **p<0.01, ***p<0.001. Source data is available in Figure 4—source data 1.
-
Figure 4—source data 1
This Excel spreadsheet contains the values for each biological replicate for data presented as histograms (mean ± SE) in Figure 4.
Sheet 1: Figure 4A and B p-Akt MFI after 10 min stimulation with either SCF or Epo 48 hr post-Exosc8 knockdown.
- https://doi.org/10.7554/eLife.17877.012
Figure 4—figure supplement 1
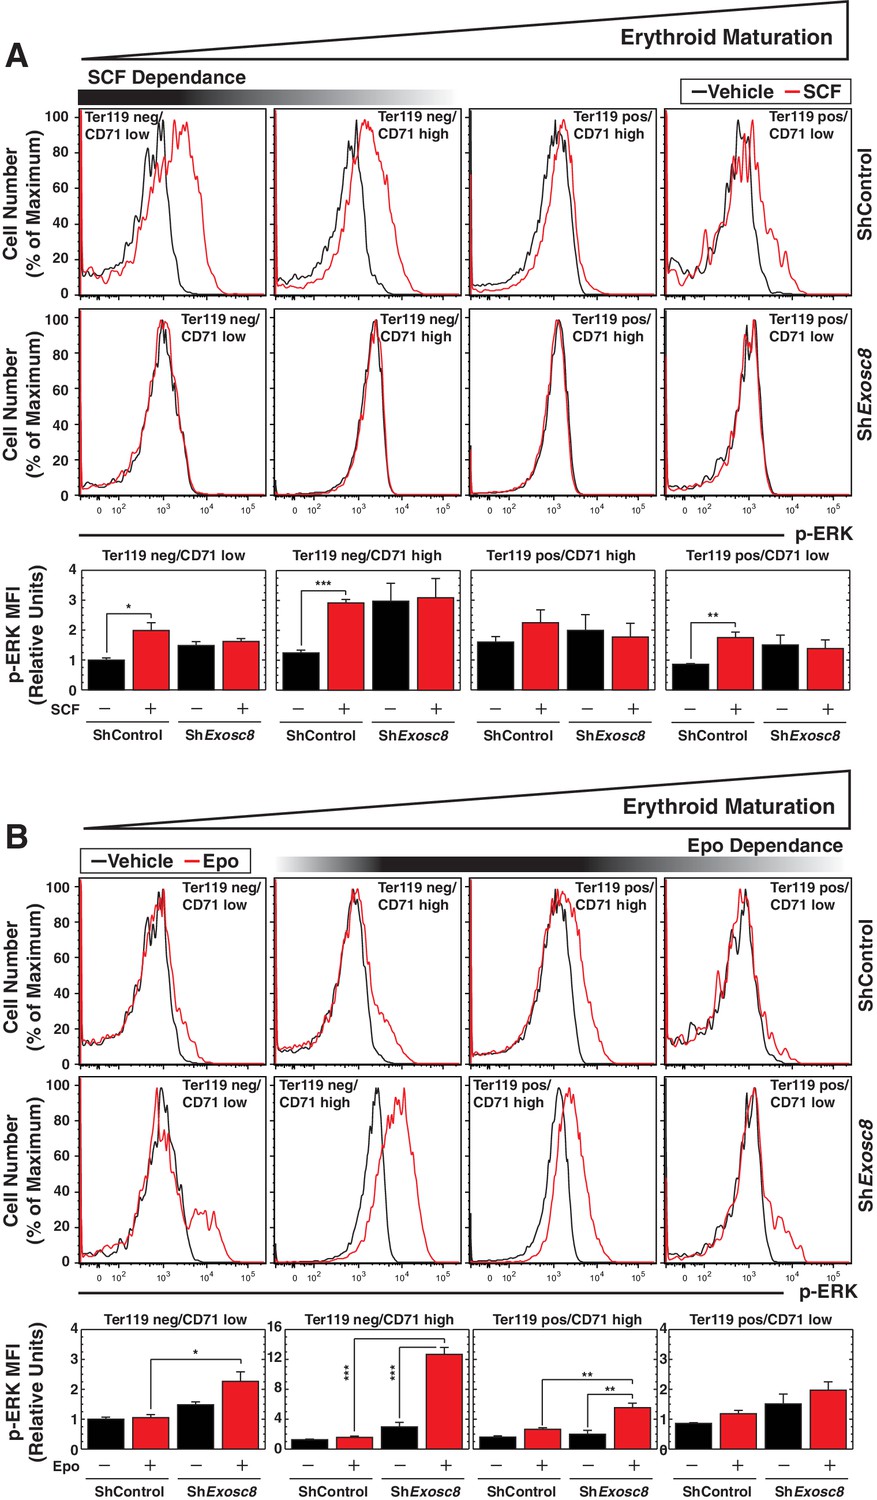
Flow cytometric analysis of ERK phosphorylation reveals Exosc8 requirement to confer Kit signaling and to suppress Epo signaling.
(A) Top: p-ERK staining after 10 min stimulation with 10 ng/ml SCF in control and Exosc8-knockdown cells (5 biological replicates). Bottom: p-ERK MFI expressed relative to unstimulated Ter119-/CD71low control (mean ± SE, 5 biological replicates). (B) Top: p-ERK staining after 10 min stimulation with 2 U/ml EPO in control and Exosc8-knockdown cells (5 biological replicates). Bottom: p-ERK MFI expressed relative to the Ter119-/CD71 low control (mean ± SE, 5 biological replicates). Initially ANOVA identified any significant variation between experimental groups. A Tukey-Kramer test subsequently identified the statistical relationship between each pair of samples. *p<0.05, **p<0.01, ***p<0.001
Figure 5
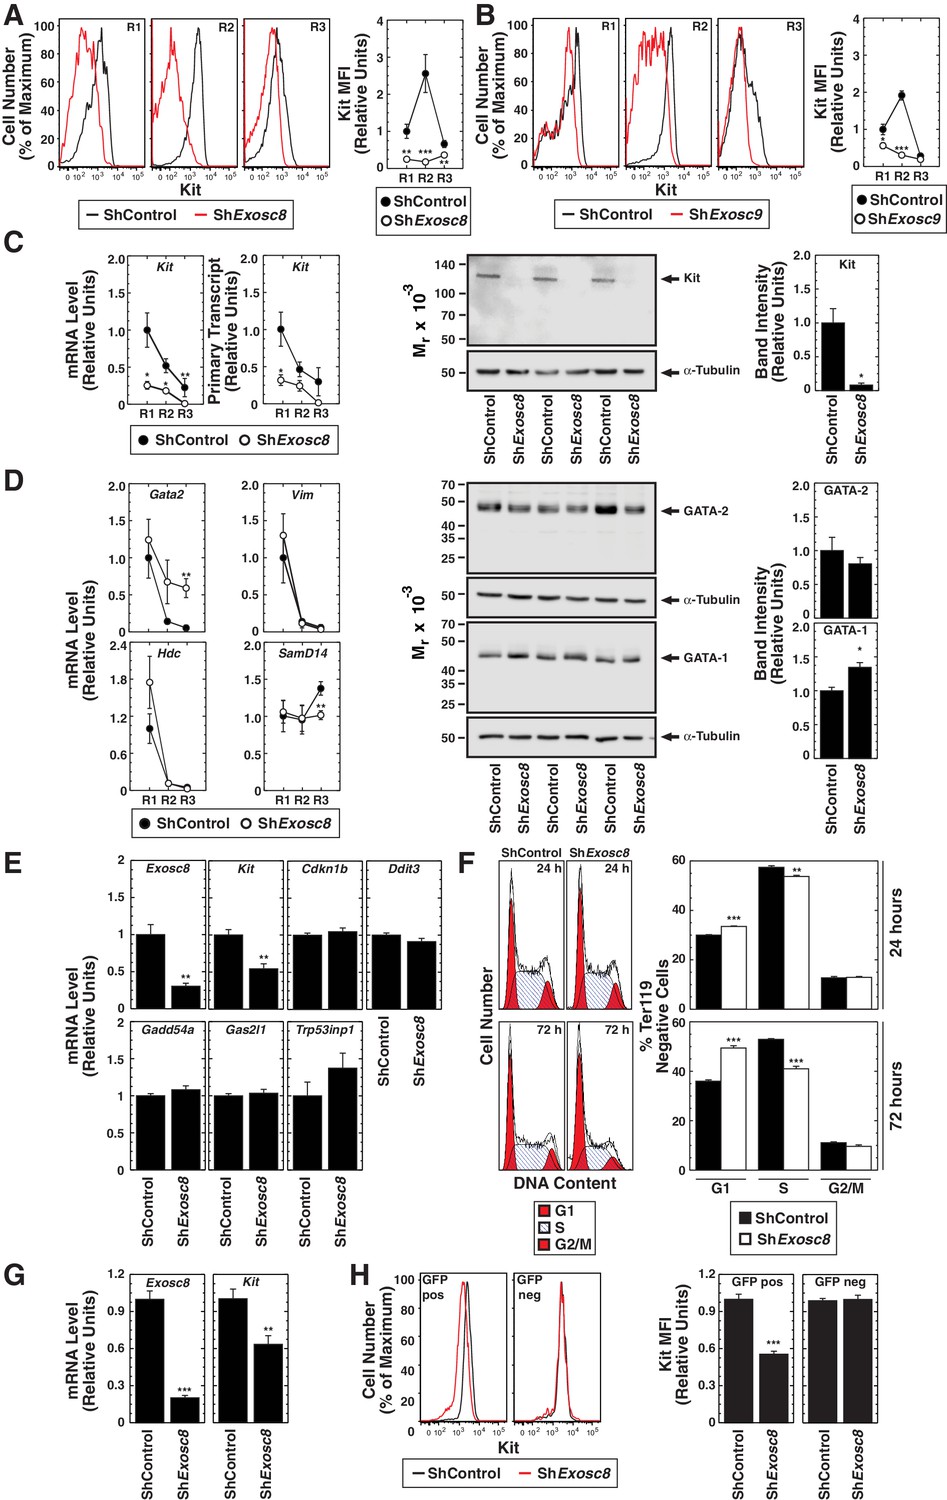
Exosome complex requirement for Kit expression.
(A) Left: surface Kit in R1-R3 populations 48 hr post-Exosc8 knockdown. Representative plots. Right: surface Kit MFI relative to control R1 (mean ± SE, 5 biological replicates). (B) Left: surface Kit in R1-R3 cells 48 hr post-Exosc9 knockdown. Representative plots. Right: surface Kit MFI relative to control R1 (mean ± SE, 8 biological replicates). (C) Left: real-time RT-PCR of Kit mRNA and primary transcripts in sorted R1-R3 populations 72 hr post-infection with shControl or shExosc8 normalized to 18S and relative to control R1 (mean ± SE, 6 biological replicates). Middle: Kit Western blot with Ter119- cells 24 hr post-infection (mean ± SE, 3 biological replicates). (D) Left: real-time RT-PCR of erythroid mRNAs in sorted R1-R3 populations 72 hr post-infection with shControl or shExosc8 (mean ± SE, 6 biological replicates). Middle: GATA-2 and GATA-1 Western blot with Ter119- cells 24 hr post-infection. Right: densitometric analysis normalized to tubulin and relative to shControl (mean ± SE, 3 biological replicates). (E) qRT-PCR of Exosc8 and Kit mRNA and GATA-1/Exosc8-regulated cell cycle arrest genes in primary erythroid precursor cells 24 hr post-infection. Normalized to 18S and relative to the control (mean ± SE, 5 biological replicates). (F) Cell cycle analysis of control and Exosc8-knockdown Ter119- cells 24 (top) and 72 hr (bottom) post-infection (mean ± SE, 6 biological replicates) (G) qRT-PCR analysis of Exosc8 and Kit mRNA in G1E cells 48 hr post-infection with shControl or shExosc8 retrovirus, normalized to 18S and expressed relative to the control (mean ± SE, 3 independent experiments) (H) Cell surface Kit expression in infected (GFP+) and uninfected (GFP-) populations of G1E cells 48 hr post-infection with shExosc8 (mean ± SE, 3 independent experiments). Statistical analysis of control and treatment conditions was conducted with the Student’s T-test *p<0.05, **p<0.01, ***p<0.001. Source data is available in Figure 5—source data 1.
-
Figure 5—source data 1
This Excel spreadsheet contains the values for each biological replicate for data presented as either line graphs or histograms (mean ± SE) in Figure 5.
Sheet 1: Figure 5A Kit MFI in the R1, R2, R3, R4 and R5 population 48 hr after Exosc8 knockdown. Sheet 2: Figure 5B Kit MFI in the R1, R2, R3, R4 and R5 population 48 hr post-Exosc9 knockdown. Sheet 3: Figure 5C Kit mRNA and primary transcript expression sorted R1-R3 populations 72 hr post-infection with shControl or shExosc8 normalized to 18S and densitometry analysis of Kit protein in Ter119- cells 24 hr post-knockdown. Sheet 4: Figure 5D mRNA expression of erythroid genes in sorted R1-R3 populations 72 hr post-infection with shControl or shExosc8 and densitometry analysis of GATA-1 and GATA-2 protein Ter119- cells 24 hr post-knockdown. Sheet 5: Figure 5E Expression of Exosc8, Kit and GATA-1/Exosc8-regulated cell cycle arrest genes in primary erythroid precursor cells 24 hr post-infection, normalized to 18S. Sheet 6: Figure 5F Cell cycle analysis of control and Exosc8-knockdown Ter119− cells 24 and 72 hr post-infection. Sheet 7: Figure 5G Exosc8 and Kit mRNA expression in G1E cells 48 hr post-infection with shControl or shExosc8 retrovirus, normalized to 18S. Sheet 8: Figure 5H Kit MFI in infected (GFP+) and uninfected (GFP-) populations of G1E cells 48 hr post-infection with shExosc8.
- https://doi.org/10.7554/eLife.17877.015
Figure 6
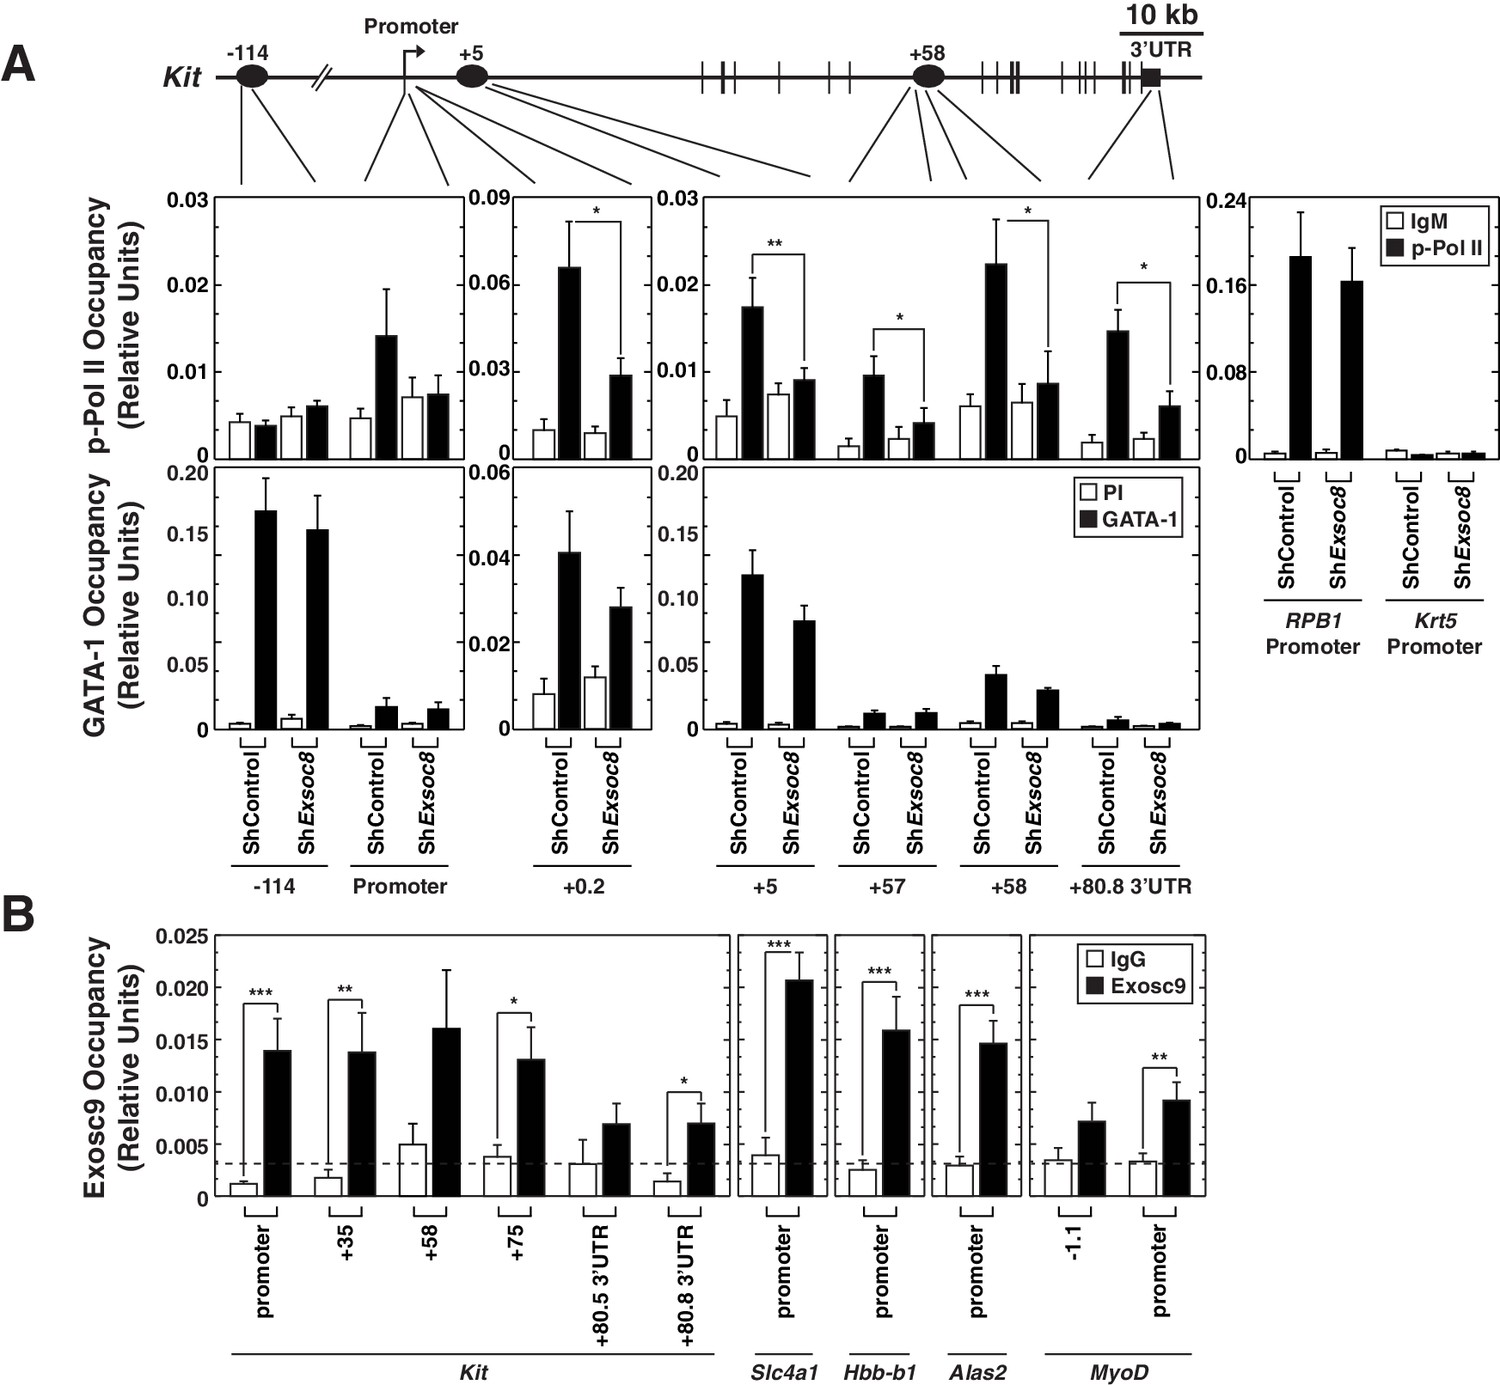
Exosome complex occupies the Kit locus and is required for active RNA Polymerase II occupancy at Kit.
(A) qChIP of serine 5-phospho Pol II, and GATA-1 occupancy at Kit in control and Exosc8-knockdown Ter119- erythroid precursor cells 24 hr post-infection (mean ± SE, 6 independent experiments). (B) qChIP of Exosc9 occupancy at Kit and promoters of other exosome complex-regulated erythroid genes (Alas2, Hbb-b1 and Slc4a1) in erythroid precursor cells after culturing for 48 hr (mean ± SE, 3 biological replicates). Statistical analysis of control and treatment conditions was conducted with the Student’s T-test. *p<0.05, **p<0.01, ***p<0.001. Source data is available in Figure 6—source data 1.
-
Figure 6—source data 1
This Excel spreadsheet contains the values for each biological replicate for data presented in histograms (mean ± SE) in Figure 6.
Sheet 1: Figure 6A qChIP of serine 5-phospho Pol II, and GATA-1 occupancy at Kit in control and Exosc8-knockdown Ter119- erythroid precursor cells 24 hr post-infection. Sheet 2: Figure 6B qChIP of Exosc9 occupancy at Kit and promoters of other exosome complex-regulated erythroid genes (Alas2, Hbb-b1 and Slc4a1) in erythroid precursor cells after culturing for 48 hr.
- https://doi.org/10.7554/eLife.17877.017
Figure 7

Functional link between Kit downregulation and erythroid differentiation induced by disrupting the exosome complex.
(A) Erythroid maturation analyzed by flow cytometric quantitation of CD71 and Ter119 post-Exosc8 knockdown and/or Kit expression in primary erythroid precursor cells expanded for 72 hr. Representative flow cytometry plots, with the R1-R5 gates denoted. (B) Left: relative Kit MFI post-Exosc8 knockdown and/or Kit overexpression (mean ± SE, 4 biological replicates). Right: percentage of primary erythroid precursor cells in the R1-R4 gates (mean ± SE, 4 biological replicates). (C) Left: relative Kit MFI 48 hr post-Exosc8 knockdown in cells infected with increasing amounts of a Kit-expressing retrovirus. The arrow depicts Kit downregulation resulting from knocking-down Exosc8. Right: percentage of erythroid precursor cells in the R3 population 48 hr post-infection with shExosc8 in cells infected with increasing amounts of Kit-expressing retrovirus. The arrow depicts the increased R3 population post-Exosc8 knockdown. ANOVA identified any significant variation between experimental groups then a Tukey-Kramer test identified the statistical relationship between each pair of samples, *p<0.05, **p<0.01, ***p<0.001. Source data is available in Figure 7—source data 1
-
Figure 7—source data 1
This Excel spreadsheet contains the values for each biological replicate for data presented in line graphs (mean ± SE) in Figure 7.
Sheet 1 2 and 3: Figure 7B Kit MFI and percentage of erythroid precursor cells in the R1, R2, R3 R4 and R5 populations 24, 48 and 72 hr post Exosc8 knockdown and/or Kit overexpression. Sheet 4: Figure 7C Kit MFI and percentage of erythroid precursor cells in the R1, R2, R3, R4 and R5 population 48 hr post-Exosc8 knockdown in cells infected with increasing amounts of a Kit-expressing retrovirus.
- https://doi.org/10.7554/eLife.17877.019
Figure 8
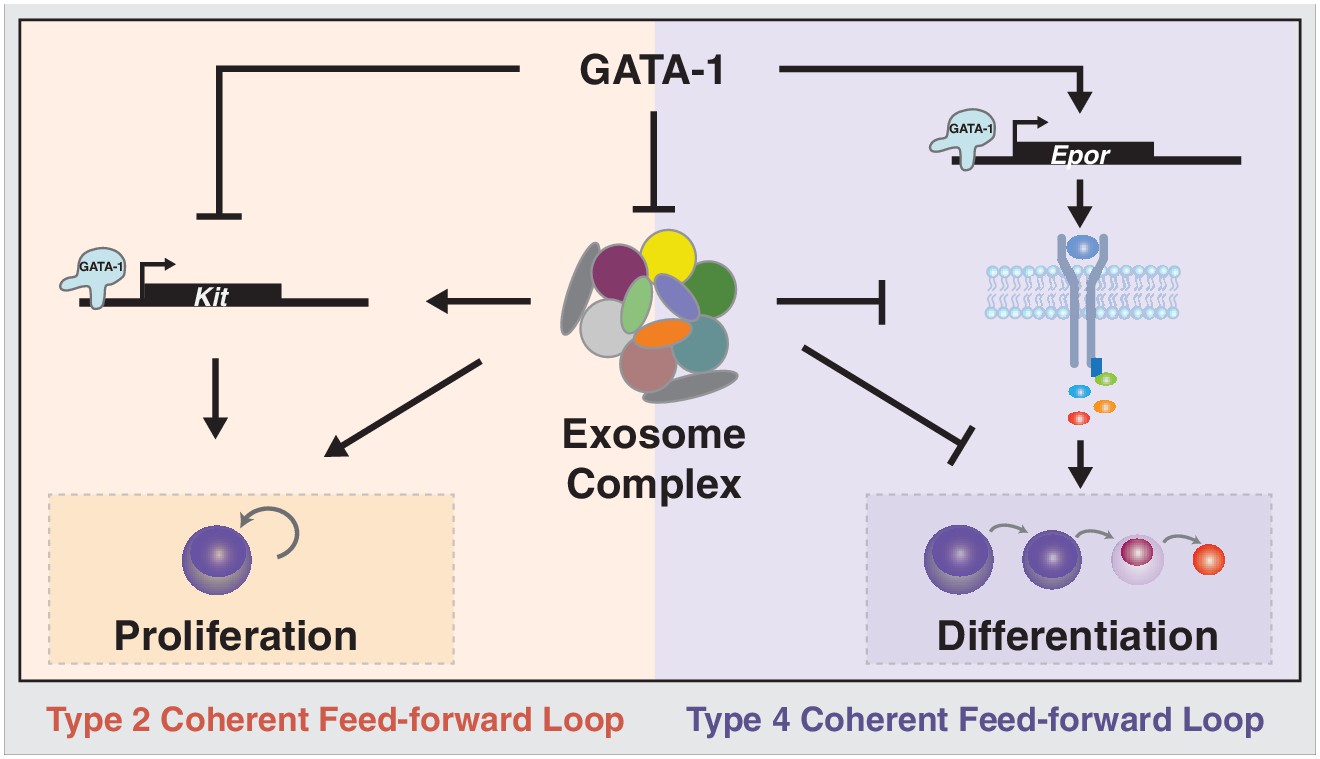
Exosome complex function to orchestrate developmental signaling pathways that control proliferation versus differentiation.
The master regulator of erythropoiesis GATA-1 represses Kit transcription and upregulates EpoR transcription, thus establishing the developmental signaling circuitry for erythroid maturation. GATA-1 represses genes encoding exosome complex subunits, which promotes erythroid maturation. The exosome complex confers Kit expression and establishes competence for SCF-induced Kit signaling. Disruption of this mechanism abrogates Kit signaling and instigates Epo signaling, which favors erythroid precursor maturation versus self-renewal.
Additional files
-
Supplementary file 1
Primers used for analysis of mRNA expression by qRT-PCR.
- https://doi.org/10.7554/eLife.17877.021
-
Supplementary file 2
Primers used for analysis of protein occupancy by qChIP.
- https://doi.org/10.7554/eLife.17877.022
Download links
A two-part list of links to download the article, or parts of the article, in various formats.
Downloads (link to download the article as PDF)
Open citations (links to open the citations from this article in various online reference manager services)
Cite this article (links to download the citations from this article in formats compatible with various reference manager tools)
Exosome complex orchestrates developmental signaling to balance proliferation and differentiation during erythropoiesis
eLife 5:e17877.
https://doi.org/10.7554/eLife.17877


