TP53 exon-6 truncating mutations produce separation of function isoforms with pro-tumorigenic functions
- Cold Spring Harbor Laboratory, United States
- Stony Brook University, United States
- Memorial Sloan Kettering Cancer Center, United States
- University of Ljubljana, Slovenia
Figures
Figure 1 with 3 supplements

TP53 exon-6 truncating mutations occur at higher than expected frequency.
(A) Distribution of TP53 nonsense (top, black) and missense (bottom, green) mutations in the TCGA cohort (n = 2521 tumors). Domains are demarcated on the upper baseline as follows: trans-activating domains (orange), Proline rich domain (green), DNA binding domain (light blue), nuclear localization sequence (yellow), and oligomerization domain (purple). The lower baseline and Roman numerals below indicate TP53 exon location relative to the p53 coding sequence. (B) Analysis as in A in the MSKCC cohort (n = 3797 tumors). (C–D) Recurrence frequency of each mutation type per unique change per sample in the TCGA and MSKCC cohorts respectively (Missense, p<2.2e-16; other nonsense, p=0.00178 and exon-6 nonsense, p=3.869e-11, Fisher’s exact test). (E) Count of unique reported amino acid changes and observed instances of exon-6 nonsense, other nonsense, missense, or all mutations. (F) Frequency of TP53 alteration vs. frequency of TP53 truncating mutations by cancer type. Circles were plotted in proportion to the frequency of TP53 exon-6 truncation mutations. See Supplementary file 1 for cancer type abbreviations. (G) The pie charts represent the relative frequency of TP53 mutation type for colorectal cancer primary tumors (top left, n = 403) and metastases (top right, n = 395). Mutations are indicated as follows: splice site mutations (Splice, light blue, p=0.035, fisher’s exact test), exon-6 nonsense mutation (Ex6 NS, orange, p=0.041), other nonsense mutation (Other NS, pink), in-frame insertion/deletion (IF indel, yellow), frameshift insertion/deletion (FS indel, gold), missense mutation (MS, green), multiple mutations (Multiple, purple), or no TP53 mutation (None, white). Note that both exon-6 nonsense mutations (p-value = 0.041) and missense mutations (p-value = 0.035) are over-represented in the metastatic samples with respect to p53-WT cases, whereas nonsense mutations outside of exon-6 and missense mutations are not (Fisher's exact test). The lower chart indicates the ratio of frequency in metastases to primary colorectal cancers of the indicated TP53 mutations. See Supplementary file 3 for number of tumor samples with TP53 mutation in primary CRC and metastatic CRC.
Figure 1—figure supplement 1

Distribution of TP53 somatic mutations across multiple tumor types based on TCGA and MSKCC data set analysis.
(A) Pie chart shows the distribution of indicated somatic mutations in TP53 based on TCGA data. For more information, see Supplementary file 1. (B) Pie chart shows distribution of indicated somatic mutations in TP53 based on MSKIMPACT data (Cheng et al., 2015).
Figure 1—figure supplement 2
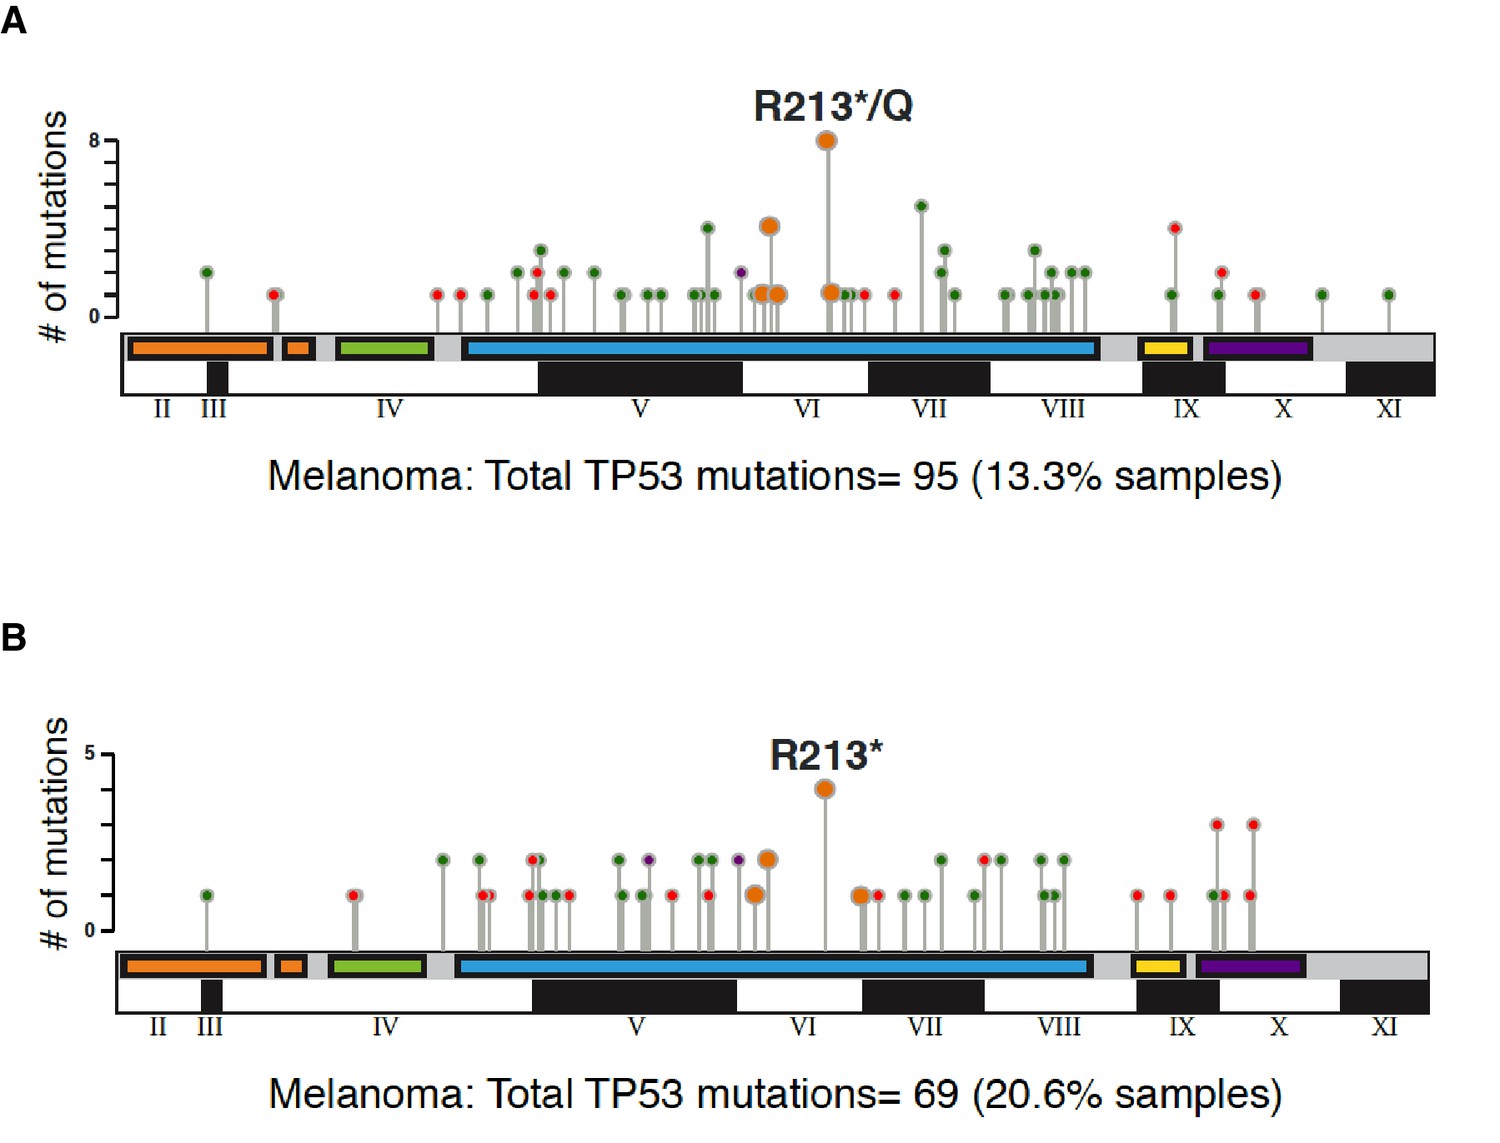
Graphical summary of TP53 non-synonymous mutations in melanoma in indicated studies.
The distribution of different type somatic mutations mapped across TP53 gene in melanoma (A) TCGA and (B) MSK-IMPACT. Circles are colored with respect to the corresponding mutation types as follows: Missense Mutations- green; Truncating Mutations (Nonsense, Nonstop, Frameshift deletion, Frameshift insertion, Splice site)-orange; Inframe Mutations (Inframe deletion, Inframe insertion).
Figure 1—figure supplement 3
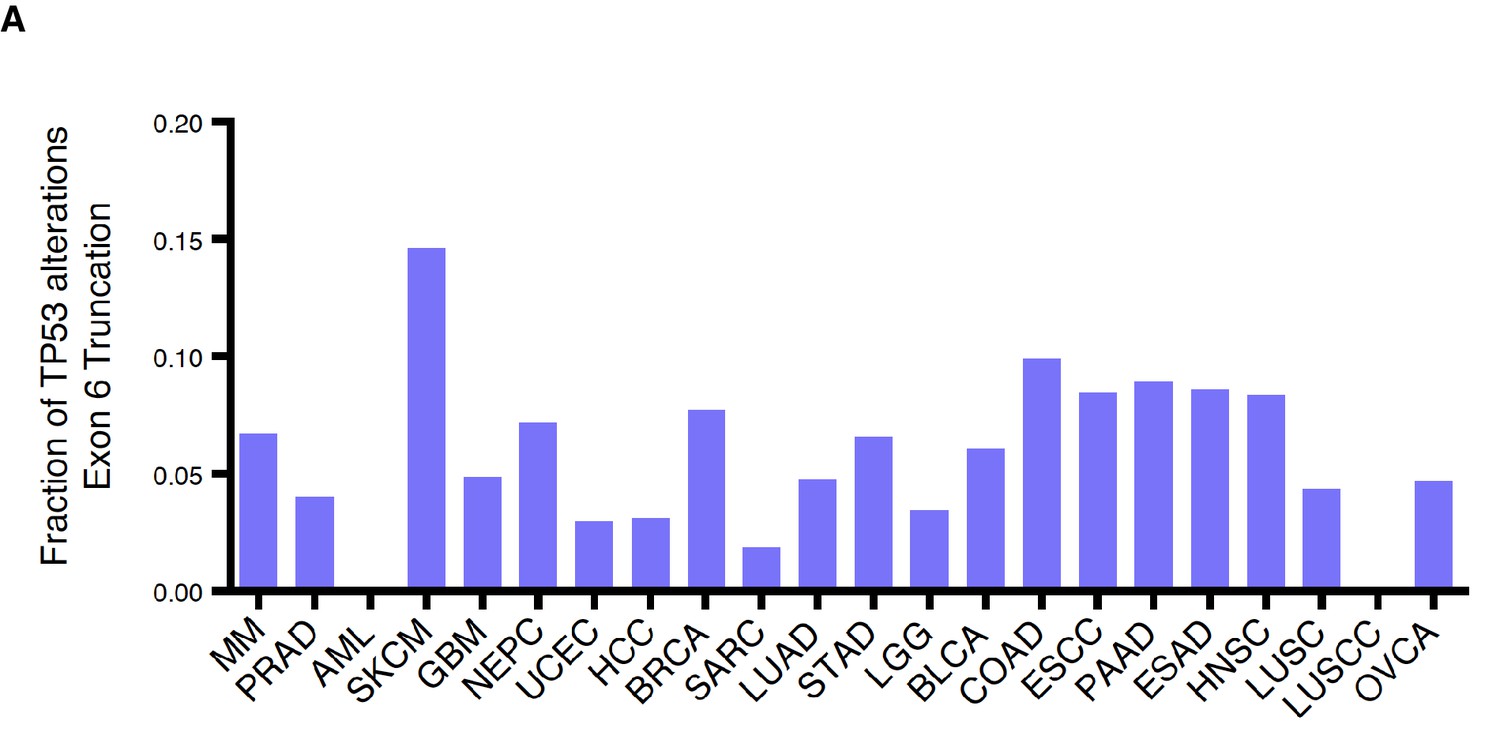
TP53 exon-6 truncating mutations are distributed at different frequency in different tumors.
(A) Fraction of TP53 exon-6 truncating mutations in the indicated tumor types.
Figure 2 with 4 supplements
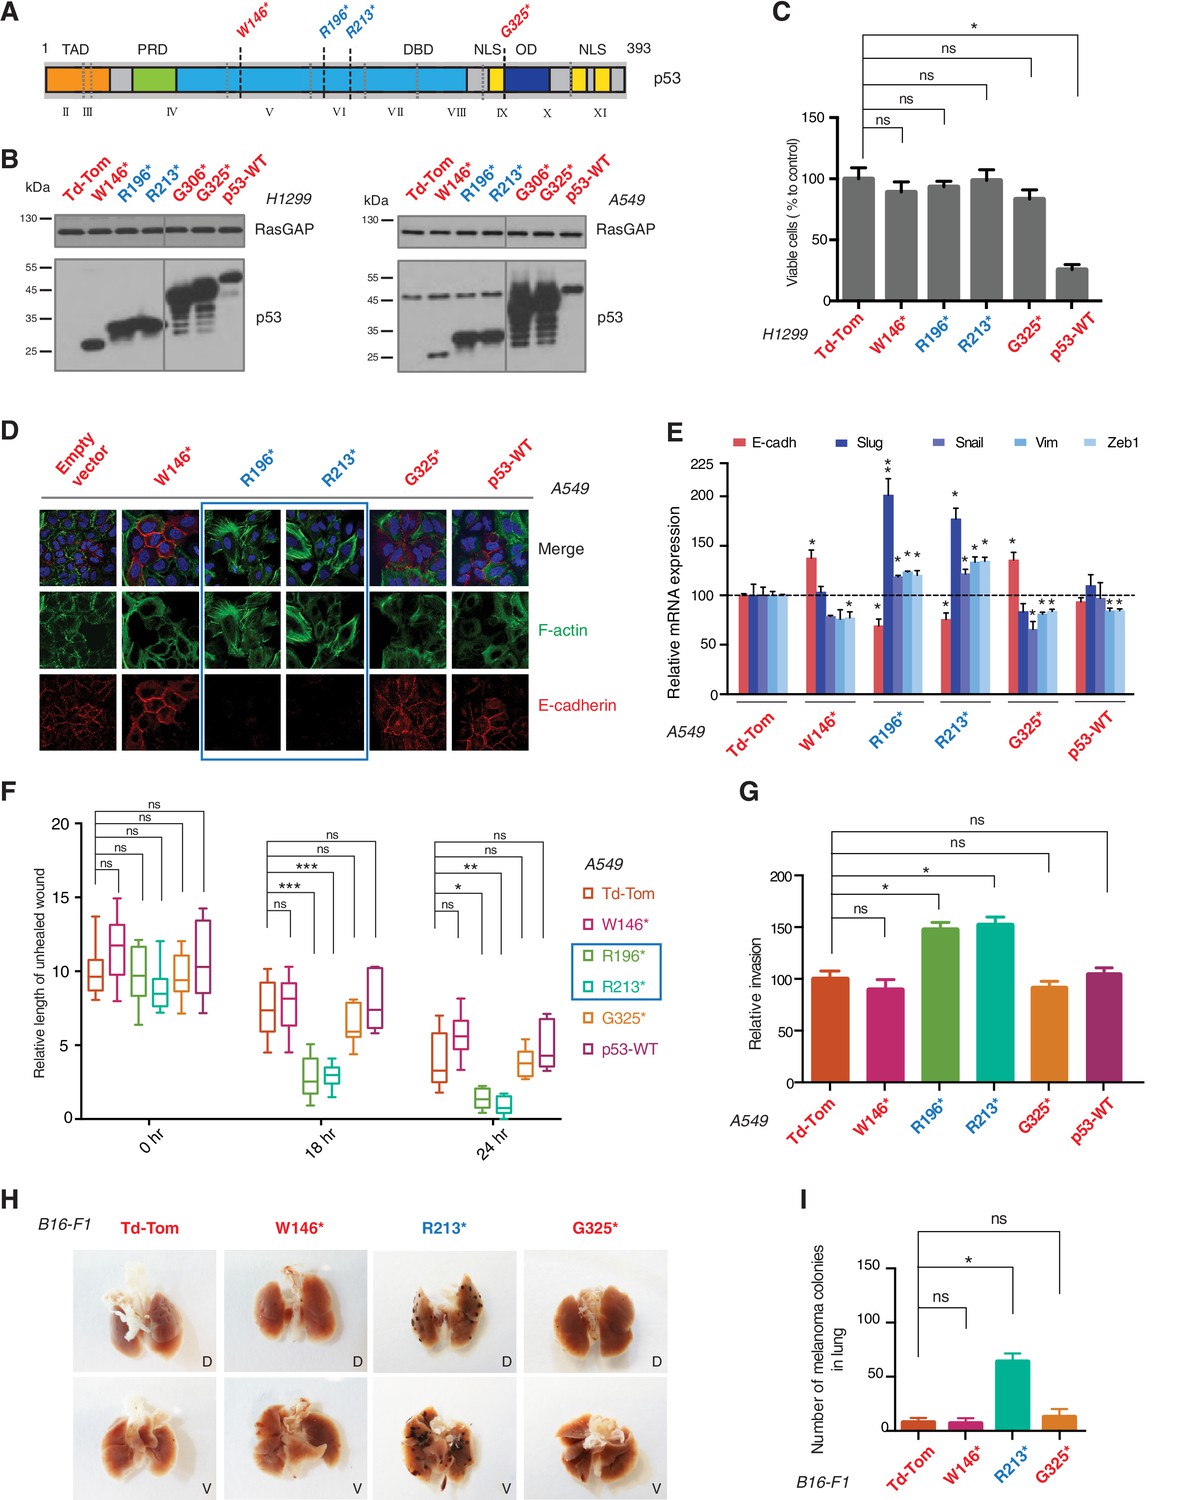
p53 exon-6 truncating mutants reprogram cells towards the acquisition of pro-metastatic features.
(A) Schematic of p53 and position of p53 nonsense mutations utilized in this study. Domains are demarcated and TP53 exon locations relative to the p53 coding sequence are indicated in the Roman numerals. (B) Different p53 truncations were ectopically expressed in the p53 null H1299 and p53-WT A549 cell lines. Expression was verified by western blot analysis of cell extracts by p53 N-terminal specific (DO1) antibody and the RasGAP as loading control after 48 hr post infection. (C) p53 C-terminal truncations lack tumor suppressor capabilities. The chart indicates the number of viable cells relative to Td-Tom expressing cells at 72 hr post infection. Each bar is the mean of 9 replicates (p-value *<0.0005 unpaired t-test). (D) Immuno-staining of A549 cells with phalloidin (green), E-cadherin (red) and DAPI (blue). Note that cells expressing R196* and R213* are characterized by different morphology, presence of stress fibers and decreased expression and localization of E-cadherin. (E) RT-qPCR analysis of EMT markers in A549 cells expressing different p53 truncations. mRNA expression was quantified by SYBR-green-based RT-qPCR. Each bar is the average of 3 replicates and represents the mRNA expression of the indicated genes relative to GAPDH (p-value *<0.05 and **<0.005, unpaired t-test). (F) p53 exon-6 truncating mutants augment the cell motility in A549 cells. Quantification of a scratch wound-healing assay is presented. Values in the chart represent mean ± SD of length of wounds at the indicated time points. For statistical analysis, the wound length at each time point for a given truncation was compared to Td-Tom expressing cells (n = 12, p-value *<0.0005, **<0.00005 and ***<0.000005, unpaired t-test). See Figure 2—figure supplement 1A for representative images of wounds closure. (G) The chart represents the quantification of a trans-well matrigel cell invasion assay. Each bar is the mean ± SD from 6 independent experiments (p-value *<0.005, unpaired t-test). (H) C57BL/6J mice were intravenously injected (tail vein) with B16-F1 melanoma cells ectopically expressing the indicated constructs. After 14 days, the lungs were dissected and the number of melanoma colonies in lung were quantified. The upper and lower panels illustrate representative dorsal (D) and ventral (V) images of the lungs. See Figure 2—figure supplement 2 for expression of truncations and Figure 2—figure supplement 4 for the histological analysis. (I) The chart represents the number of melanoma colonies in lung in different p53-truncation expressing cells. Each bar is the average number of melanoma colonies in the lungs of individual mice with data pooled from three independent experiments (Mean ± SD, p-value *<0.005).
Figure 2—figure supplement 1
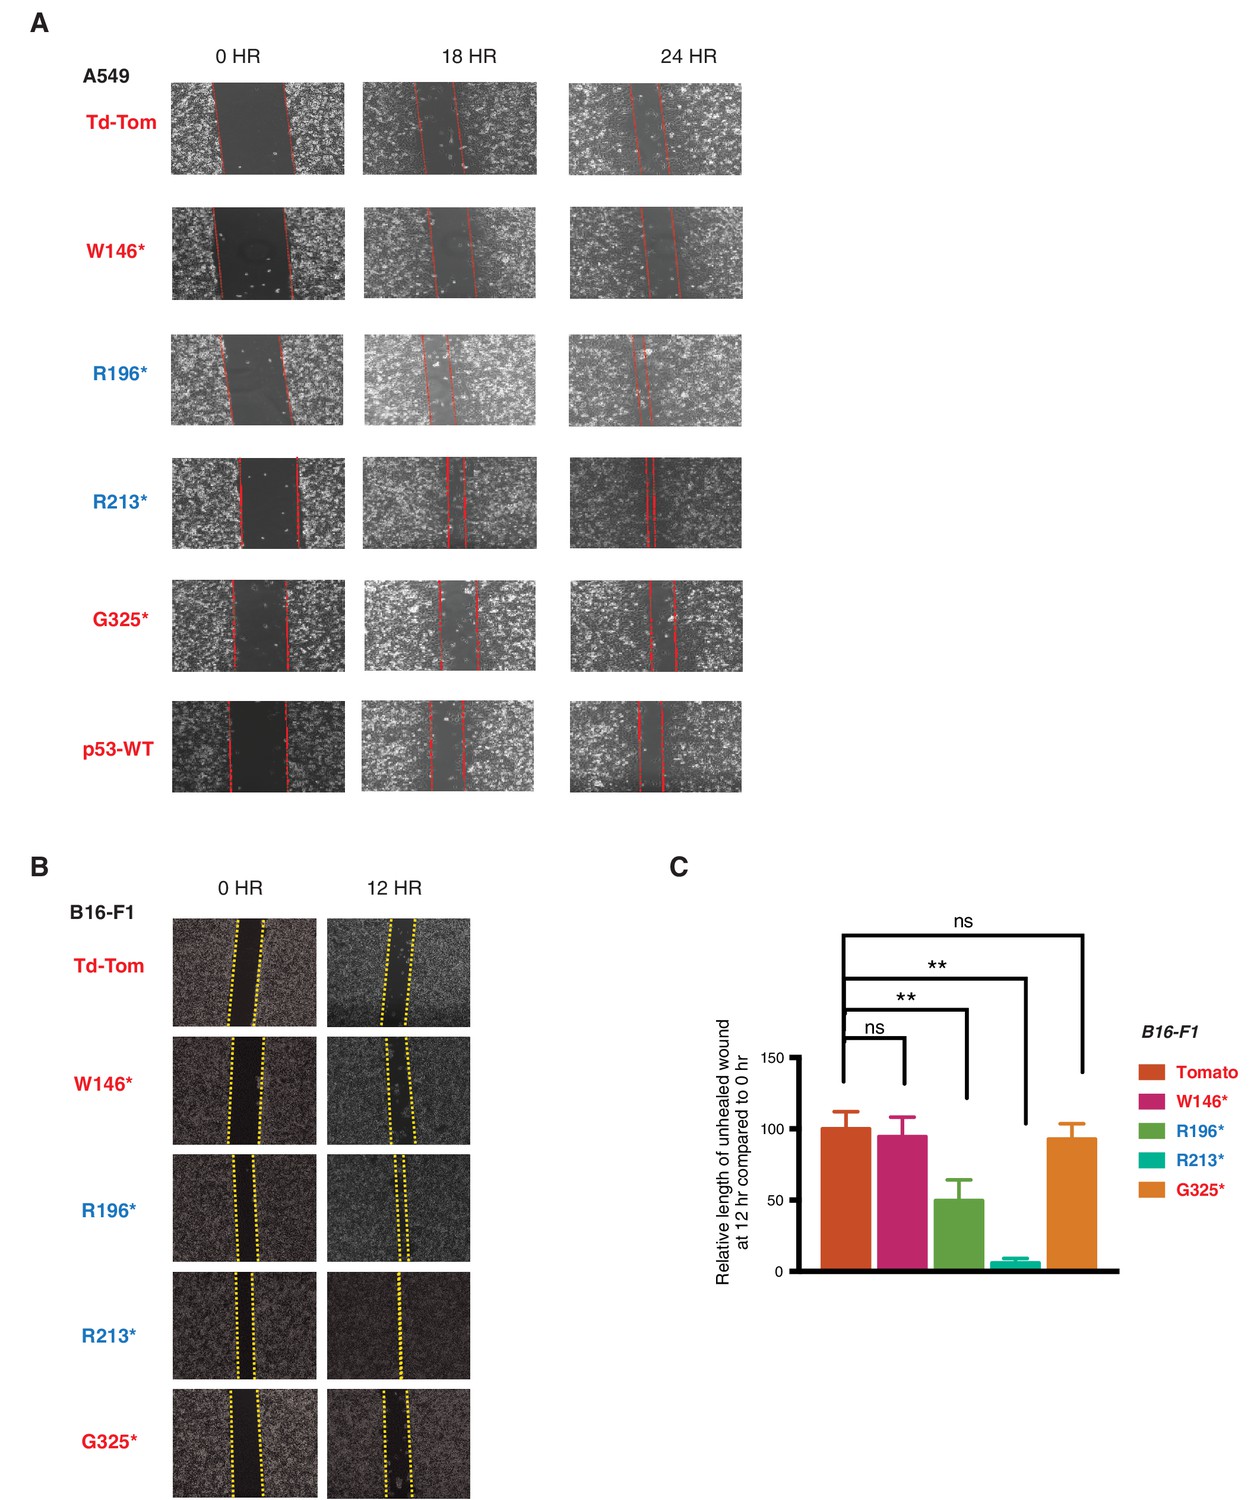
p53 exon-6 truncations increase cell migration.
(A) Representative images of A549 cells ectopically expressing different p53 truncations and p53-WT shown at indicated time points post scratch (40X). The boundary lines of scratch are indicated by dotted red line. Cell migration was assessed by recovery of the scratch. (B) Representative images of B16-F1 cells ectopically expressing different p53 truncations at indicated time points post scratch (40X). The boundary lines of scratch are indicated by dotted yellow line. Cell migration was assessed by recovery of the scratch. (C) The chart depicts the relative length of each wound (mean ± SD of 8 wounds) at 12 hr compared to 0hr in B16-F1 cells (n=8, p-value **<0.0005, unpaired t-test).
Figure 2—figure supplement 2
Lentiviral ectopic expression of different p53 truncations.
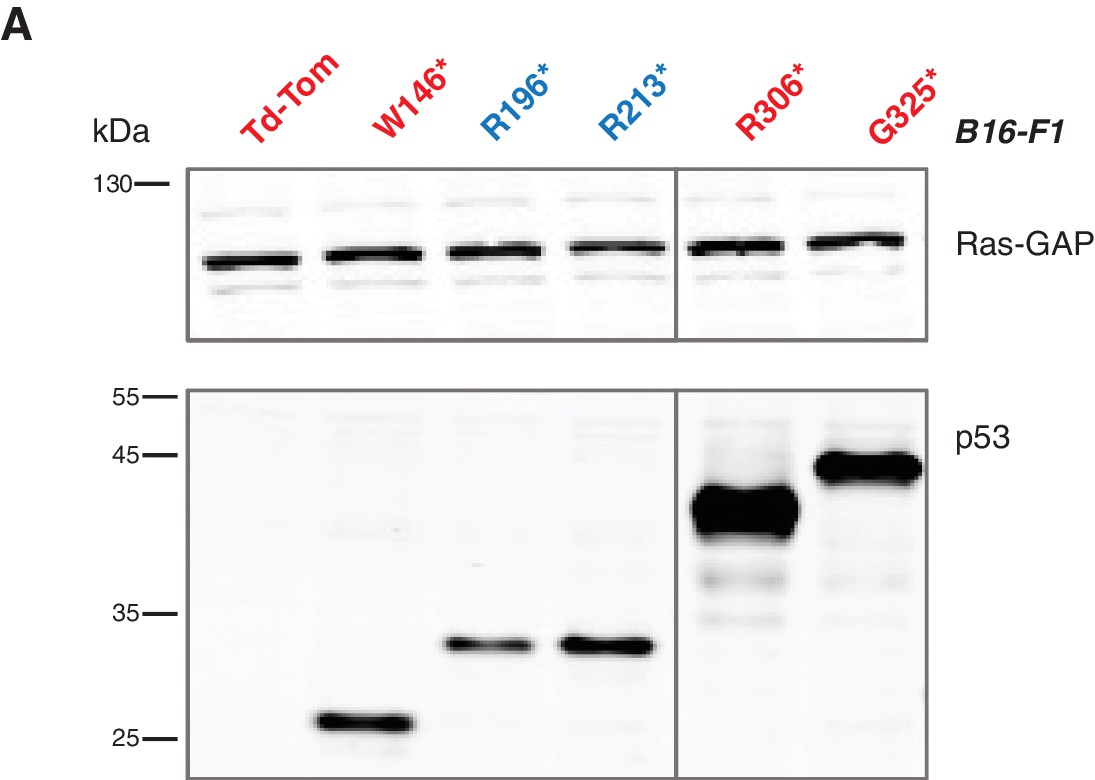
(A) Western blot analysis of B16-F1 cells ectopically expressing different p53 truncating mutations using antibodies specific for p53 N-terminal specific (DO1) antibody and RasGAP as loading control.
Figure 2—figure supplement 3
p53 exon-6 truncations increase expression of mesenchymal marker.
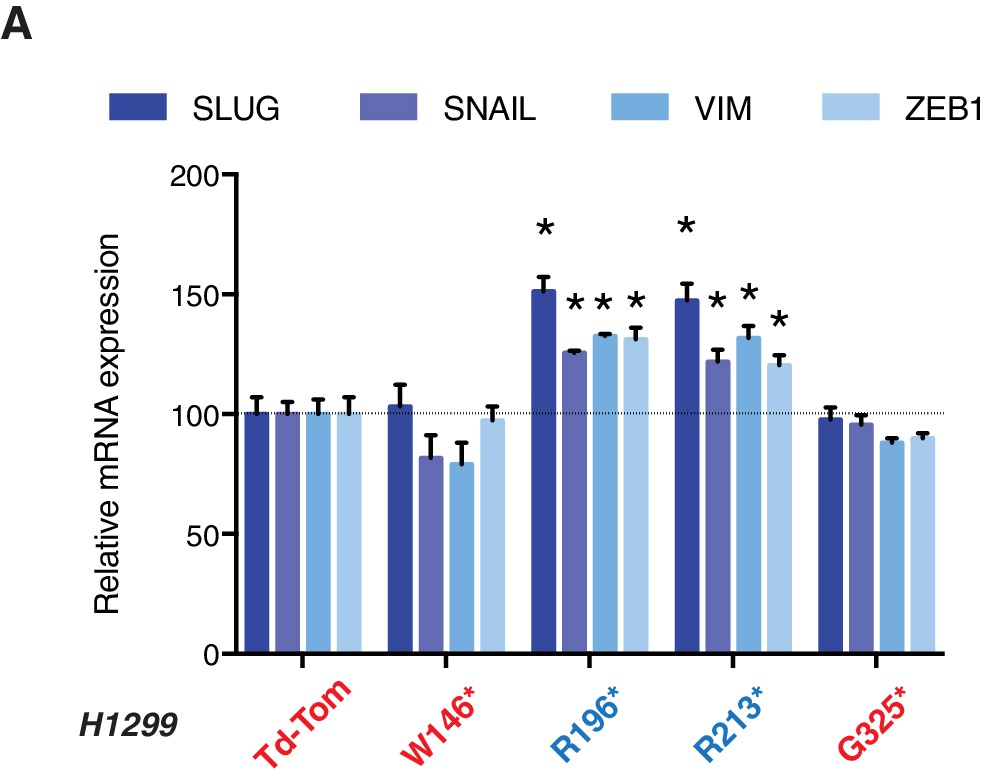
(A) RT-qPCR analysis of EMT markers in H1299 cells expressing different p53 truncations. mRNA expression was quantified by SYBR-green-based RT-qPCR. Each bar is the average of 3 replicates and represents mRNA expression of the indicated genes relative to GAPDH (p-value *<0.05, unpaired t-test).
Figure 2—figure supplement 4
p53 exon-6 truncation increases the colonization of melanoma cells in the lungs.
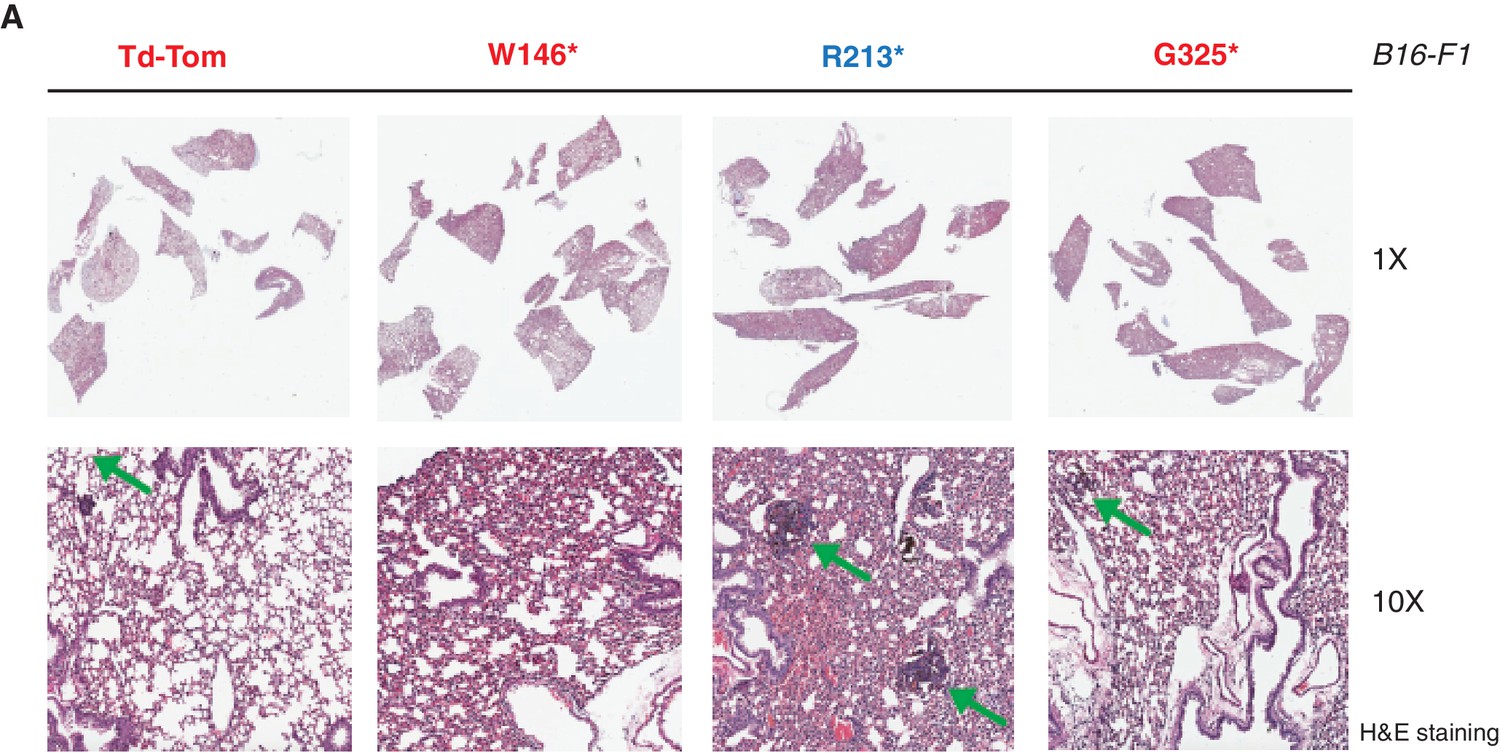
(A) Representative Hematoxylin and Eosin staining of mice lung sections dissected from mice injected with B16-F1 cells expressing different p53 truncations via the tail vein. Green arrow indicates the melanoma colonies.
Figure 3 with 7 supplements
TP53 exon-6 truncating mutations are required for EMT and cell survival.
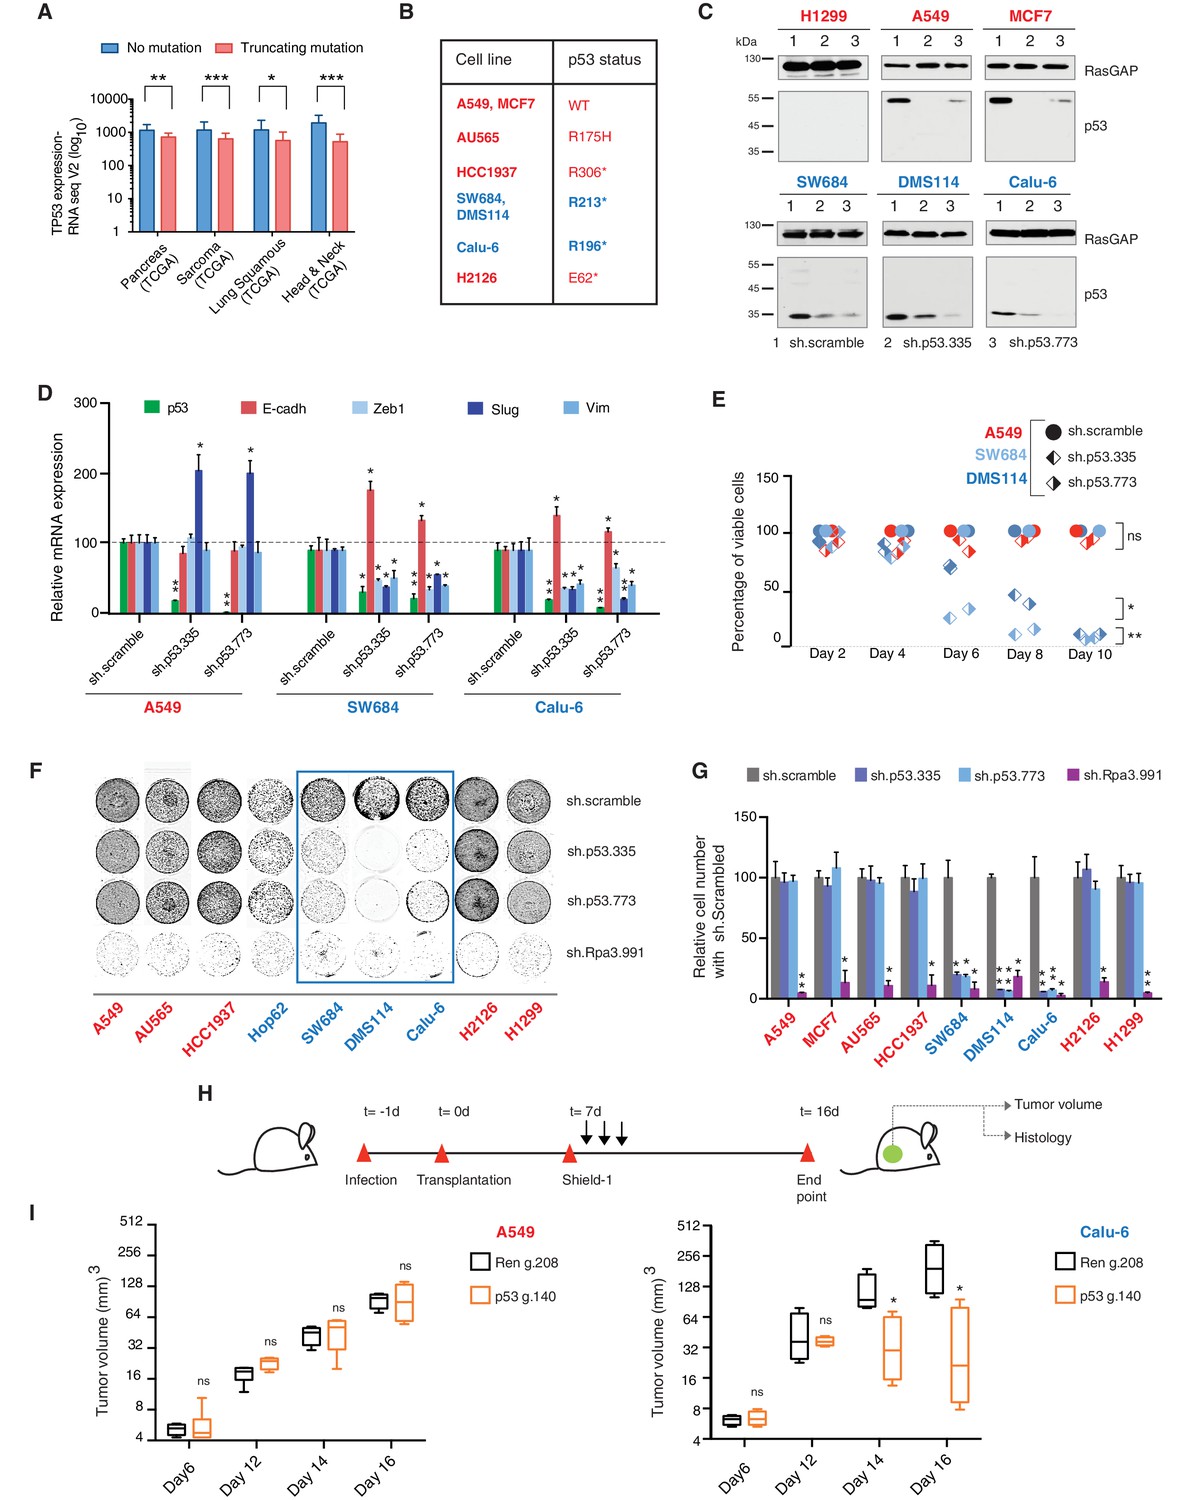
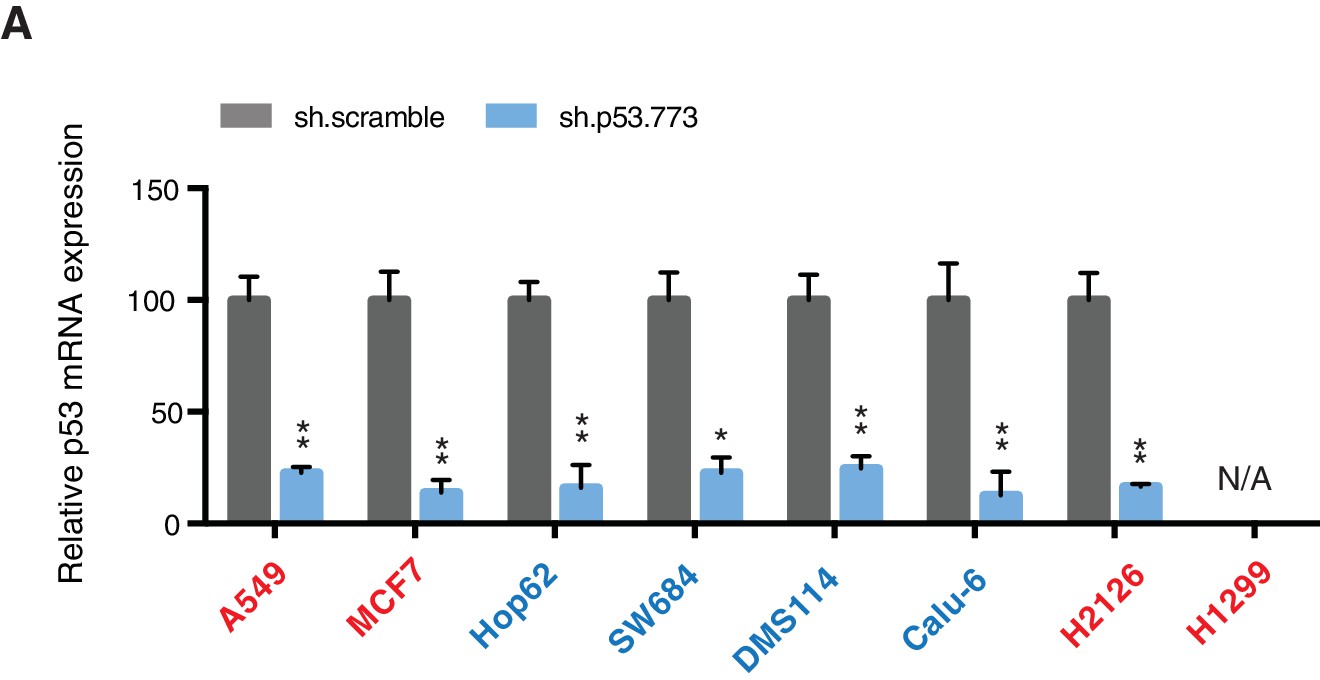
(A) The chart represents the median distribution of mRNA transcripts from the indicated tumors with p53 truncating mutation (Red) and no mutation (Blue), based on TCGA datasets. See Figure 3—figure supplement 1 and Supplementary file 2 for further details. (B) The table summarizes TP53 mutation status in the cell lines utilized in this study. (C) Western blot analysis of the indicated cell lines using a p53 N-terminal specific (DO1) antibody and an antibody against RasGAP as loading control. Quantification is provided in Figure 3—figure supplement 3B. (D) The chart represents themRNA expression analysis of the indicated genes in A549, SW684 and Calu-6 cell lines. mRNA expression was quantified by SYBR-green-based RT-qPCR. Each bar is the average of 3 replicates and represents the mRNA expression of the indicated gene relative to GAPDH (p-value *<0.05 and **<0.005, unpaired t-test). Analysis of additional cell lines is provided in Figure 3—figure supplement 4A (E) Each dot represents the percentage of viable cells compared to scramble shRNA in cells expressing p53-WT (A549) or exon-6 truncating mutations (SW684 and DMS114) upon knockdown of p53 with two independent shRNA constructs. Each dot represents the mean of 9 individual replicates. Efficiency of knock down is provided in Figure 3—figure supplement 4B (F) Crystal violet staining of the indicated cell lines upon p53 knockdown with two independent p53 shRNAs. A scramble shRNA was used as a negative control while shRNA targeting the essential gene RPA3 was used as a positive control. The quantification of knockdown efficiency is provided in Figure 3—figure supplement 5 (G) The chart depicts the percentage of viable cells 8 days post infection with the indicated shRNA constructs relative to scramble shRNA control. Each bar represents the mean of 9 individual replicates (p-value *<0.005, **<0.0005, unpaired t-test). See Figure 3—figure supplement 5 for knockdown efficiency. See Supplementary file 4 for shRNA sequences. (H) Workflow of the transplantable model system used in this study. A549 (p53-WT) and Calu-6 (p53 R196*) cells were transduced with lentivirus constructs expressing an inducible CRISPR-Cas9 (DD-Cas9) targeting p53 (p53 g.140) and as negative control targeting Renila (Ren.g.208). Cells were transplanted sub-cutaneously in immune-deficient mice. When the tumors reached an approximate size of 4–5 mm in diameter; mice were treated with Shield-1 (1 µg). Tumor volume was determined at the indicated time points. See Supplementary file 5 for sgRNA sequences. (I) The charts illustrate quantification of tumor volumes (mean ± SD) in the indicated cohorts at given time points (n = 4, p-value *<0.05, unpaired t-test). Validation of p53 inactivation is provided in Figure 3—figure supplement 7B and C.
Figure 3—figure supplement 1
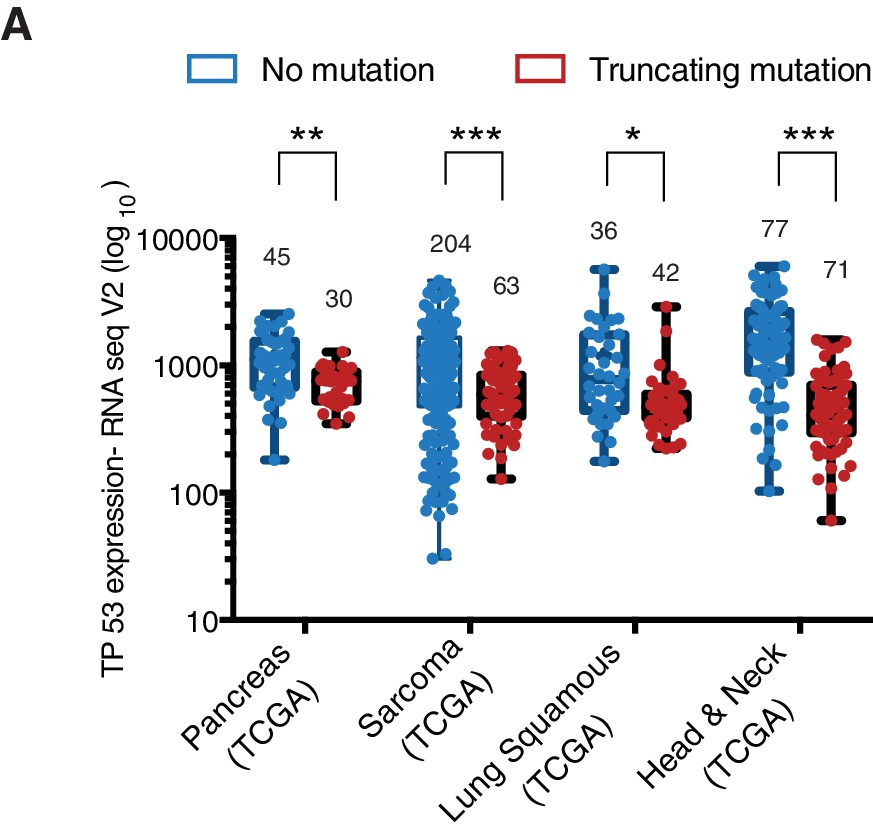
The P53 mRNA expression is comparable between p53-WT and p53 truncations.
(A) The chart represents the distribution of TP53 mRNA expression in the indicated tumors based on analysis of TCGA data sets. Each dot represents one individual tumor and number of tumor samples for each group is indicated on each tumor type. p-value for Pancreas, Sarcoma, Lung Squamous and Head and neck tumors are 0.0001684, 3.18365E-06, 0.001551394 and 1.2E-14 respectively. See Supplementary file 2 for further details.
Figure 3—figure supplement 2
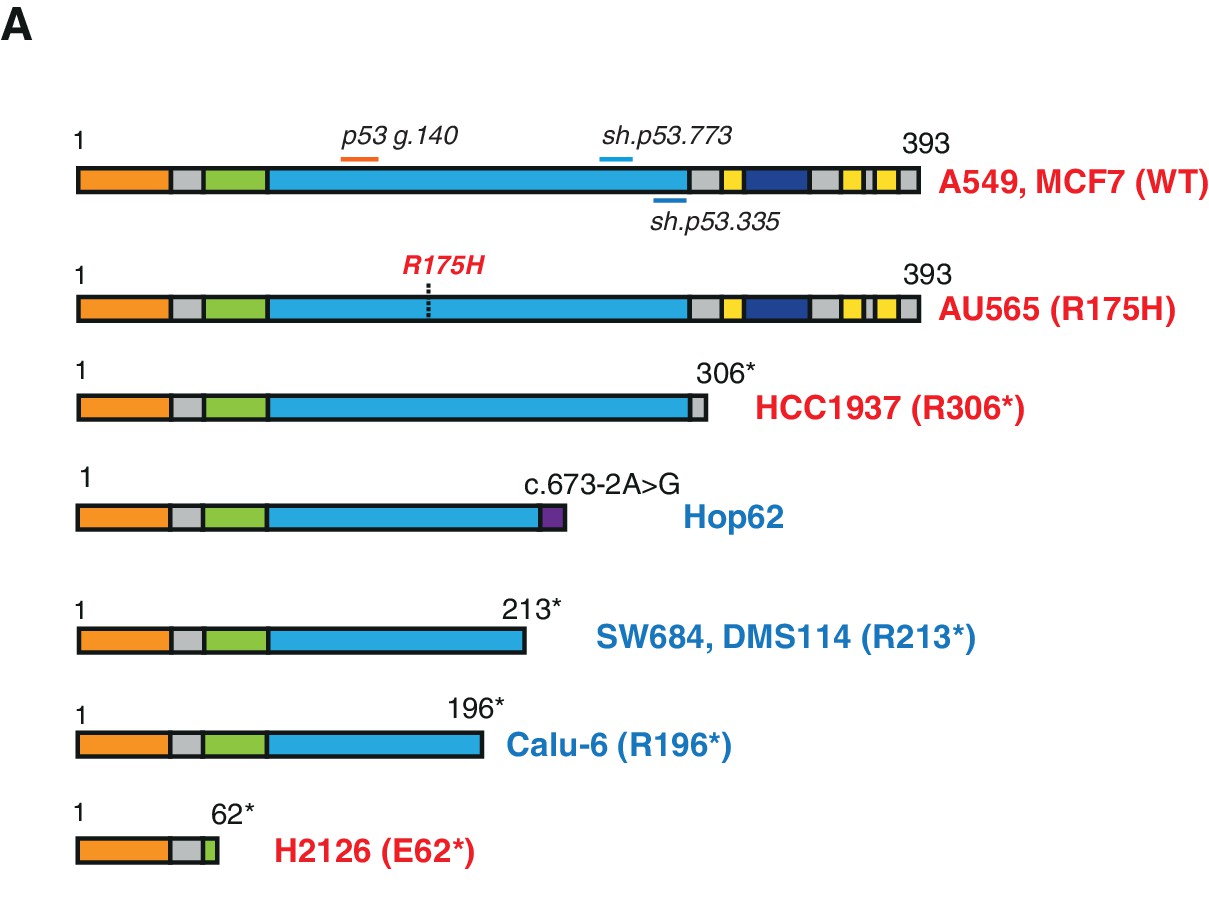
Schematic of the p53-WT or truncated forms expressed in the cell lines utilized in this study.
(A) Cell lines harboring TP53 exon-6 truncating mutations or splicing mutations are indicated in blue.
Figure 3—figure supplement 3
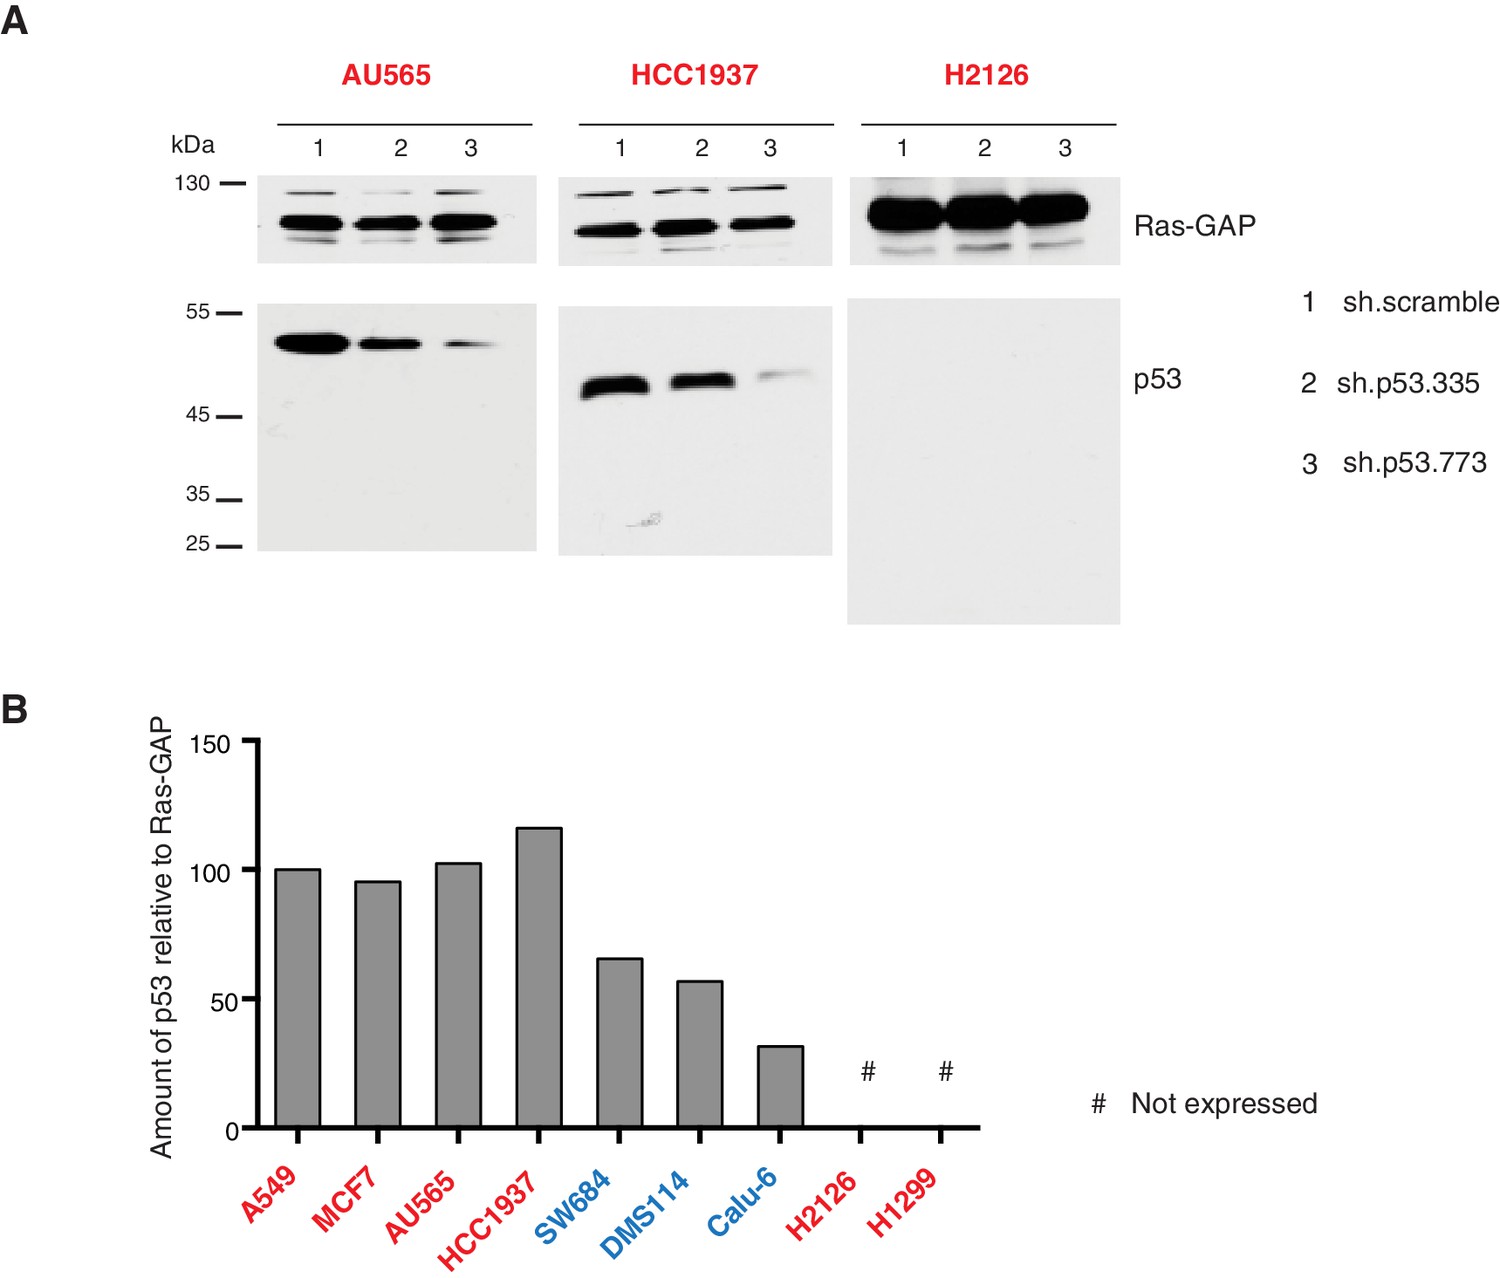
Validation of p53 expression by immuno-blot and efficient knockdown with indicated p53 specific shRNA.
(A) Western blot analysis of the indicated cell lines using a p53 N-terminal specific (DO1) antibody and an antibody against RasGAP as loading control. (B) Quantification of levels of p53 protein expression in multiple cell lines. Cell extracts were analyzed by western blot analysis with the p53 N-terminal specific (DO1) antibody and RASGAP as a loading control. ImageJ was used to determine signal intensity of the bands. The values were then indicated as ratio of amount of p53 to RasGAP (in arbitrary units) relative to amount in A549 (p53-WT) cells.
Figure 3—figure supplement 4
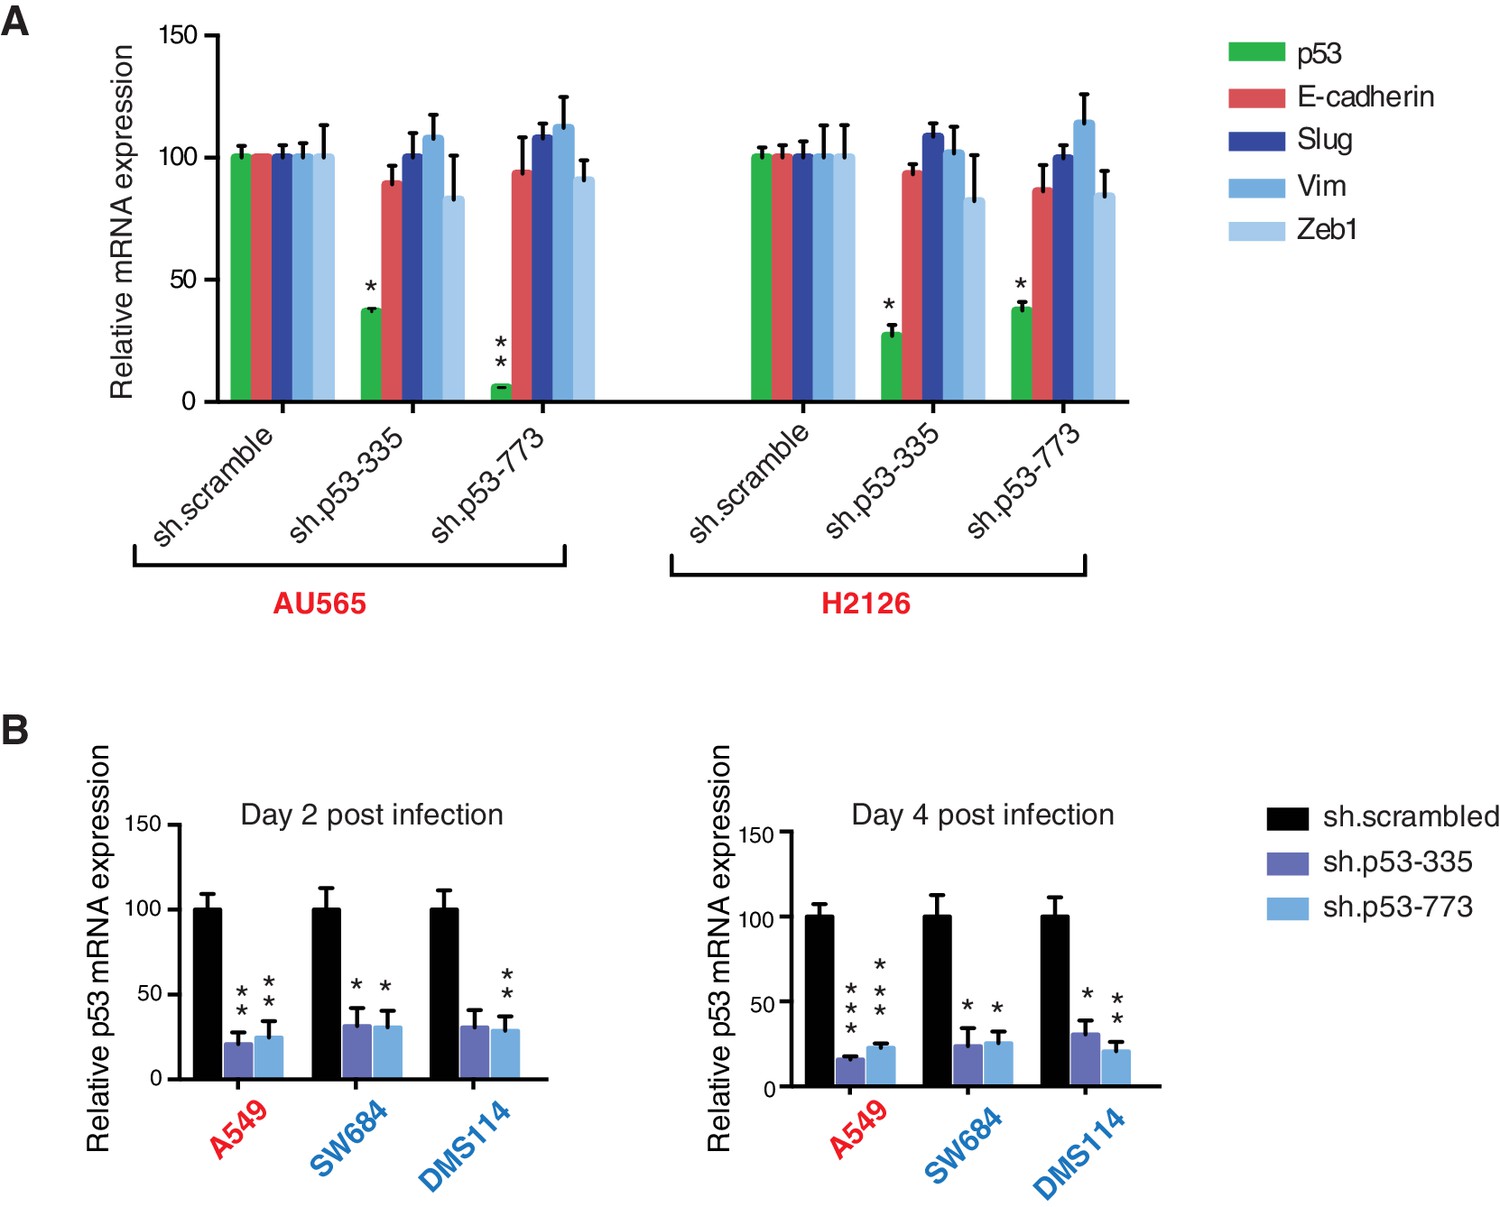
Differential expression of indicated genes and knockdown efficiency of indicated p53 shRNAs.
(A) The chart represents the mRNA expression analysis of the indicated genes in AU565 and H2126 cell lines. mRNA expression was quantified by SYBR-green-based RT-qPCR. Each bar is the average of 3 replicates and represents the mRNA expression of the indicated gene relative to GAPDH. (p-value, *<0.005 and **<0.0005, unpaired t-test). (B) p53 knockdown efficiency upon infection with two independent shRNAs at indicated times in A549, SW684 and DMS114 cell lines. Each bar is the average of 3 replicates and represents p53 mRNA expression relative to GAPDH. (p-value, *<0.005 and **<0.0005, unpaired t-test).
Figure 3—figure supplement 5
Knockdown efficiency of indicated shRNAs in following cell lines.
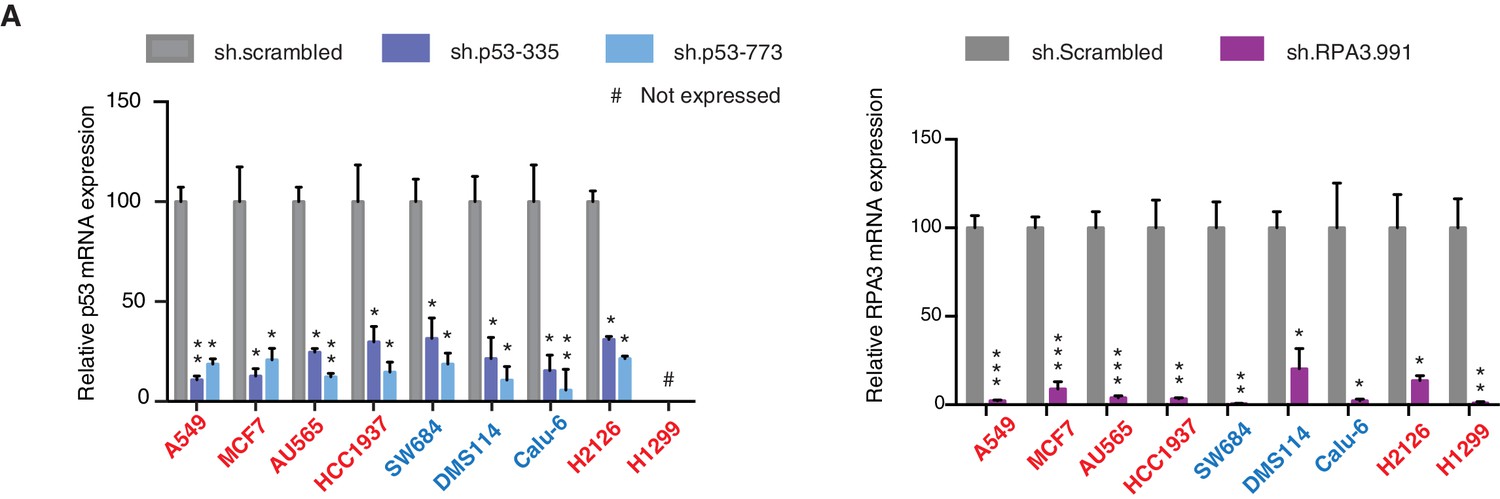
(A) Knockdown efficiency of p53 and RPA3 upon shRNA infection in the indicated cell lines at 96h after infection. Each bar is the average of 3 replicates and represents mRNA expression of the indicated gene relative to GAPDH. (p-value, *<0.005, **<0.0005 and ***<0.00005, unpaired t-test). The sequence for each shRNA used in this study, is indicated in Supplementary file 4.
Figure 3—figure supplement 6
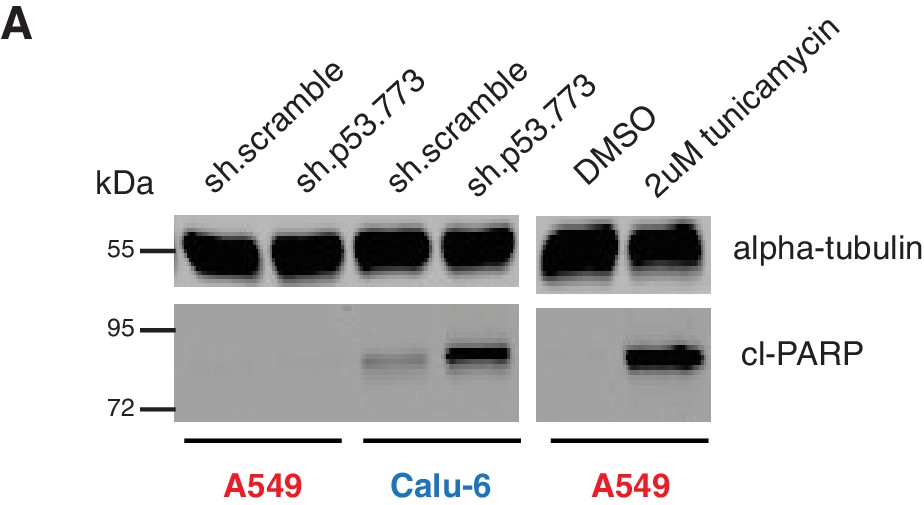
Knockdown of p53 induces apoptosis in cell expressing in p53 exon-6 truncation.
(A) Cleaved-PARP Western blot analysis upon p53 knockdown in A549 and Calu-6 cell lines 5 days after shRNA infection. As a positive control, A549 were treated with DMSO or 2 µM tunicamycin for 72 hr. Alpha-tubulin was used as a loading control.
Figure 3—figure supplement 7
Inactivation of p53 by using CRISPR-Cas9 decreases cell survival of p53 exon-6 truncation expressing cells.
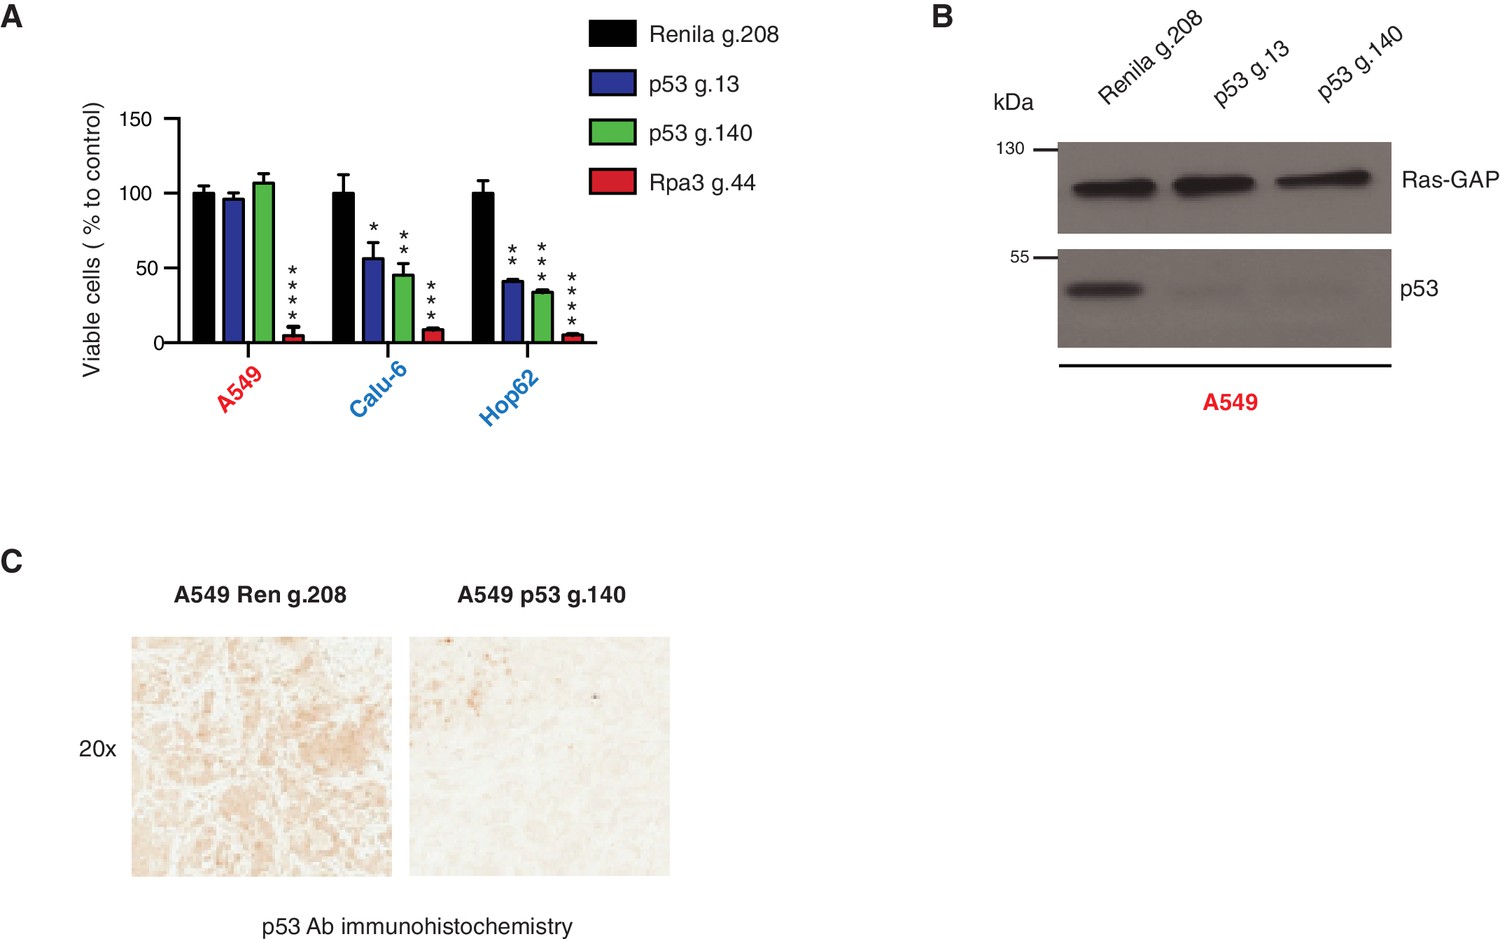
(A) The chart represents the number of viable cells compared to Renila control (Ren g.208) upon CRISPR-Cas9 mediated gene editing either with p53 g.13 and g.140 or Rpa3 g.44 as positive control. Each bar is the average of 9 replicates (p-value, *<0.05, **<0.005, ***<0.0005 and ****<0.00005 unpaired t-test). The sequence for each gRNA used in this study, is indicated in Supplementary file 5. (B) Western blot analysis of A549 cell line using a p53 N-terminal specific (DO1) antibody and an antibody against RasGAP as loading control to validate the inactivation of p53. (C) Validation of p53 gene editing in the mouse model. Mice were injected sub-cutaneously with A549 cells, treated with Shield-1 after 9 days and sacrificed at day 16. Sections of tumors transduced either with Renila sgRNA or p53 sgRNA were stained with a p53 N-terminal specific (DO1) antibody. Representative pictures are shown.
Figure 4 with 7 supplements
CypD activity is required for phenotypes associated with TP53 exon-6 truncating mutations.
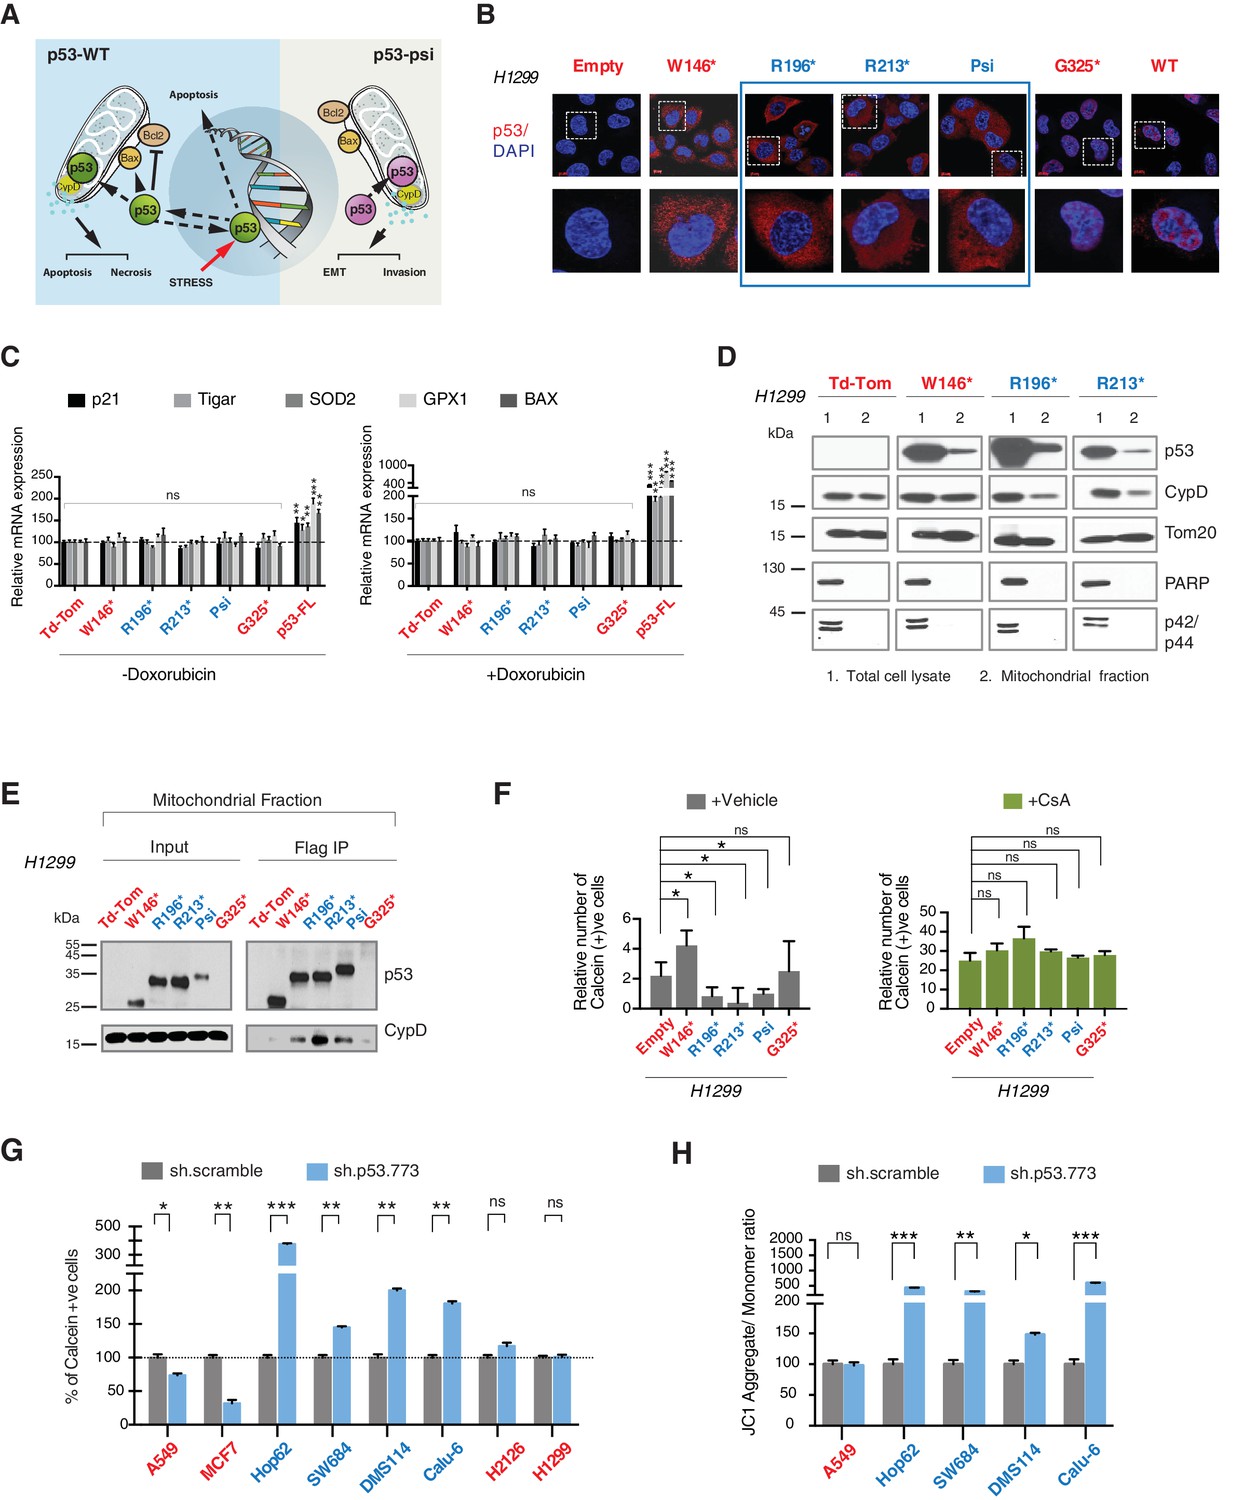
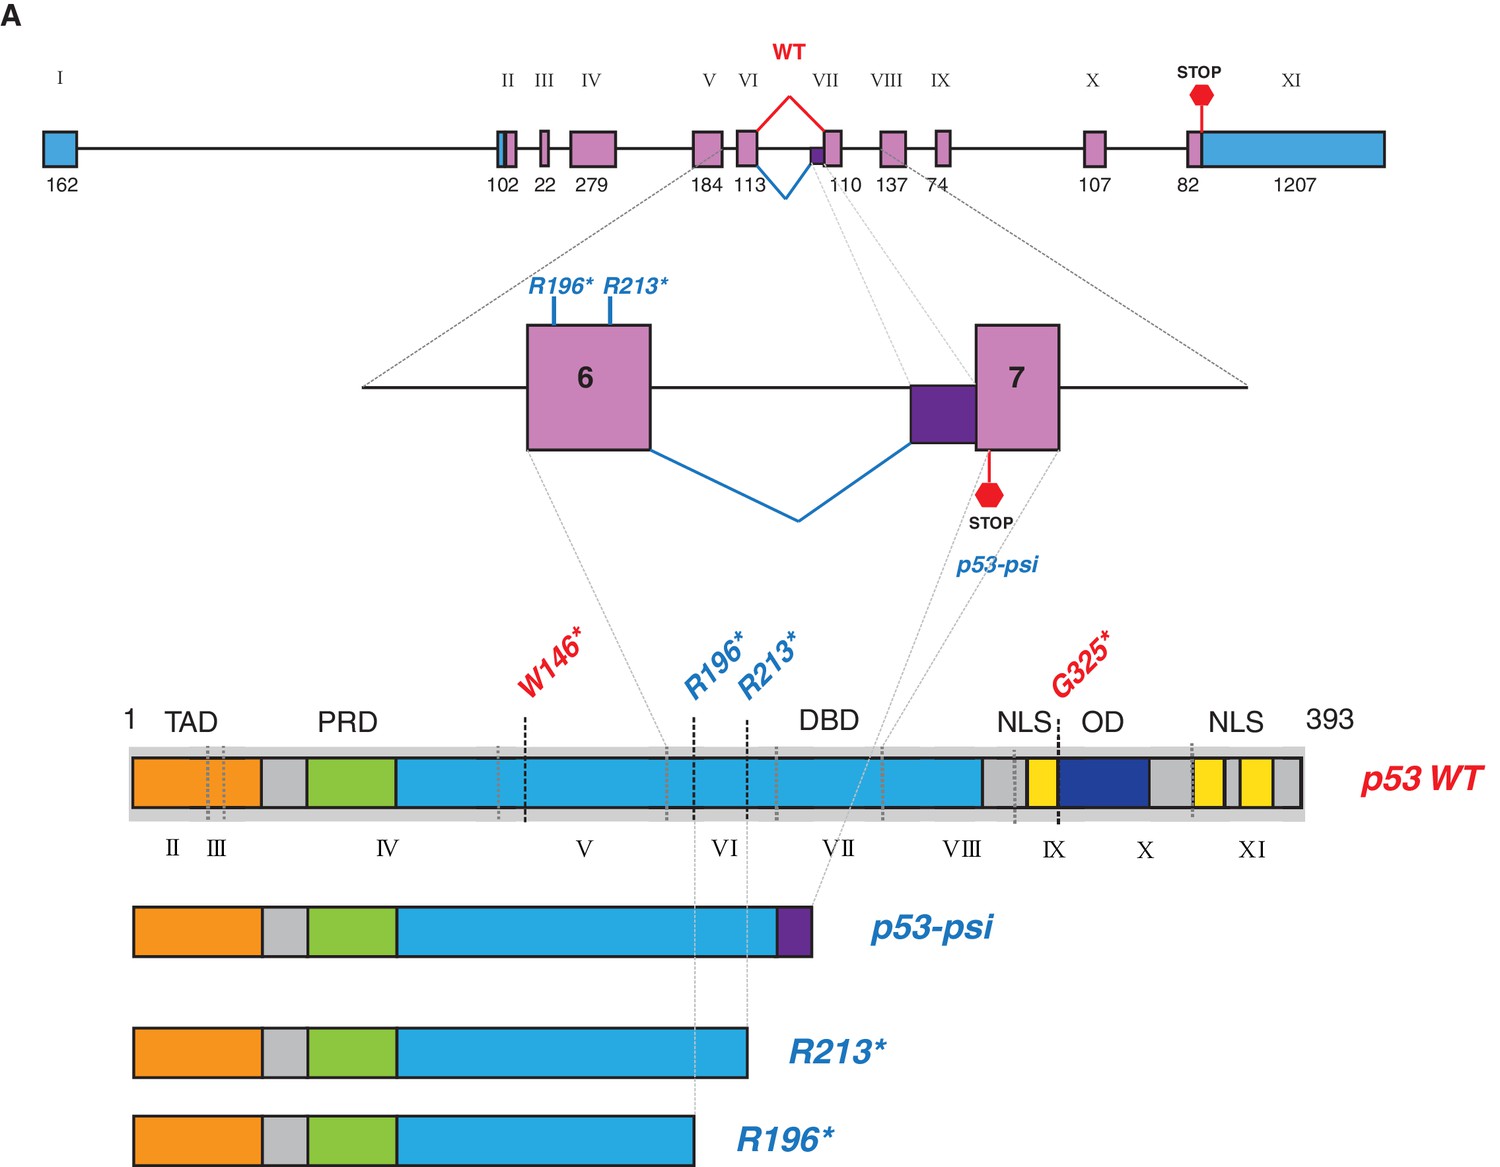
(A) Schematic of p53-psi activities as reported by Senturk et al., unlike from p53-WT, p53-psi does not localize in the nucleus and does not have transcriptional capabilities. Yet, p53-psi can translocate to the mitochondria where it binds to CypD and via modification of the inner pore permeability induces pro-metastatic features. (B) p53 truncating mutants are excluded form the nucleus. Immuno-staining of H1299 cells with the p53 N-terminal specific (DO1) antibody (red). DAPI (blue) is used as counterstain. (C) The chart represents an expression of p53 target genes upon ectopic expression of different p53 truncations in A549 cells either in the absence or presence of Doxorubicin (1 µM) for 24 hr. mRNA expression was quantified by SYBR-green based RT-qPCR. Each bar is the average of 3 replicates and represents the mRNA expression of the indicated genes relative to GAPDH (p-value, *<0.05, **<0.005 and ***<0.0005 unpaired t-test). (D) p53 truncating mutants are partially localized in the mitochondria. Western blot analysis of total cell extracts and of mitochondrial fractions shows translocation of p53 truncations in mitochondria. Purity of fractions was verified with antibodies specific for the mitochondria matrix protein CypD, mitochondria outer-membrane associated protein Tom20, nuclear protein PARP and cytoplasmic protein p42/44. (E) Immuno-precipitation analysis of the mitochondrial fraction from H1299 cells expressing FLAG-tagged different p53 truncations. Cell extracts were immuno-precipitated with a FLAG specific antibody and analyzed by western blot with a p53 N-terminal specific (DO1) antibody and CypD specific antibody. (F) p53 truncating mutants increase the mitochondria inner pore permeability. See Materials and methods for details on assay design. The graph indicates the relative number of H1299 cells expressing different p53 truncations that retain calcein fluorescence in mitochondria, upon CoCl2 treatment, in the presence or absence of CsA (2 µM) (n = 3, p-value *<0.05, unpaired t-test). (G) The graph indicates the percentage of cells retaining calcein fluorescence in mitochondria upon CoCl2 treatment in the indicated cell lines upon p53 knockdown with shRNA. See Figure 4—figure supplement 3 for p53 knockdown efficiency. Note, there is an increase in the number of calcein positive cells (decreased permeability) upon p53 knockdown in cells harboring p53-psi or p53 exon-6 truncating mutations (n = 3, p-value *<0.05, **<0.005 and ***<0.0005, unpaired t-test). (H) The chart indicates the ratio of JC-1 aggregate relative to monomer in the indicated cells after p53 knockdown with a p53 shRNA lentiviral construct relative to scrambled shRNA. Note the increase in the number of J aggregates (increased mitochondrial polarization) upon p53 knockdown in cells harboring p53-psi or p53 exon-6 truncating mutations (n = 3, p-value *<0.0005, **<0.00005 and ***<0.000005, unpaired t-test).
Figure 4—figure supplement 1
p53-psi molecularly resembled TP53 exon-6 truncating mutations.
(A) Schematic representation of normal splicing as well as an alternative splicing event in TP53 generating p53-WT and p53-psi as indicated. Lower panel schematic shows structural similarity between p53-psi protein and p53 exon-6 truncations. Each exon in TP53 is indicated with Roman numerals.
Figure 4—figure supplement 2
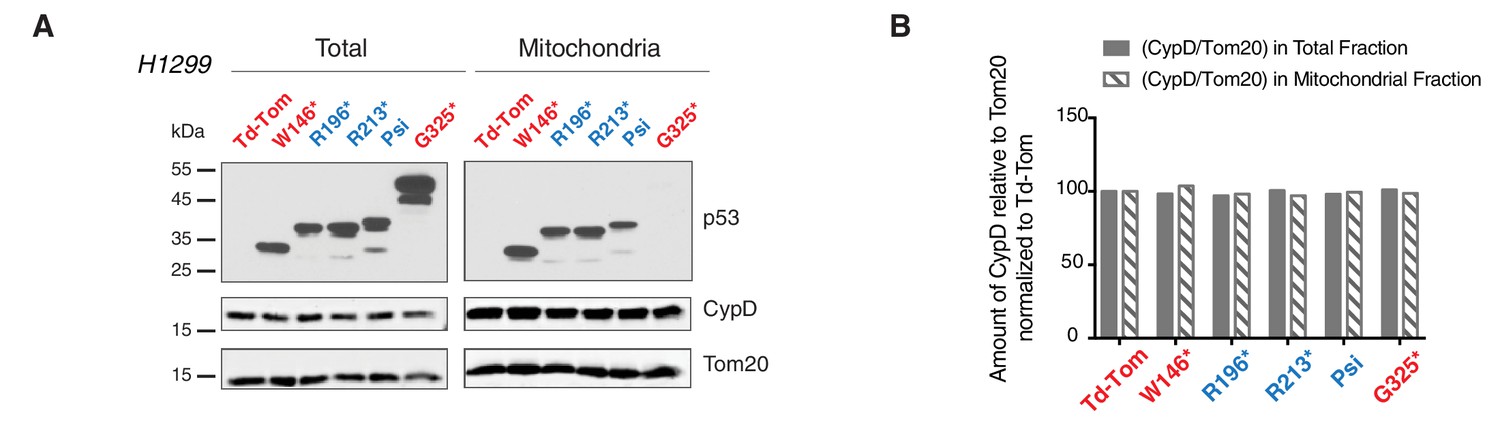
p53-psi and p53 exon-6 truncations localize to mitochondria without affecting expression and localization of CypD.
(A) Western blot analysis of H1229 cells expressing different p53 truncations and their localization in mitochondria shown by p53 N-terminal specific (DO1) antibody. Ectopic expression of these truncations does not affect CypD expression and localization in mitochondria shown by CypD specific antibody. Tom20 was used as a loading control for total as well as mitochondrial fraction. These fractions were further used for co-immunoprecipitation experiment shown in Figure 4E. (B) This chart represents the ratio of amount of CypD to Tom20 (arbitrary units) in total and the mitochondrial fraction of different p53 truncating expressing cells relative to Td-Tom expressing cells.
Figure 4—figure supplement 3
Knockdown efficiency upon infection with shRNA targeting p53.
(A) mRNA expression was quantified by SYBR-green based RT-qPCR in the indicated cell lines 96h post infection. Each bar is the average of 3 replicates and represents the mRNA expression of the indicated gene relative to GAPDH (p-value, *<0.05, **<0.005 and ***<0.0005 unpaired t-test).
Figure 4—figure supplement 4
p53-psi and p53 exon-6 truncations regulate MPTP and mitochondrial polarization in CypD dependent manner.
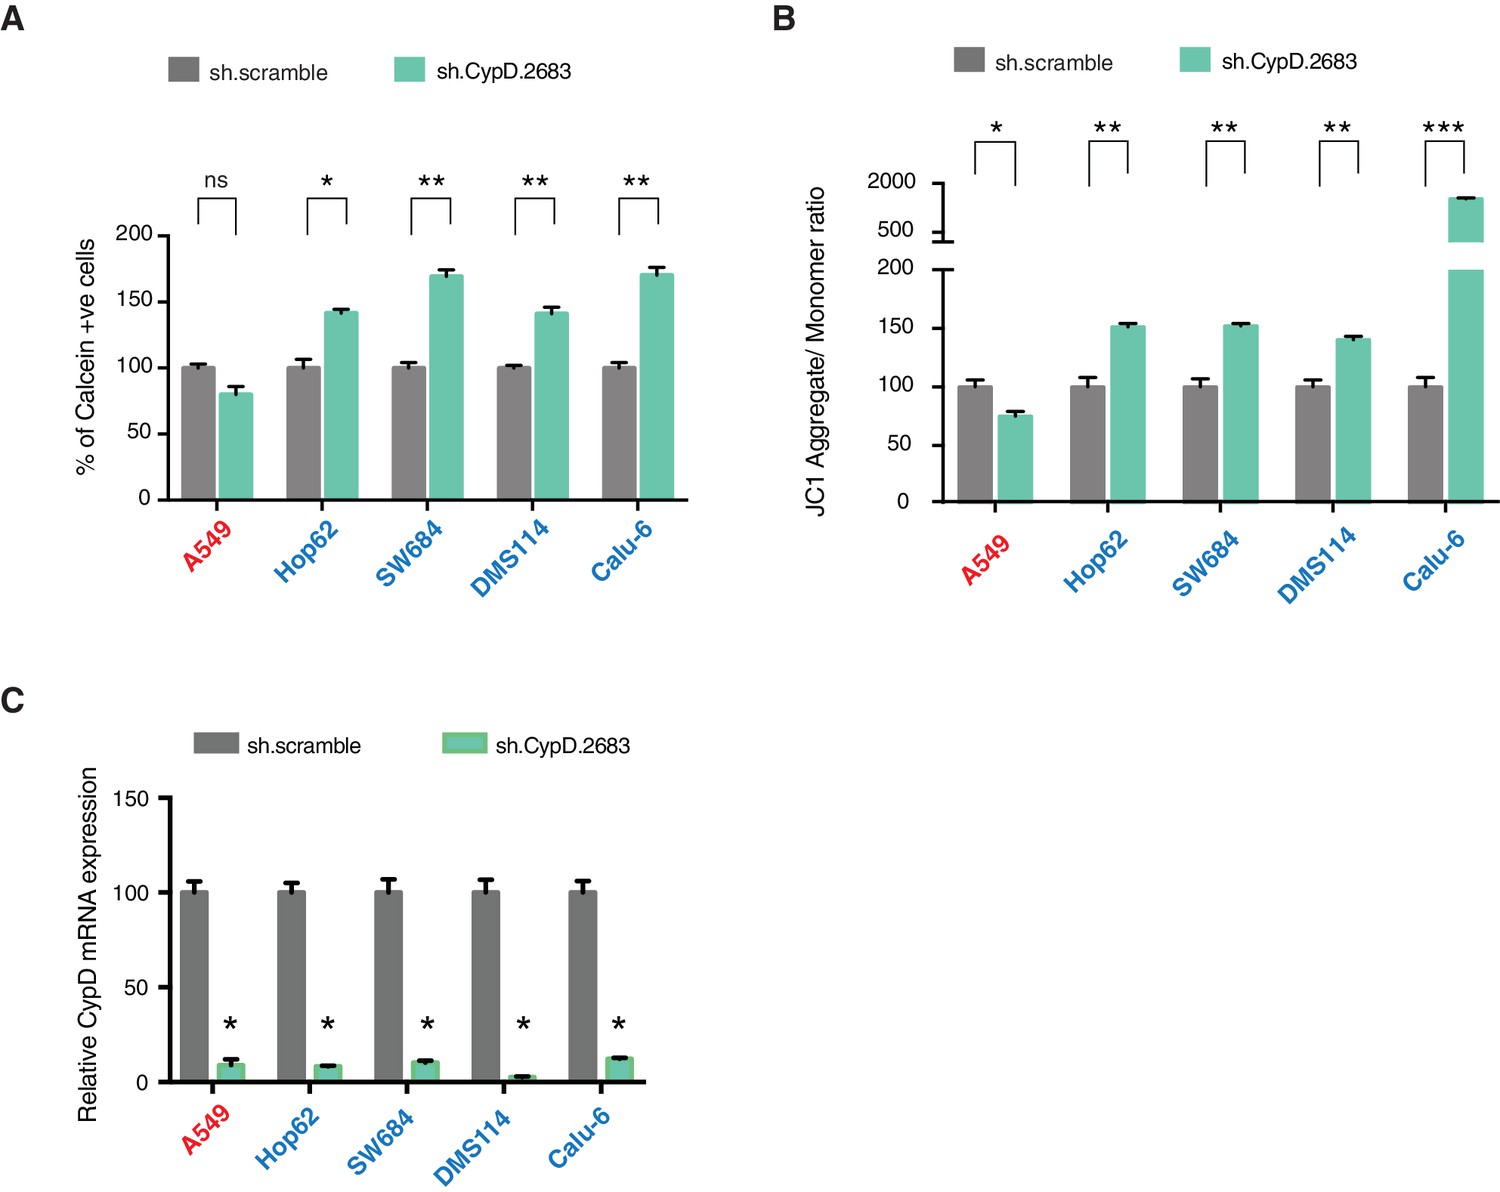
(A) The chart represents the percentage of cells retaining calcein in mitochondria upon CoCI2 treatment. Each column is the average of 3 independent experiments and indicates the mean percentage of calcein positive cells relative to scramble shRNA for each cell lines with standard deviation (n = 3, p-value *<0.005 and **<0.0005, unpaired t-test). TP53 mutation status for the cell lines utilized in this study is indicated on the right. (B) The chart indicates the ratio of J aggregate relative to monomer in the indicated cells after p53 knockdown with a p53 shRNA lentiviral construct relative to scrambled shRNA. Note the increase in the number of J aggregates (increased mitochondrial polarization) upon p53 knockdown in cells harboring p53-psi or p53 exon-6 truncating mutations (n = 3, p-value *<0.0005, **<0.00005 and ***<0.000005, unpaired t-test). (C) The chart represents the knockdown efficiency upon infection with shRNA targeting CypD in indicated cell lines 96h after infection. mRNA expression was quantified by SYBR-green based RT-qPCR. Each bar is the average of 3 replicates and represents mRNA expression of the indicated gene relative to GAPDH (p-value, *<0.05, unpaired t-test).
Figure 4—figure supplement 5

Knockdown efficiency upon infection with shRNA targeting p53.
(A) mRNA expression was quantified by SYBR-green based RT-qPCR in the indicated cell lines 96h post infection. Each bar is the average of 3 replicates and represents mRNA expression of the indicated gene relative to GAPDH (p-value, *<0.05, unpaired t-test).
Figure 4—figure supplement 6
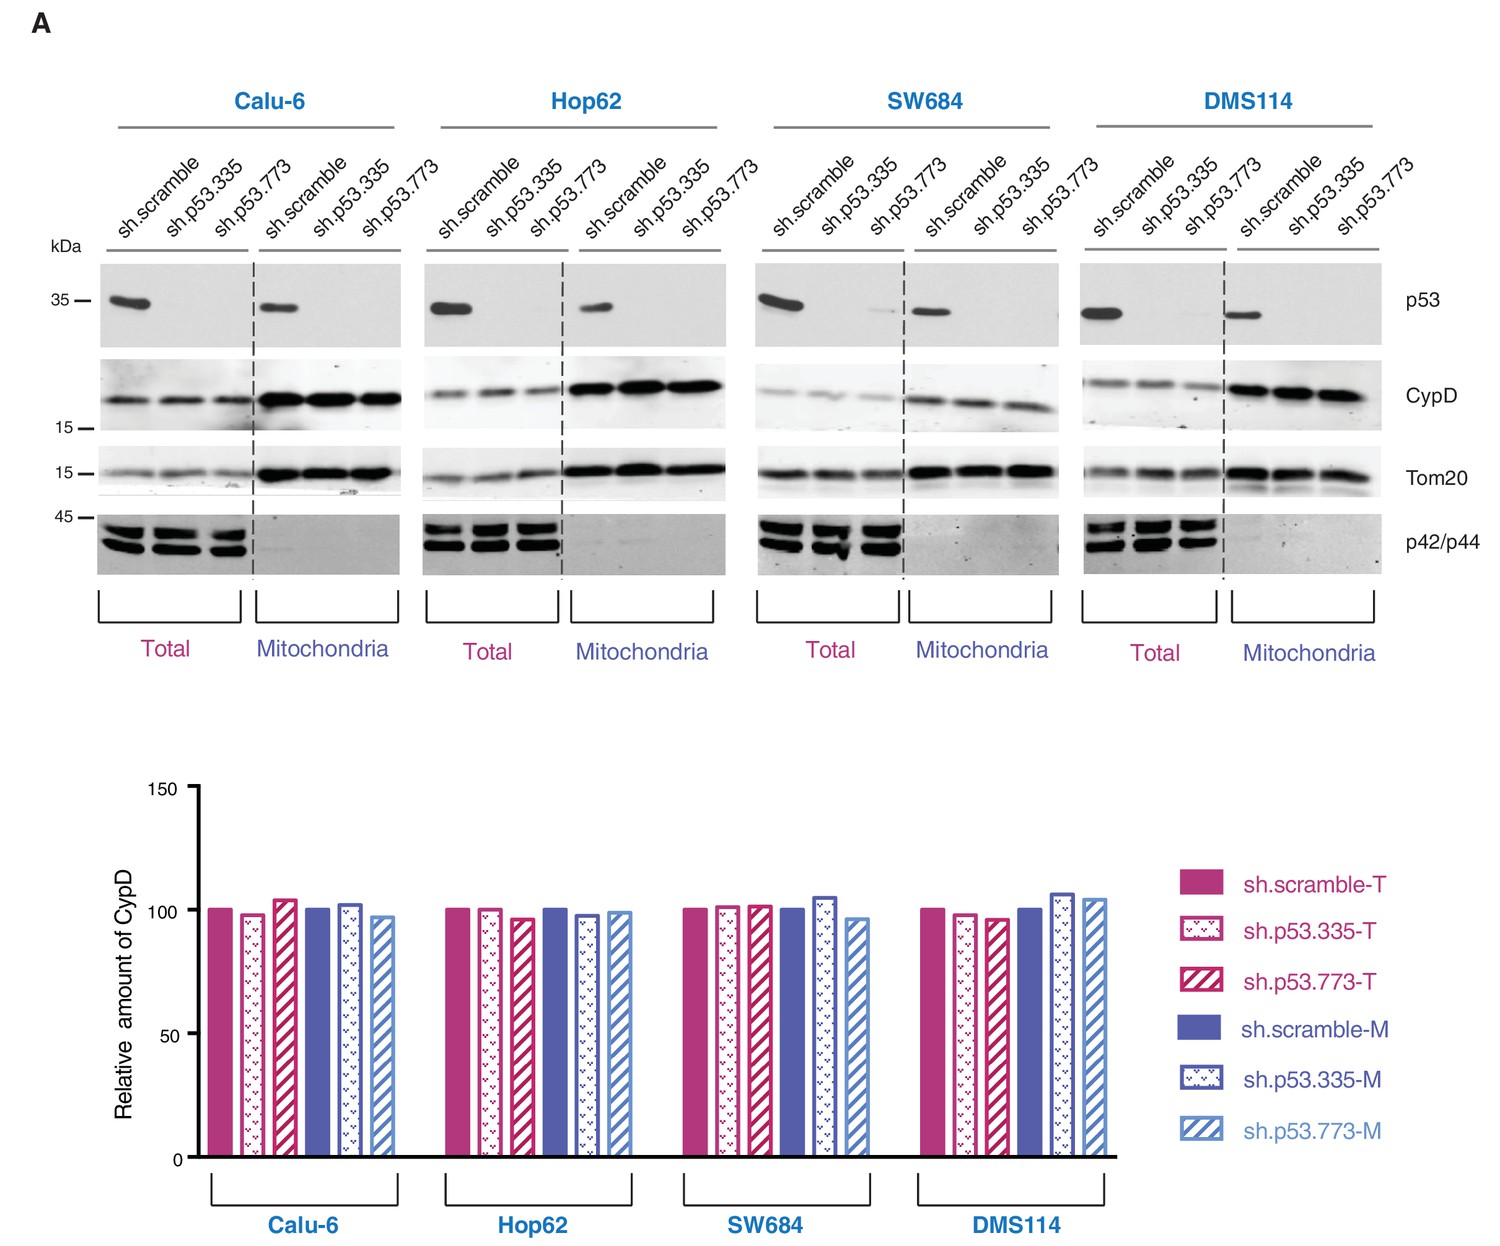
Knockdown of p53 exon-6 truncations and p53-psi does not affect the expression and localization of CypD.
(A) Western blot analysis (top panel) of total cell extracts and mitochondria fractions of the indicated cell lines. P53 was silenced by shRNA-mediated knockdown with two independent targeting lentiviral constructs. Purity of mitochondrial fractions was confirmed by immuno-blot analysis with antibodies targeting the Tom20 mitochondrial protein and the p42/44 MAPK cytosolic proteins. In the lower panel, the chart depicts quantification of the relative amount of CypD in the total (purple hues) and mitochondria fractions (blue hues) of the indicated cell lines. Levels of intensity of each CypD and Tom20 bands were quantified using the imageJ software, represented as a ratio of CypD to Tom20 and normalized to levels detected in sh.scramble samples, T= total cell lysate and M= mitochondrial lysate.
Figure 4—figure supplement 7
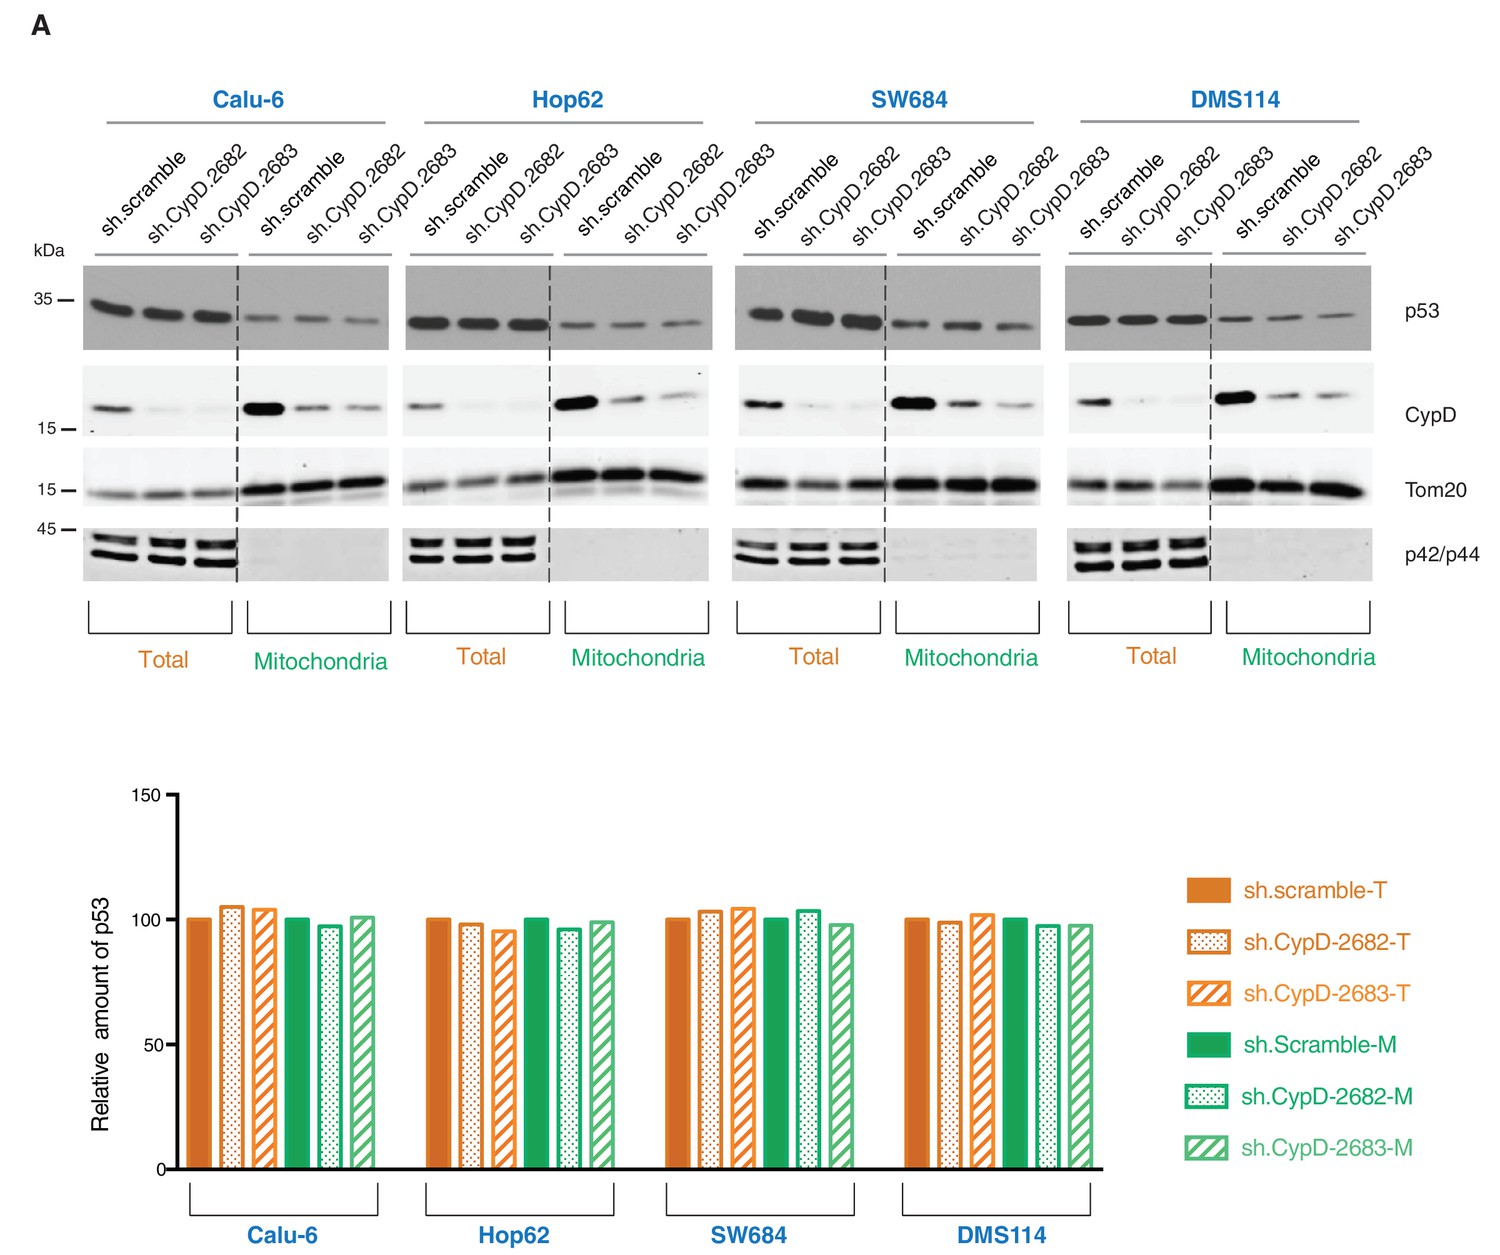
Knockdown of CypD does not affect the expression and localization of mutant p53 isoforms.
(A) Western blot analysis (top panel) of total cell extracts and mitochondria fractions of the indicated cell lines. CypD was silenced by shRNA-mediated knockdown with two independent targeting lentiviral constructs. Purity of mitochondrial fractions was confirmed by immuno-blot analysis with antibodies targeting the Tom20 mitochondrial protein and the p42/44 MAPK cytosolic proteins. In the lower panel, the chart depicts quantification of the relative amount of p53 in the total (orange hues) and mitochondria fractions (green hues) of the indicated cell lines. Levels of intensity of each p53 and Tom20 bands were quantified using the imageJ software, represented as a ratio of p53 to Tom20 and normalized to levels detected in sh.scramble samples, T= total cell lysate and M= mitochondrial lysate.
Figure 5 with 2 supplements
CypD activity is required for phenotypes associated with TP53 exon-6 truncating mutations.
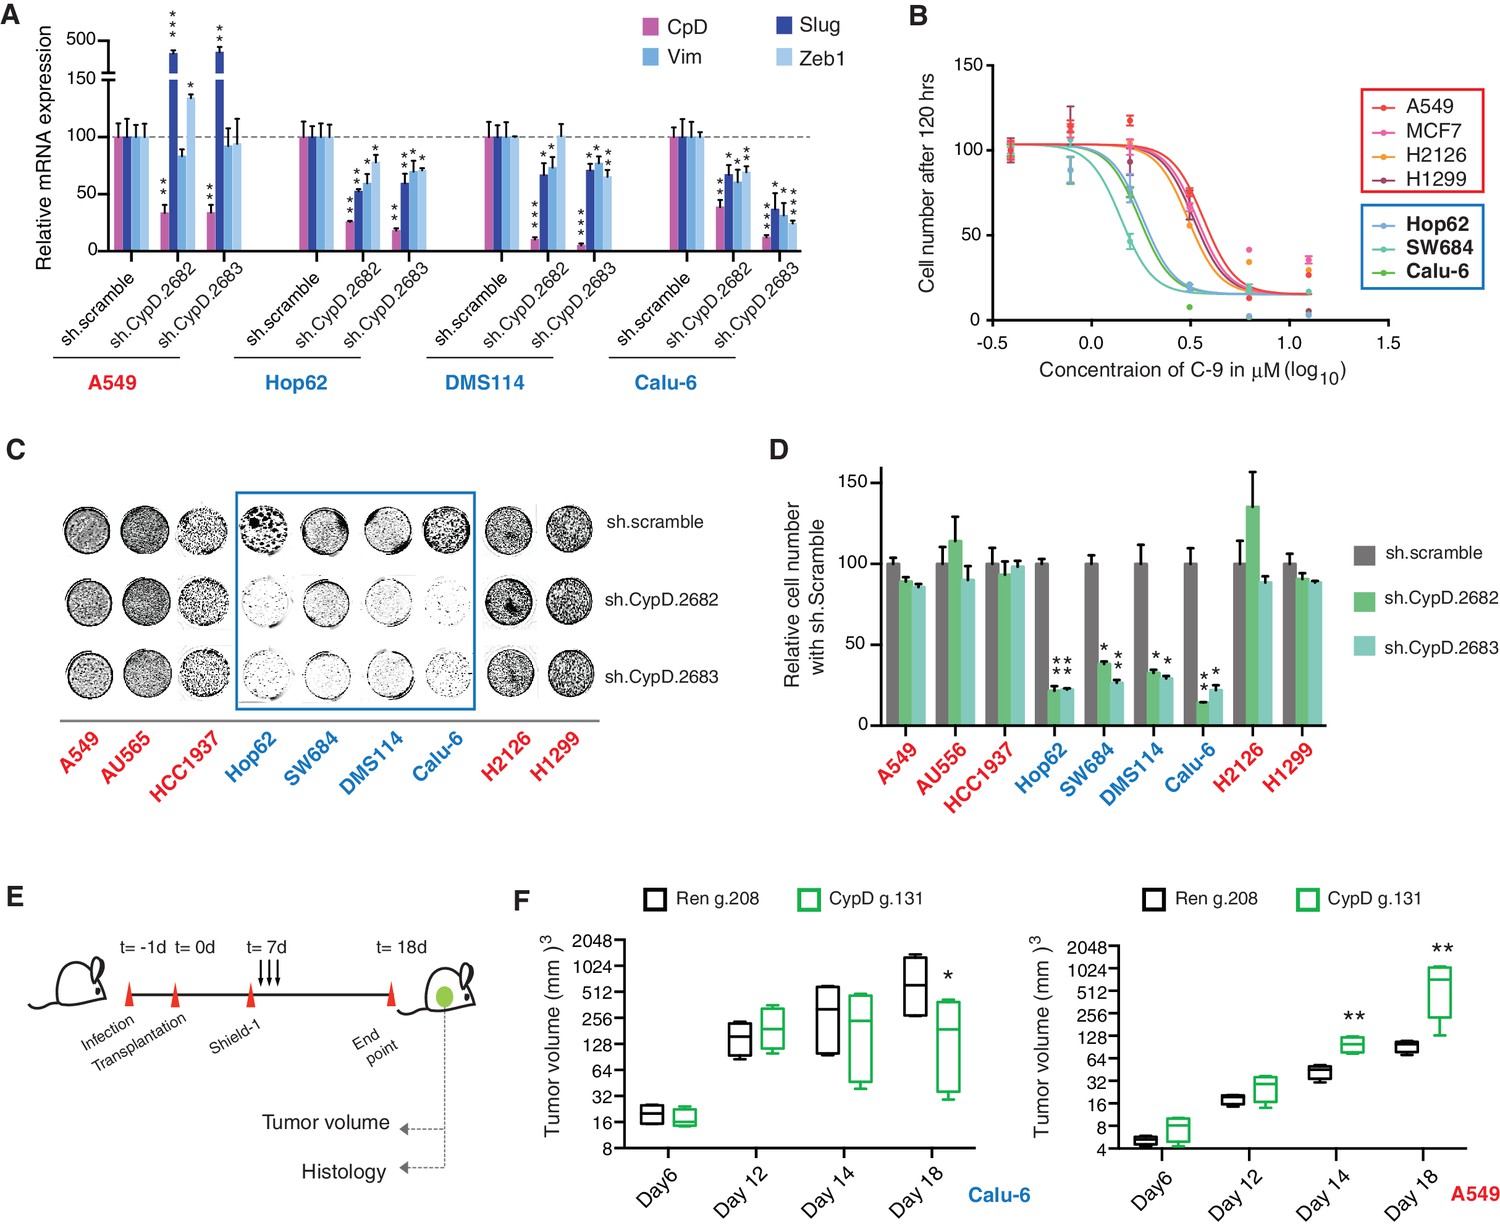
(A) CypD is required for maintaining cells in a mesenchymal like state. The chart represents mRNA expression analysis of the indicated genes in A549 (p53-WT), Hop62 (p53-psi), DMS114 (p53-R213*) and Calu-6 (R196*) cell lines after CypD knockdown. Cells harboring p53-psi or TP53 exon-6 nonsense mutations are indicated in blue. mRNA expression was quantified by SYBR-green-based RT-qPCR. Each bar is the average of 3 replicates and represents mRNA expression of the indicated gene relative to GAPDH (p-value, *<0.05, **<0.005 and ***<0.0005, unpaired t-test). See Figure 5—figure supplement 1A for analysis in additional cell lines. (B) CypD is required for the survival of cells harboring p53-psi splice or TP53 exon-6 truncating mutations. The graph represents cell survival curve of indicated cell lines when treated with CypD inhibitor C-9 for 120 hr. (C) Crystal violet staining of the indicated cell lines upon CypD knockdown with two independent shRNAs. A scramble shRNA was used as negative control. The quantification of knockdown efficiency is provided in Figure 5—figure supplement 1B. (D) The chart depicts the percentage of viable cells 8 days after infection with the indicated CypD shRNA constructs relative to scramble shRNA control. Each bar represents the mean of 9 individual replicates (p-value *<0.0005 and **<0.00005, unpaired t-test). (E) Workflow of the transplantable model system used in this study. A549 (p53-WT) and Calu-6 (p53 R196*) cells were transduced with an inducible CRISPR-Cas9 (DD-Cas9) targeting CypD (CypD g.131) and Renila (Ren g.208). Cells were transplanted sub-cutaneously in immune-deficient mice. When the tumors reached an approximate size of 4–5 mm in diameter, mice were treated with Shield-1 (1 µg). Tumor volume was determined at the indicated time points. See Supplementary file 5 for sgRNA sequences. (F) The charts illustrate quantification of tumor volumes (mean ± SD) in the indicated cohorts at given time points (n = 4, p-value *<0.05, unpaired t-test). Validation of CypD inactivation is provided in Figure 5—figure supplement 2.
Figure 5—figure supplement 1
Differential expression of indicated genes and knockdown efficiency of CypD shRNAs.
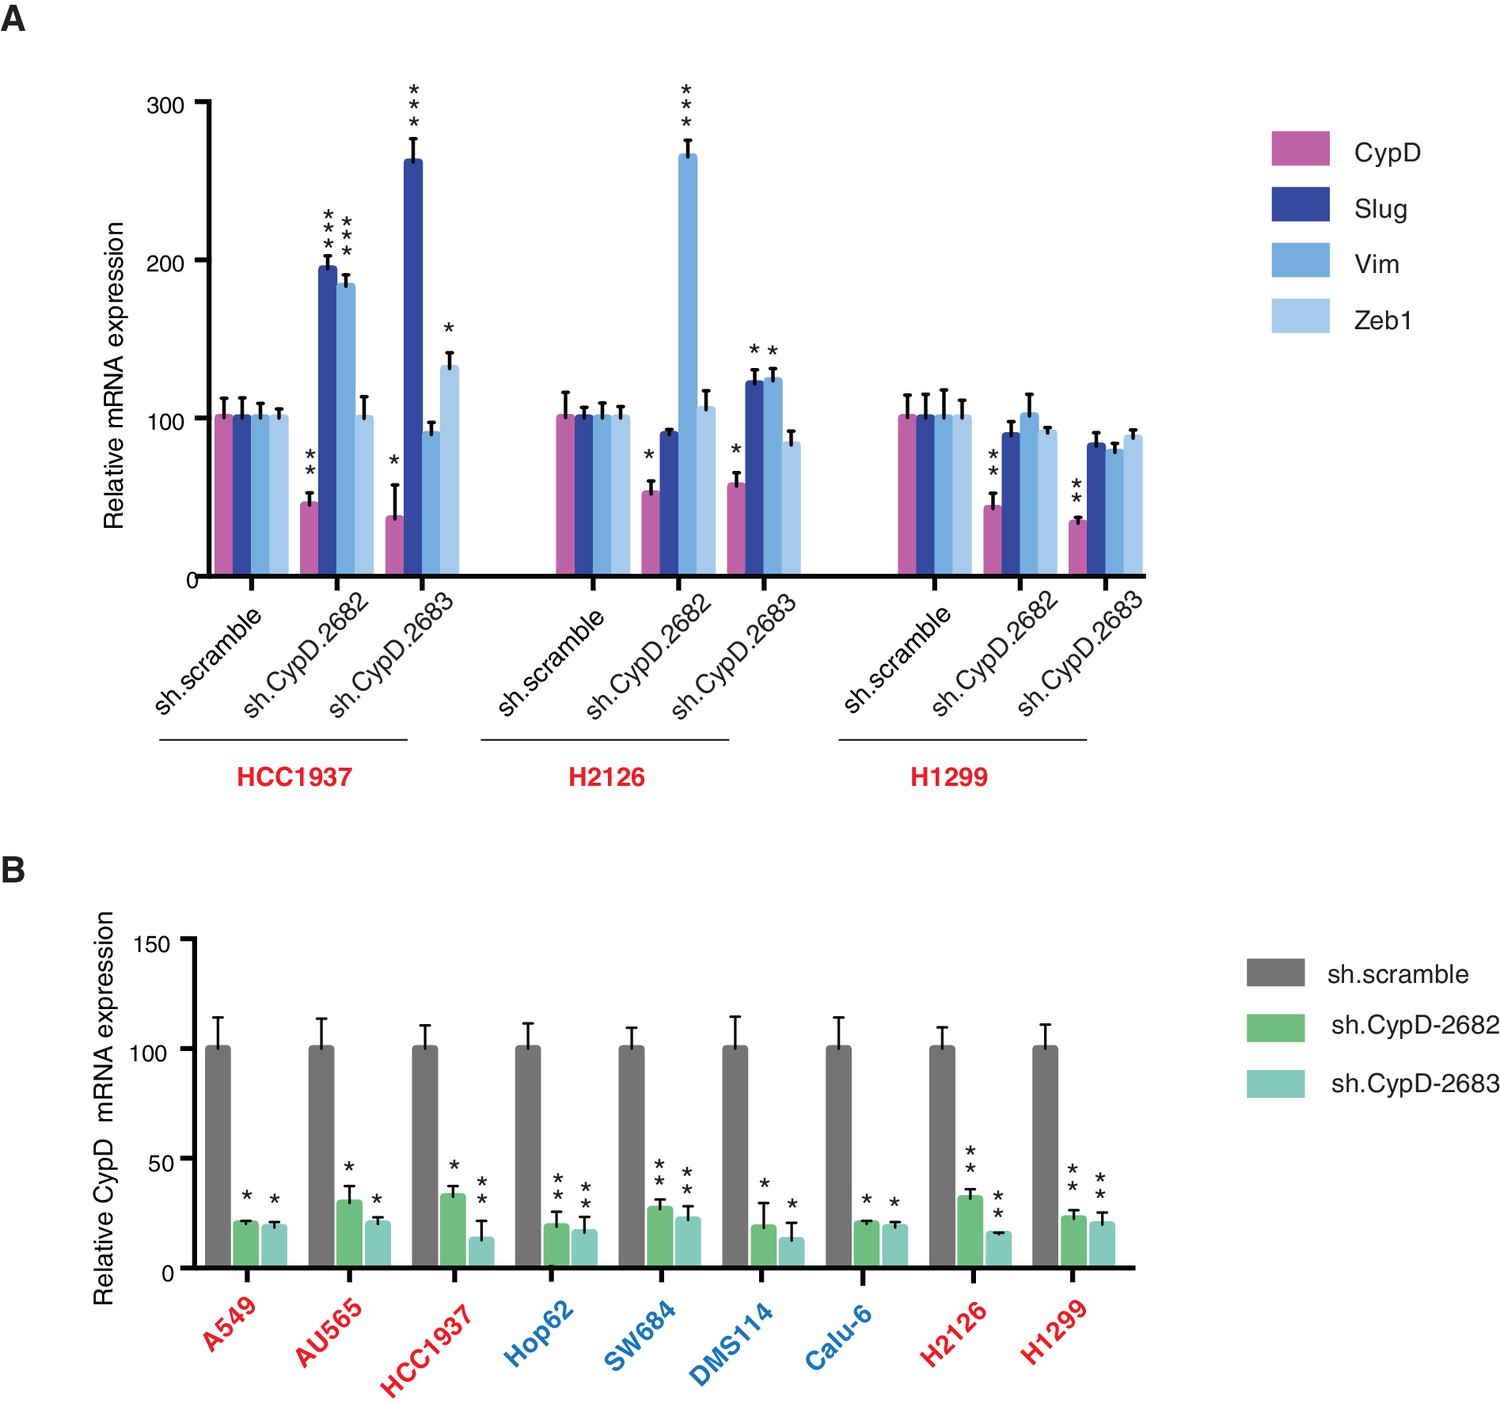
(A) The chart represents mRNA expression analysis of the indicated genes in HCC1937, H2126 and H1299 cell lines. mRNA expression was quantified by SYBR-green based RT-qPCR. Each bar is the average of 3 replicates and represents mRNA expression of the indicated genes relative to GAPDH (p-value, *<0.05, **<0.005 and ***<0.0005 unpaired t-test). (B) The chart represents the knockdown efficiency of two CypD shRNAs in indicated cell lines at 96h post infection. mRNA expression was quantified by SYBR-green based RT-qPCR. Each bar is the average of 3 replicates and represents mRNA expression of the indicated genes relative to GAPDH (p‐value, *<0.005 and **<0.0005 unpaired t-test).
Figure 5—figure supplement 2
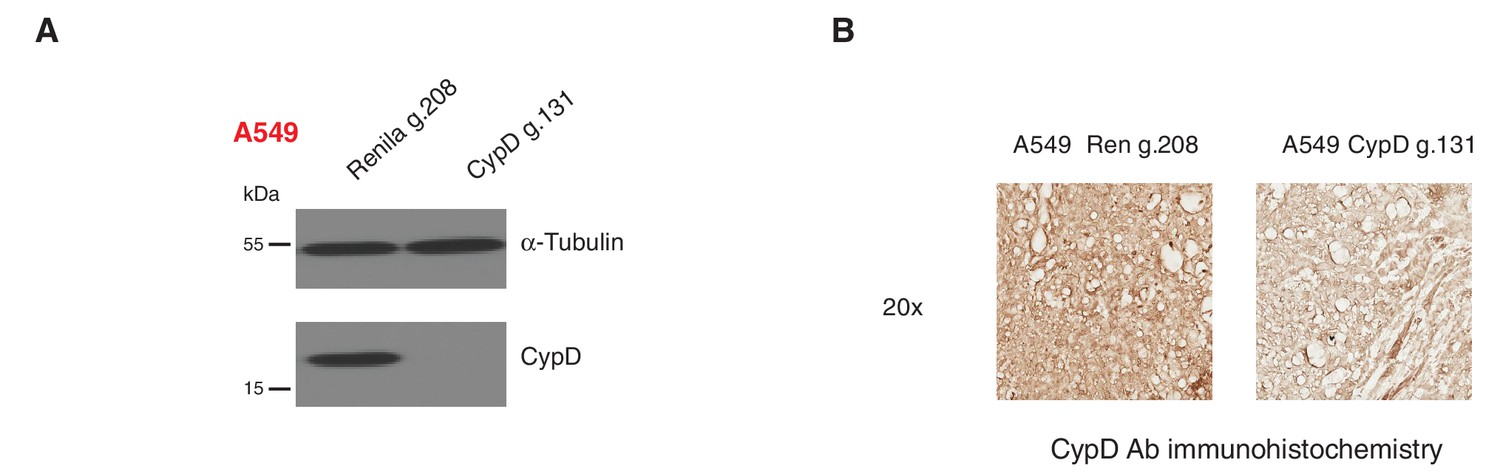
Inactivation of CypD by CRISPR-Cas9 in in vitro and in vivo systems.
(A) Western blot analysis of the indicated cell lines using a CypD specific antibody and an antibody against RasGAP as loading control. (B) Mice were injected sub-cutaneously with A549 cells, after 9 days treated with Shield-1 and sacrificed at day 16. Sections of tumors transduced either with Renila sgRNA or CypD sgRNA were stained with a CypD specific antibody. Representative pictures are shown.
Additional files
-
Supplementary file 1
List of tumor studies used for analysis of distribution of Missense, Exon-6 and other truncations in TP53.
- https://doi.org/10.7554/eLife.17929.030
-
Supplementary file 2
Values of p53 mRNA expression with different mutations obtained from four different tumor types.
- https://doi.org/10.7554/eLife.17929.031
-
Supplementary file 3
Number of tumor samples with indicated mutation types in primary and metastatic colorectal carcinoma.
- https://doi.org/10.7554/eLife.17929.032
-
Supplementary file 4
Sequence of sense strand of shRNAs used in this study.
- https://doi.org/10.7554/eLife.17929.033
-
Supplementary file 5
Complimentary oligonucleotides used for cloning the indicated sgRNAs.
- https://doi.org/10.7554/eLife.17929.034
Download links
A two-part list of links to download the article, or parts of the article, in various formats.
Downloads (link to download the article as PDF)
Open citations (links to open the citations from this article in various online reference manager services)
Cite this article (links to download the citations from this article in formats compatible with various reference manager tools)
TP53 exon-6 truncating mutations produce separation of function isoforms with pro-tumorigenic functions
eLife 5:e17929.
https://doi.org/10.7554/eLife.17929


