The Cac1 subunit of histone chaperone CAF-1 organizes CAF-1-H3/H4 architecture and tetramerizes histones
- University of Colorado School of Medicine, United States
- Weill Cornell Medicine, United States
- MD Anderson Cancer Center, United States
- University of Colorado, Boulder, United States
Figures
Figure 1 with 1 supplement
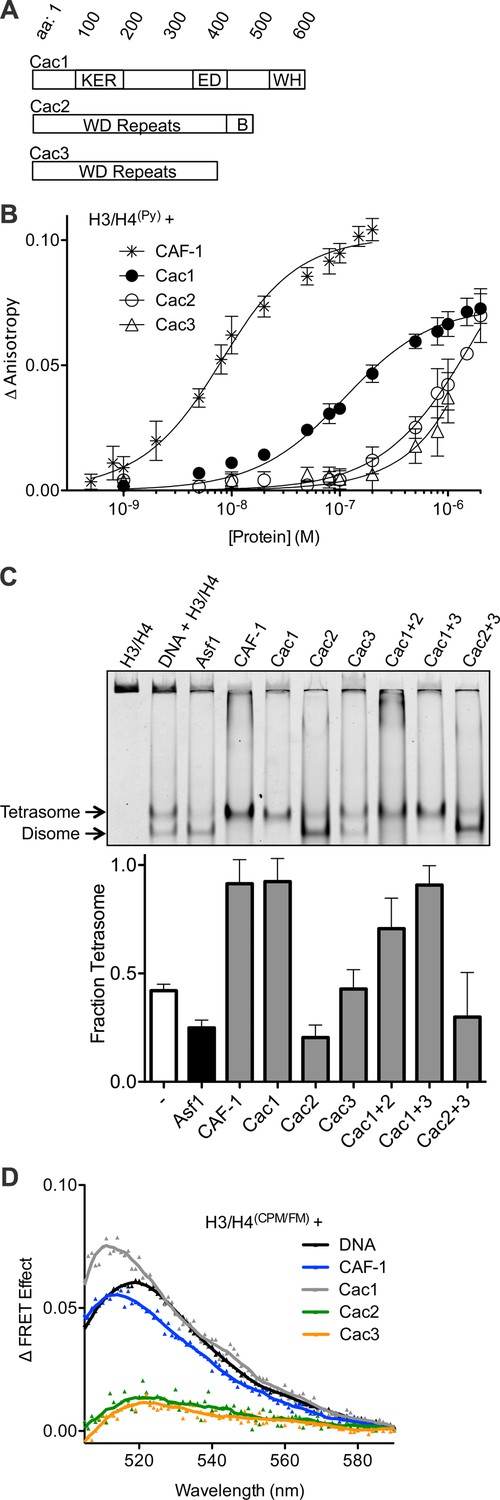
The Cac1 subunit is sufficient for (H3/H4)2 tetramerization.
(A) Schematic of domains in the individual CAF-1 subunits. (B) H3/H4(Py) binding to individual CAF-1 subunits. Fluorescence anisotropy of 25 nM pyrene-labeled H3/H4 was monitored with titration of individually purified Cac1, Cac2, or Cac3 in Histone Buffer (H.B.: 20 mM Tris, 150 mM KCl, 2 mM MgCl2, 0.5 mM TCEP, 1% Glycerol, 0.05% BRIJ-35.) The CAF-1 complex was titrated into 5 nM H3/H4(Py). The curves were fitted using Equation 3. (C) A representative EMSA separating histone:DNA species as disomes or tetrasomes. 1.6 µM of the indicated histone chaperone or CAF-1 subunit was incubated with 0.2 µM H3/H4(FM) dimer, prior to addition of 0.4 µM 80 bp DNA. The bar graph shows the mean and standard deviation of fraction of tetrasomes formed, calculated by Equation 5, from at least three independent experiments. (D) FRET of mixed labeled H3/H4(CPM/FM). Spectra were obtained for 10 nM of labeled histones incubated with 0.2 µM CAF-1 or DNA, or 1 µM CAF-1 subunit. The FRET Effect was calculated using Equation 4 from at least three independent experiments.
Figure 1—figure supplement 1
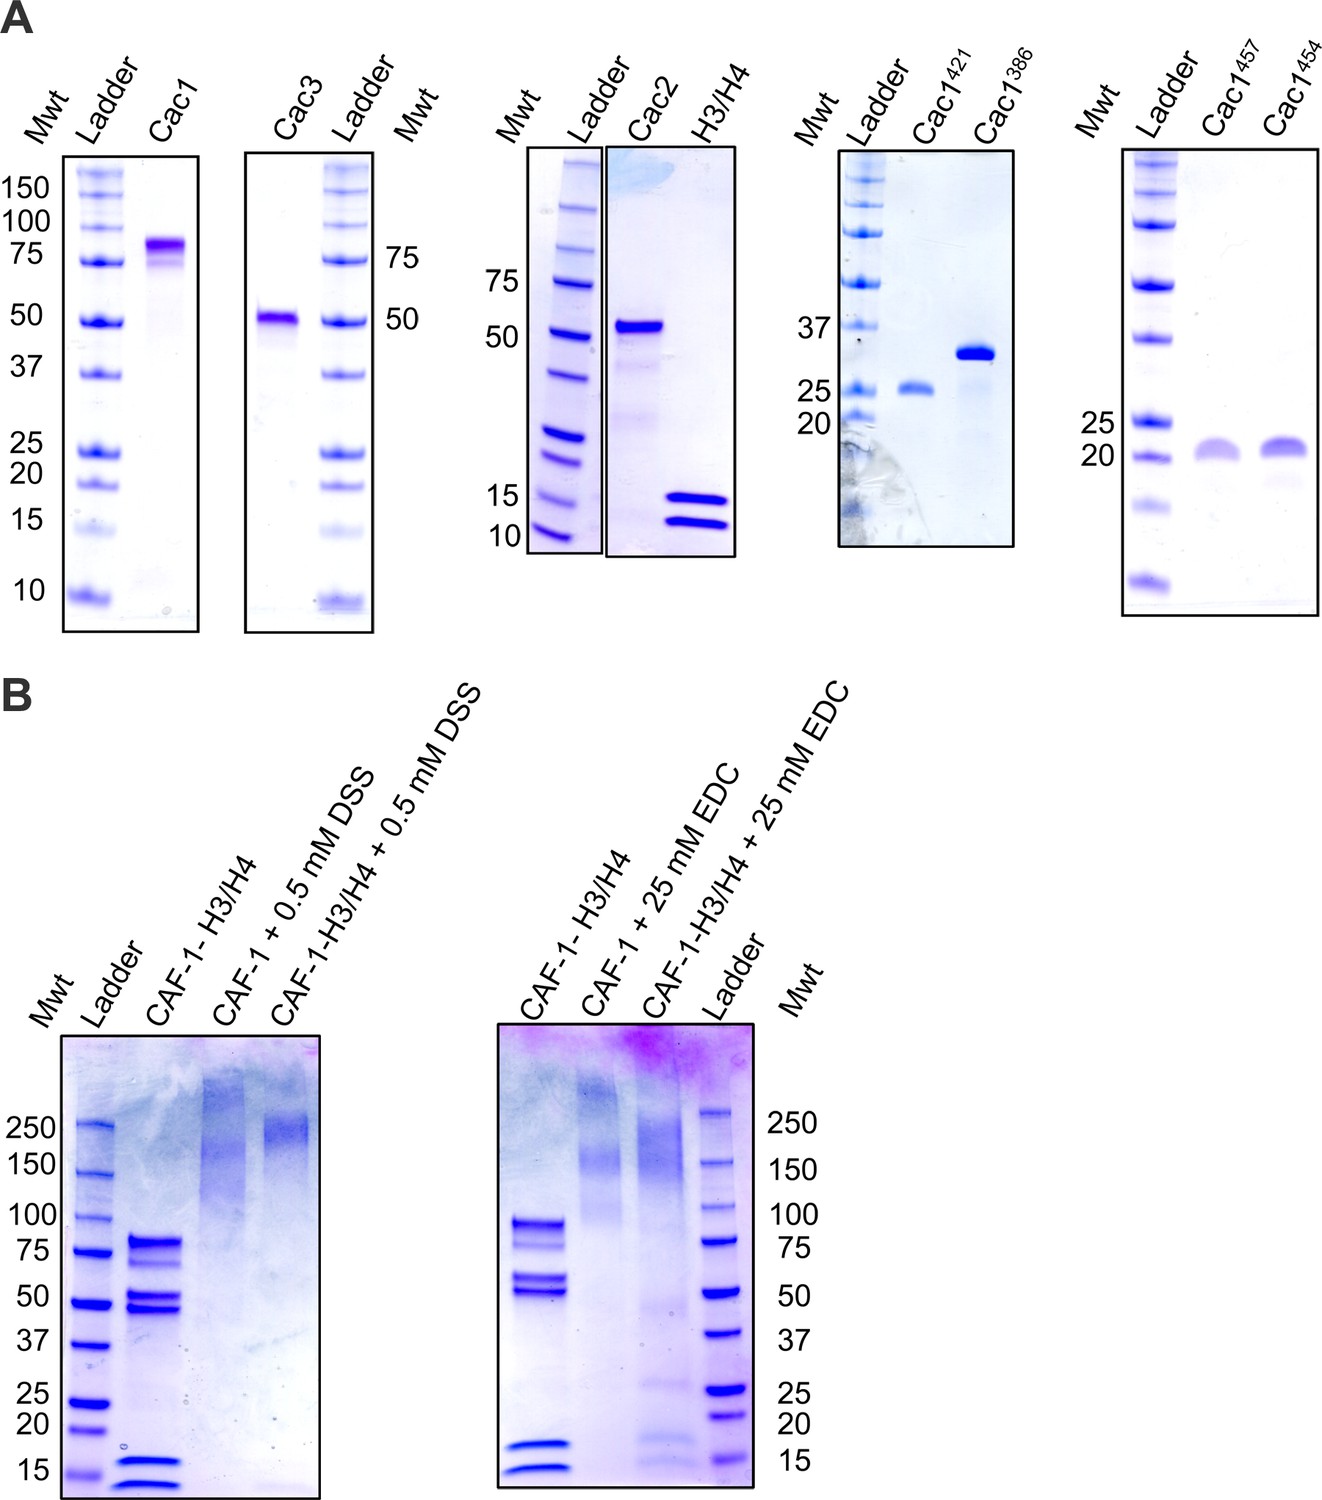
Purified proteins used in this study.
Coomassie-stained SDS PAGE of the (A) individual, purified CAF-1 subunits, Cac1 truncations, and (B) CAF-1 and CAF-1-H3/H4 complexes cross-linked by DSS or EDC.
Figure 2 with 1 supplement
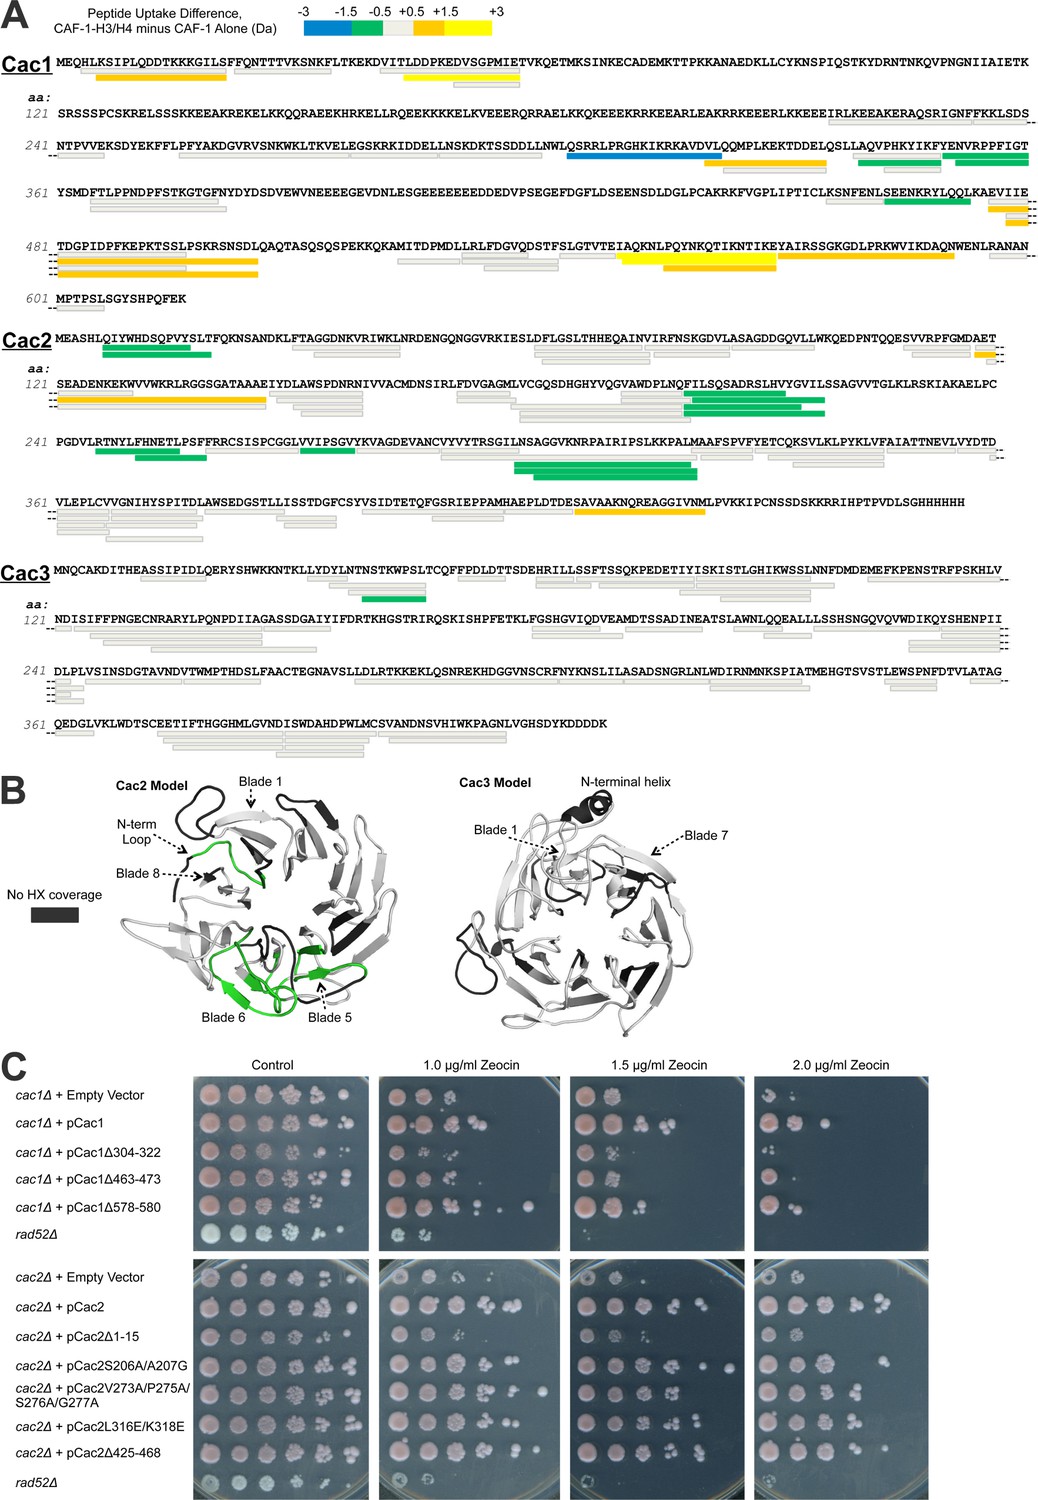
Hydrogen/deuterium exchange of CAF-1, and CAF-1-H3/H4 complexes.
(A) The sequences of the three individual CAF-1 subunits are shown. Each bar represents an individual identical peptide observed in the protein between the compared samples, plotted as the difference in deuteron uptake between the CAF-1 and CAF-1-H3/H4 samples (i.e., difference = CAF-1-H3/H4 – CAF-1 only). The differences in deuteron uptake at 60’ are colored according to the legend. The 'cooler' colors (green, blue, and purple) represent an increase in apparent protection for the peptide in CAF-1-H3/H4 compared to the CAF-1 sample, whereas the 'warmer' colors (orange, yellow, and red) represent decreased apparent protection. Peptide coverage was approximately 60%, 80%, and 80% for Cac1, Cac2 and Cac3, respectively. (B) Differences in HX at 60’ were mapped on PHYRE2 models of Cac2 and Cac3. The coloring scheme is the same as for A, but amino acids with no coverage are colored dark gray to distinguish these residues from those that have coverage but did not exchange significantly. (C) The top panel shows five fold serial dilution analysis of strain CFY53 (cac1) with the vector pCac1 introduced that was either empty, expressed wild type Cac1 or Cac1 with the indicated amino acid changes. The bottom shows five fold serial dilution analysis of strain CFY54 (cac2) with the vector pCac2 introduced that was either empty, expressed wild type Cac2 or Cac2 with the indicated amino acid changes.
Figure 2—figure supplement 1
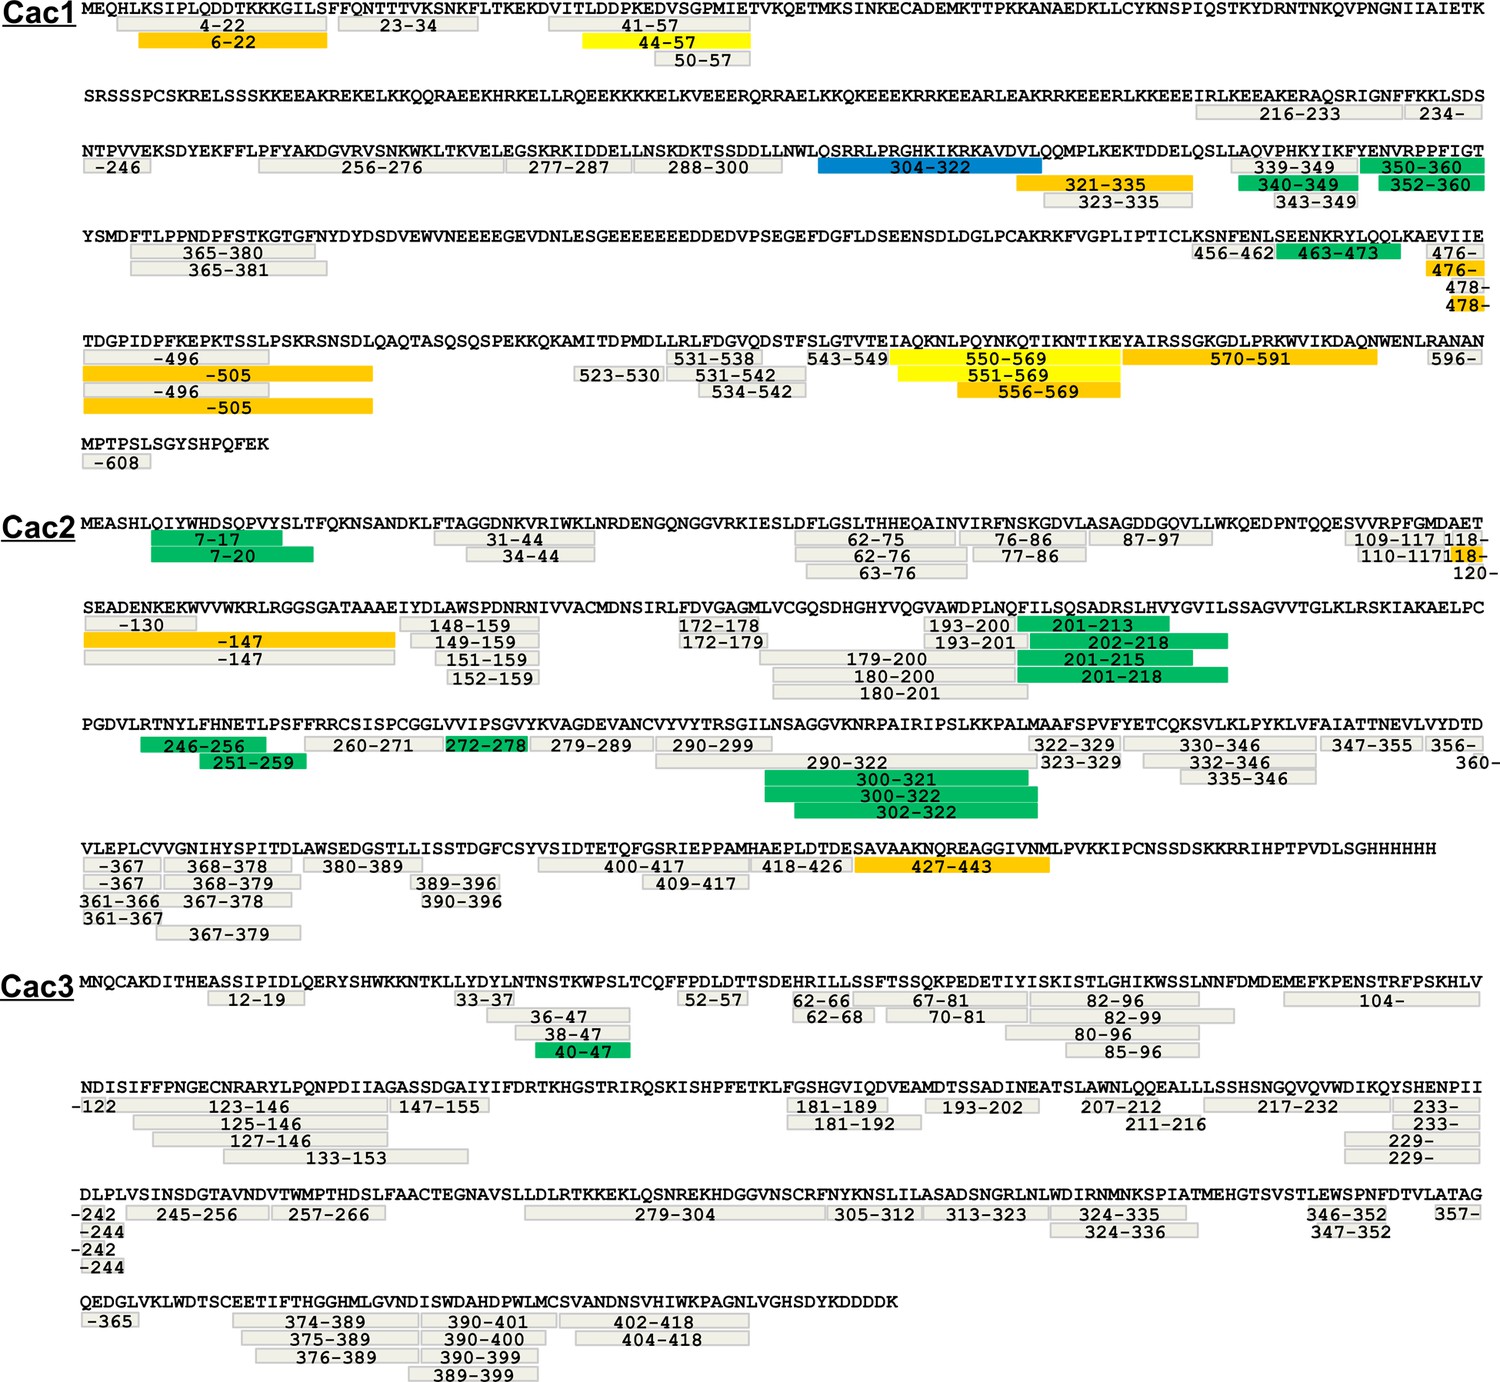
Peptide coverage in HX-MS.
Coverage maps of Cac1, Cac2, and Cac3, from side-to-side comparisons between CAF-1 and CAF-1-H3/H4 samples in the HX study. All identical peptides between multiple samples were calculated for differences in deuteron uptake at 60’ and colored accordingly, using the same scheme as in Figure 2B.
Figure 3 with 1 supplement
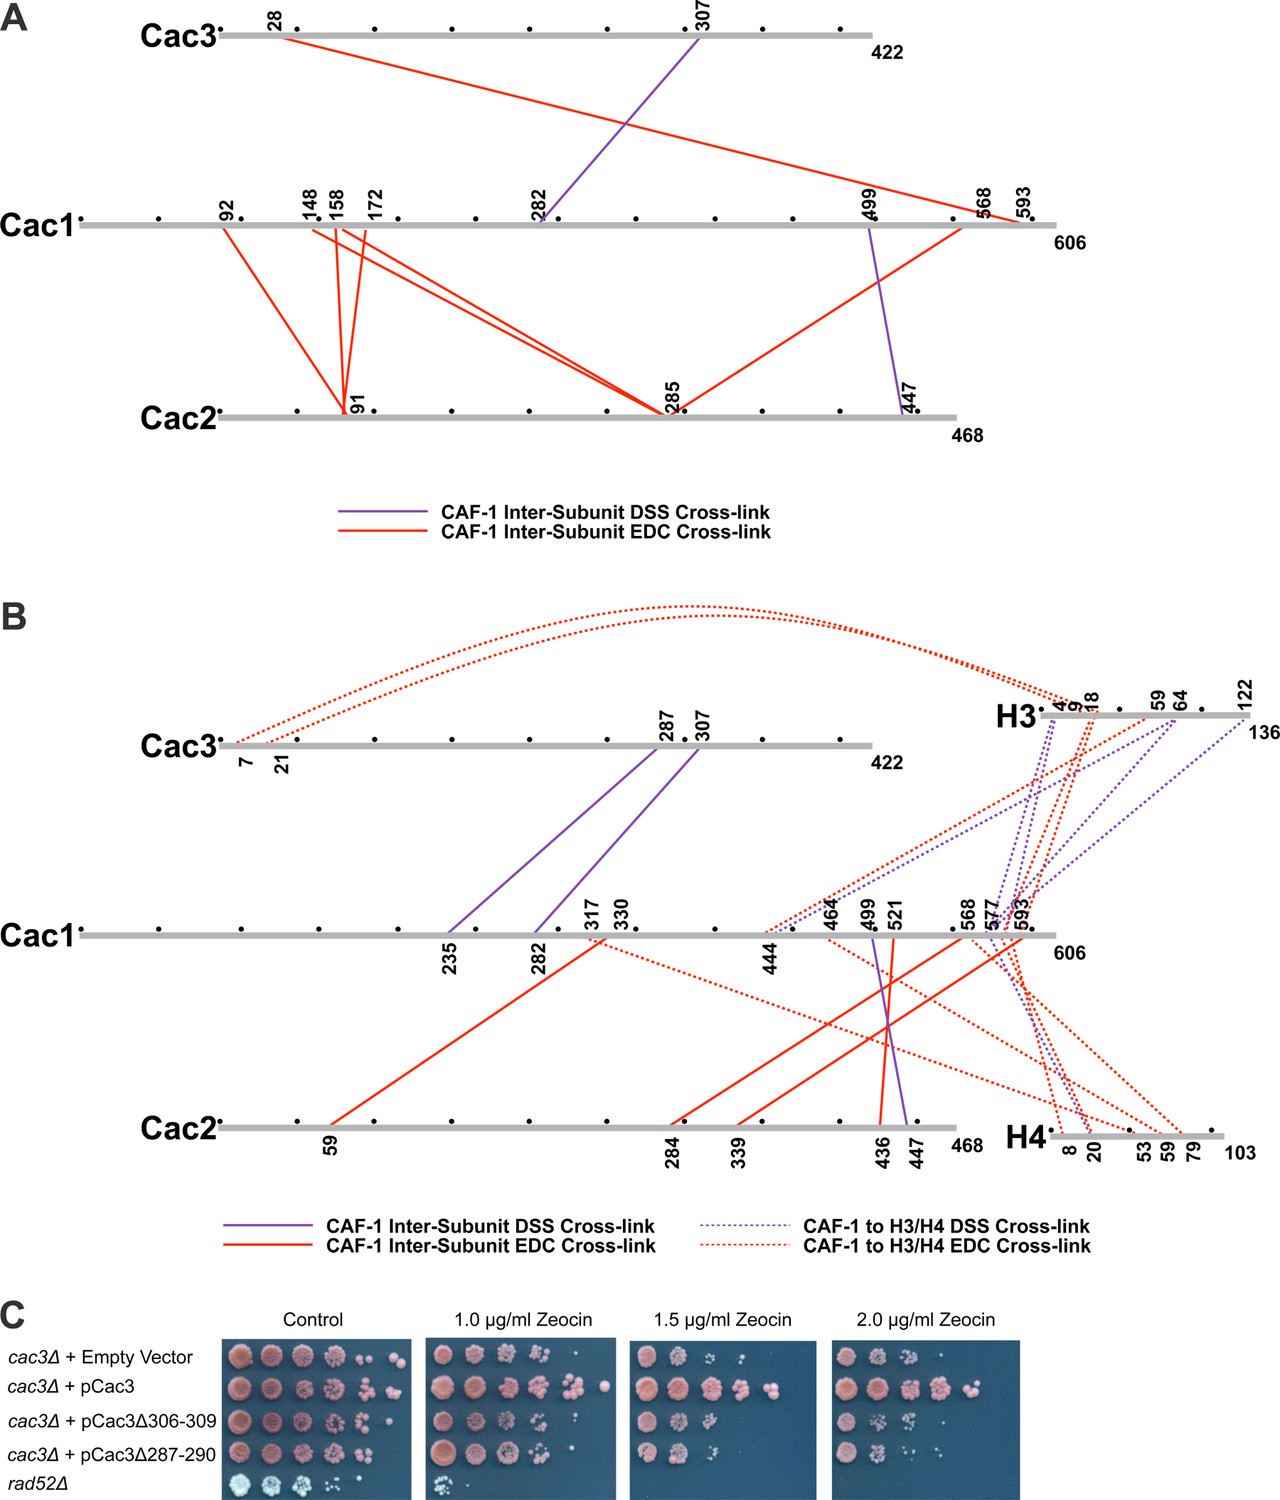
Chemical cross-linking of CAF-1 and CAF-1-H3/H4 complexes.
(A) CAF-1 or (B) CAF-1-H3/H4 complexes were covalently cross-linked with DSS or EDC, then digested and run on an LTQ-Orbitrap. Cross-linked peptides were analyzed using Protein Prospector. The primary sequences are depicted in gray bars, with each gray circle marking 50 amino acid segments. DSS cross-links are shown in purple and EDC cross-links are in red. DSS leaves a 11.4 Å spacer arm between covalently-linked amine groups. EDC treatment results in a zero length cross-link between amine and carboxyl groups. The inter-subunit cross-links are represented as solid lines and cross-links to H3 and H4 are shown as dotted lines. (C) Analysis of Cac3 mutants in yeast. Cac3 mutants were subjected to zeocin-induced DNA damage response in vivo. The panel shows five fold serial dilution analysis of strain CFY58 (cac3) with the vector pCac3 introduced that was either empty (EV), expressed wild type Cac1, or Cac1 with the indicated amino acid changes.
Figure 3—figure supplement 1
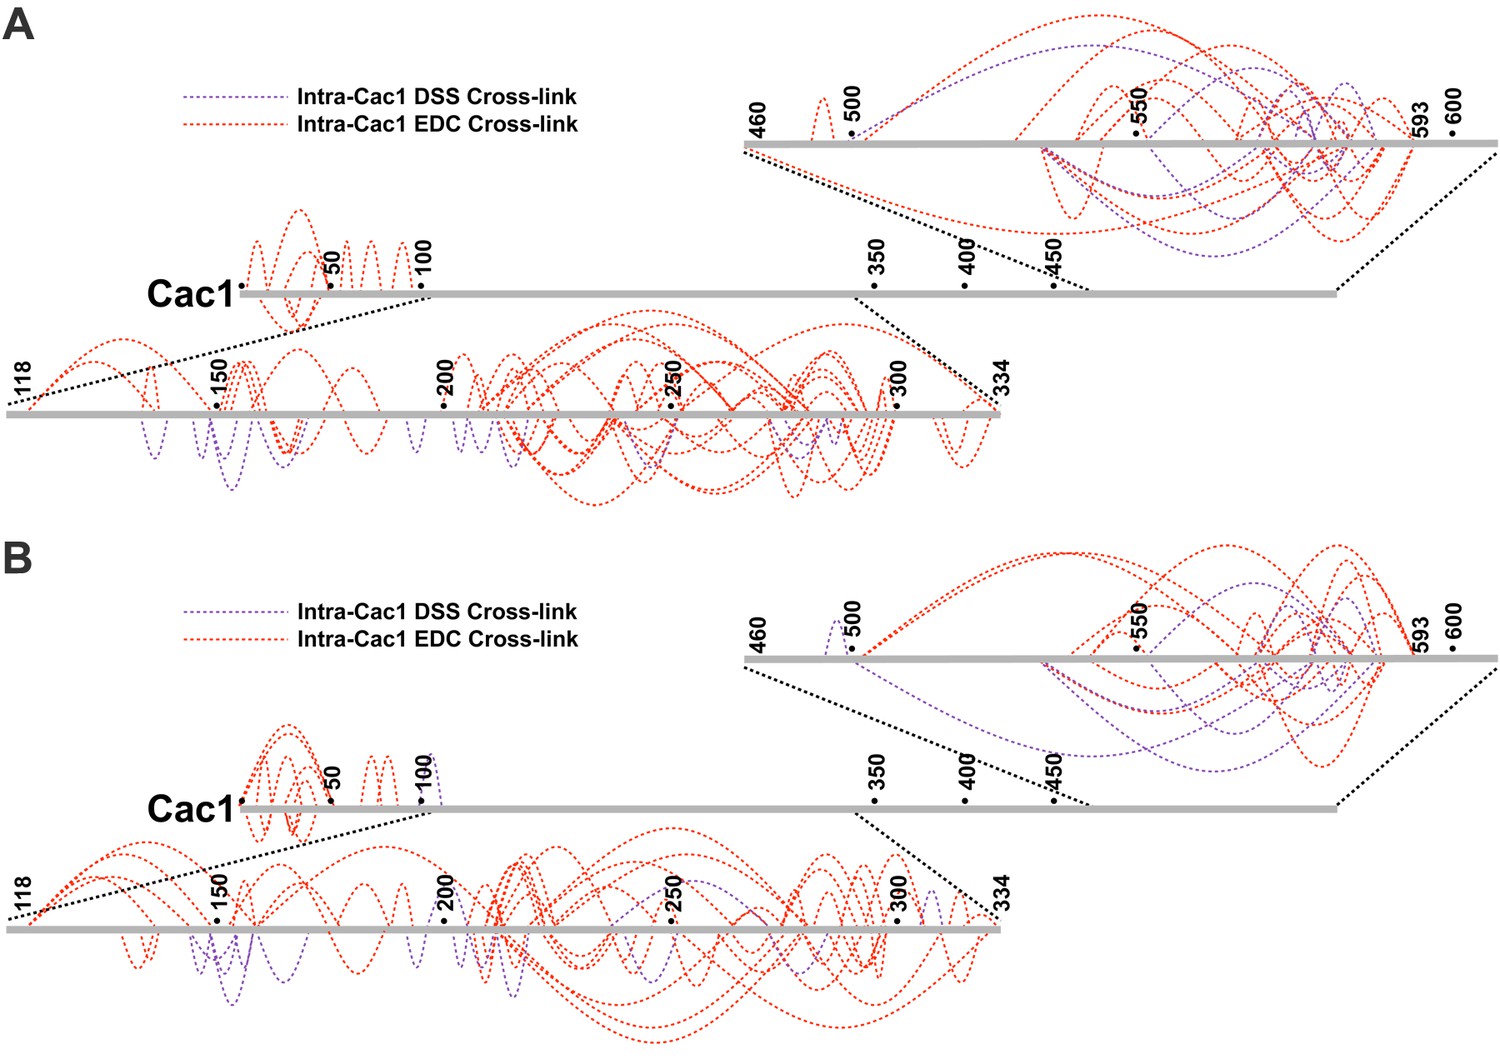
Intra-Cac1 cross-links.
(A) DSS (purple) and EDC (red) cross-links detected within the Cac1 protein in the CAF-1 complex and (B) CAF-1-H3/H4 complex.
Figure 4 with 1 supplement
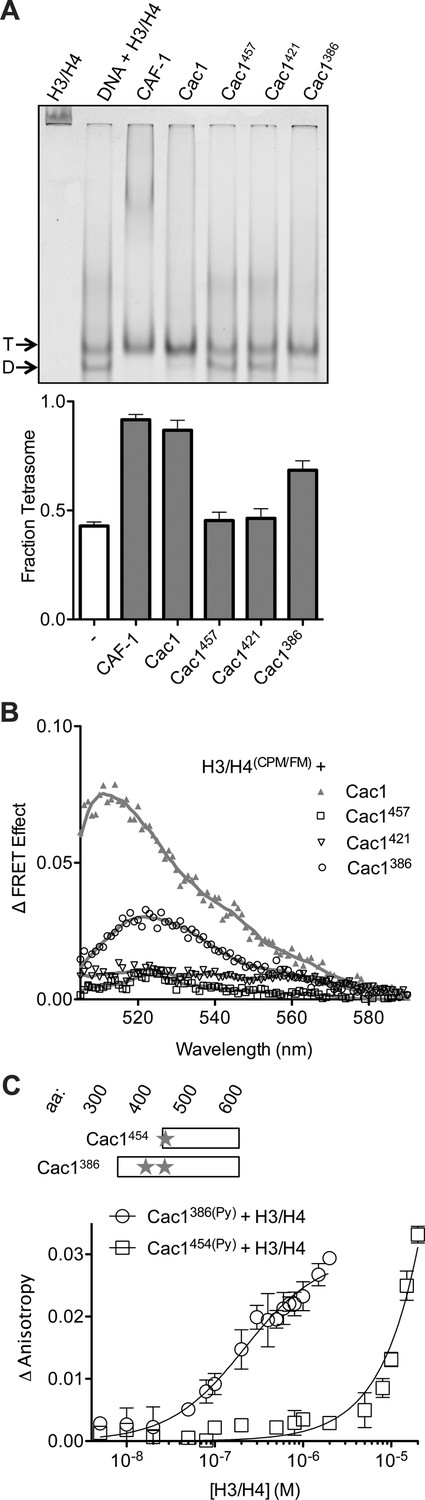
The C-terminus of Cac1 binds and tetramerizes H3/H4.
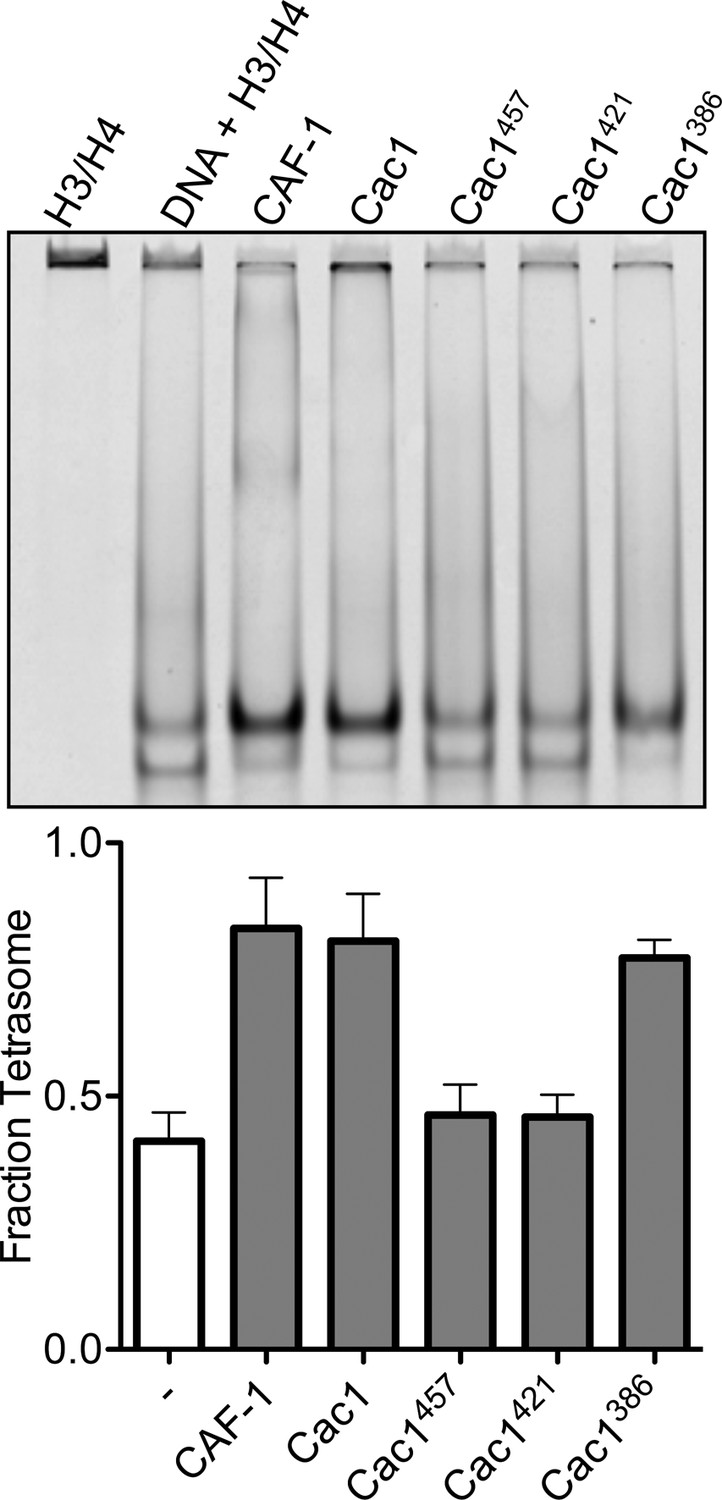
(A) EMSA evaluating tetrasome formation by Cac1 N-terminal truncations Cac1386, Cac1421 and Cac1457 in H.B. The graph shows the mean and standard deviation from at least three independent experiments. Arrows point to complexes of DNA bound to H3/H4 dimers (D) or tetramers (T), respectively. (B) Change in FRET Effect of H3/H4(CPM/FM) induced by 2 µM Cac1386, Cac1421 or Cac1457. The Cac1 spectrum is included from Figure 2B for reference. (C) Fluorescence anisotropy of Cac1386(Py) or Cac1454(Py) titrated with H3/H4 in H.B. The schematic indicates two labeled residues on Cac1386 (cysteines 440 and 454), and one on Cac1454.
Figure 4—figure supplement 1
Histone deposition assay of Cac1 truncations in Minimal Buffer (M.B.).
1.6 µM of each Cac1 truncation was incubated with 0.2 µM H3/H4FM, then allowed to interact with 0.4 µM 80 bp DNA. The EMSA (upper panel) is representative of at least four independent experiments that were used for comparisons in the bar graph (lower panel).
Figure 5 with 2 supplements
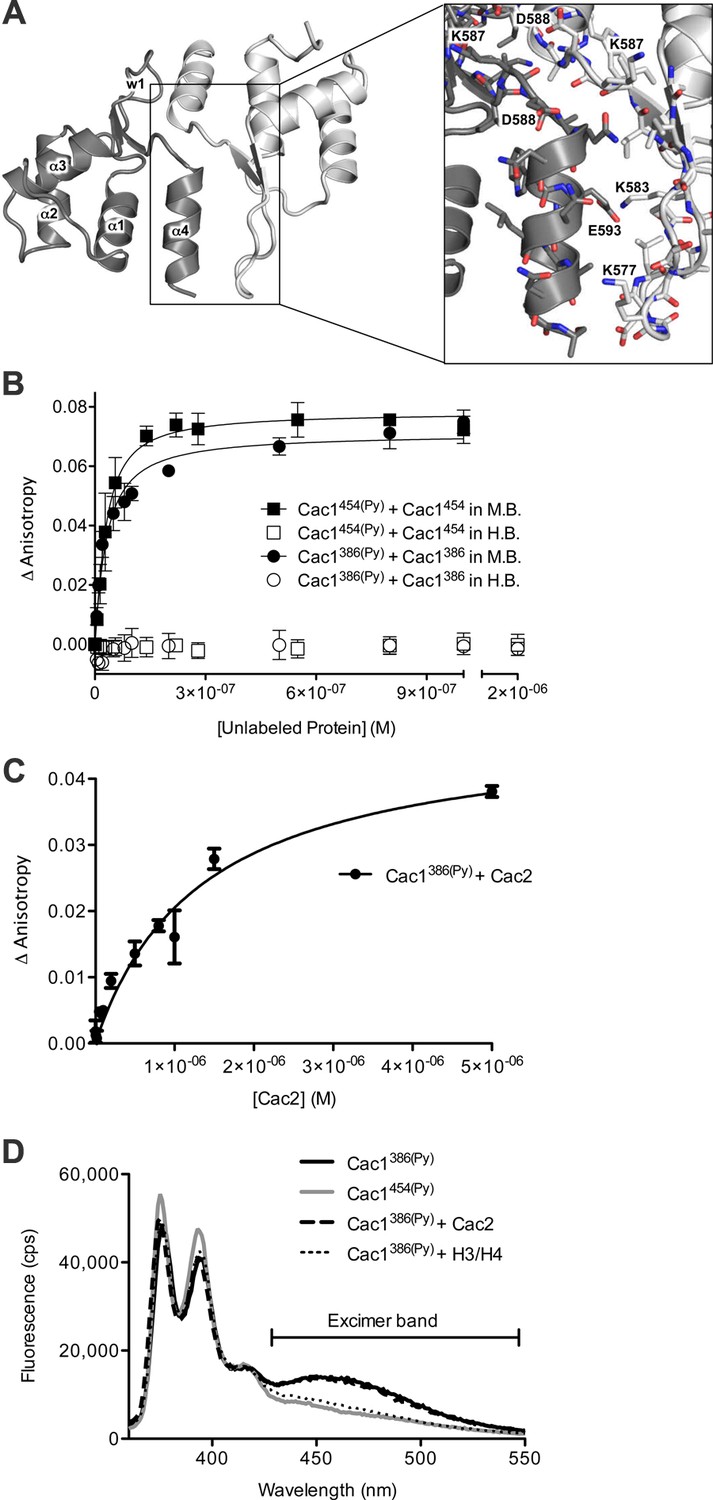
The Cac1 C-terminal winged helix (WH) domain can form a homodimer.
(A) Crystal structure of amino acids 520–600 at a resolution of 2.9 Å (PDB ID 5JBM), shown as two crystallographically related monomers colored separately (light gray and dark gray). The inset shows major interacting residues buried in half of the homodimer interface, which is arranged in a head-to-tail symmetry with identical interactions on both halves. (B) Homo-dimerization of the Cac1 C-terminus quantified by titrating unlabeled Cac1386 or Cac1454 into 10 nM of labeled Cac1386(Py) or Cac1454(Py), respectively. The pyrene anisotropy of Cac1386(Py) or Cac1454(Py) increases in Minimal Buffer (M.B.: 20 mM HEPES, 150 mM NaCl, 1 mM DTT, pH 7.5), but homo-dimerization does not occur in H.B. (C) Binding affinity of the Cac1386(Py)-Cac2 interaction. Pyrene fluorescence anisotropy of 10 nM Cac1386(Py) titrated with increasing concentration of Cac2 in Histone Buffer (H.B.). The KD was determined to be 1.3 µM (Table 1). (D) Pyrene fluorescence spectra of Cac1386(Py) alone, Cac1454(Py) alone, and Cac1386(Py) bound to 2 µM H3/H4 or 13 µM Cac2. The excimer band that peaks at 465 nm is indicated.
Figure 5—figure supplement 1
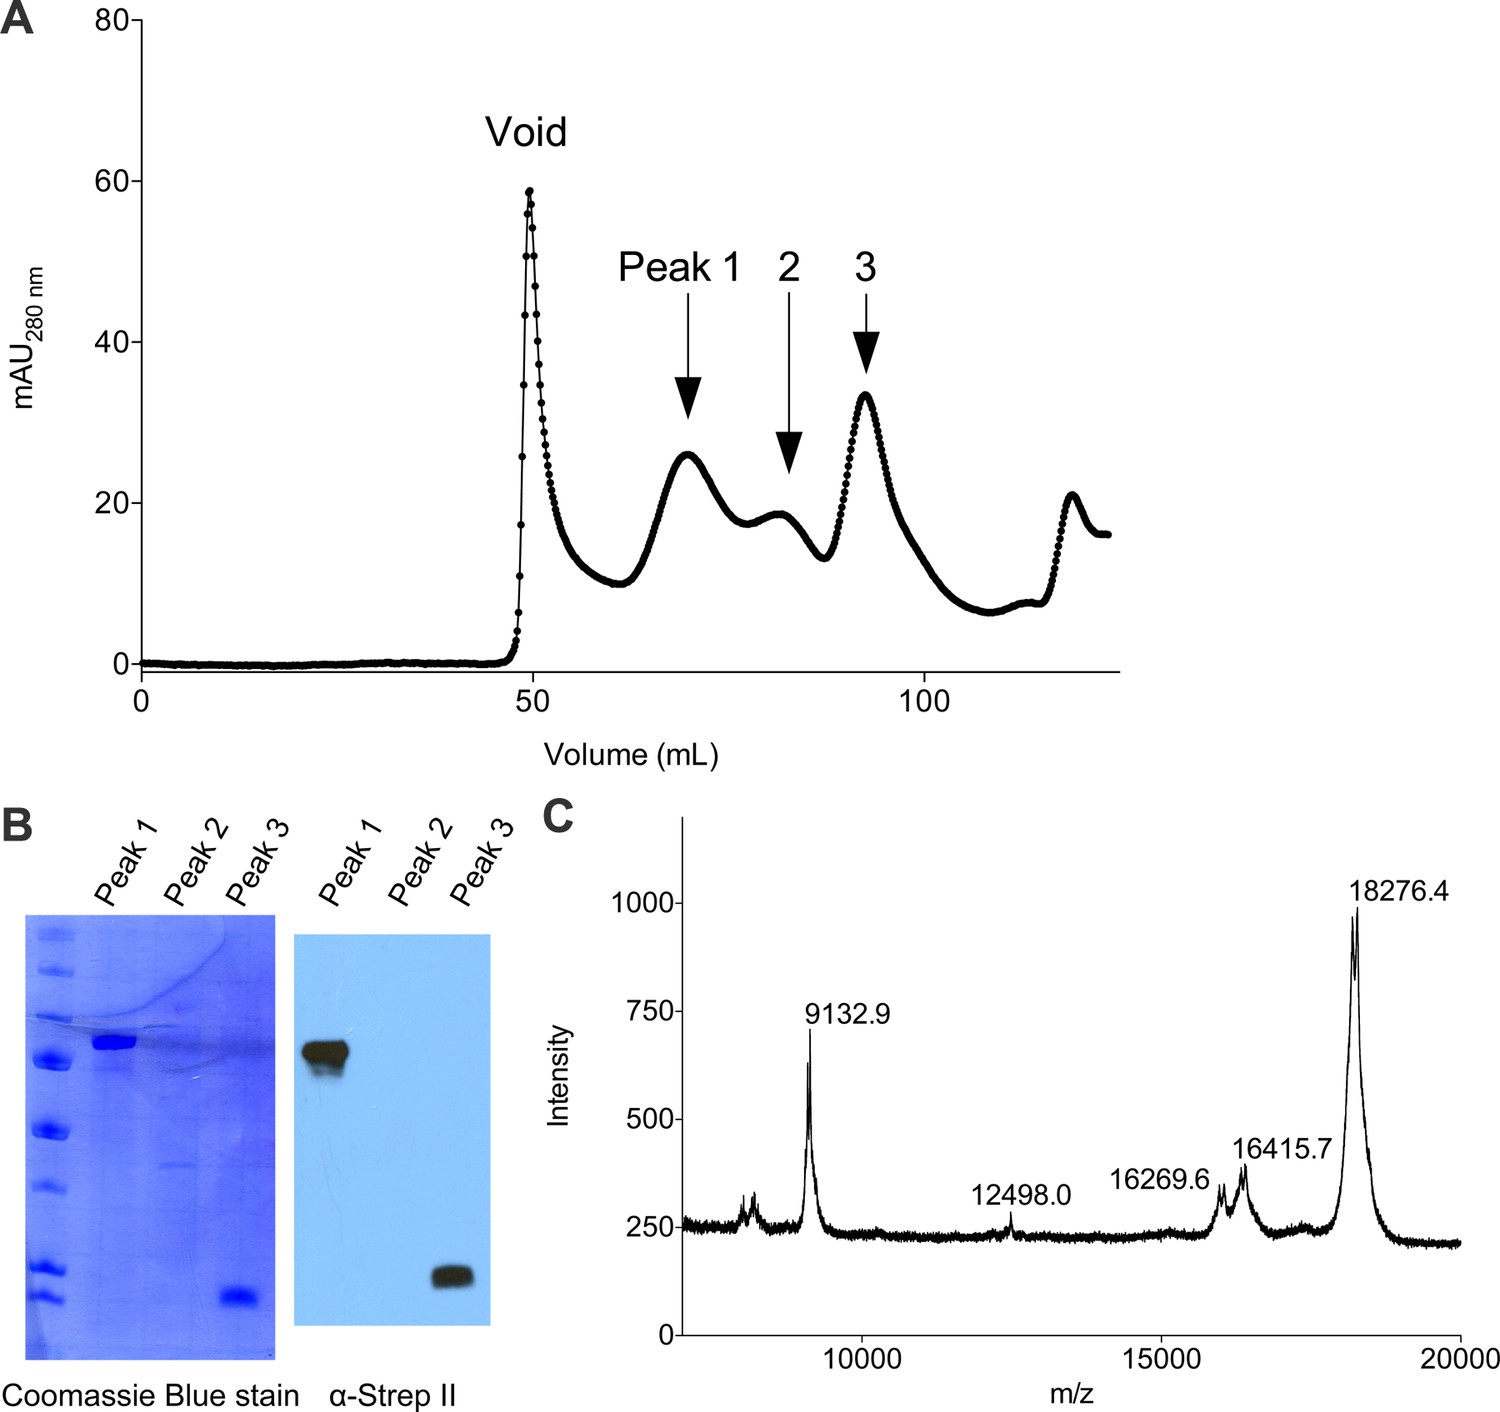
Purification of full-length Cac1 and Cac1457 from baculovirus-infected Sf9 cells.
(A) Cac1 elutes from a 120 mL Sephadex 200 column in 3 peaks. (B) Western blotting for the Strep II epitope present on the Cac1 C-terminus. Peak 1 is full-length Cac1, whereas Peak 3 is truncated from the N-terminus. (C) MALDI identified the C-terminal regions as residues 457–606 (expected mass 18285.3; observed mass 18276.4).
Figure 5—figure supplement 2
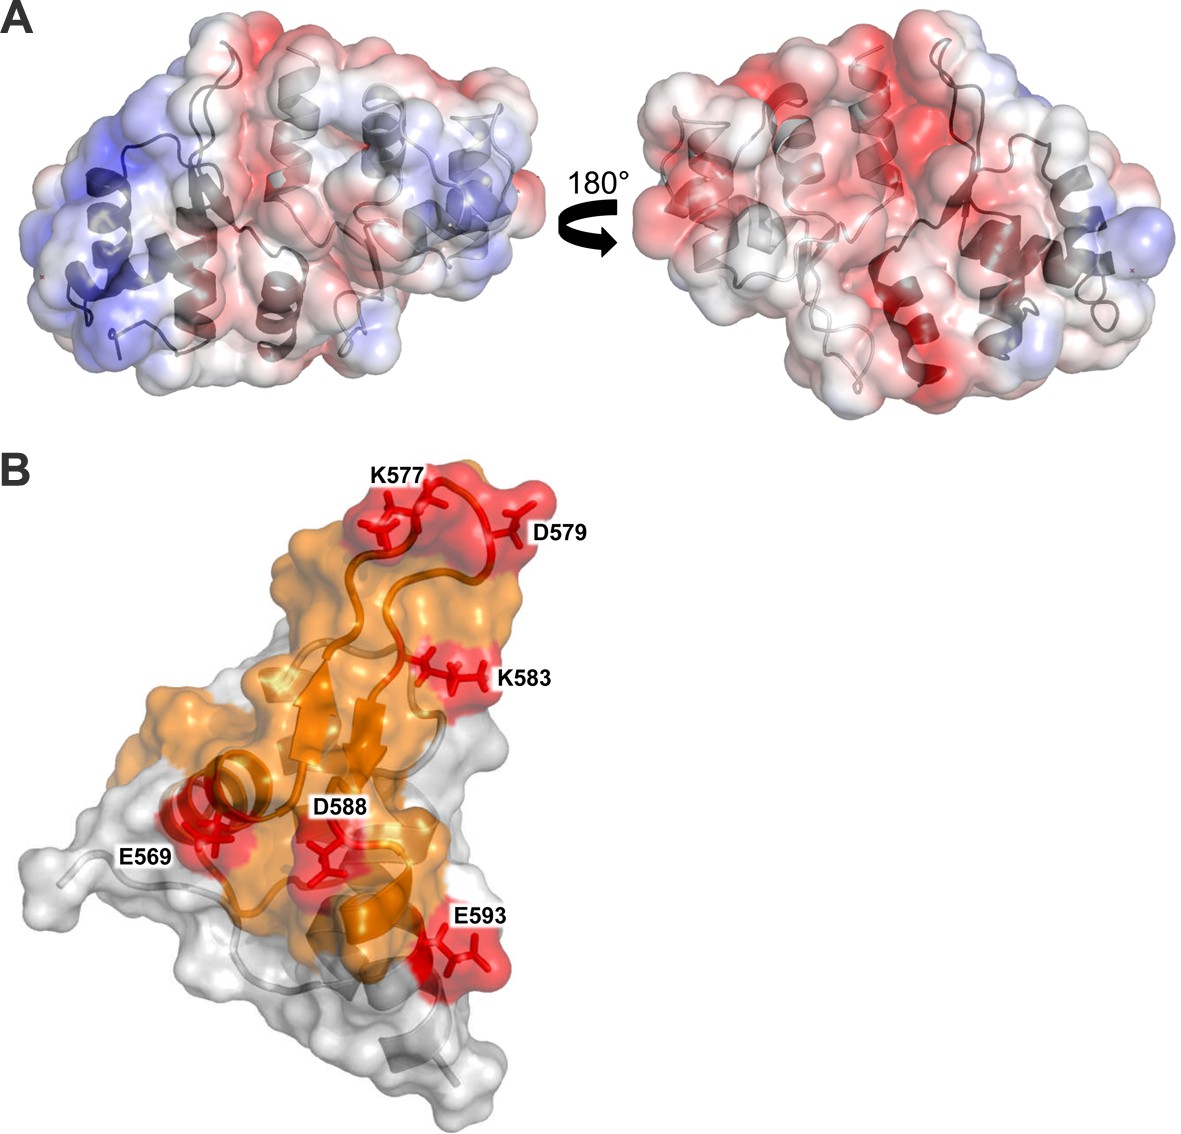
Structural analysis of the Cac1457 WH domain.
(A) The Cac1 WH domain monomer and one of the symmetry mates are depicted in both a ribbon and surface representation, in two orientations. The Cac1 monomers are colored light gray and dark gray, respectively, with the electrostatic potential shown mapped onto the surface, colored from red to blue, indicating negatively charged to positively charged regions. (B) The Cac1 WH domain monomer is depicted in both a ribbon and surface representation. The putative dimerization interface faces to the right. HX changes are colored in orange to represent an increase in HX with H3/H4 bound to CAF-1 (Figure 3). Amino acids that cross-link to H3/H4 are labeled and colored in red.
Figure 6
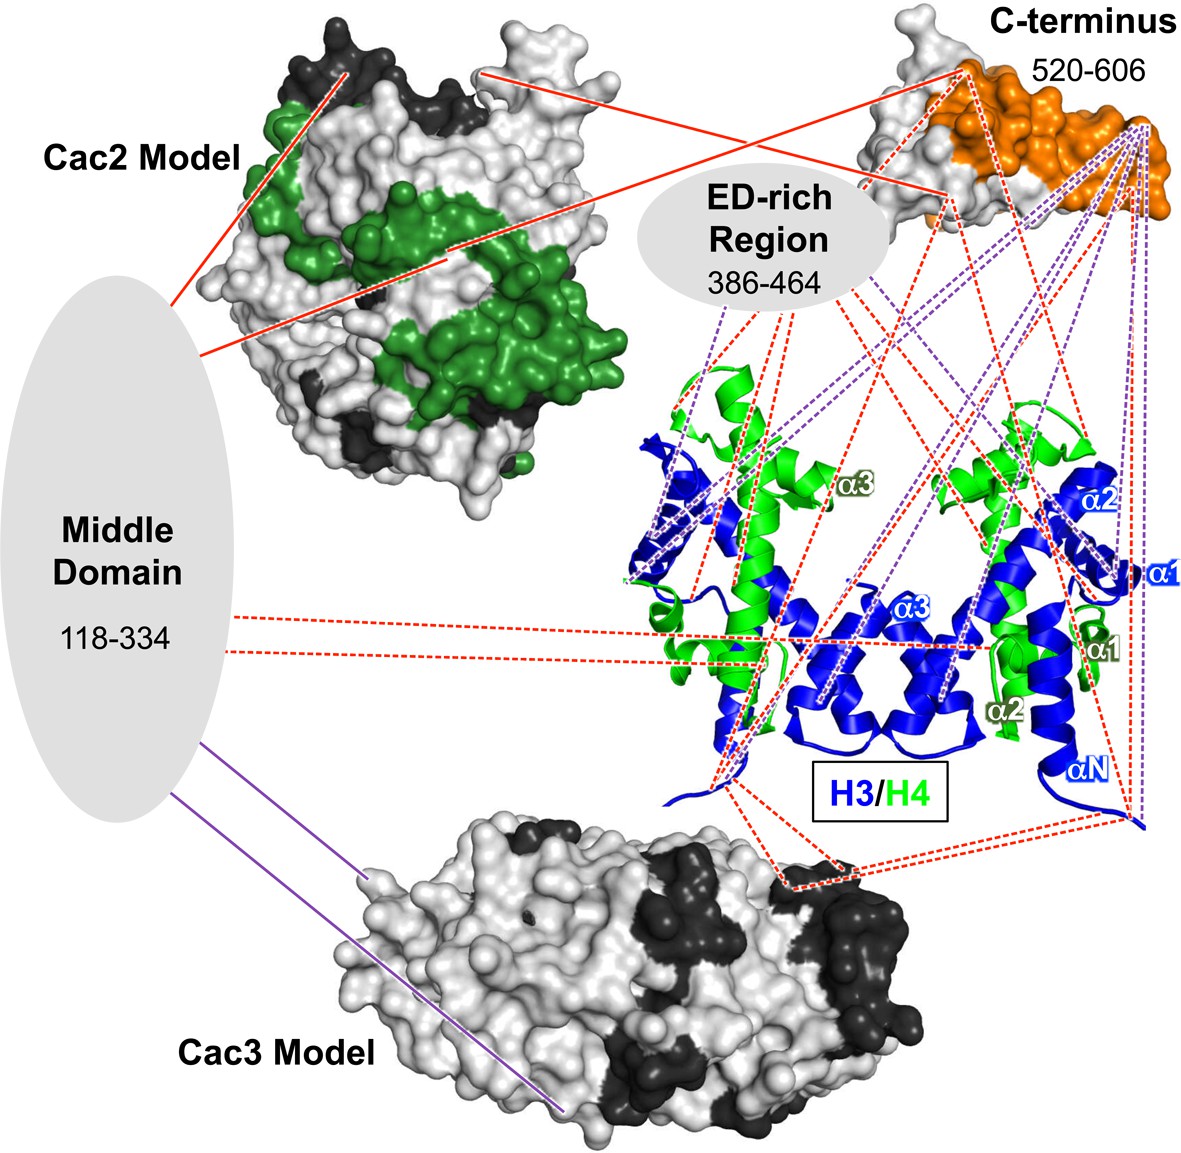
Architectural model of the CAF-1-H3/H4 complex.
Cac2 and Cac3 are presented using PHYRE2 models. Cac1 is presented with respect to the domains observed in this study: the 'Middle Domain,' which consists of amino acids 118–334 and includes the KER region; the 'ED-rich Region' that includes the ED domain and the adjacent amino acids; and the 'C-terminus' that includes the WH domain. The nucleosomal (H3/H4)2 tetramer is shown (1ID3.pdb) with H3 (blue) and H4 (bright green) colored to distinguish the histones. CAF-1 proteins are colored according to the 60’ HX data and coloring scheme in Figure 2B. The cross-linking data is incorporated using the same coloring and line schemes as in Figure 3B.
Figure 7

Potential equilibrium for CAF-1 association with H3/H4.
D and T indicate dimers or tetramers of H3/H4, respectively.
Tables
Table 1
KD values from pyrene fluorescence anisotropy of CAF-1 subunits and H3/H4.
| Pyrene-labeled protein | Binding partner | KD or KDapp (M) |
|---|---|---|
| H3/H4 | CAF-1 | 5.3 ± 0.9 × 10⁻⁹ |
| H3/H4 | Cac1 | 9.7 ± 1.8 × 10⁻⁸ |
| H3/H4 | Cac2 | n.c. |
| H3/H4 | Cac3 | n.c. |
| Cac1386 | Cac1386 | 2.6 ± 0.2 × 10⁻⁸ |
| Cac1454 | Cac1454 | 2.5 ± 0.2 × 10⁻⁸ |
| Cac1386 | H3/H4 | 2.1 ± 0.5 × 10⁻⁷ |
| Cac1454 | H3/H4 | n.c. |
| Cac1386 | Cac2 | 1.3 ± 0.4 × 10⁻⁶ |
-
n.c. not calculated
Table 2
Yeast strains and plasmids.
| Strain | Mutation | Genotype | Reference |
|---|---|---|---|
| w1588-4a | WT | Mat alpha; leu2-3,112; ade2-1; can1-100; his3-11,15; ura3-1; trp1-1; RAD5 | Gift from R. Rothstein |
| CFY53 | cac1Δ | Mat alpha; leu2-3,112; ade2-1; can1-100; his3-11,15; ura3-1; trp1-1; RAD5 cac1Δ::NAT | This study |
| CFY54 | cac2Δ | Mat alpha; leu2-3,112; ade2-1; can1-100; his3-11,15; ura3-1; trp1-1; RAD5 cac2Δ::NAT | This study |
| CFY58 | cac3Δ | Mat alpha; leu2-3,112; ade2-1; can1-100; his3-11,15; ura3-1; trp1-1; RAD5 cac3Δ::NAT | This study |
| JKT004 | rad52Δ | MAT a rad52::TRP1; trp1-1; ura3-1; can1-100; ADE; bar1::LEU2; his3-11; GAL | Ramey et al. (2004) |
| Plasmid | Characteristics | Reference | |
|---|---|---|---|
| pRS315 (EV) | CEN6 ARSH4 LEU2 | Sikorski and Hieter (1989) | |
| pCac1 | pRS315-Cac1 | This study | |
| pCac2 | pRS315-Cac3 | This study | |
| pCac3 | pRS315-Cac3 | This study | |
| pCac1Δ233-237 | pRS315-Cac1 aa 233-237 deleted | This study | |
| pCac1Δ280-284 | pRS315-Cac1 aa 280 to 284 deleted | This study | |
| pCac1Δ304-322 | pRS315-Cac1 aa 304 to 322 deleted | This study | |
| pCac1Δ340-360 | pRS315-Cac1 aa 340-360 deleted | This study | |
| pCac1Δ428-432 | pRS315-Cac1 aa 428-432 deleted | This study | |
| pCac1K442E/R443E/K444E | pRS315-Cac1 with the mutation K442E/R443E/K444E | This study | |
| pCac1Δ463-473 | pRS315-Cac1 aa 463 to 473 deleted | This study | |
| pCac1Δ497-501 | pRS315-Cac1 aa 497 to 501 deleted | This study | |
| pCac1Δ574-584 | pRS315-Cac1 aa 574-584 deleted | This study | |
| pCac1Δ578-580 | pRS315-Cac1 aa 578 to 580 deleted | This study | |
| pCac1Δ576-606 | pRS315-Cac1 aa 576-606 deleted | This study | |
| pCac1Δ578-580 | pRS315-Cac1 aa 578 to 580 deleted | This study | |
| pCac2Δ1-15 | pRS315-Cac2 aa 1 to 15 deleted | This study | |
| pCac2E70K | pRS315-Cac2 with the mutation E70K | This study | |
| pCac2D91K/D92K | pRS315-Cac2 with the mutation D91K/D92K | This study | |
| pCac2S206A/A207G | pRS315-Cac2 with the mutation S206A/A207G | This study | |
| pCac2V273A/P275A/S276A/G277A | pRS315-Cac2 with the mutation V273A/P275A/S276A/G277A | This study | |
| pCac2I274A/S276A | pRS315-Cac2 with the mutation I274A/S276A | This study | |
| pCac2D248K/E285K | pRS315-Cac2 with the mutation D248K/E285K | This study | |
| pCac2R295E | pRS315-Cac2 with the mutation R295E | This study | |
| pCac2K306A/N307A/R308A | pRS315-Cac2 with the mutation K306A/N307A/R308A | This study | |
| pCac2L316A/K318A | pRS315-Cac2 with the mutation L316A/K318A | This study | |
| pCac2L316E/K318E | pRS315-Cac2 with the mutation L316E/K318E | This study | |
| pCac2Δ371-373 | pRS315-Cac2 aa 371 to 373 deleted | This study | |
| pCac2M417A/H418A/E420A | pRS315-Cac2 with the mutation M417A/H418A/E420A | This study | |
| pCac2Δ425-468 | pRS315-Cac2 aa 425-468 deleted | This study | |
| pCac2Δ445-468 | pRS315-Cac2 aa 445-468 deleted | This study | |
| pCac2K447E/K448E | pRS315-Cac2 with the mutation K447E/K448E | This study | |
| pCac3K284A/K285A/E286A | pRS315-Cac3 with the mutation K284A/K285A/E286A | This study | |
| pCac3Δ306-309 | pRS315-Cac3 deleted aa 306 to 309 | This study | |
| pCac3Δ287-290 | pRS315-Cac3 deleted aa 287 to 290 | This study | |
Table 3
Yeast mutants and phenotypes observed.
| Mutant | Rationale for mutant | Zeocin resistance | Protein expression |
|---|---|---|---|
| Cac1Δ233-237 | Cross-link to Cac3 (Figure 3B) | Sensitive | No |
| Cac1Δ280-284 | Cross-link to Cac3 (Figure 3A,B) | Sensitive | No |
| Cac1Δ304-322 | HX change with H3/H4 and cross-link to Cac2 (Figure 2A,3B) | Very sensitive | Yes |
| Cac1Δ340-360 | HX change with H3/H4 (Figure 2A) | Sensitive | No |
| Cac1Δ428-432 | In ED-rich Region (Figure 1A) | Not sensitive | Yes |
| Cac1K442E/K443E/K444E | Cross-link to H3 (Figure 3B) | Not sensitive | Yes |
| Cac1Δ463-473 | HX change and cross-link to H3/H4 (Figure 2A, 3B) | Sensitive | Yes |
| Cac1Δ497-501 | Cross-link to Cac2 (Figure 3B) | Little sensitive | Yes |
| Cac1Δ574-584 | HX change and cross-link to H3/H4 (Figure 2A, 3B) | Little sensitive | Yes |
| Cac1Δ578-580 | HX change and cross-link to H3/H4 (Figure 2A, 3B) | Sensitive | Yes |
| Cac1Δ575-606 | HX change and cross-link to H3/H4 (Figure 2A, 3B) | Very sensitive | No |
| Cac2Δ1-15 | HX change with H3/H4 (Figure 2A) | Very sensitive | Yes |
| Cac2E70K | Loop next to Cac2 N-terminal loop (Figure 2A) | Not sensitive | Yes |
| Cac2D91K/D92K | Cross-link to Cac1 (Figure 3A) | Sensitive | Yes |
| Cac2S206A/A207G | HX change with H3/H4 (Figure 2A) | Sensitive | Yes |
| Cac2V273A/P275A/S276A/G277A | HX change with H3/H4 (Figure 2A) | Sensitive | Yes |
| Cac2I274A/S276A | HX change with H3/H4 (Figure 2A) | Not sensitive | Yes |
| Cac2D284K/E285K | Cross-link to Cac1 (Figure 3A) | Not sensitive | Yes |
| Cac2R295E | Loop between Cac2 blades 5 and 6 (Figure 2A) | Sensitive | No |
| Cac2K306A/N307A/R308A | HX change with H3/H4 (Figure 2A) | Not sensitive | Yes |
| Cac2L316A/K318A | HX change with H3/H4 (Figure 2A) | Sensitive | Yes |
| Cac2L316E/K318E | HX change with H3/H4 (Figure 2A) | Sensitive | Yes |
| Cac2Δ371-373 | Loop next to Cac2 N-term loop and blade 6 (Figure 2A) | Sensitive | Yes |
| Cac2M417/H418A/E420A | C-terminal loop in Cac2 | Not sensitive | Yes |
| Cac2Δ425-468 | HX change with H3/H4 (Figure 2A) | Not sensitive | Yes |
| Cac2Δ445-468 | C-terminal loop in Cac2 | Not sensitive | Yes |
| Cac3K284A/K285A/E286A | Cross-link to Cac1 (Figure 3B) | Not sensitive | Yes |
| Cac3Δ287-290 | Cross-link to Cac1 (Figure 3B) | Sensitive | Yes |
| Cac3Δ306-309 | Cross-link to Cac1 (Figure 3A) | Sensitive | Yes |
Table 4
Data collection and refinement statistics.
| Wavelength | 1.0 Å |
| Resolution range – data collection | 29.43–2.91 (3.01–2.91) |
| Space group | P 41 2 2 |
| Unit cell (Å) (deg) | 58.850 58.830 97.929 90 90 90 |
| Total reflections | 26,419 (5001) |
| Unique reflections | 4117 (393) |
| Multiplicity | 6.42 (6.63) |
| Completeness (%) | 99.3 (99.7) |
| Mean I/sigma(I) | 12.9 (1.7) |
| Wilson B-factor | 92.56 |
| R-meas | 0.099 (0.557) |
| Resolution range - refinement | 29.43–3.00 (3.107–3.00) |
| Reflections used in refinement | 3761 (365) |
| Reflections used for R-free | 360 (42) |
| R-work | 0.233 (0.408) |
| R-free | 0.275 (0.324) |
| Number of non-hydrogen atoms | 654 |
| Macromolecules | 653 |
| Protein residues | 81 |
| RMS(bonds) | 0.007 Å |
| RMS(angles) | 0.93 deg |
| Ramachandran favored (%) | 88 |
| Ramachandran allowed (%) | 12 |
| Ramachandran outliers (%) | 0 |
| Rotamer outliers (%) | 4.3 |
| Clashscore | 6.85 |
| Average B-factor | 48.8 |
| Number of TLS groups | 3 |
-
Statistics for the highest-resolution shell are shown in parentheses.
-
Friedel mates were averaged when calculating data collection statistics.
Additional files
-
Supplementary file 1
Supplementary tables.
(A) Peptides identified in HX studies. (B) Primers used in the studies in yeast. (C) Chemically cross-linked peptides identified by XL-MS. (D) Cac1C putative dimer contacts.
- https://doi.org/10.7554/eLife.18023.020
Download links
A two-part list of links to download the article, or parts of the article, in various formats.
Downloads (link to download the article as PDF)
Open citations (links to open the citations from this article in various online reference manager services)
Cite this article (links to download the citations from this article in formats compatible with various reference manager tools)
The Cac1 subunit of histone chaperone CAF-1 organizes CAF-1-H3/H4 architecture and tetramerizes histones
eLife 5:e18023.
https://doi.org/10.7554/eLife.18023


