NusG inhibits RNA polymerase backtracking by stabilizing the minimal transcription bubble
- University of Turku, Finland
Figures
Figure 1
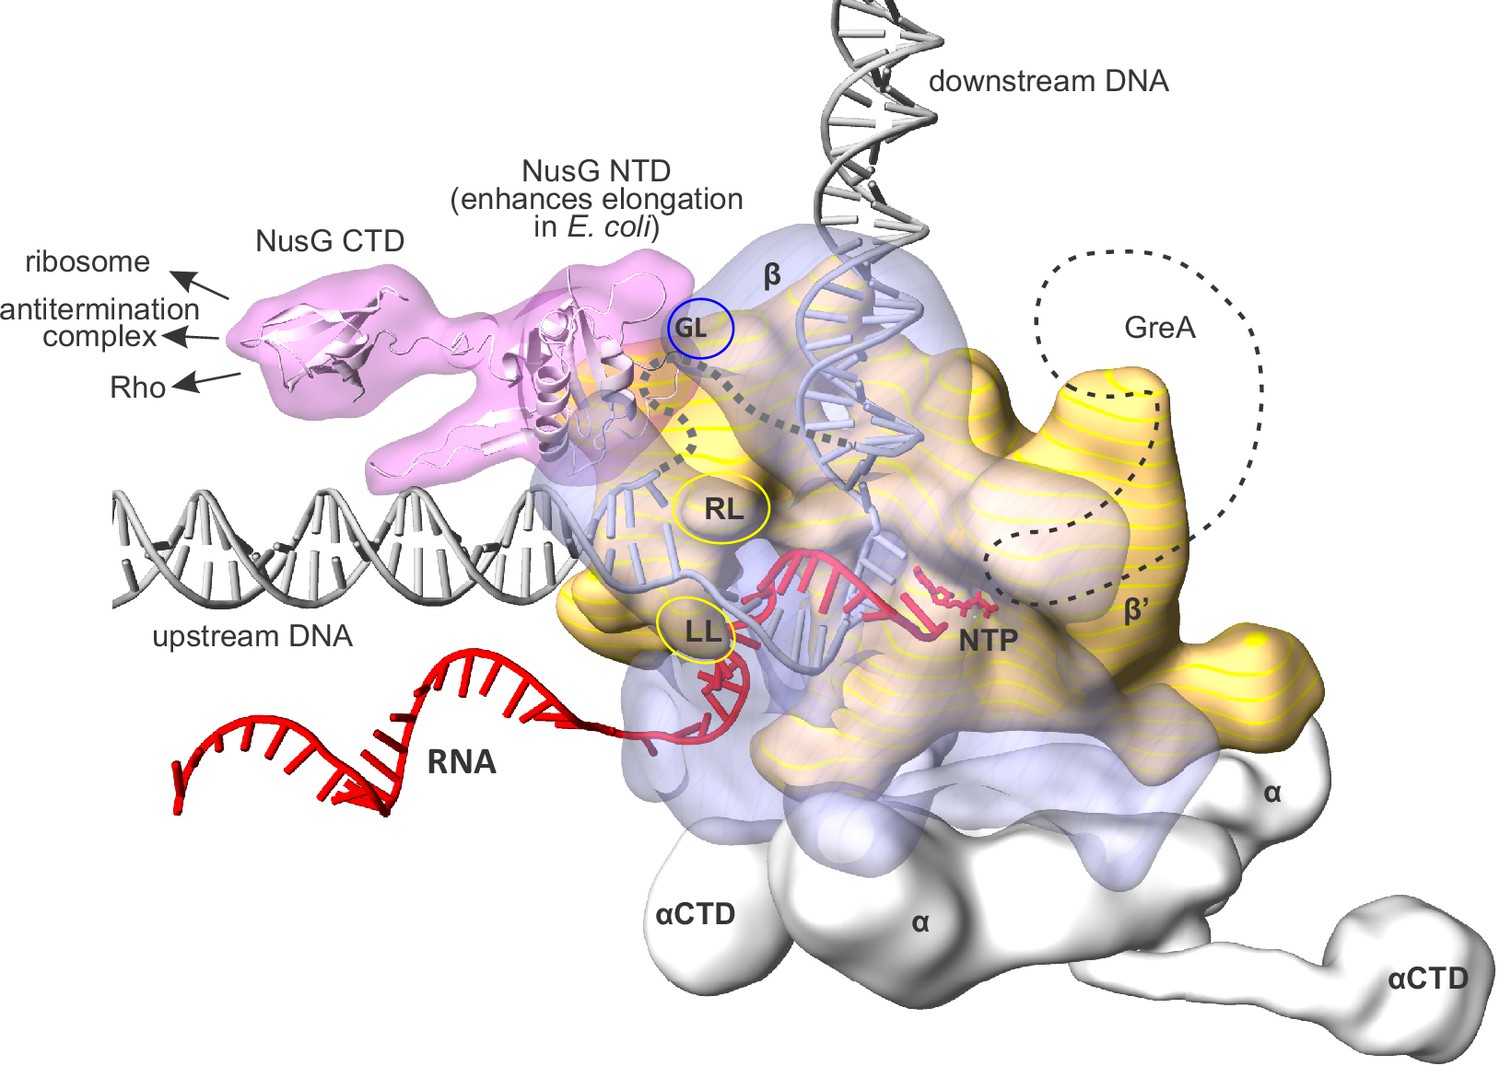
An overview of the bacterial transcription elongation complex (TEC) with bound NusG.
RNAP core subunits are depicted by simplified differentially colored molecular surfaces. β is depicted transparent to reveal the path of nucleic acids through the enzyme. The positions of NusG CTD and αCTD, connected via flexible linkers, were chosen arbitrary. The locations of RNAP cleft loops individually deleted in this study, β Gate Loop (GL), β' Rudder Loop (RL) and β' Lid Loop (LL) are accentuated by ovals. The hypothetical path of the single stranded non-template DNA is depicted by a grey dashed line. The approximate location of GreA cleavage factor employed in backtracking experiments (see results) is depicted as a black dashed contour. The composite model was generated using the Thermus thermophilus TEC (Vassylyev et al., 2007), NusG NTD from the NusG-RNAP model in Martinez-Rucobo et al., 2011 and the elements from other structures (see Materials and methods). The duplex DNA immediately upstream of the RNA:DNA hybrid was modeled de novo as described in the Results section.
Figure 2 with 1 supplement
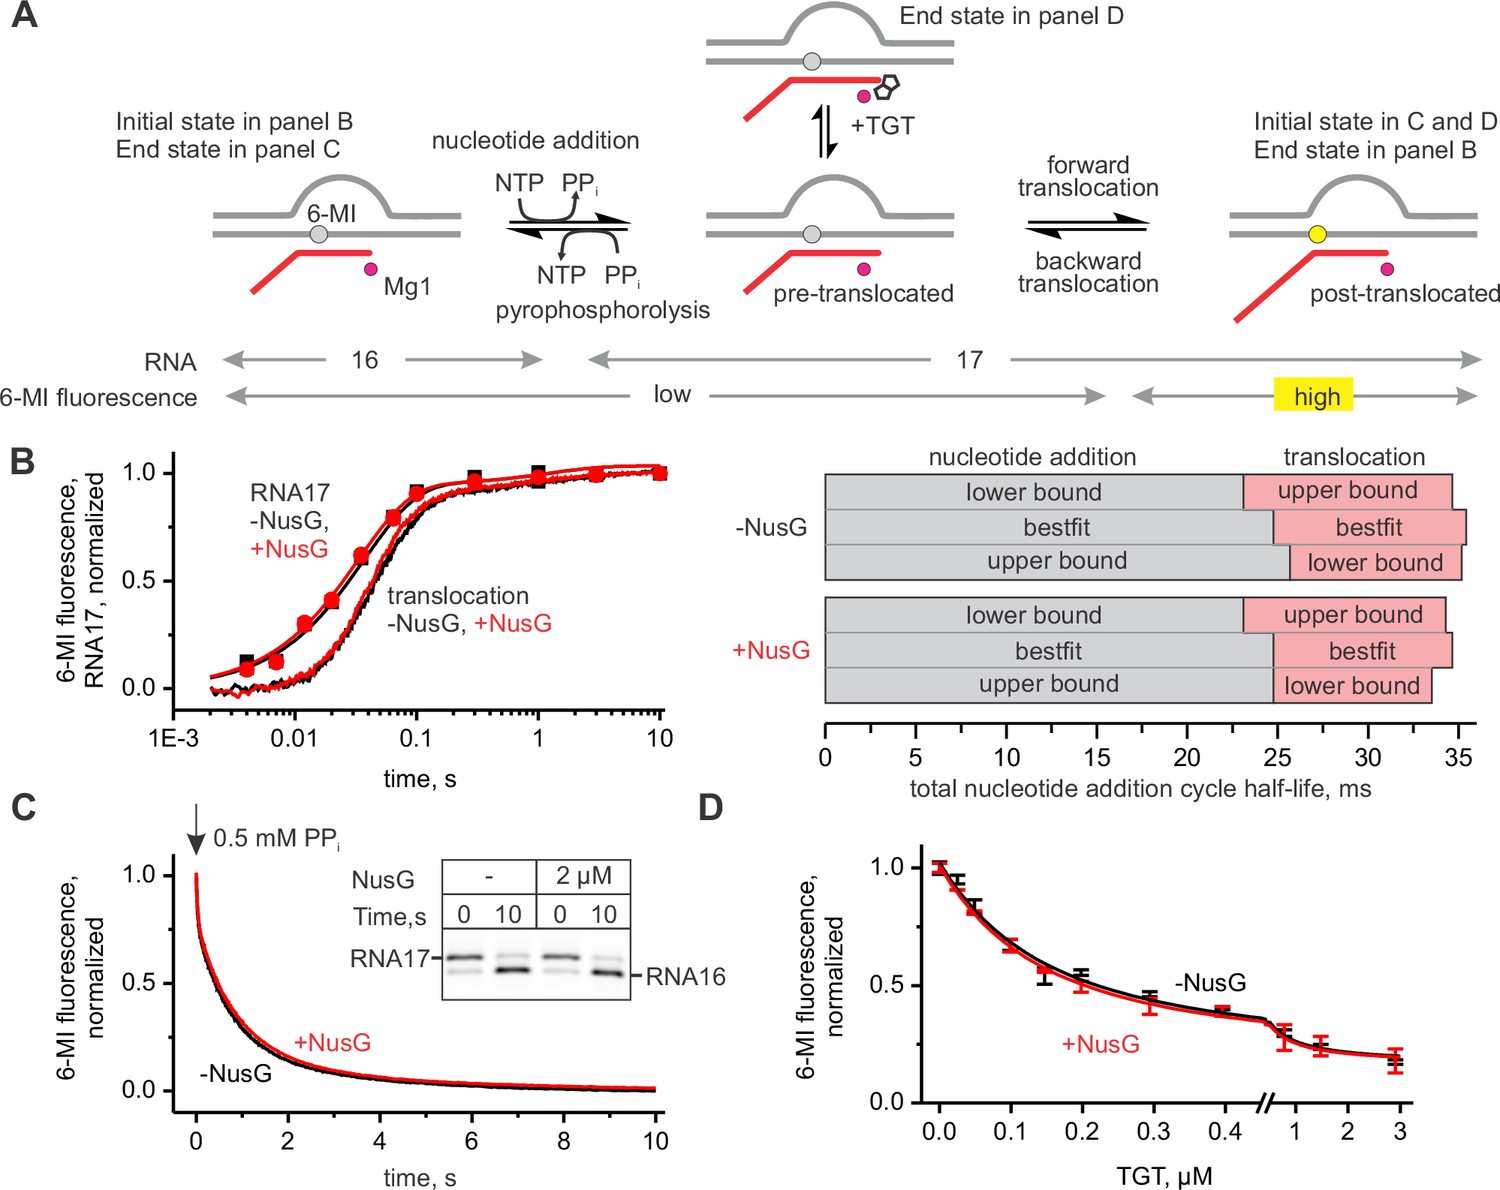
NusG does not affect on-pathway transcription elongation.
(A) The schematics of the system used for monitoring the forward and the backward kinetics of the nucleotide addition cycle. In addition, the translocation bias of the TEC was evaluated under equilibrium conditions by measuring the TEC response to tagetitoxin (TGT). (B) The effect of NusG on the rate of nucleotide addition (discrete time-points and best-fit lines) and forward translocation (continuous time-traces). The lower and upper bounds of the reaction half-lives were calculated by combined analysis of data from several independent experiments (Table 5) by FitSpace routine of Kintek Explorer software (at a 10% increase in Chi2). (C) The effect of NusG on the pyrophosphorolysis-driven backward translocation. Inset: the gel control of the pyrophosphorolysis reaction. (D) The effect of NusG on the potency of TGT to bias the TEC towards the pre-translocated state. Error bars indicate the range of duplicate measurements. Numerical values of the reaction rate constants and the median reaction times are presented in Table 1.
Figure 2—figure supplement 1
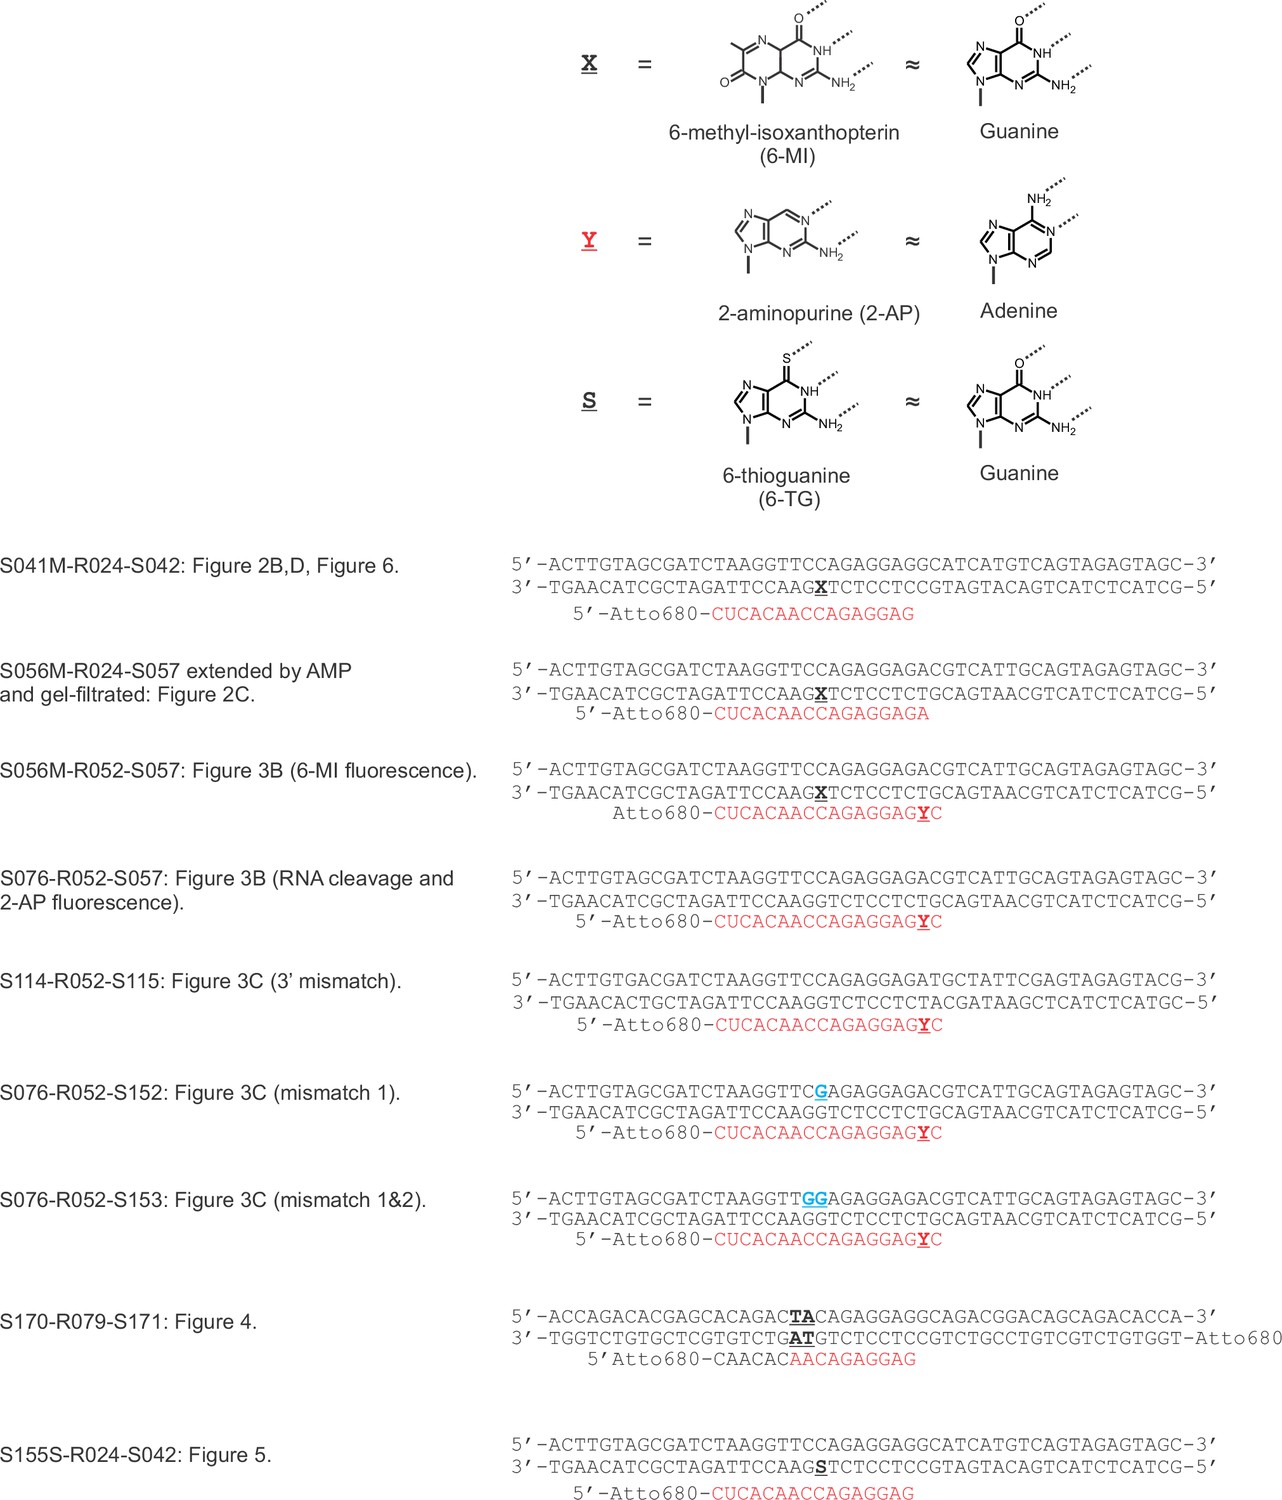
TEC systems employed in the experiments presented in the main figures.
X = 6-MI, Y = 2-AP, S = 6-TG, mismatches in the non-template DNA are colored blue.
Figure 3 with 3 supplements

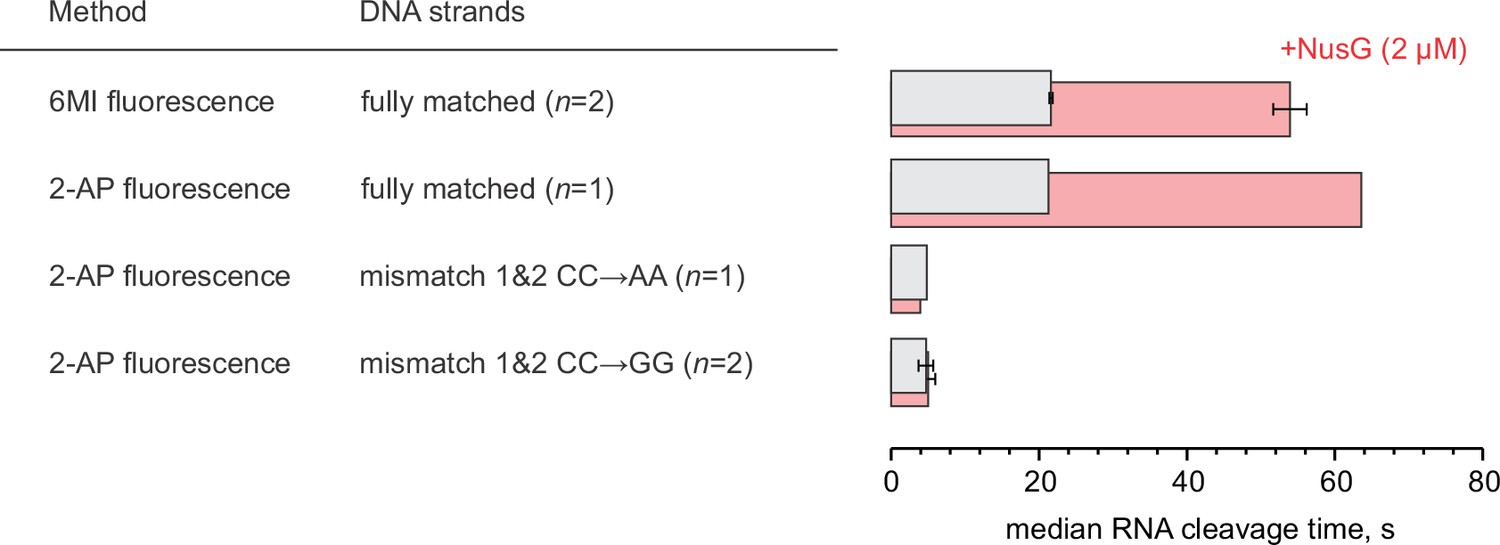
NusG inhibits GreA assisted RNA cleavage by slowing backtracking.
(A) Three assays for monitoring the GreA-assisted RNA cleavage: TEC backtracking (6-MI fluorescence decrease), RNA cleavage (PAGE), and the dinucleotide release (2-AP fluorescence increase). (B) Left: the effect of NusG on the TEC backtracking (continuous time-traces) and RNA cleavage (discrete time-points) upon the addition of 8 µM GreA. Center: the effect of NusG on the release of the cleaved dinucleotide (continuous time-traces) and the RNA cleavage (discrete time-points). Right: the median reaction times. (C) The effect of NusG on the RNA cleavage by TECs with deletions of the RNAP domains, the mismatched upstream DNA and a 3' rC‑dA RNA:DNA mismatch. The median reaction times were determined by monitoring the increase in 2‑AP fluorescence at 8 µM GreA. The schematic on the right illustrates the location of DNA:DNA mismatches (cyan bars). Numerical values of the median reaction times are presented in Table 1. Error bars indicate the range of the bestfit estimates in duplicate experiments.
Figure 3—figure supplement 1
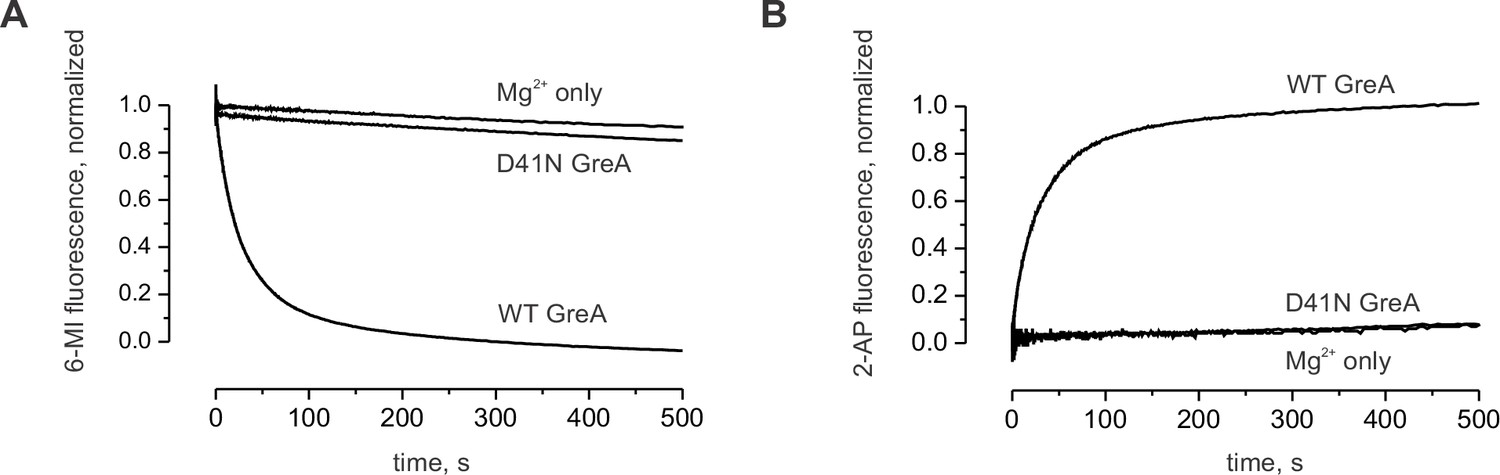
Control experiment with the inactive GreA (D41N variant).
(A) The decrease in 6-MI fluorescence is observed upon addition of the active GreA protein but not the inactive GreA D41N variant. (B) The increase in 2-AP fluorescence is observed upon addition of the active GreA protein but not the inactive GreA D41N variant.
Figure 3—figure supplement 2

Primary data for graphs in Figure 3B: The effect of NusG on GreA assisted RNA cleavage.
https://doi.org/10.7554/eLife.18096.009
Figure 3—figure supplement 3
The effect of NusG on RNA cleavage by wild-type TECs at 2 µM GreA.
Error bars indicate the range of duplicate measurements.
Figure 4 with 1 supplement

Probing the effects of NusG and deletions of the RNAP domains on the structure of the upstream fork junction by DNA:DNA photocrosslinking with 8-methoxypsoralen (8-MP).
(A) TECs containing the unique 8-MP intercalation site were supplemented with 8-MP, walked by up to three nucleotides, supplemented with 5 µM TGT (where indicated) and illuminated with the UV light. (B) DNA:DNA crosslinking in TECs formed by the wild-type and altered RNAPs in the absence (grey bars) and presence (red bars) of NusG. Error bars indicate the range of duplicate measurements or SDs of several measurements (Table 5). The gel panels were spliced from the same gel and the pixel counts were linearly scaled to span the full 8 bit grayscale range within each panel. Joined panels have the same scaling.
Figure 4—figure supplement 1
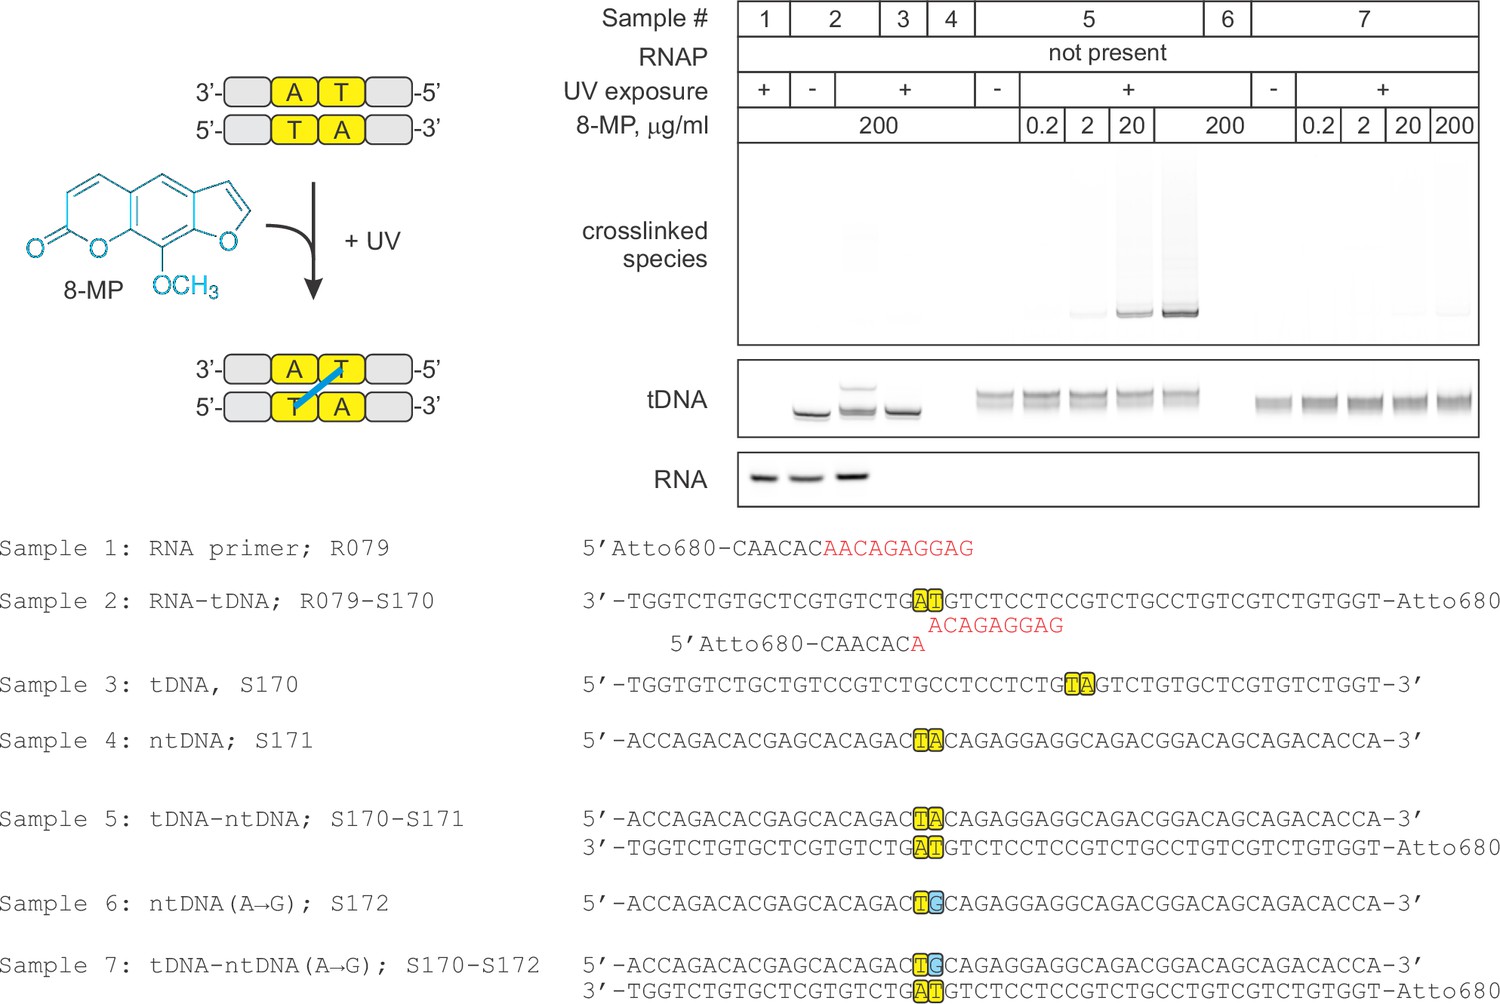
Control experiment: the specificity of DNA:DNA photocrosslinking with 8-MP.
Oligonucleotides were mixed in various combinations (samples 1–7), treated with indicated concentrations of 8‑MP and subjected, where indicated, to 30 min illumination with UV light. The vertically stacked panels were spliced from the same gel and the pixel counts were linearly scaled to span the full 8 bit grayscale range within each panel.
Figure 5 with 2 supplements
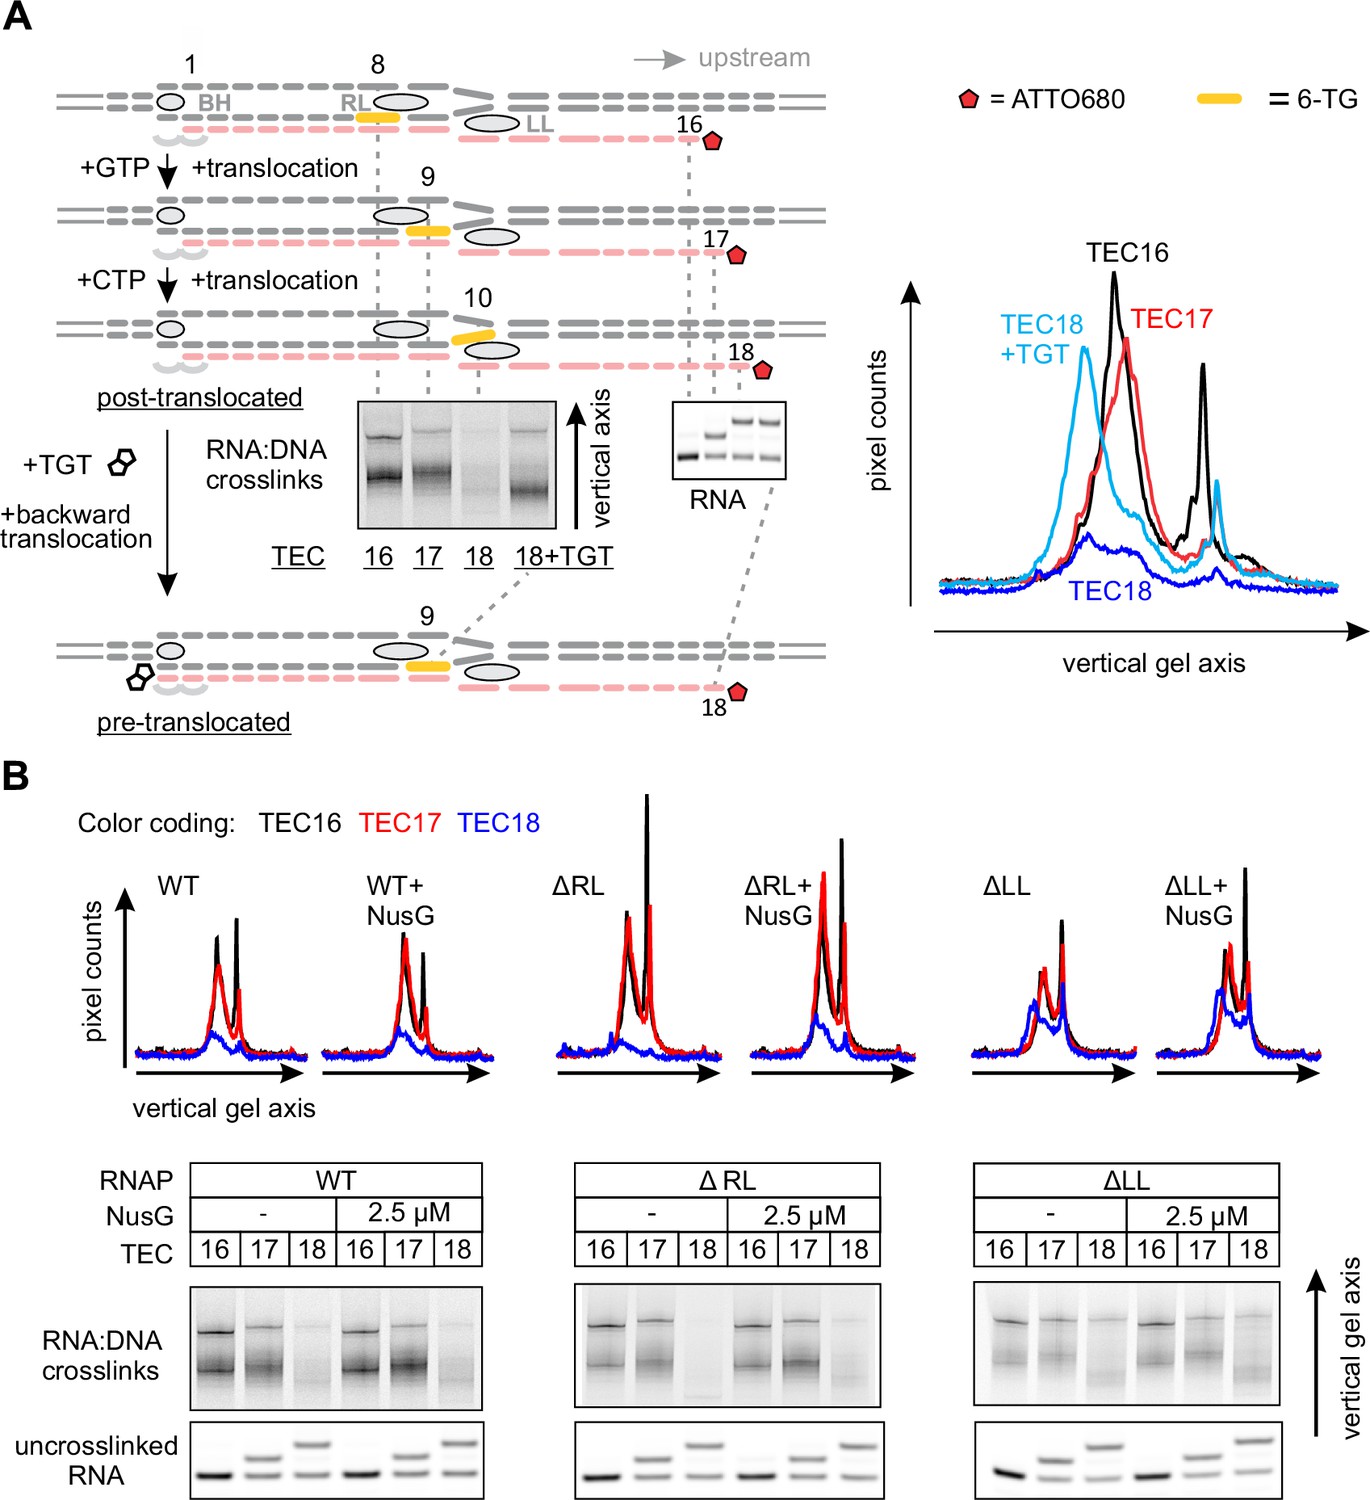
Probing the effects of NusG and deletions of the RNAP domains on the structure of the upstream fork junction by RNA:DNA photocrosslinking with 6-TG.
(A) TECs containing 6-TG in the template DNA were walked by up to three nucleotides, supplemented with 5 µM TGT (where indicated) and illuminated with the UV light. (B) RNA:DNA crosslinking in TECs formed by the wild-type and altered RNAPs in the absence and presence of NusG. The gel panels were spliced from the same gel and the pixel counts were linearly scaled to span the full 8 bit grayscale range within each panel. The pixel intensity profiles for each gel lane are shown above the gels. The independent repeats are presented in Figure 5—figure supplement 2.
Figure 5—figure supplement 1
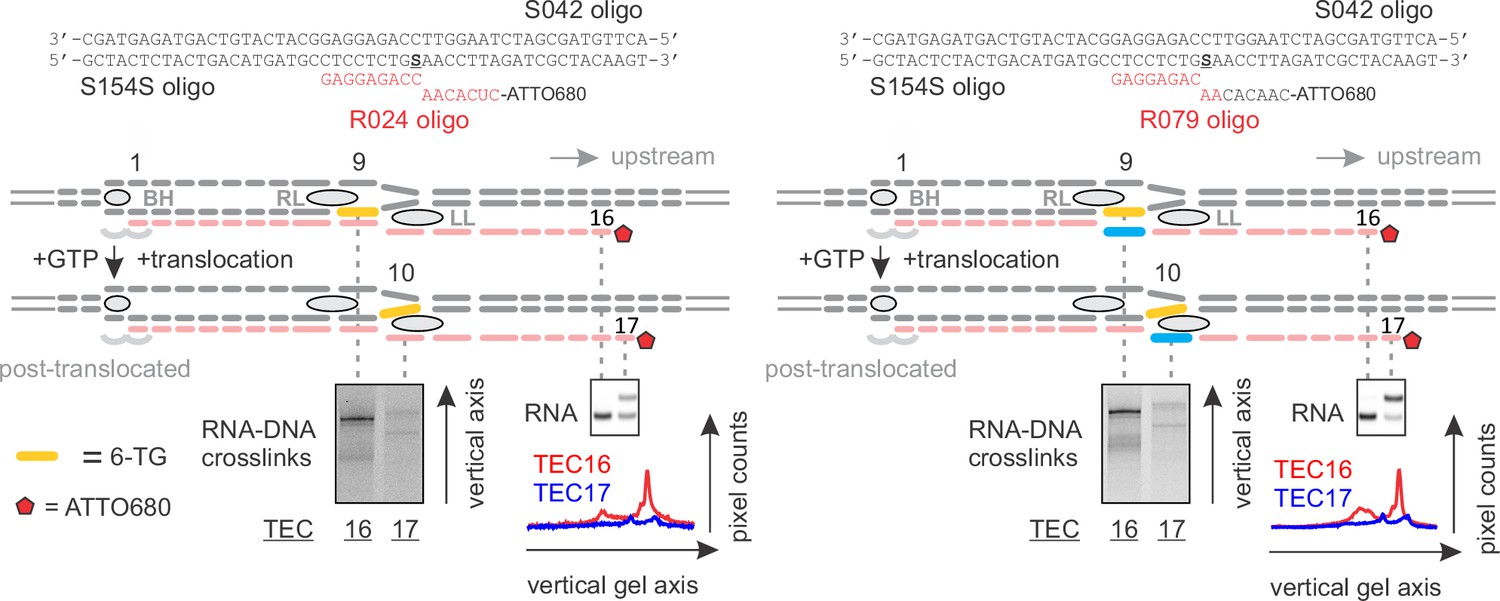
RNA:DNA photocrosslinking with 6-TG reflects the physical accessibility of RNA to DNA.
TECs containing 6-TG in the template DNA nine nucleotides upstream of the RNA 3’ end were walked by up to two nucleotides and illuminated with the UV light. The RNA:DNA complementarity was initially nine (Left) and eight (Right) base pairs. 6-TG does not pair with RNA in the TEC16 on the right: the mismatch against 6‑TG is colored light blue. The vertically stacked panels were spliced from the same gel and the pixel counts were linearly scaled to span the full 8 bit grayscale range within each panel.
Figure 5—figure supplement 2

The effects of NusG (A), TGT (B) and ΔLL (C) on RNA:DNA photocrosslinking with 6-TG.
This figure presents the independent repeats of the experiments in Figure 5. The gel panels were spliced from the same gel and the pixel counts were linearly scaled to span the full 8 bit grayscale range within each panel. The pixel intensity profiles for each gel lane are shown above the gels.
Figure 6 with 1 supplement
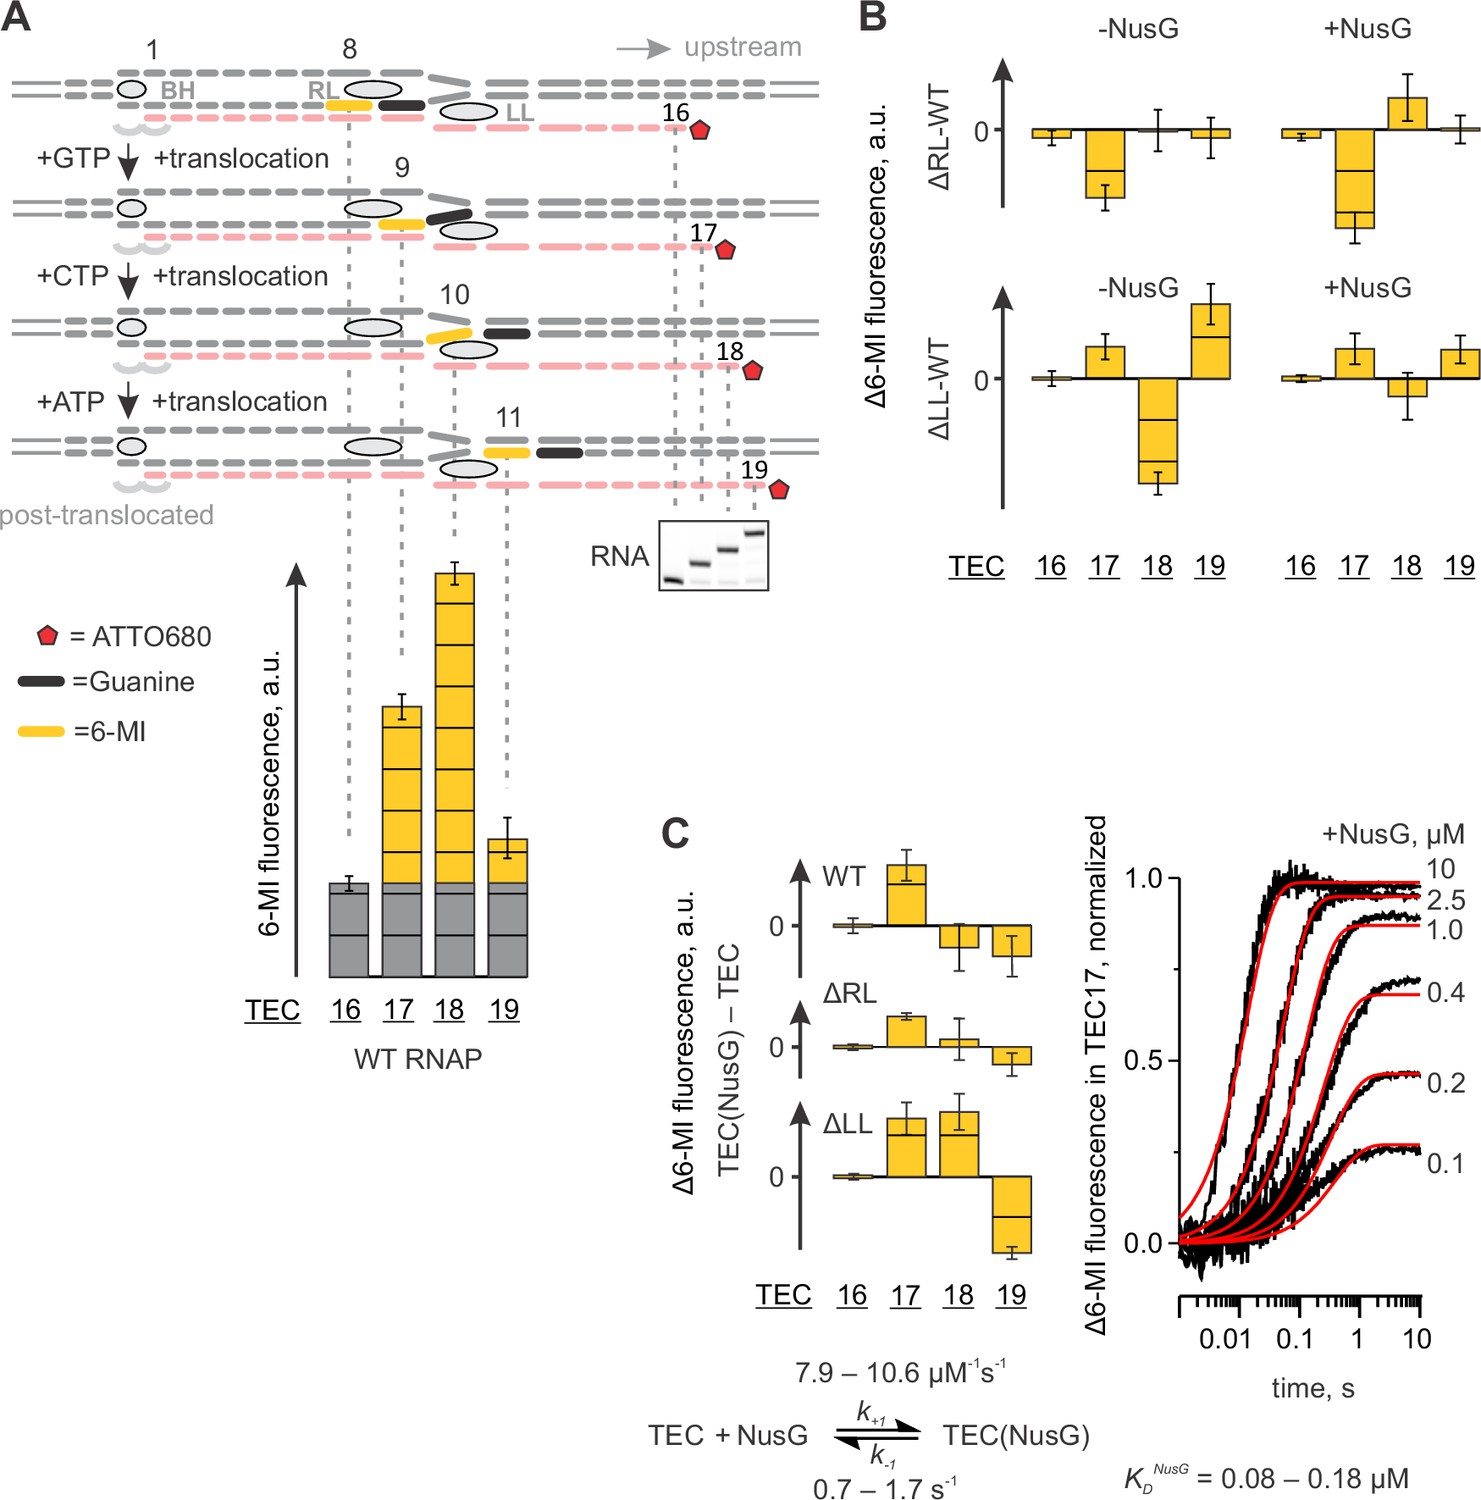
Probing the effects of NusG and deletions of the RNAP domains on the structure of the upstream fork junction by a fluorescent beacon in the template DNA.
Error bars indicate the range of duplicate measurements or SDs of several measurements (Table 5). (A) Walking 6-MI (yellow dash) through the upstream fork junction modulates 6-MI stacking with the upstream guanine (black dash) that functions as a strong quencher. (B) The effects of ΔRL and ΔLL on the TEC fluorescence in the absence and the presence of NusG. (C) The effects of NusG on 6-MI fluorescence of the wild-type and altered TECs. Monitoring the fluorescence of TEC17 upon mixing with NusG in a stopped flow instrument (graph on the right, black curves) allows for the estimation of the binding and the dissociation rate constants. The analysis scheme is depicted below the graph. The best fit curves (red) were simulated using k+1=9.2 µM−1s−1; k−1=1.1 s−1. The lower and upper bounds of rate constants were calculated by combined analysis of data from two independent experiments by FitSpace routine of Kintek Explorer software (at a 10% increase in Chi2).
Figure 6—figure supplement 1
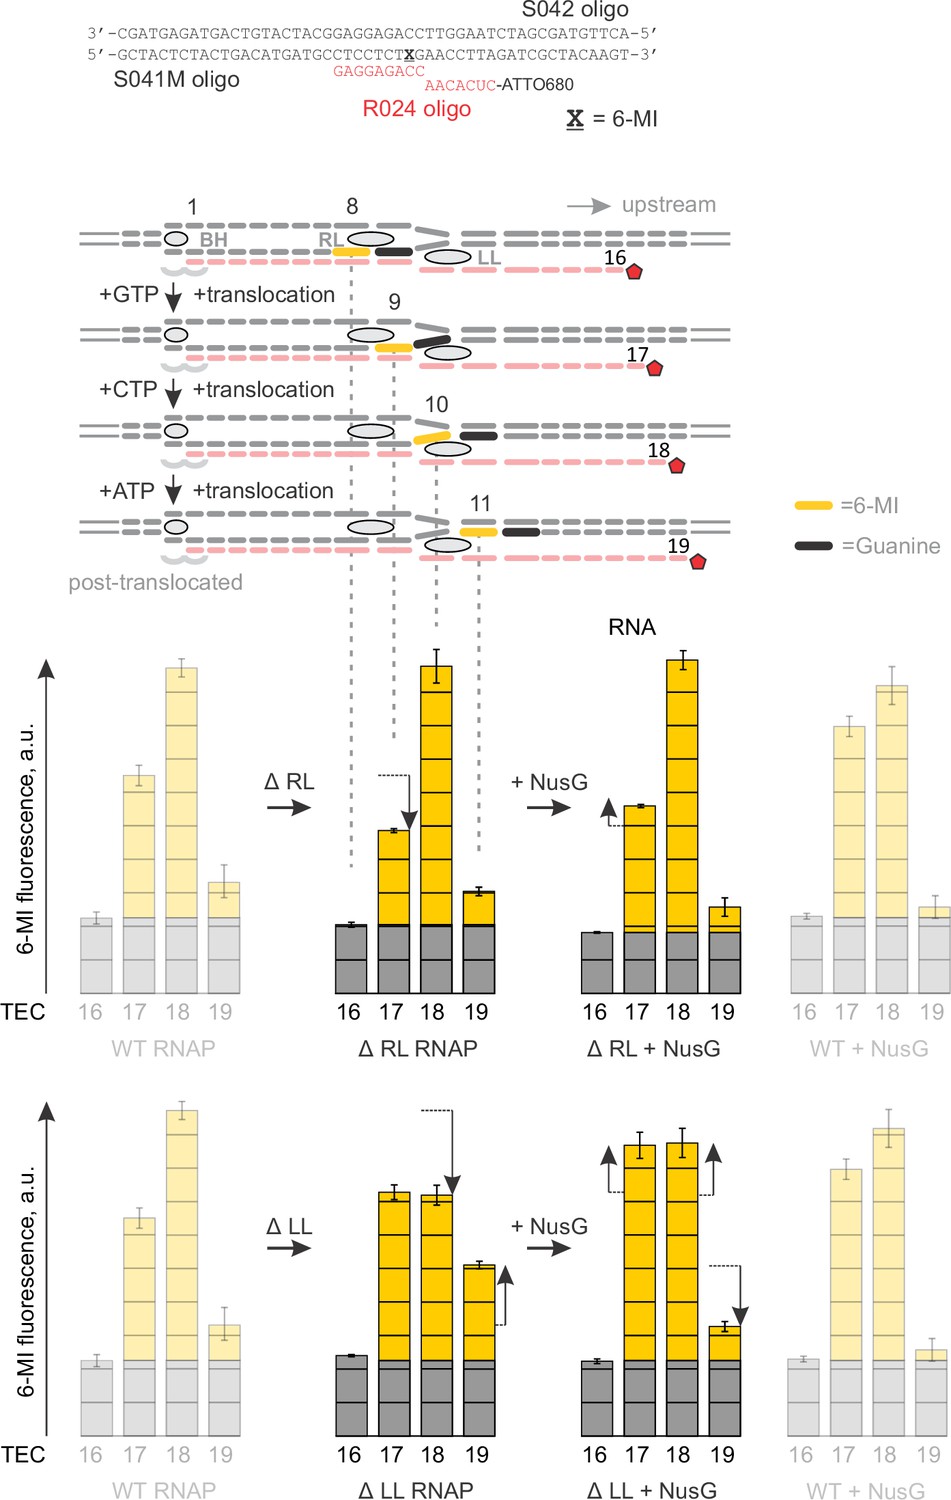
Primary data for Figure 6: the effects of NusG and deletions of the RNAP domains on 6-MI fluorescence.
Black vertical arrows depict the changes in fluorescence relative to the neighboring graph on the left. The wild-type TEC data (faded graphs) are presented for comparison. Error bars indicate the range of duplicate measurements or SDs of several measurements (Table 5).
Figure 7 with 2 supplements
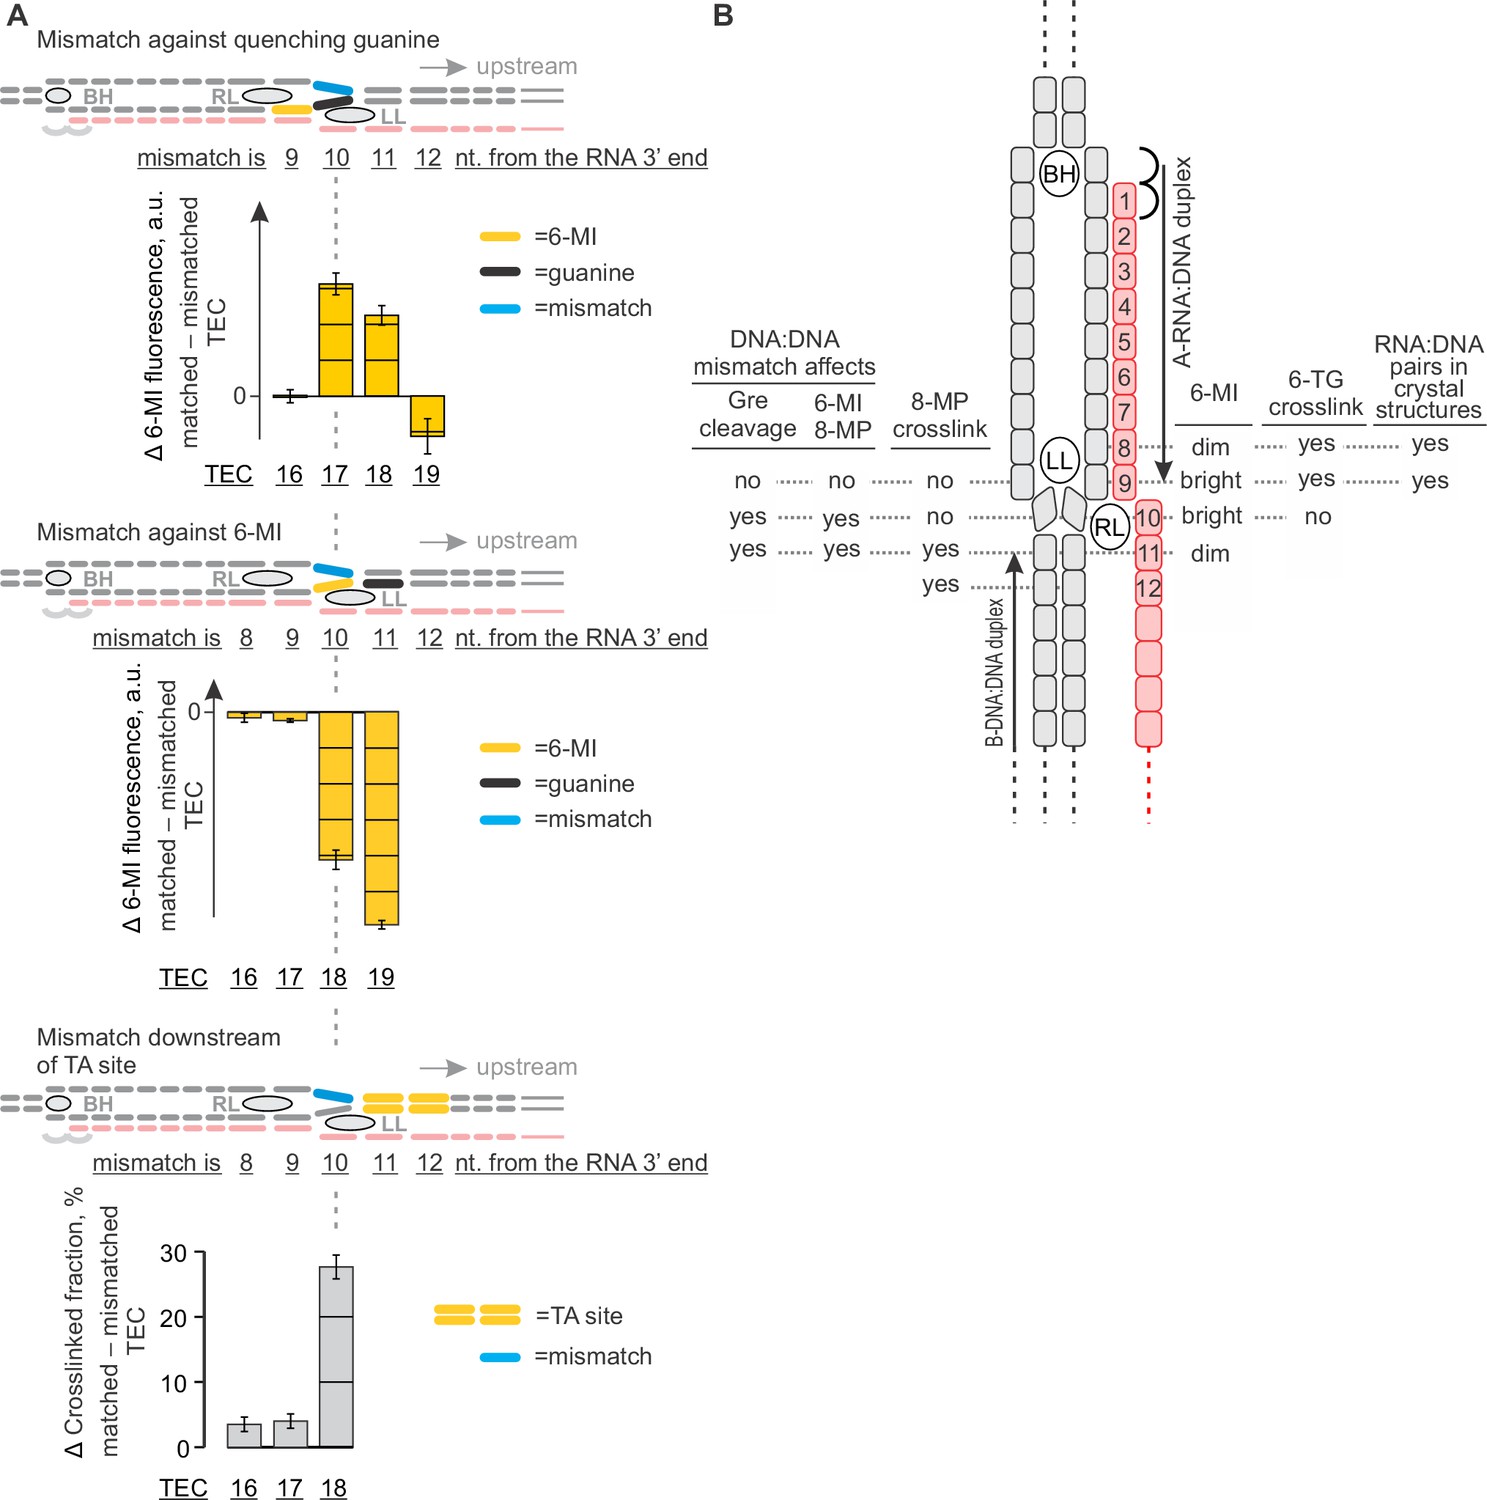
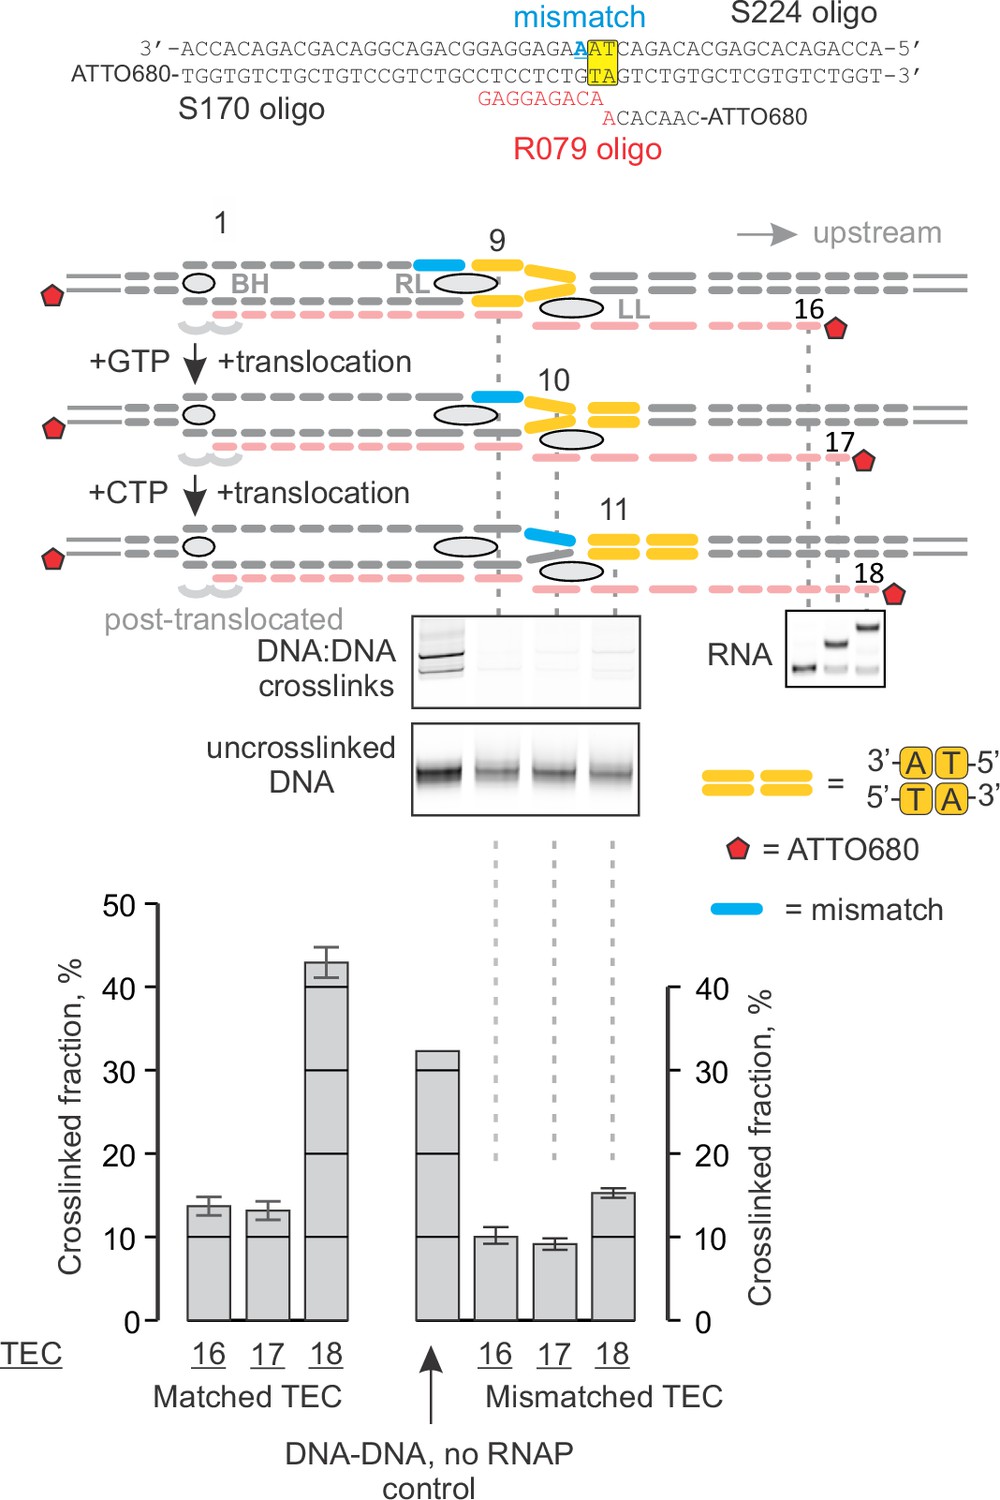
The effects of DNA mismatches suggest the minimal transcription bubble.
(A) DNA:DNA mismatches against quenching guanine (top) and 6-MI (middle), or downstream of the TA site (bottom) alter the TEC properties when positioned ten nucleotides upstream of the RNA 3' end and further upstream. Error bars indicate the range of duplicate measurements or SDs of several measurements (Table 5). (B) Mapping the upstream edge of the transcription bubble based on data in Figures 3C, 4A, 5A, 6A and 7A.
Figure 7—figure supplement 1
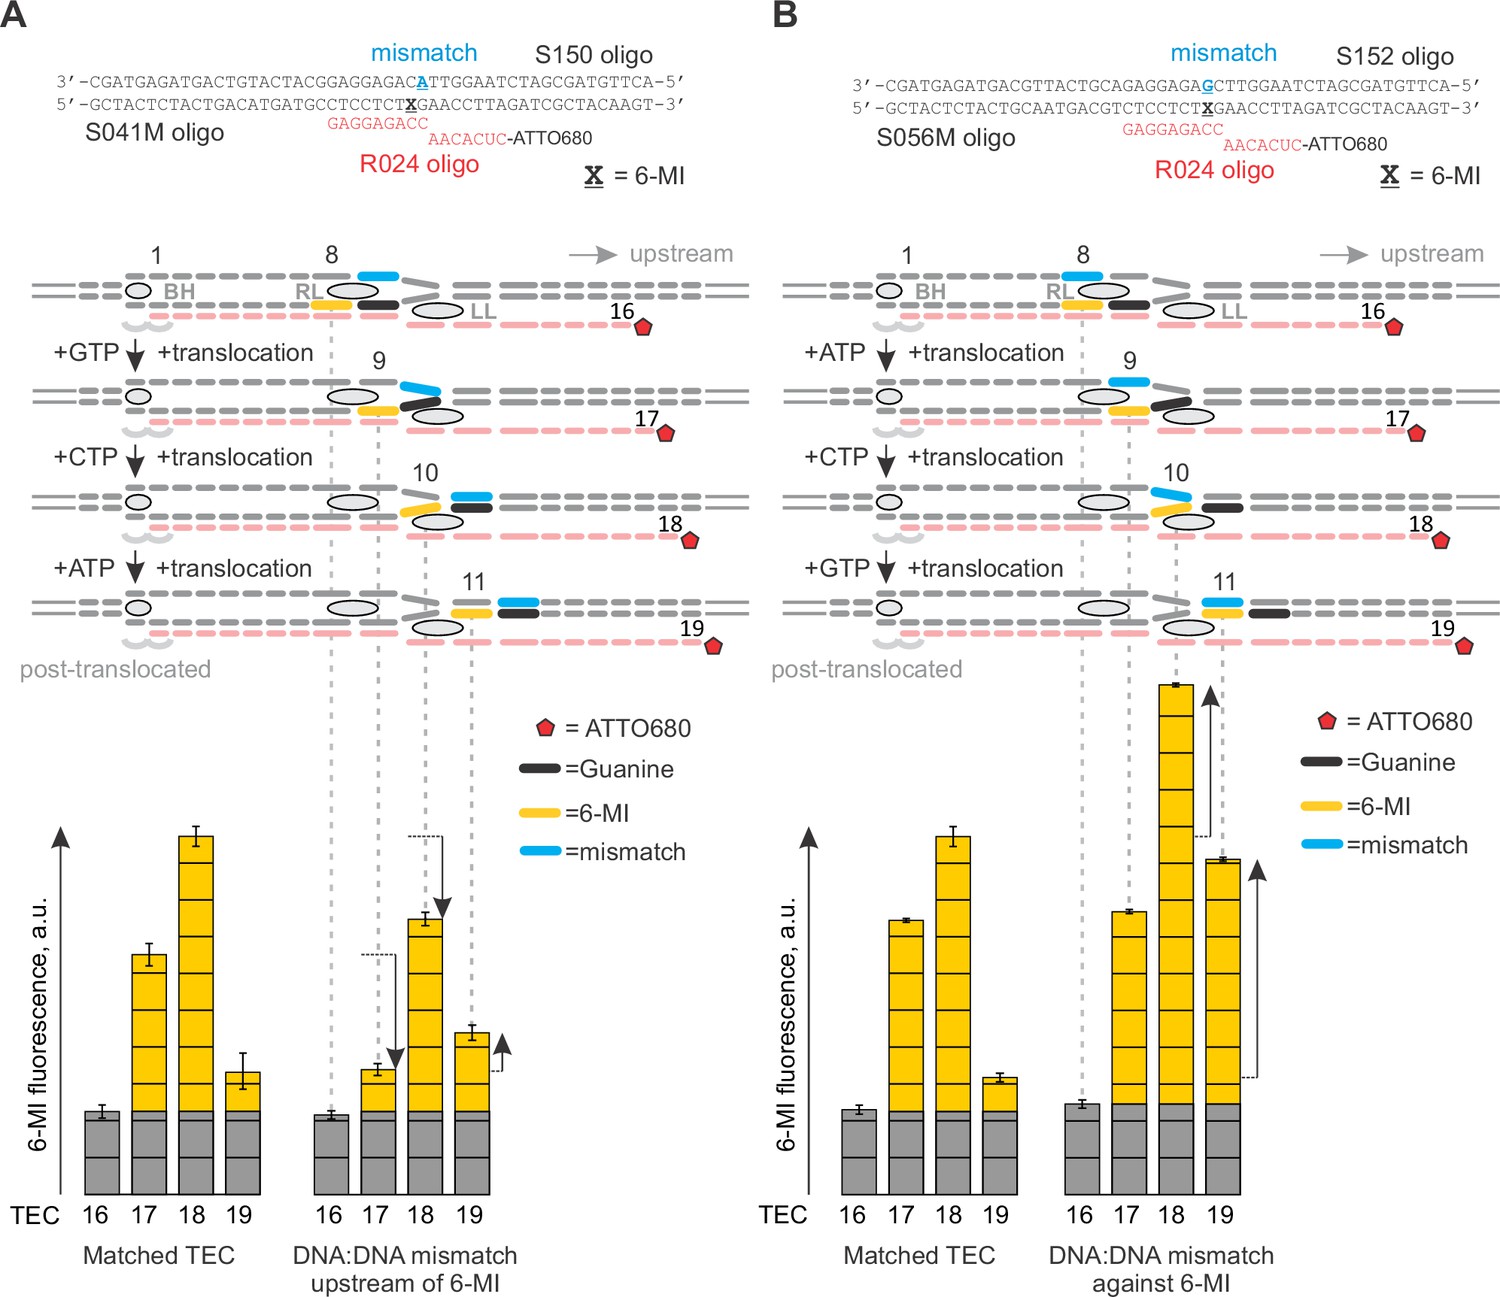
Primary data for Figure 7A: the effects of DNA mismatches on 6-MI fluorescence.
Black vertical arrows depict the changes in fluorescence relative to the graph on the left. Error bars indicate the range of duplicate measurements or SDs of several measurements (Table 5). (A) The mismatch is against quenching guanine. (B) The mismatch is against 6‑MI.
Figure 7—figure supplement 2
Primary data for Figure 7A: the effect of a DNA mismatch downstream of the TA site on crosslinking with 8‑MP.
Error bars indicate the range of duplicate measurements or SDs of several measurements (Table 5).
Figure 8

A model of the upstream fork junction.
DNA bases are numbered from the RNA 3' end in the post-translocated TEC. (A) An overview: β’ LL and the structurally conserved five amino acid loop of NusG NTD form a channel accommodating the exiting upstream DNA. (B) The template DNA nucleotide at position ten can be modeled to pair with the non-template DNA in a partially unstacked conformation (top) or interact with the cleft between the β’ RL and β’ LL (bottom). DNA and RNA bases are shown as spheres, sugar-phosphate backbones as cartoons. The β subunit is omitted for clarity. (C) The superimposition of Aquifex aeolicus NusG NTD (PDB ID 1M1G) and Pyrococcus furiosus Spt5 NTD (PDB ID 3P8B). The cartoon color changes from magenta in well superimposed regions to cyan in poorly superimposed or unaligned regions. The β’ clamp helices (yellow, from PDB ID 3QQC), the upstream DNA (grey, from the model in A) and Spt4 (cyan cartoon, from PDB ID 3P8B) are included to present the superimposition in the context of the TEC. (D) Multiple sequence alignment of the structurally conserved five amino acid loop of NusG family proteins and the flanking secondary structure elements. Species names are abbreviated as follows: Eco, E. coli, Bsu, Bacillus subtilis, Mtu, Mycobacterium tuberculosis, Tma, Thermotoga maritima, Syn, Synechocystis sp. PCC 6803, Tth, T. thermophilus, Aae, Aquifex aeolicus, Mja Methanocaldococcus jannaschii, Pfu, Pyrococcus furiosus, Sce, Saccharomyces cerevisiae, Hsa, Homo sapiens. Amino acid residues are shaded as follows: hydrophobic –green, polar –olive, Pro and Gly –yellow, Asp and Glu –red, Arg, Lys and His –cyan.
-
Figure 8—source data 1
NusG-TEC model.
- https://doi.org/10.7554/eLife.18096.022
Tables
Table 1
Numerical values of the reaction rate constants and the median reaction times.
| Figure | |||||||||||||||
|---|---|---|---|---|---|---|---|---|---|---|---|---|---|---|---|
| 2B | −NusG | +NusG | |||||||||||||
| lower bound | best fit | upper bound | lower bound | best fit | upper bound | ||||||||||
| nucleotide addition, s−1 | 27 | 28 | 30 | 28 | 28 | 30 | |||||||||
| translocation, s−1 | 60 | 65 | 73 | 62 | 70 | 79 | |||||||||
| Slow TEC fraction | ~8% | ~7% | |||||||||||||
| recovery rate, s−1 | 0.4 | 1.1 | 2.7 | 0.4 | 1.1 | 2.7 | |||||||||
| inactivation rate, s−1 | 0.03 | 0.09 | 0.3 | 0.02 | 0.08 | 0.2 | |||||||||
| The lower and upper bounds of rate constants were calculated by the combined analysis of data from several independent experiments (Table 5) by FitSpace routine of Kintek Explorer software (at a 10% increase in Chi2). | |||||||||||||||
| 2C | median pyrophosphorolysis time, s | ||||||||||||||
| -NusG | +NusG | ||||||||||||||
| 0.49 ± 0.08 | 0.51 ± 0.08 | ||||||||||||||
| Errors indicate the range of the bestfit estimates in duplicate experiments. | |||||||||||||||
| 2D | KD TGT, µM | ||||||||||||||
| -NusG | +NusG | ||||||||||||||
| 0.09–0.15 | 0.09–0.14 | ||||||||||||||
| The ranges represent 95% confidence interval for KD determined by the nonlinear regression analysis of data from two independent experiments. | |||||||||||||||
| 3B | Method | median reaction time, s | |||||||||||||
| −NusG | +NusG | ||||||||||||||
| 6-MI | 13.2 ± 2.2 | 28.0 ± 0.7 | |||||||||||||
| RNA18 | 11.7 ± 1.1 | 30.4 ± 3.4 | |||||||||||||
| RNA16 | 11.6 ± 1.2 | 30.1 ± 3.6 | |||||||||||||
| 2-AP | 12.4 ± 1.8 | 30.3 ± 2.2 | |||||||||||||
| Errors indicate the range of the bestfit estimates in duplicate experiments. | |||||||||||||||
| 3C | RNA | DNA | RNAP | median reaction time, s | |||||||||||
| −NusG | +NusG | ||||||||||||||
| matched | matched | WT | 12.4 ± 1.8 | 30.3 ± 2.2 | |||||||||||
| matched | matched | ΔRL | 11.1 ± 1.9 | 25.7 ± 4.4 | |||||||||||
| matched | matched | ΔLL | 11.4 ± 1.3 | 20.6 ± 3.1 | |||||||||||
| matched | matched | ΔGL | 24.0 ± 2.3 | 54.1 ± 4.7 | |||||||||||
| matched | mm 1 | WT | 19.9 ± 2.2 | 42.9 ± 3.3 | |||||||||||
| matched | mm 1 and 2 | WT | 2.30 ± 0.04 | 3.11 ± 0.20 | |||||||||||
| 3’ mm | matched | WT | 0.34 ± 0.17 | 0.36 ± 0.10 | |||||||||||
-
3’ mm stands for mismatch against 3’ RNA nucleotide. Errors indicate the range of the bestfit estimates in duplicate experiments.
Table 2
DNA oligonucleotides and RNA primers used in this study.
| Name | type | Sequence (5’→3’) | Employment | |
|---|---|---|---|---|
| S041M | tDNA | GCTACTCTACTGACATGATGCCTCCTCTXGAACCTTAGATCGCTACAAGT | Figures 2,6–7 | |
| S154S | tDNA | GCTACTCTACTGACATGATGCCTCCTCTGSAACCTTAGATCGCTACAAGT | Figure 5—figure supplement 1 | |
| S155S | tDNA | GCTACTCTACTGACATGATGCCTCCTCTSGAACCTTAGATCGCTACAAGT | Figure 5 | |
| S042 | ntNA | ACTTGTAGCGATCTAAGGTTCCAGAGGAGGCATCATGTCAGTAGAGTAGC | Figures 2,5–7 | |
| S150 | ntDNA | ACTTGTAGCGATCTAAGGTTCAGAGGAGGCATCATGTCAGTAGAGTAGC | Figure 7A | |
| S056M | tDNA | GCTACTCTACTGCAATGACGTCTCCTCTXGAACCTTAGATCGCTACAAGT | Figures 2C, 3B, 7A | |
| S076 | tDNA | GCTACTCTACTGCAATGACGTCTCCTCTGGAACCTTAGATCGCTACAAGT | Figure 3 | |
| S057 | ntDNA | ACTTGTAGCGATCTAAGGTTCCAGAGGAGACGTCATTGCAGTAGAGTAGC | Figures 2C,3,7A | |
| S152 | ntDNA | ACTTGTAGCGATCTAAGGTTCAGAGGAGACGTCATTGCAGTAGAGTAGC | Figures 3C,7A | |
| S153 | ntDNA | ACTTGTAGCGATCTAAGGTTAGAGGAGACGTCATTGCAGTAGAGTAGC | Figure 3C | |
| S173 | ntDNA | ACTTGTAGCGATCTAAGGTTAGAGGAGACGTCATTGCAGTAGAGTAGC | Figure 3—figure supplement 3 | |
| S114 | tDNA | CGTACTCTACTCGAATAGCATCTCCTCTGGAACCTTAGATCGTCACAAGT | Figure 3C | |
| S115 | ntDNA | ACTTGTGACGATCTAAGGTTCCAGAGGAGATGCTATTCGAGTAGAGTACG | Figure 3C | |
| S170 | tDNA | Atto680- | TGGTGTCTGCTGTCCGTCTGCCTCCTCTGTAGTCTGTGCTCGTGTCTGGT | Figures 4,7A |
| S171 | ntDNA | ACCAGACACGAGCACAGACTACAGAGGAGGCAGACGGACAGCAGACACCA | Figures 4,7A | |
| S224 | ntDNA | ACCAGACACGAGCACAGACTAAGAGGAGGCAGACGGACAGCAGACACCA | Figure 7A | |
| R024 | RNA | Atto680- |
| Figures 2,5–7 |
| R052 | RNA | Atto680- |
| Figure 3 |
| R079 | RNA | Atto680- |
| Figures 4,7, Figure 5—figure supplement 1 |
-
X = 6-methyl-isoxanthopterin; S = 6-thioguanine; = 2-aminopurine
-
Mismatches in ntDNA are marked in blue and underlined.
-
R079 is a chimeric oligo: six 5’ nucleotides are DNA.
Table 3
E. coli protein expression vectors used in this study.
| Name | Description | Source/reference |
|---|---|---|
| pVS10 | wild-type RNAP (T7p-α-β-β’_His6-T7p-ω) | (Belogurov et al., 2007) |
| pTG011 | ΔβGL RNAP (T7p-α-His6_β[ΔR368-P376→GG]-β’-ω) | this work |
| pMT041 | Δβ’RL RNAP (T7p-α-β-β’[ΔN309-K325]_TEV_His10-T7p-ω) | this work |
| pHM001 | Δβ’LL RNAP (T7p-α-β-β’[ΔP251-S263→GG]_TEV_His10-T7p-ω) | this work |
| pIA578 | GreA (T7p-GreA_His6) | (Perederina et al., 2006) |
| pGB043 | NusG (T7p-His6_TEV_NusG) | made by GB in Artsimovitch lab. |
-
Sequences of the plasmids are provided as Supplementary file 5 (plasmids.fas).
Table 4
TEC assembly ratios and reaction buffers.
| Concentrations during assembly, µM | Assembly buffer | Reaction buffer* | ||||||
|---|---|---|---|---|---|---|---|---|
| RNA | tDNA | ntDNA | RNAP | TEC | additive | |||
| Nucleotide addition (gel) | 1 | 1.4 | 2 | 1.5 | TB10 | TB10 | TB10 | Figure 2B |
| RNA cleavage (gel) | 1 | 1.4 | 2 | 1.5 | TB0 | TB0 | TB2 | Figure 3B |
| Forward translocation (nucleotide addition) | 1.4 | 1 | 2 | 1.5 | TB10 | TB10 | TB10 | Figure 2B |
| Backward translocation (pyrophosphorolysis) | 1.4 | 1 | 2 | 1.5 | TB10 | TB10 | TB10 | Figure 2C |
| Backtracking (RNA cleavage) | 1.4 | 1 | 2 | 1.5 | TB0 | TB0 | TB2 | Figure 3B |
| NusG binding | 1.4 | 1 | 2 | 1 | TB1 | TB1 | TB1 | Figure 6C |
| Equilibrium 6-MI assays | 1.4 | 1 | 2 | 1.5 | TB10 | TB10 | Figures 2D,6–7 | |
| Dinucleotide release (RNA cleavage) | 1 | 1.4 | 2 | 1.5 | TB0 | TB0 | TB2 | Figure 3 |
| 8-MP crosslinking | 1.2 | 1 | 1 | 1.5 | TB10 | TB10 | Figures 4,7A | |
| 6-TG crosslinking | 1 | 1 | 2 | 1.5 | TB10 | TB10 | Figure 5 | |
-
* In time resolved assays the equal volumes of the TEC and the additive solutions were mixed to initiate the reaction.
Table 5
The number of repeats for each experiment.
| Figure | Data | Number of experiments | ||||||
|---|---|---|---|---|---|---|---|---|
| with independently assembled TECs | including the experiments with the same TEC preparation | with independently assembled TECs not in the figures | ||||||
| control | +NusG | control | +NusG | control | +NusG | |||
| 2B | WT catalysis WT translocation | 4 3 | 3 2 | 8 >12 | 6 >8 | |||
| 2C | WT pyrophosphorolysis | 2 | 2 | >8 | >8 | |||
| 2D | WT TGT binding | 2 | 2 | |||||
| 3BC | WT RNA cleavage WT 6-MI WT 2-AP ΔRL 2-AP ΔLL 2-AP ΔGL 2-AP WT mm1 2-AP WT mm1-2 2-AP WT 3’mm 2-AP | 2 2 2 2 2 2 2 2 2 | 2 2 2 2 2 2 2 2 2 | 3 >8 >8 >8 >8 >8 >8 >8 >8 | 4 >8 >8 >8 >8 >8 >8 >8 >8 | 6 | 2 | |
| 3S3 | WT 6-MI WT 2-AP WT mm1-2 AA 2-AP WT mm1-2 GG 2-AP | 2 1 1 2 | 2 1 1 2 | 5 3 7 >8 | 5 3 8 >8 | 1 | 1 | |
| The experiments reported in the figures were performed with the same batch of GreA. The older and the newer experiments cannot be directly combined with the reported experiments due to the variations in the specific activity of the GreA preparations. However, the relative effect of NusG on the reactions involving backtracking can be estimated from all available data. In the WT TEC NusG inhibits reactions that involve backtracking: 2.61 ± 0.28 fold (n = 5, 2 µM GreA); 2.62 ± 0.22 fold (n = 6, 8 µM GreA) | ||||||||
| 4AB | WT 8-MP ΔRL 8-MP ΔLL 8-MP WT TEC18+TGT 8-MP | 7 3 3 2 | 3 2 2 | |||||
| 5AB 5S2 | WT 6-TG ΔRL 6-TG ΔLL 6-TG WT TEC18+TGT 6-TG | 7 2 3 2 | 3 2 2 | |||||
| 6AB,C(Left) | WT 6-MI ΔRL 6-MI ΔLL 6-MI | 2 2 2 | 2 2 2 | >5 5* 5* | >3 3* >3 | >7 | >7 | |
| * Except TEC19. SD of the fluorescence measurements with the same TEC preparation = 2.3 ± 1.3% (n = 122). SD of the fluorescence measurements with the independently assembled TECs = 16% (n = 8, WT TEC17 measured with different batches of the fluorescent oligonucleotides). Accordingly, the primary data from all fluorescent experiments cannot be directly combined with a figure but some NusG effects can be estimated with the highest accuracy and precision from all available data. NusG effects on the fluorescence intensity of the WT TECs: (TEC17NusG–TEC16NusG)/(TEC17-TEC16) = 1.45 ± 0.09 (n = 9) (TEC18NusG–TEC16NusG)/(TEC18-TEC16) = 0.99 ± 0.02 (n = 7) (TEC19NusG–TEC16NusG)/(TEC19-TEC16) = 0.50 ± 0.35 (n=3) | ||||||||
| 6C (Right) | WT+NusG 6-MI | 2 | >6 | |||||
| 7A | TEC16-19 6-MI | 2 | 9 (except TEC19) | |||||
| TEC16-19 6-MI | 2 | 4 (except TEC19) | ||||||
| TEC16-18 8-MP | 2 | 2 | ||||||
Additional files
-
Supplementary file 1
Model employed for fitting of nucleotide addition and translocation data.
- https://doi.org/10.7554/eLife.18096.027
-
Supplementary file 2
Model employed for fitting pyrophosphorolysis, backtracking, RNA cleavage and dinucleotide release data.
- https://doi.org/10.7554/eLife.18096.028
-
Supplementary file 3
Model employed for fitting equilibrium titration with TGT.
- https://doi.org/10.7554/eLife.18096.029
-
Supplementary file 4
Model employed for fitting NusG binding kinetics.
- https://doi.org/10.7554/eLife.18096.030
-
Supplementary file 5
Plasmid sequences.
- https://doi.org/10.7554/eLife.18096.031
Download links
A two-part list of links to download the article, or parts of the article, in various formats.
Downloads (link to download the article as PDF)
Open citations (links to open the citations from this article in various online reference manager services)
Cite this article (links to download the citations from this article in formats compatible with various reference manager tools)
NusG inhibits RNA polymerase backtracking by stabilizing the minimal transcription bubble
eLife 5:e18096.
https://doi.org/10.7554/eLife.18096


