Motility and microtubule depolymerization mechanisms of the Kinesin-8 motor, KIF19A
- Graduate School of Medicine, The University of Tokyo, Japan
- RIKEN Center for Life Science Technologies, Japan
- King Abdulaziz University, Saudi Arabia
Figures
Figure 1
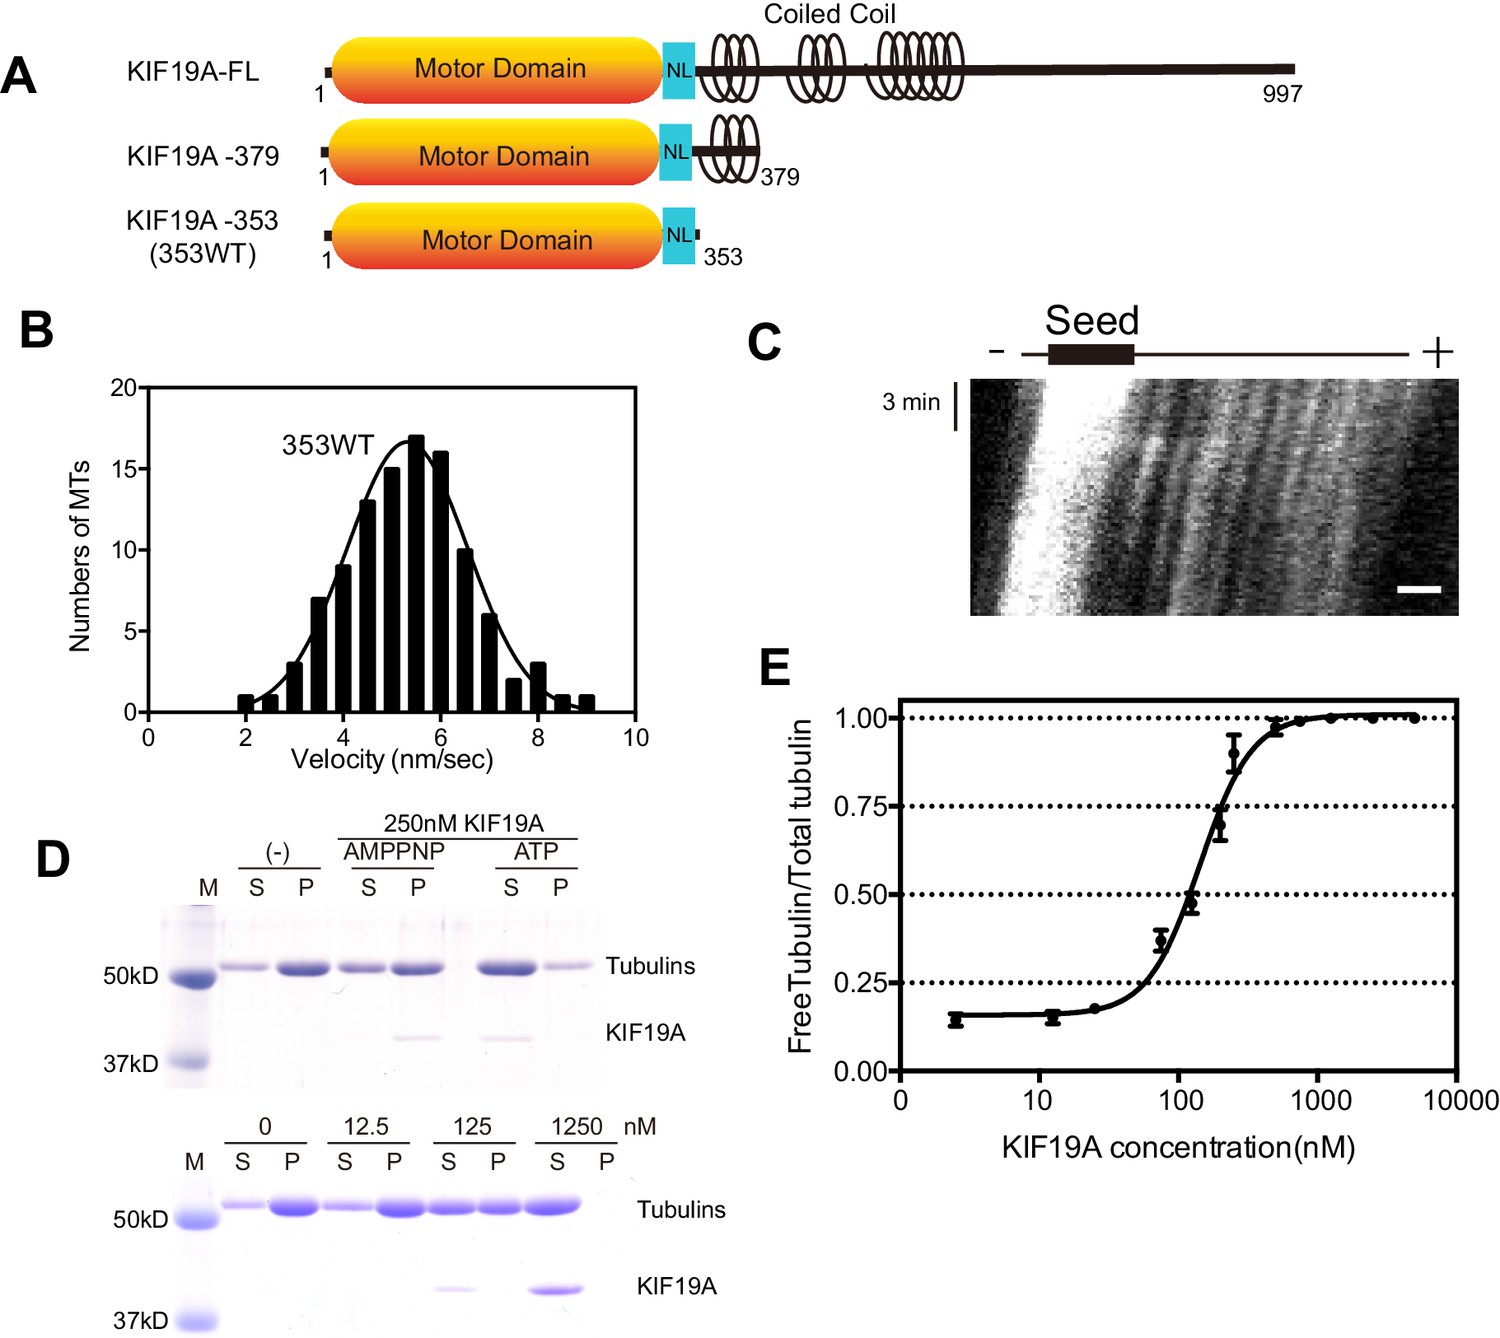
Characteristics of the dual function mouse KIF19A motor domain.
(A) Schematic of mouse KIF19A motor domain constructs. The KIF19A monomer KIF19A-353 (referred to as 353WT) was used in this study. NL, neck-linker. (B) MT gliding assays of 353WT on taxol-stabilized MTs. Data are presented as the mean ± SEM, n = 105 MTs. (C) Kymograph showing movement of 353WT along MTs as imaged by TIRF microscopy. Scale bars, 2 μM (horizontal) and 3 min (vertical). The average MT length is 8.39 ± 2.71 μM. (D) 1.5 μM GMPCPP-stabilized MTs were incubated with 250 nM 353WT in the presence of 5 mM ATP or AMP-PNP (Top) for 15 min. AMP-PNP was used as a control. 1.5 μM GMPCPP-stabilized MTs were incubated with different concentrations of 353WT in the presence of 5 mM ATP for 15 min (Bottom). The microtubules were pelleted by centrifugation to separate the free tubulin (S) and MT pellets (P). SDS-PAGE and Coomassie brilliant blue staining were used to confirm the ratio of free tubulin and MTs. Representative data from three independent sample preparations are shown. (E) Dose-response MT depolymerization curve for different concentrations of 353WT. Data are presented as the mean ± SD. The mean EC50 values of 353WT was 142 ± 2 nM. The data from three independent experiments were analysed.
-
Figure 1—source data 1
The data and analysis for 353WT.
Sheet F1B: Motility Velocity of 353WT. Sheet F1E: The data and analysis of dose-response MT depolymerization curve for different concentrations of 353WT.
- https://doi.org/10.7554/eLife.18101.004
Figure 2 with 2 supplements
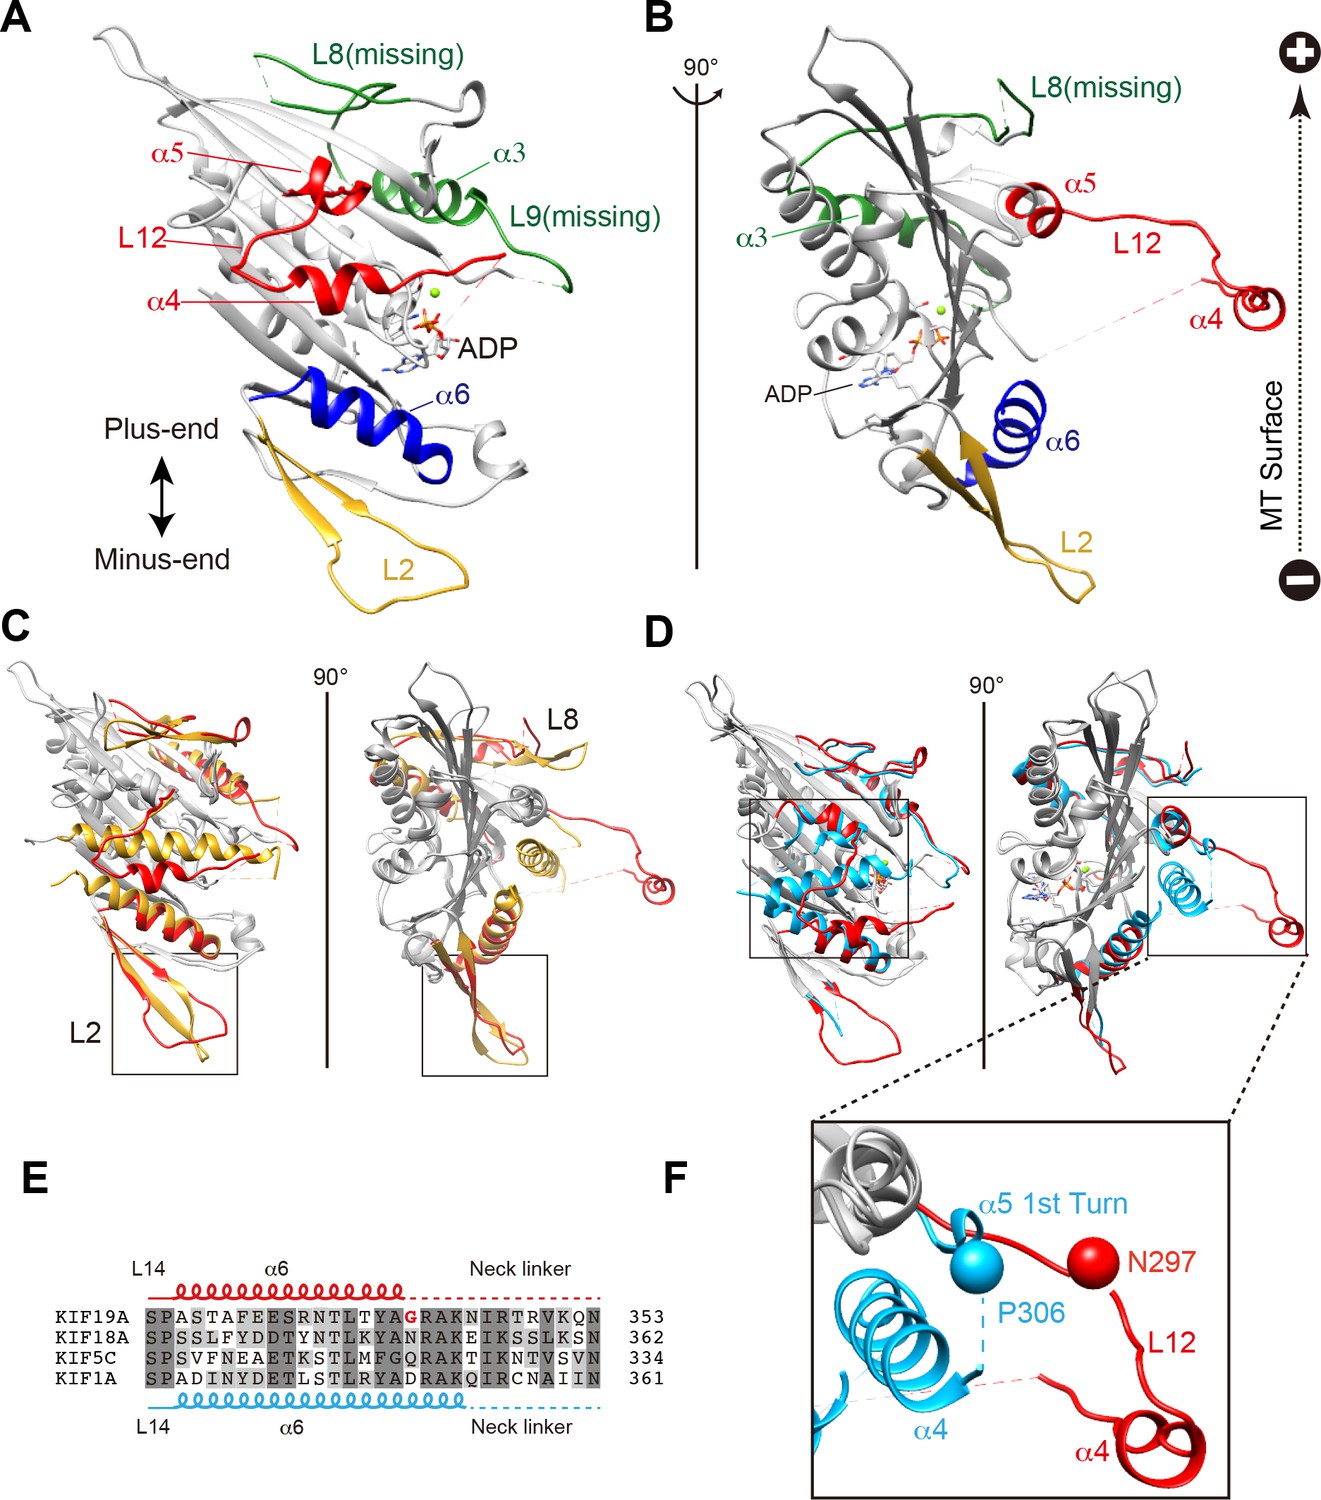
Crystal structure of the dual function mouse KIF19A motor domain.
(A, B) Crystal structure of the KIF19A motor domain in the ADP-state seen from the MT binding side (A) and 90 degree rotation around the ordinate axis (B). L2 (yellow), L8-α3-L9 (green), L11-α4-L12-α5 (red) and α6 (blue) are depicted. The Mg2+-ADP is shown as a ball and stick model. (C) Superposition of the KIF19A motor domain and KIF2C-ADP (PDB: 1V8J). The clusters with obviously different structures are colored red (KIF19A) and gold (KIF2C). L2 is shown in the square. (D) Superposition of KIF19A-ADP and KIF18A-ADP (PDB: 3LRE). The clusters with obviously different structures are colored red (KIF19A) and light blue (KIF18A). α4-L12-α5 is shown in the square. (E) Sequence alignment of α6 between KIF19A and other typical moving kinesin motors. For other kinesin motors see Figure 2—figure supplement 2A. (F) Zoom-in view of α4-L12-α5 of KIF19A and KIF18A motor domain in Figure 2D. N297 of KIF19A and P306 of KIF18A are shown as balls.
Figure 2—figure supplement 1
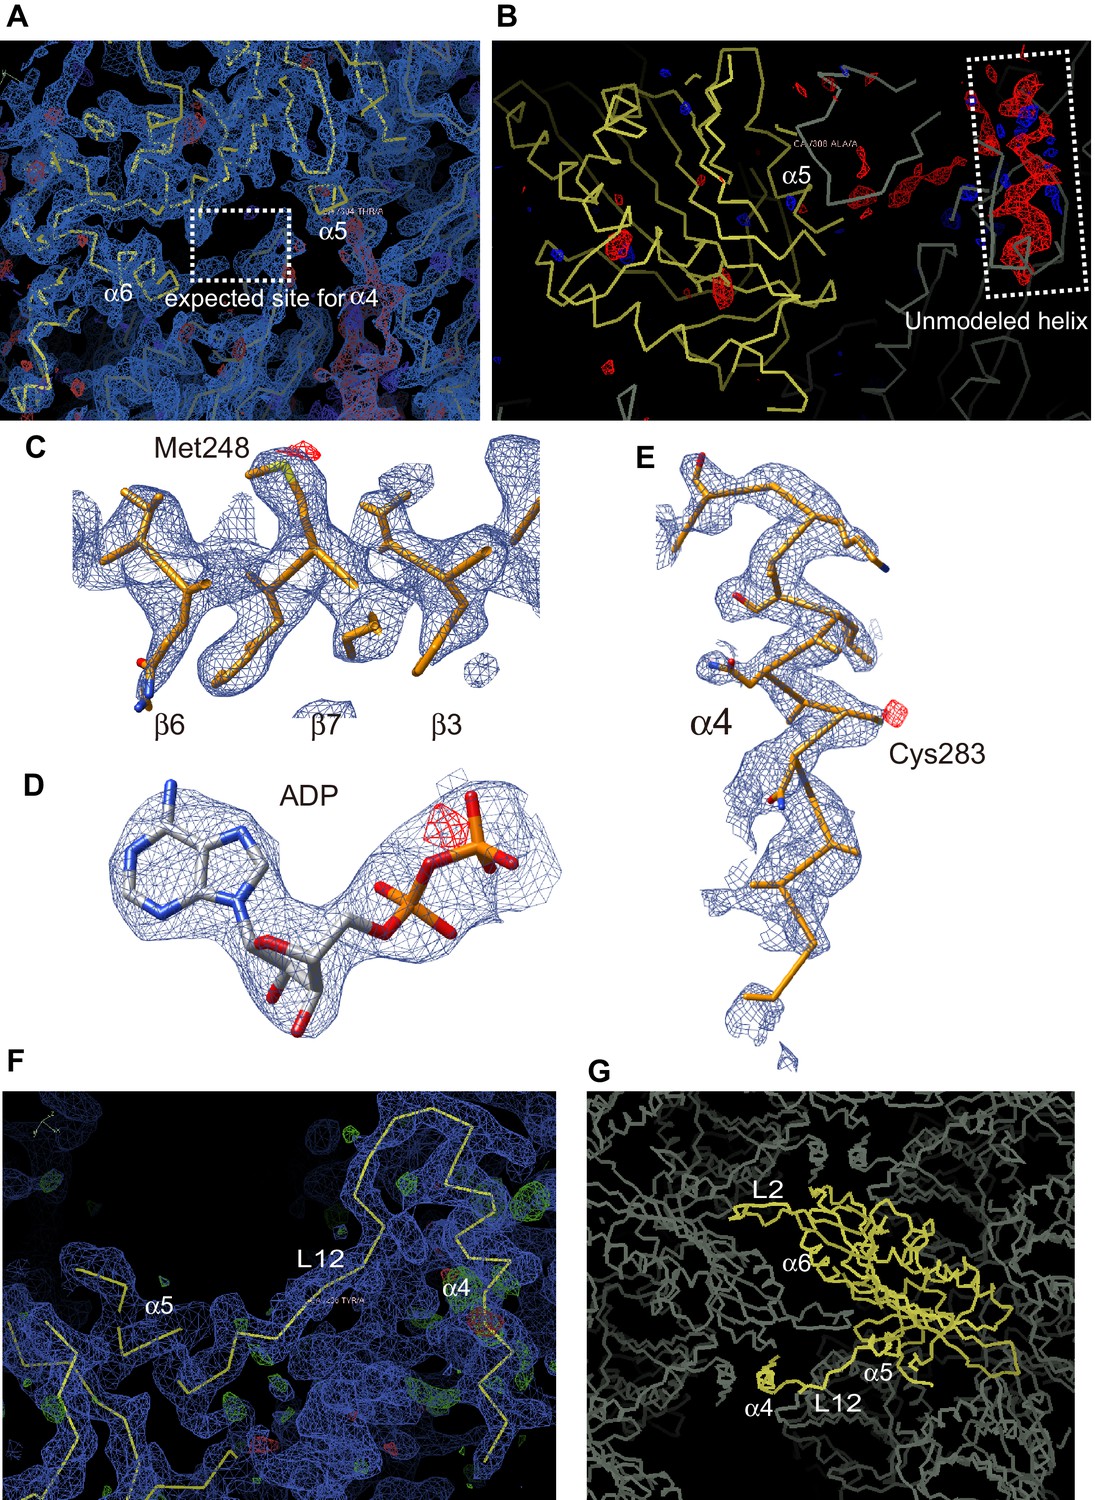
The unmodeled helix determination by the long wavelength X-ray diffraction.
(A) The 2Fo-Fc electron density map contoured at 1.0 σ (blue) is shown. The dashed line rectangle shows the common α4 position for all reported kinesin structures where no corresponding density was found in the KIF19A map. (B) The Fo-Fc difference map contoured at 2.5 σ (red) shows the positive helical density in the dashed line rectangle. (C–E) The anomalous difference Fourier maps contoured at 3.8 σ (red) of (C) Met248, (D) ADP and (E) Cys283 clearly show the signals from the sulfur or the phosphorus atoms. (F) The 2Fo-Fc electron density map around α4 contoured at 1.0 s (blue) is shown with the final atomic model of KIF19A-ADP. (G) Crystal packing environment of the KIF19A-ADP crystal.
Figure 2—figure supplement 2
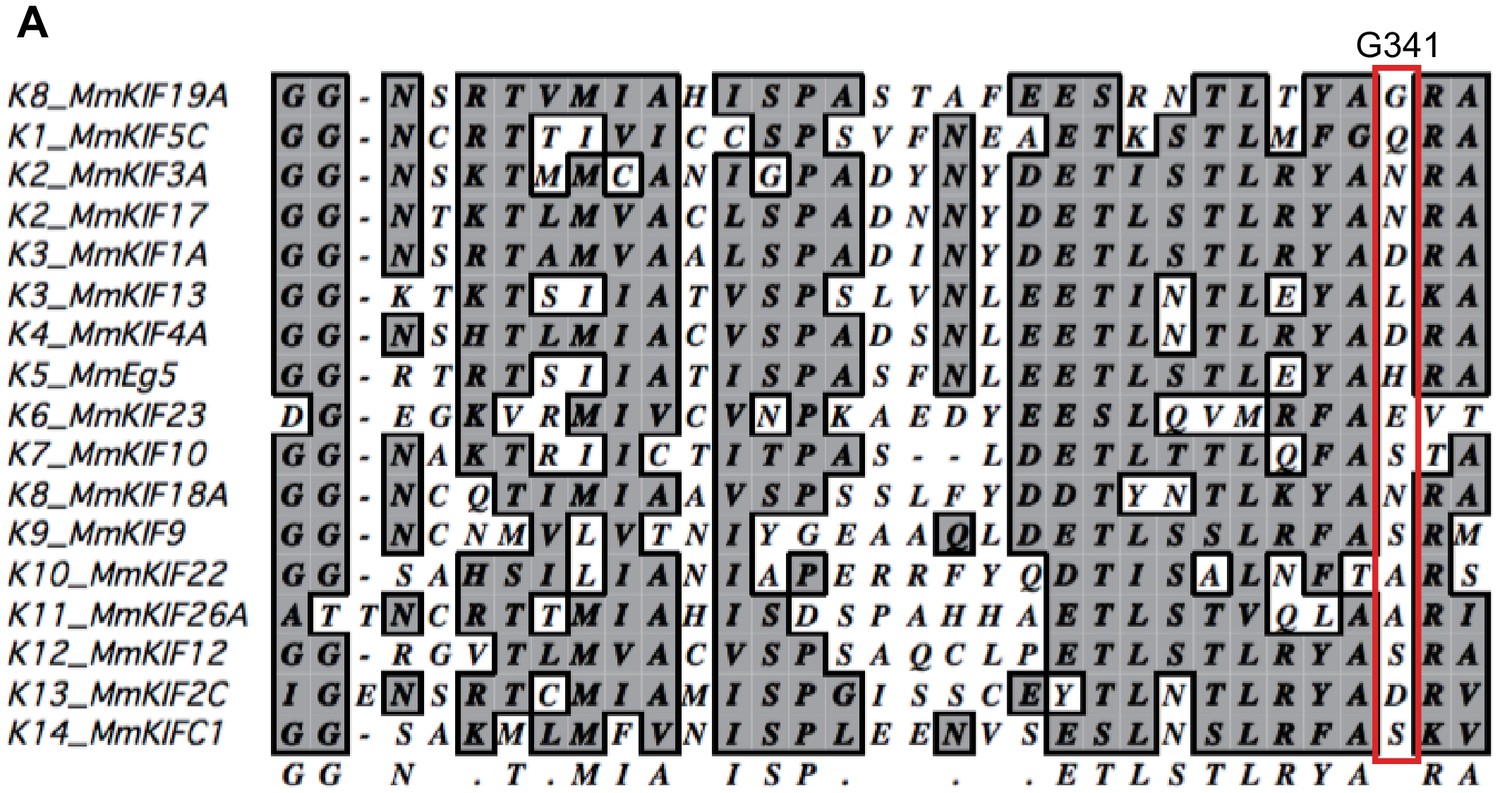
Sequence alignment between representative kinesin members.
(A) Sequence Alignment around β8-L14-α6 between representative kinesin members.
Figure 3
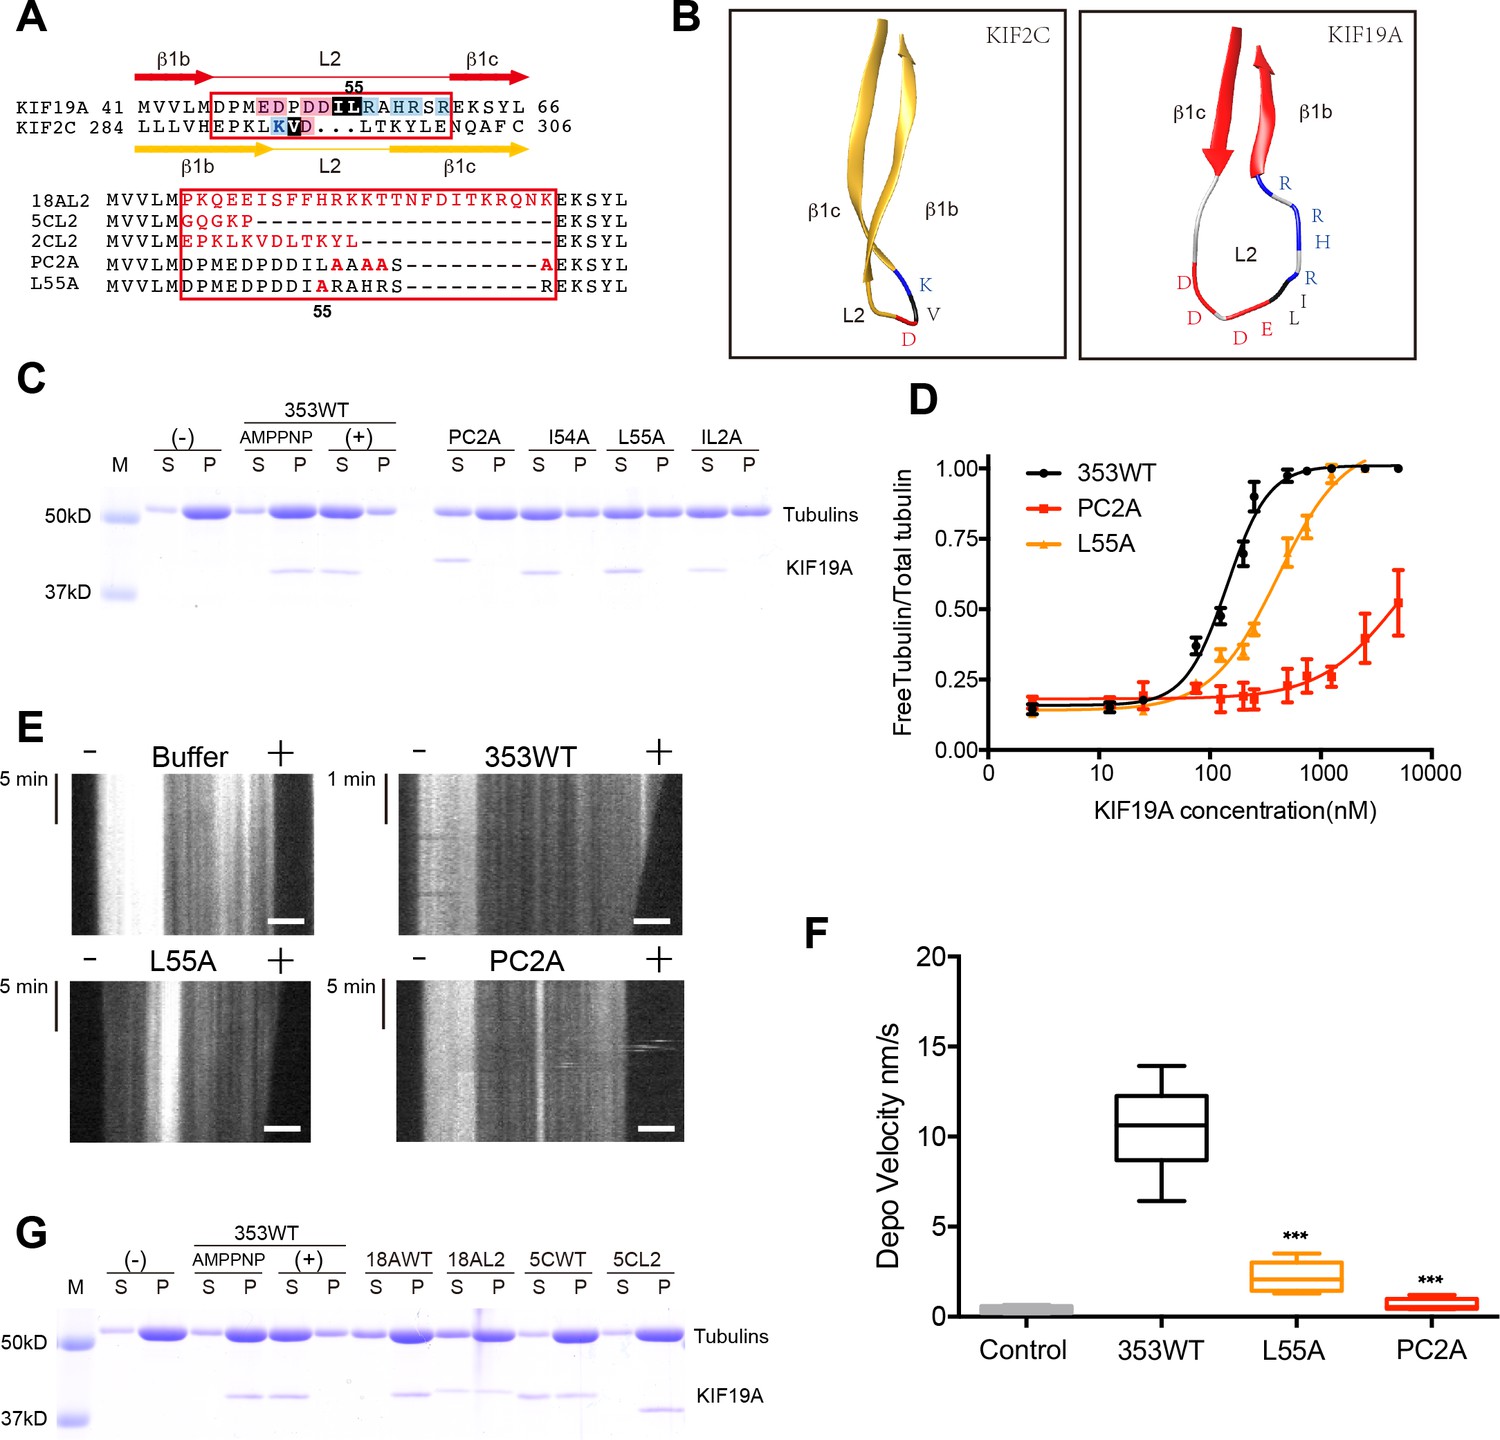
Basic and hydrophobic residues in L2 contribute to MT-depolymerizing activity.
(A) Top, sequence alignment of L2 between KIF19A and KIF2C. Bottom, the L2 swap mutation and other point mutation strategies are shown. (B) β1b-L2-β1c structure diagram of KIF2C (gold) and KIF19A (red). The acidic, hydrophobic and basic residues are colored red, black and blue, respectively. (C) 1.5 μM GMPCPP-stabilized MTs were co-sedimented with 250 nM 353WT or its L2 mutants in the presence of 5 mM ATP or AMP-PNP. 5 mM AMP-PNP was used as a control. (D) Dose-response MT depolymerization curve for different concentrations of 353WT and its L2 mutants in the presence of 5 mM ATP. Data are presented as the mean ± SD. The mean EC50 values of 353WT, PC2A and L55A were 142 ± 2 nM, 4936 ± 15 nM and 409 ± 4 nM, respectively. The data from three independent experiments were analysed. (E) Kymographs from MT depolymerization. Segment-marked microtubules incubated with 125 nM 353WT or its L2 mutants. Scale bars, 2 μM (horizontal) and time (vertical). (F) The depolymerization speeds of 353WT, L55A and PC2A were 10.9 ± 2.0 nm/s, 2.5 ± 0.5 nm/s, and 0.7 ± 0.2 nm/s, respectively. Each column represents the mean ± SEM (n = 45, 67, 58 and 51 MTs for buffer, 353WT, L55A and PC2A, respectively. Data were analysed using a two-tailed t-test, ***p<0.001, compared with 353WT). (G) 1.5 μM GMPCPP-stabilized MTs were co-sedimented with 250 nM 353WT, KIF18A, KIF5C, and the swap mutants, whose L2 loops were replaced by the counterpart of KIF19A. 5 mM AMP-PNP was used as a control. Representative data from three independent sample preparations are shown.
-
Figure 3—source data 1
The data and analysis for 353WT and L2 mutants.
Sheet F3D: The data and analysis of dose-response MT depolymerization curve for different concentrations of 353WT and L2 mutants.
- https://doi.org/10.7554/eLife.18101.010
Figure 4 with 2 supplements
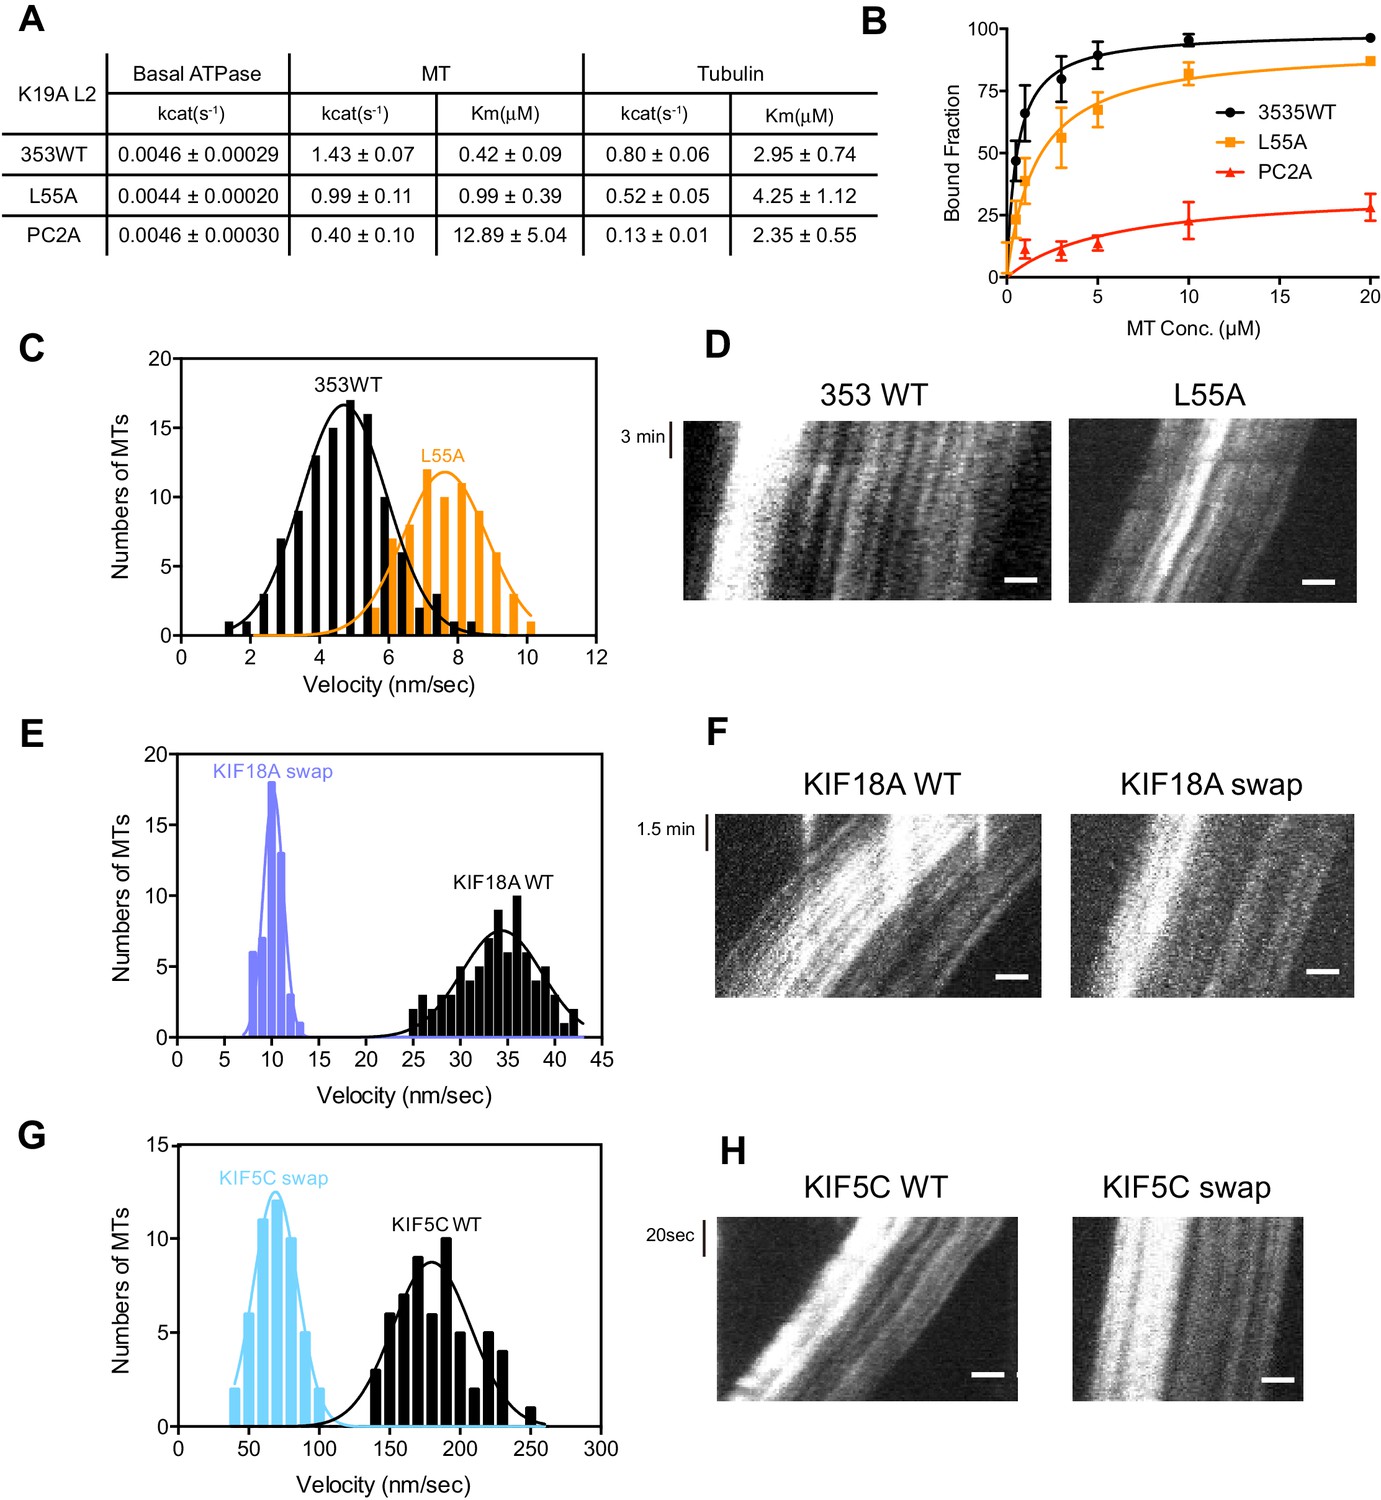
L2 also affects KIF19A kinetics and motility.
(A) Steady state ATPase kinetics of 100 nM 353WT and its L2 mutants. Data are presented as the mean ± SD (n = 3). (B) Graph of the bound fraction of 353WT and L2 mutants plotted against the concentration of MTs. Fitting the data to a one site binding model gave a dissociation constant (Kd). Data are presented as the mean ± SD (n = 3). (C) MT sliding speed on 353WT and the L55A mutant. Data are presented as the mean ± SEM (n = 69 MTs for L55A). (D, F, H) Kymographs show MTs gliding on L55A and other constructs as imaged by TIRF microscopy. Scale bars, 2 μM (horizontal) and time (vertical). (E, G) Introduction of KIF19A L2 into KIF18A (E) and KIF5C (G) to generate two swap mutants. MT sliding speed of the wild type and swap mutants. Data are presented as the mean ± SEM (n = 80 and 58 MTs for KIF18A WT and KIF18A swap, respectively, n = 60 and 48 MTs for KIF5C WT and KIF5C swap, respectively).
-
Figure 4—source data 1
The data and analysis for 353WT, L2 and swap mutants.
Sheet F4A_F4FS1: The data and analysis of ATPase activity of 353WT and L2 mutants. Sheet F4B: The data and analysis of MT binding assay of 353WT and L2 mutants. Sheet F4C: Motility Velocity of 353WT and L55A mutant. Sheet F4E: Motility Velocity of KIF8A WT and KIF18A swap. Sheet F4G Motility Velocity of KIF5C WT and KIF5C swap.
- https://doi.org/10.7554/eLife.18101.012
Figure 4—figure supplement 1
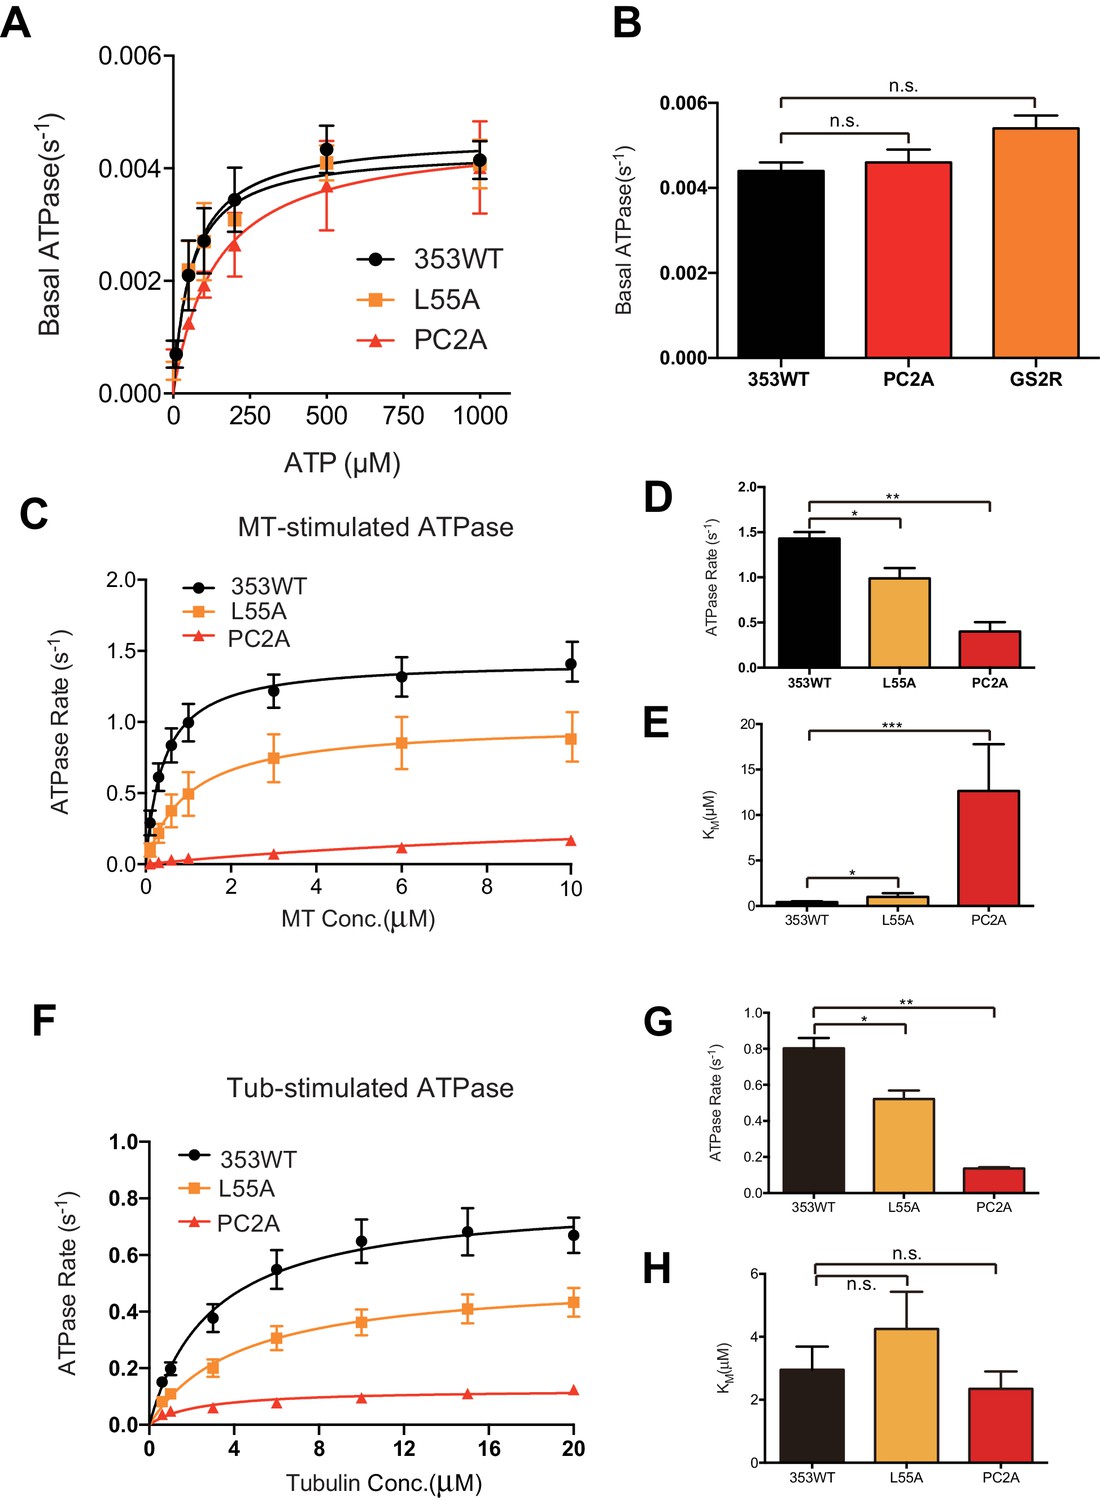
ATPase kinetics of 353WT and Its L2 mutants.
(A) The basal ATPase kinetics of 353WT and its L2 mutants. (B) The max basal ATPase rate of 353WT and L2 mutants. (C) Microtubule-stimulated ATPase activity of 353WT and its L2 mutants. (D) The max turnover rate(Vmax) of 353WT and its L2 mutants with MTs. (E) The Michaelis-Menten constant(KM) of 353WT and its L2 mutants with MTs. (F) Tubulin-stimulated ATPase activity of 353WT and its L2 mutants. (G) The max turnover rate(Vmax) of 353WT and its L2 mutants with tubulins. (H) The Michaelis-Menten constant(KM) of 353WT and its L2 mutants with tubulins. Data are presented as the mean ± SD (n = 3).
Figure 4—figure supplement 2
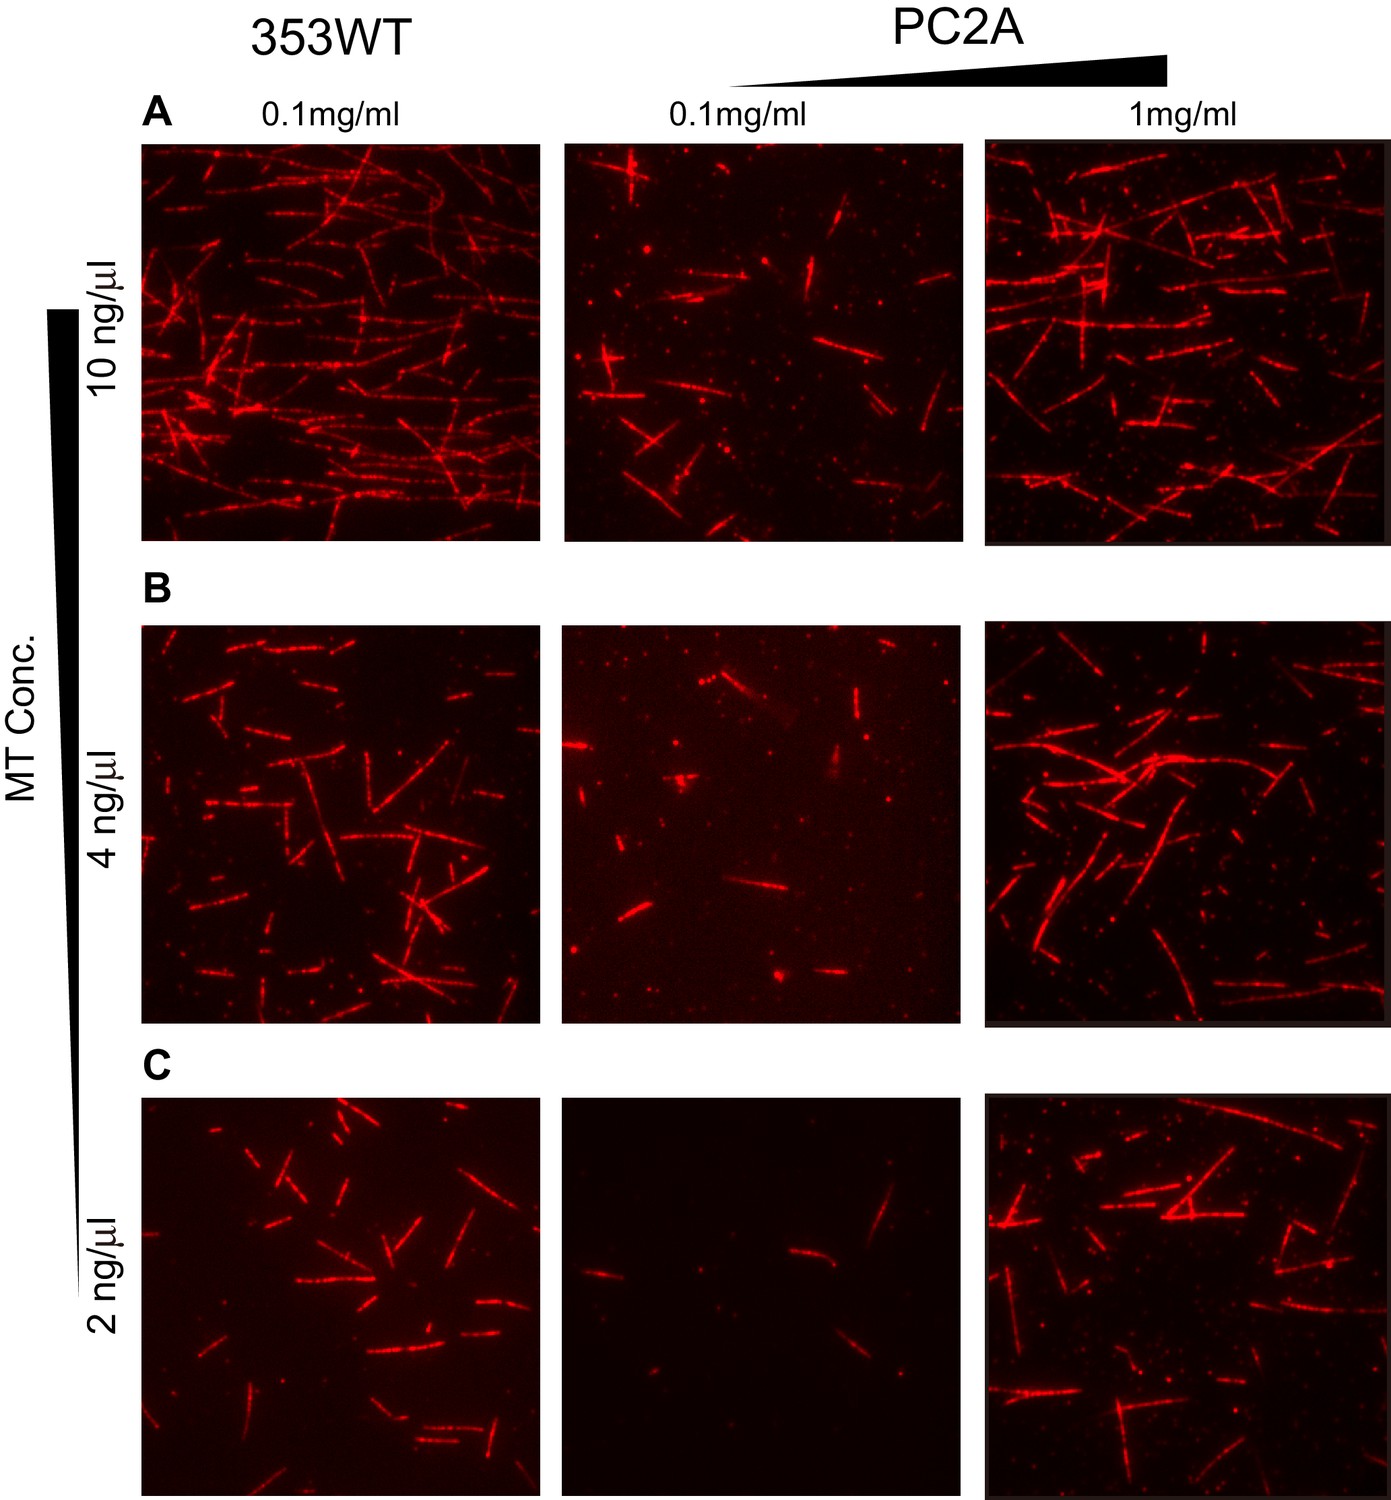
Binding affinity difference between 353WT and PC2A.
(A) Incubate 10 ng/μl MTs with 353WT and different concentrations of PC2A. (B) Incubate 4 ng/μl MTs with 353WT and different concentrations of PC2A. (C) Incubate 2 ng/μl MTs with 353WT and different concentrations of PC2A. Representative data from three independent sample preparations are shown.
Figure 5 with 1 supplement

Basic residues in L12 assist KIF19A to effectively depolymerize microtubules.
(A) Top, sequence alignment of KIF19A, KIF5C and KIF18A. Bottom, the L12 swap mutation and other point mutation strategies are shown. (B) L11-α4-L12-α5 structure of KIF18A (light blue) and KIF19A (red). KIF18A P306 and KIF19A N297 are shown as balls. (C, D) 1.5 μM GMPCPP-stabilized MTs were co-sedimented with 250 nM 353WT or its L12 swap mutants (C) and charged mutants (D) in the presence of 5 mM ATP or AMP-PNP. AMP-PNP (5 mM) was used as a control. (E) Dose-response MT depolymerization curve for different concentrations of 353WT and its L12 mutants in the presence of 5 mM ATP. Data are presented as the mean ± SD. The mean EC50 values of 353WT, GS2R and K2A were 142 ± 2 nM, 91 ± 2 nM and 678 ± 5 nM, respectively. The data from three independent experiments were analysed. (F) Kymographs from MTs depolymerization. Segment-marked MTs incubated with 125 nM 353WT or its L12 mutants. Scale bars, 2 μM (horizontal) and time (vertical). (G) The depolymerization speeds of 353WT, GS2R and K2A were 10.9 ± 2.0 nm/s, 30.0 ± 4.9 nm/s, and 2.0 ± 0.5 nm/s, respectively. Each column represents the mean ± SEM (n = 45, 67, 52 and 47 MTs for buffer, 353WT, GS2R, and K2A, respectively). Data were analyzed using the two-tailed t-test, ***p<0.001, compared with 353WT). (H) Steady state ATPase kinetics of 100 nM 353WT and its L12 mutants. Data are presented as the mean ± SD (n = 3). (I) Graph of the bound fraction of 353WT and L12 mutants plotted against MT concentration. Data are presented as the mean ± SD (n = 3). (J) MTs polymerized by tubulin and tubulin S were co-sedimented with different concentrations of KIF19A in the presence of 1 mM AMP-PNP. Representative data from three independent sample preparations are shown.
-
Figure 5—source data 1
The data and analysis for 353WT and L12 mutants.
Sheet F5E: The data and analysis of dose-response MT depolymerization curve for different concentrations of 353WT and L12 mutants. Sheet F5H_F5FS1: The data and analysis of ATPase activity of 353WT and L12 mutants. Sheet F5I: The data and analysis of MT binding assay of 353WT and L12 mutants.
- https://doi.org/10.7554/eLife.18101.016
Figure 5—figure supplement 1
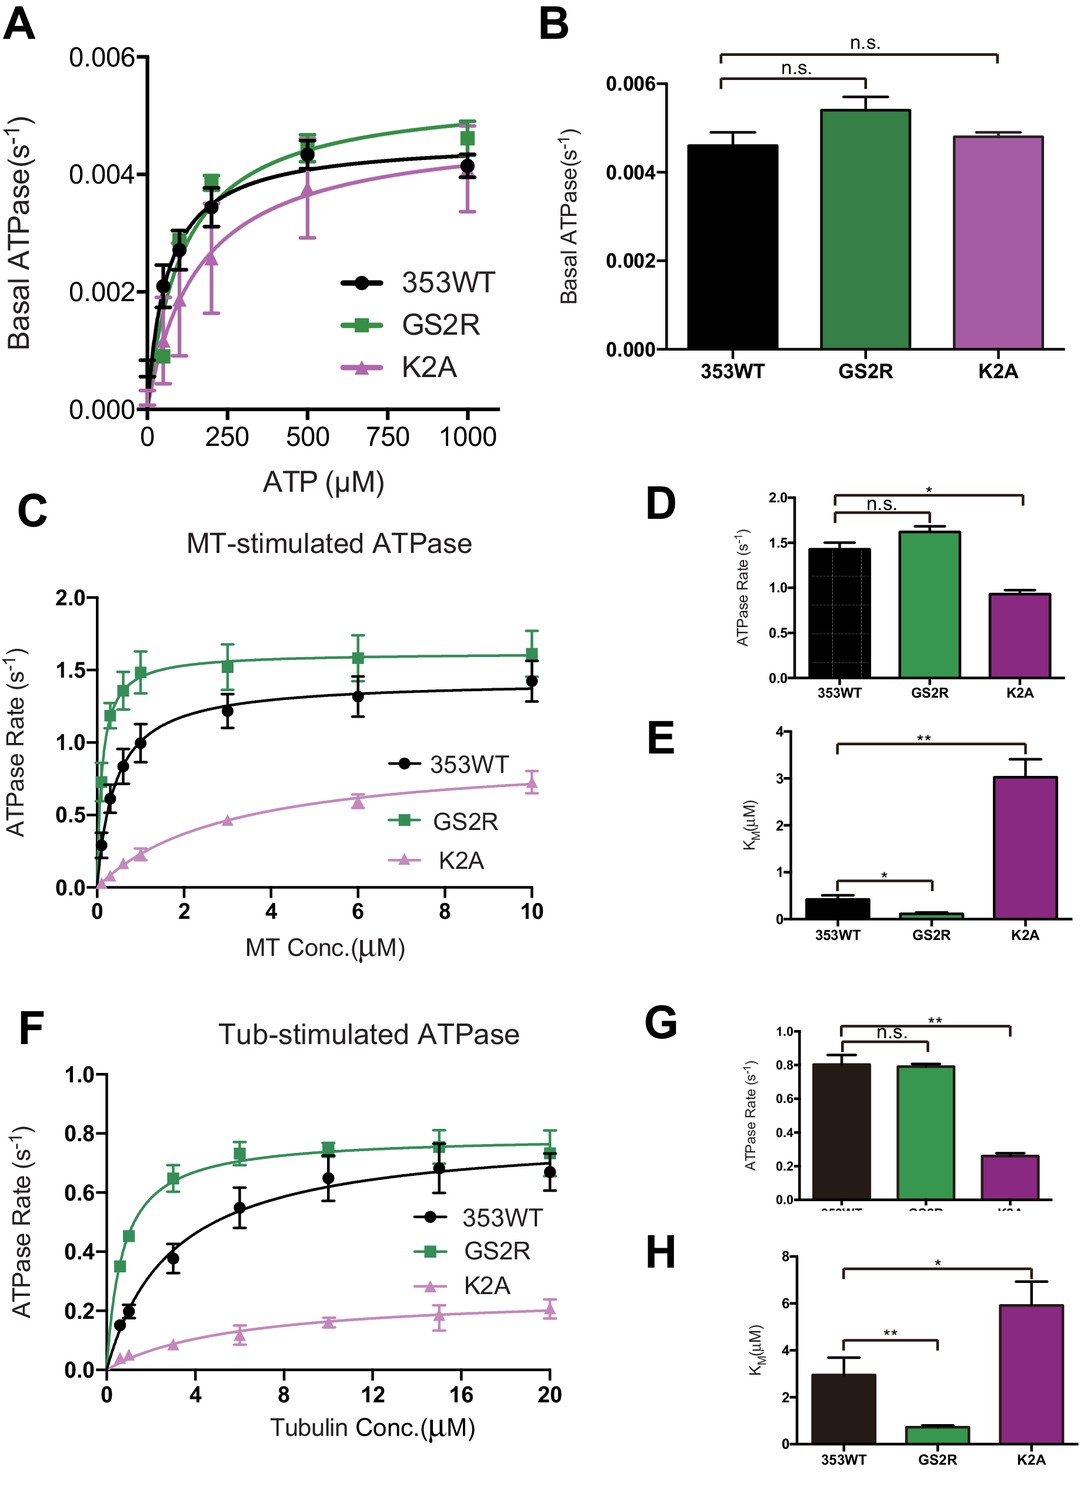
Steady state ATPase kinetics of 353WT and Its L12 mutants.
(A) The basal ATPase kinetics of 353WT and its L12 mutants. (B) The max basal ATPase rate of 353WT and L12 mutants. (C) Microtubule-stimulated ATPase activity of 353WT and its L12 mutants. (D) The max turnover rate(Vmax) of 353WT and its L12 mutants with MTs. (E) The Michaelis-Menten constant(KM) of 353WT and its L12 mutants with MTs. (F) Tubulin-stimulated ATPase activity of 353WT and its L12 mutants. (G) The max turnover rate(Vmax) of 353WT and its L12 mutants with tubulins. (H) The Michaelis-Menten constant(KM) of 353WT and its L12 mutants with tubulins. Data are presented as the mean ± SD (n = 3).
Figure 6 with 2 supplements
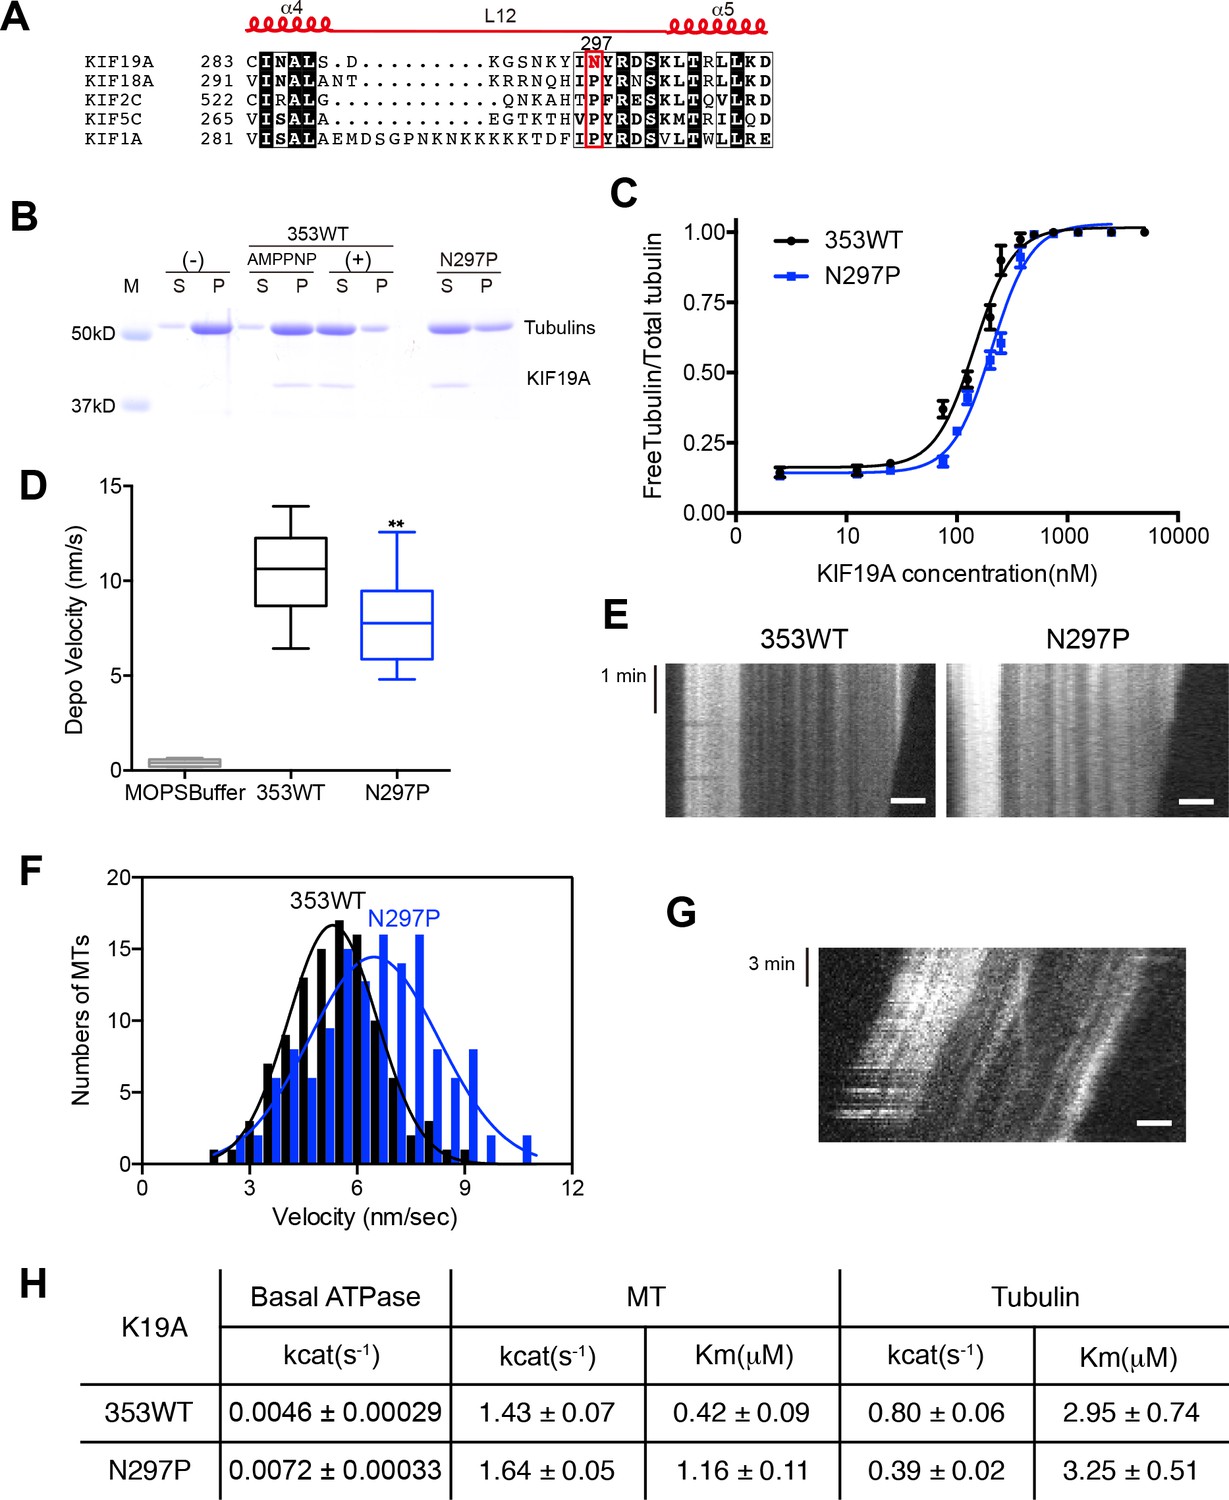
Contribution of KIF19A-Specific Asn297.
(A) Sequence alignment of KIF19A and other typical kinesins for the α4-L12-α5 region. For more kinesin member sequence alignments see Figure 6—figure supplement 1A. (B) 1.5 μM GMPCPP-stabilized MTs were co-sedimented with 250 nM 353WT or N297P mutant in the presence of 5 mM ATP or AMP-PNP. Representative data from three independent sample preparations are shown. AMP-PNP was used as a control. (C) Dose-response MT depolymerization curve for different concentrations of 353WT and N297P in the presence of 5 mM ATP. Data are presented as the mean ± SD. The mean EC50 values of 353WT, N297 were 142 ± 2 nM and 201 ± 2 nM, respectively. The data from three independent experiments were analyzed. (D) The depolymerization speeds of 353WT and N297 were 10.9 ± 2.0 nm/s and 7.7 ± 1.3 nm/s, respectively. Each column represents the mean ± SEM (n = 67 and 29 MTs for 353WT and N297P, respectively). Data were analyzed using the two-tailed t-test, **p<0.01, compared with 353WT). (E) Kymographs of MT depolymerization. Segment-marked MTs incubated with 125 nM 353WT or N297P mutant. Scale bars, 2 μM (horizontal) and 1 min (vertical). (F) MT gliding assays of KIF19A-353WT and N297P on taxol-stabilized MTs. Data are presented as the mean ± SEM, (n = 113 MTs for N297P). (G) Kymograph showing movement of N297P long MTs as imaged by TIRF microscopy. Scale bars, 2 μM (horizontal) and 3 min (vertical). (H) Steady state ATPase kinetics of 100 nM 353WT and N297P. Data are presented as the mean ± SD, (n = 3).
-
Figure 6—source data 1
The data and analysis for 353WT and N297P mutant.
Sheet F6C The data and analysis of dose-response MT depolymerization curve for different concentrations of 353WT and N297P mutant. Sheet F6F: Motility Velocity of 353WT and N297P mutant. Sheet F6H_F6FS2: The data and analysis of ATPase activity of 353WT and N297P mutant.
- https://doi.org/10.7554/eLife.18101.019
Figure 6—figure supplement 1
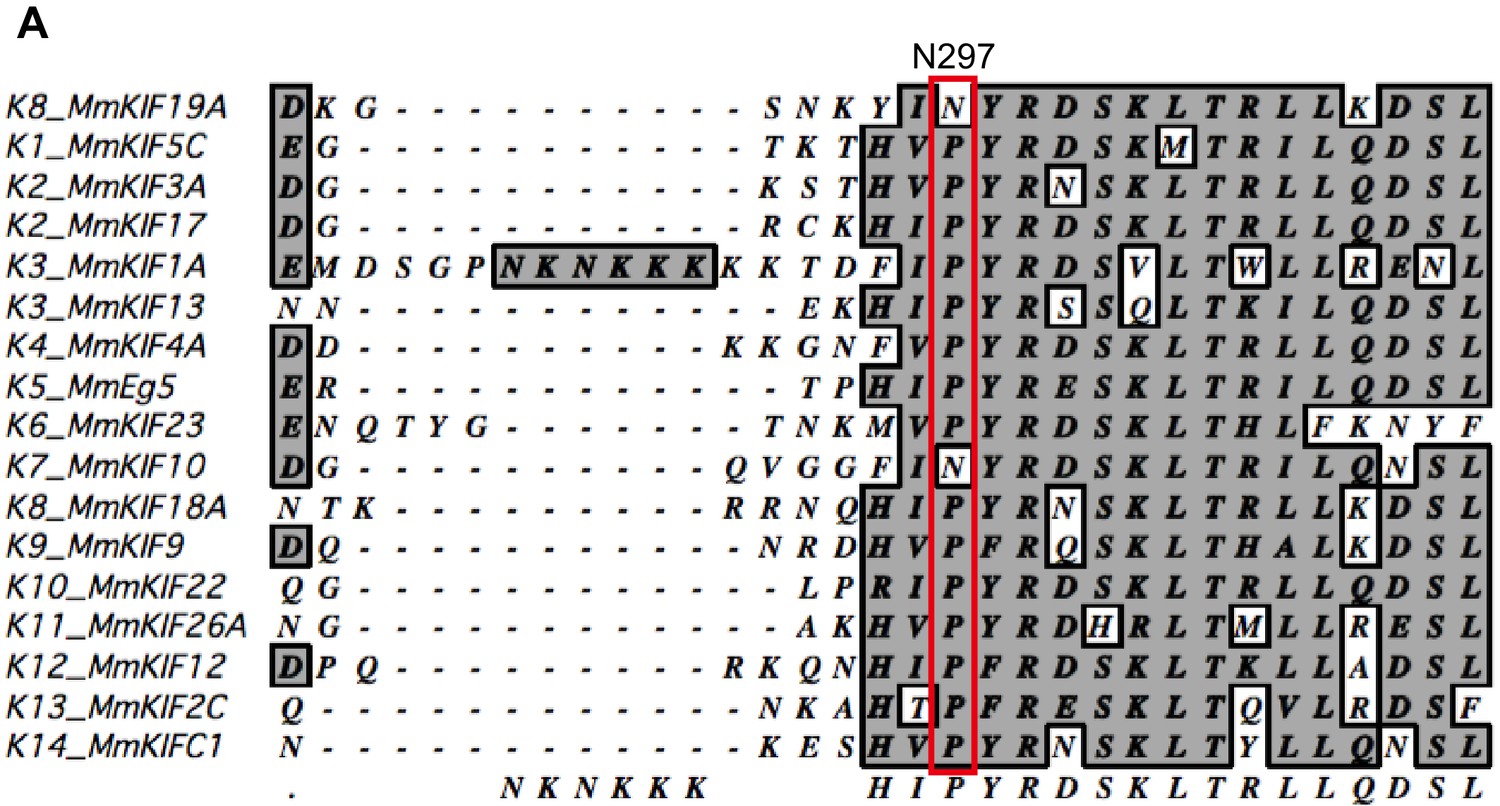
Sequence alignment between representative kinesin members.
(A) Sequence Alignment around L12-α5 between representative kinesin members.
Figure 6—figure supplement 2
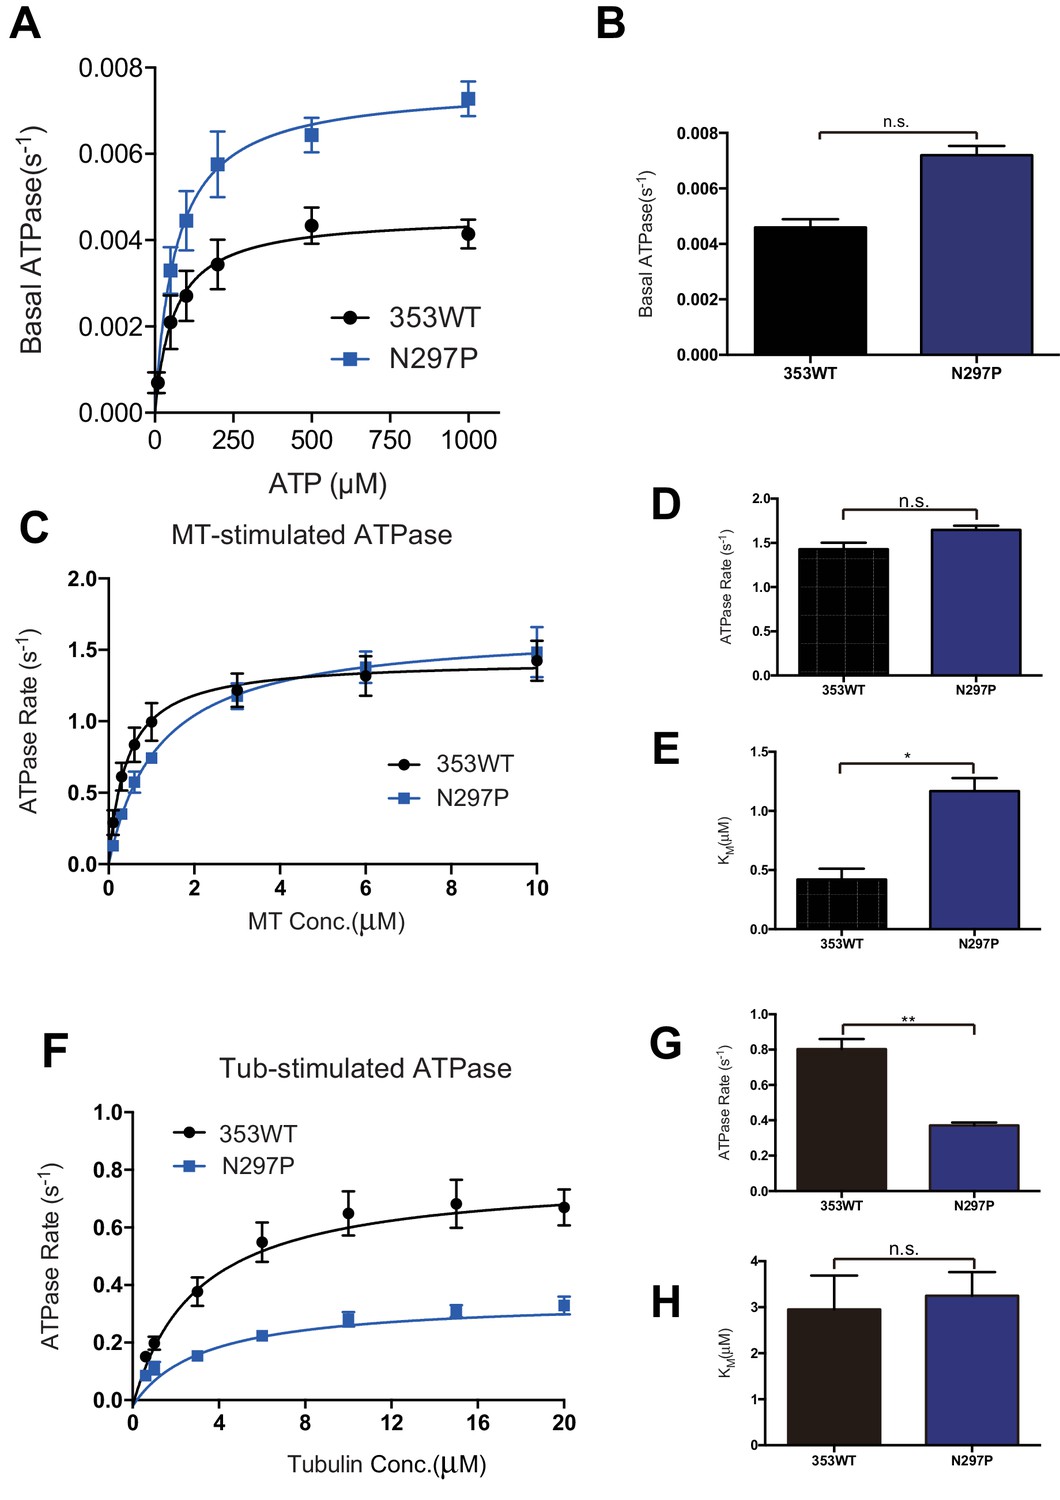
Steady state ATPase kinetics of 353WT and N297P mutant.
(A) The Basal ATPase kinetics of 353WT and N297P mutant. (B) The Basal ATPase rate of 353WT and N297P mutant. (C) Microtubule-stimulated ATPase activity of 353WT and N297P mutant. (D) The max turnover rate(Vmax) of 353WT and N297P mutant with MTs. (E) The Michaelis-Menten constant(KM) of 353WT and N297P mutant with MTs. (F) Tubulin-stimulated ATPase activity of 353WT and N297P mutant. (G) The max turnover rate(Vmax) of 353WT and N297P mutant with tubulins. (H) The Michaelis-Menten constant(KM) of 353WT and N297P mutant with tubulins. Data are presented as the mean ± SD (n = 3).
Figure 7 with 1 supplement
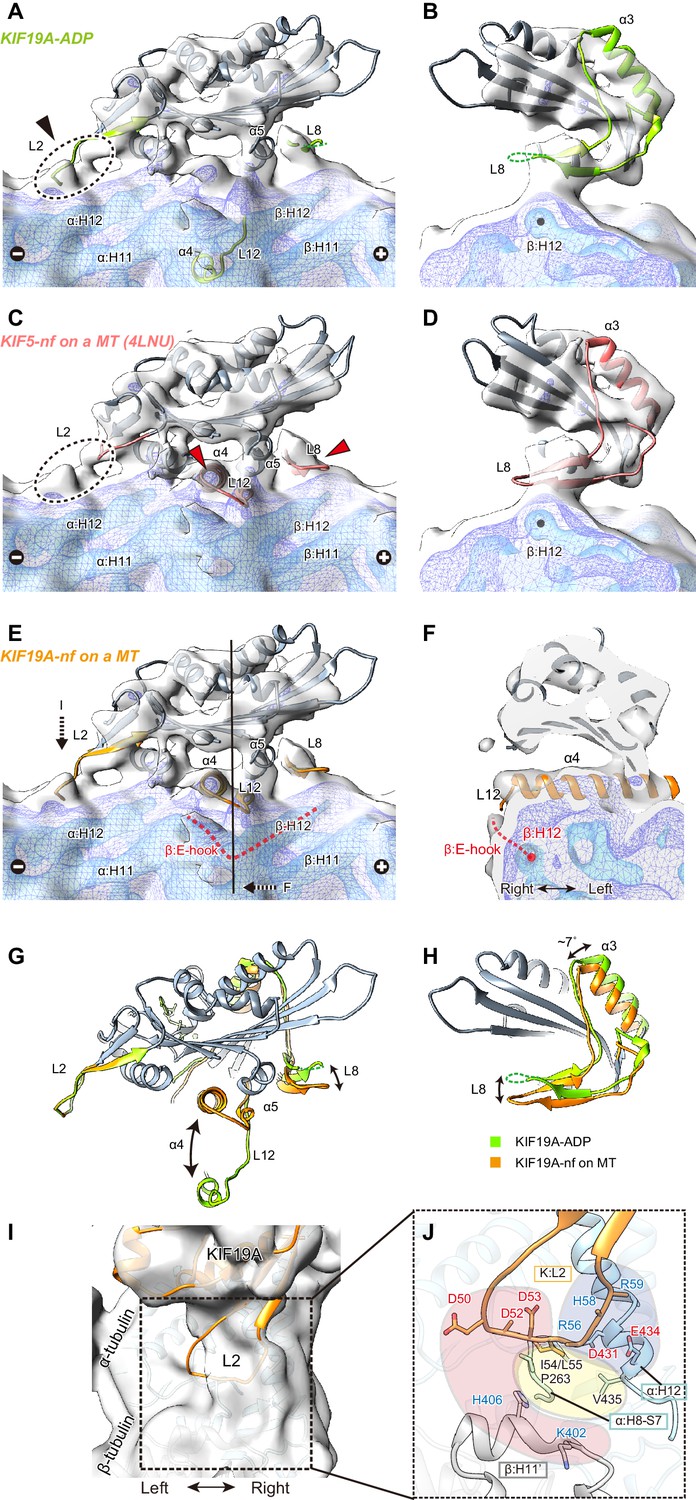
Cryo-EM reconstruction of KIF19A on a straight MT.
(A–D) Cryo-EM reconstruction of KIF19A-nucleotide-free complexed with GDP-taxol-MT with three different contour levels (grey, blue, cyan), and atomic models of KIF19A-ADP solved in this study (green) (A and B) and KIF5-nucleotide-free (red, PDB: 4LNU) (C and D), seen from the right side (A and C) and the plus-end side (B and D). Black arrow and dashed circles indicate the elongated L2. Red arrows show the α4-L12 and L8 fitted in the corresponding densities. (E) Atomic model of KIF19A-nucleotide-free on GDP-taxol-MT (orange) was created and rigidly fitted onto the cryo-EM map. The density of the helix H12 and the following E-hook of β-tubulin can be observed (red dashed line), while the E-hook of α-tubulin is not clear. (F) Conformation of the switch II (α4–L12) and the E-hook of β-tubulin (red dashed line). Atomic model of α4 fits perfectly in the density. (G and H) Comparison of the KIF19A-ADP (green) and KIF19A-nucleotide-free models on MT (orange), viewed as in A and B. (I) L2 density was clearly observed at the inter-tubulin dimer interface. (J) Zoom-in view around L2. The acidic residues in L2 potentially interact with the basic residues in β-tubulin H11’ (red region). The basic residues in L2 interact with the acidic residues in α-tubulin H12 (blue region). Between these electrostatic clusters, the hydrophobic residues of L2 in KIF19A and H12 and H8-S7 loops in α-tubulin constitute the hydrophobic core (yellow region).
Figure 7—figure supplement 1
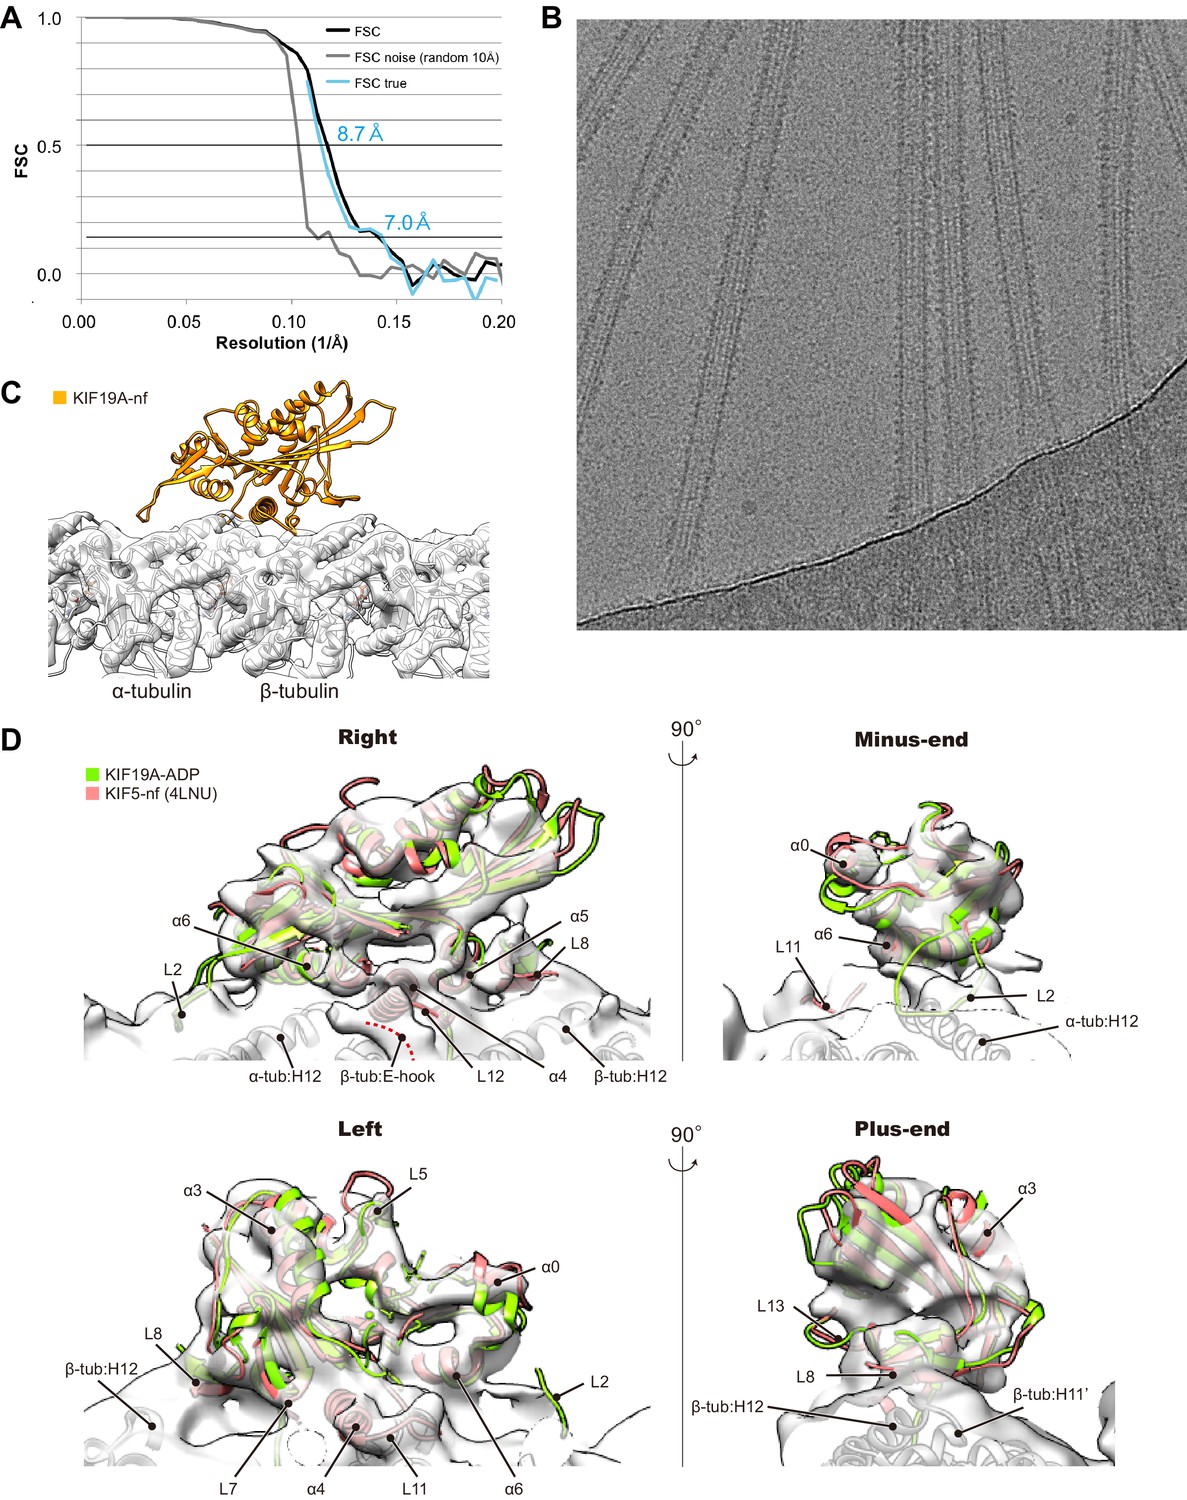
Cryo-EM reconstruction of KIF19A-MT complex.
(A) FSC curves for standard FSC (black), FSC noise (high resolution noise substitution cutoff 10 Å, gray, Chen et al., 2013) and FSC true (cyan). The resolutions of FSC true according to the 0.143 and 0.5 criteria were estimated as 7.0 Å and 8.7 Å. To achieve the resolution, 471,380 particles were calculated in total. (B) Example micrograph of nucleotide-free KIF19A complexed with GDP-taxol MT. (C) Cryo-EM reconstruction of a KIF19A-decorated GDP-taxol-MT. The occupancy of KIF19A was lower than that of the MT so that only the density for the MT can be visualized at the threshold-level 6.5. (D) Cryo-EM map at the threshold-level 2.7. The secondary structural elements of KIF19A as well as the loops interacting between MT and KIF19A are visualized.
Figure 8
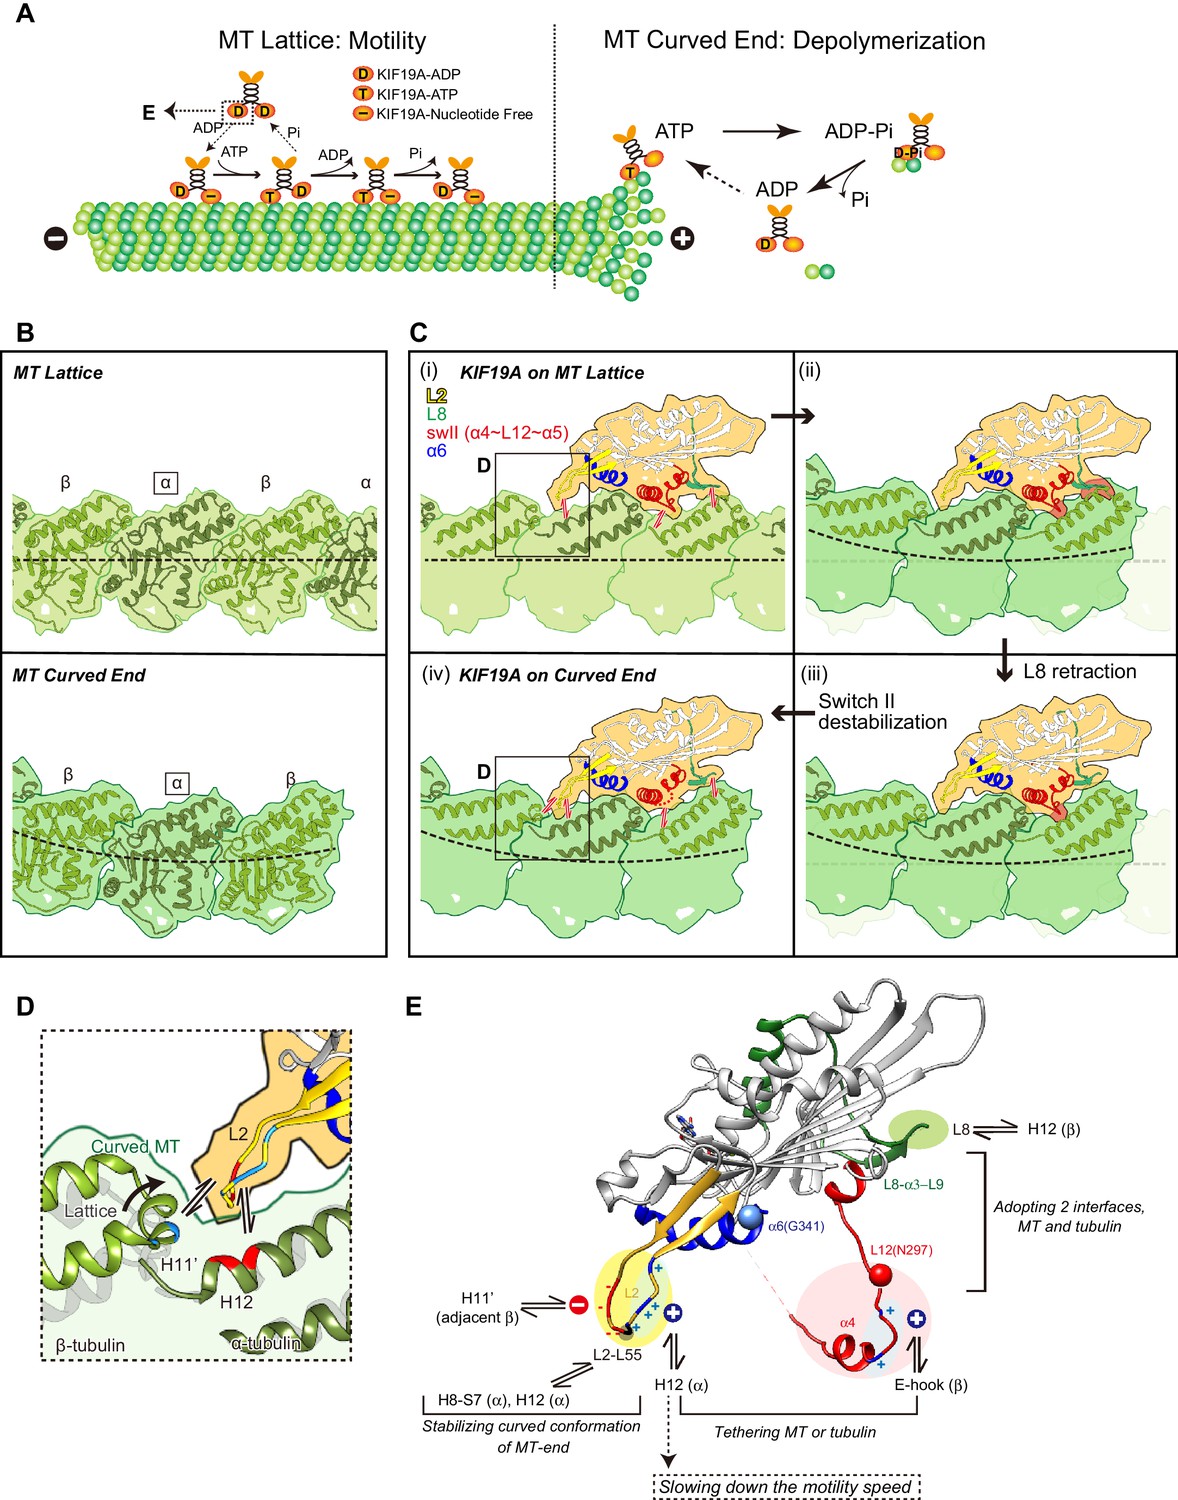
Model of KIF19A motor domain function.
(A) Schematic diagram of the dual functions of KIF19A. (B) Simulated 7 Å maps of straight and curved MTs created from the atomic models of 1JFF and 3RYC, respectively. The two structures were aligned at the position of the marked α-tubulins. (C) Simulated 7 Å maps and atomic models of KIF19A on straight and curved MTs showing the adaptation of KIF19A-MT interfaces. Collisions between KIF19A and β-tubulin in (ii) and (iii) are highlighted in red. (D) Zoom-in view around the KIF19A L2 and curved tubulin-dimer interface (green). Atomic model of a straight MT (grey) is superimposed to compare the distance from L2 to β-tubulin H11’. (E) Functional anatomy for the dual function of KIF19A.
Videos
Video 1
Polarity-marked microtubules sliding on 353WT.
353WT was fixed on the coverslip. The strongly-labeled MT minus-ends lead the MT gliding, indicating that KIF19A motor proteins move toward the plus end. 10 seconds intervals, total tracking time 15 minutes.
Additional files
-
Supplementary file 1
Crystal structure statistics for KIF19A motor domain 353WT.
Data collection and refinement statistic table.
- https://doi.org/10.7554/eLife.18101.025
Download links
A two-part list of links to download the article, or parts of the article, in various formats.
Downloads (link to download the article as PDF)
Open citations (links to open the citations from this article in various online reference manager services)
Cite this article (links to download the citations from this article in formats compatible with various reference manager tools)
Motility and microtubule depolymerization mechanisms of the Kinesin-8 motor, KIF19A
eLife 5:e18101.
https://doi.org/10.7554/eLife.18101


