The isolated voltage sensing domain of the Shaker potassium channel forms a voltage-gated cation channel
- Université de Montréal, Canada
Figures
Figure 1

Expression of Shaker-iVSD lacking pore domains is sufficient to reconstitute voltage-dependent channel activity.
(a) Top: topology of Shaker K+ channel. Amino acid positions relevant to the present study are highlighted in yellow. Middle: Shaker channels constructs (Shaker-W434F and Shaker-iVSD) used in the present study. Thiol-reactive fluorophores are attached to a cysteine at position A359C in the S3–S4 linker. The mutation W434F in the pore region produces an instantly C-type inactivated Shaker channel. Shaker-iVSD is a deletion mutant truncated after the S4 helix. Bottom: Sequence of the C-terminus of Shaker-iVSD (b) Gating currents recorded from oocytes expressing Shaker-iVSD (top) and Shaker-W434F (bottom) using cut-open oocyte voltage clamp. Leak, background, and capacitive currents were subtracted from the current traces using a P/4 protocol. Inset shows the current step protocol. Gating currents were elicited by test pulses from −100 mV to +120 mV at a holding potential of −90 mV. Zero level was indicated by the red dashed line. (c and d) Representative ionic currents recorded by cut-open oocyte voltage-clamp from oocytes expressing Shaker-iVSD and Shaker-W434F. At depolarized (0 mV, top) or hyperpolarized (−90 mV, bottom) holding potentials, currents were elicited by voltage pluses at a range between −180 and +140 mV in 10 mV increments without leak substraction. The interval between test pulses was 5 s to allow complete recovery of the channels. An inset on top of current traces shows the corresponding voltage protocols. Zero level was indicated by the red dashed line. NMDG+-based solutions were used as the external and internal solutions, pHin/pHout 7.35/7.35. (e) Representative ionic currents recorded from HEK293 cells expressing Shaker-iVSD using the whole-cell configuration of the patch-clamp technique. Cells were depolarized for 500 ms to potentials ranging from –140 mV to +100 mV (at a holding potential of 0 mV, top), or from −140 mV to +80 mV (at a holding potential of −90 mV, bottom) in 10 mV increments. An inset on top of current traces shows the corresponding voltage protocols. Zero level was indicated by the red dashed line. To compare with the ionic current recorded from oocytes as shown in c, NMDG+-based solutions were also used as the extracellular and intracellular solutions, pHin/pHout 7.35/7.35. (f) I-V relations of currents recorded from Shaker-iVSD-injected oocytes at holding potentials of 0 mV (black triangle, n = 14) or −90 mV (red triangle, n = 13), and H2O-injected oocytes at holding potentials of 0 mV (blue triangle, n = 5) using the cut-open oocyte voltage clamp technique (see protocol in the upper inset of c). The mean steady-state currents during the last 50 ms of the command pulses were plotted versus voltage. (g) I-V relations of ionic currents recorded from HEK293 cells transfected with Shaker-iVSD at holding potentials of 0 mV (black triangle, n = 8) or −90 mV (red triangle, n = 4) using the whole-cell patch clamp technique (see protocol in the upper inset of e). The mean steady-state currents during the last 50 ms of the command pulses were plotted versus voltage.
Figure 2

Selectivity of Shaker-iVSD-induced current in high buffer (HB) solutions or NMDG+-based solutions.
(a)Top. Normalized IV relationships of Shaker-iVSD induced currents under different external pH conditions with HB solutions. Tail currents were evoked by 250 ms voltage pulses ranging from −180 to +120 mV following a 200 ms hyperpolarization prepulse to −120 mV using cut-open oocyte technique (see inset for protocol). External HB solution contained (in mM) 70 NMDG+, and either 180 acetic acid (for pH 4.5), 180 HEPES (for pH 7.5), or 136 CHES with 44 D-sorbitol (for pH 9.5). The composition of the HB internal solution was the same as the HB internal solution at pH 7.5. Bottom. Same normalized IV relationships, but zoomed in to emphasize the changes of Vrev. At pHin/pHout 7.5/7.5, Vrev = −0.14 ± 0.18 mV (black triangle, n = 56); at pHin/pHout 7.5/4.5, Vrev = 12.5.2 ± 1.6 mV (blue triangle, n = 5); at pHin/pHout 7.5/9.5, Vrev = −5.4 ± 1.76 mV (red triangle, n = 5). (b) Top. Normalized IV relations of currents with NMDG+in/NMDG+out 115 mM/10 mM or 115 mM/115 mM, at pHin/pHout 7.35/7.35. NMDG+-based external and internal solutions contained 115 mM NMDG-MeSO3 were the same as in Figure 1b–d. To test the permeability of Shaker-iVSD-induced currents to NMDG+ ions, 115 mM NMDG-MeSO3 in the external solution was replaced by 10 mM NMDG-MeSO3 and 210 mM D-sorbitol, at pH 7.35. Currents were elicited by the voltage pulse protocol shown in the inset. Bottom. Same normalized IV relationships, but zoomed in to emphasize the changes of Vrev. At NMDG+in/NMDG+out 115 mM/10 mM, Vrev = −62.6 ± 2.5 nmV (red triangle, n = 4); at NMDG+in/NMDG+out 115 mM/115 mM, Vrev = −0.8 ± 1.1 (black triangle, n = 4). (c) Top. Normalized IV relationships of currents recorded from HEK293 cells transfected with Shaker-iVSD cDNA with HB solutions. Tail currents were elicited from a holding potential of 0 mV by 250 ms voltage pulses ranging from –140 to +100 mV in 10 mV increments, following a 200 ms hyperpolarization prepulse to −120 mV using whole-cell patch clamp technique (see inset for protocol). The intracellular and extracellular HB solutions contained (in mM) 10 NMDG+, and either 24 HEPES (for PH 7.5), 56 MES (for pH5.5), or 35 acetic acid (for pH4.5). Osmolarity was adjusted to 300~320 mOsm by D-sorbitol. Bottom. Same normalized IV relationships, but zoomed in to emphasize the changes of Vrev. Vrev values were 0.5 ± 0.2 mV at pHin/pHout 7.5/7.5 (black triangle, n = 9), −7.0 ± 1.1 mV at pHin/pHout 5.5/7.5 (red triangle, n = 6), and −34.9 ± 1.8 mV at pHin/pHout 4.5/7.5 (blue triangle, n = 10). (d–e) Comparison of conductance of Shaker-iVSD for external NMDG+ (black triangles, n = 12), K+ (f, red triangles, n = 7) and Na+ (g, blue triangles, n = 7) using cut-open oocyte technique. The NMDG+-based external solution and internal solutions were the same as in Figure 1b–d at pHin/pHout 7.35/7.35. Na+-based or K+-based external solutions were the same as the NMDG+-based external solution except that 115 mM NMDG- MeSO3 was replaced by the same concentration of NaOH- MeSO3 or KOH- MeSO3. Currents were elicited by the voltage pulse protocol shown in the inset of Figure 1c, and currents were normalized relative to the maximum NMDG+ inward currents and plotted versus voltage. (f) Replacing MeSO3 with chloride (green triangle, n = 7) in the external NMDG+-based solution did not exhibit significantly difference from the currents recorded in external NMDG-MeSO3 solution, indicating that it is likely not carried by anions.
Figure 3 with 1 supplement
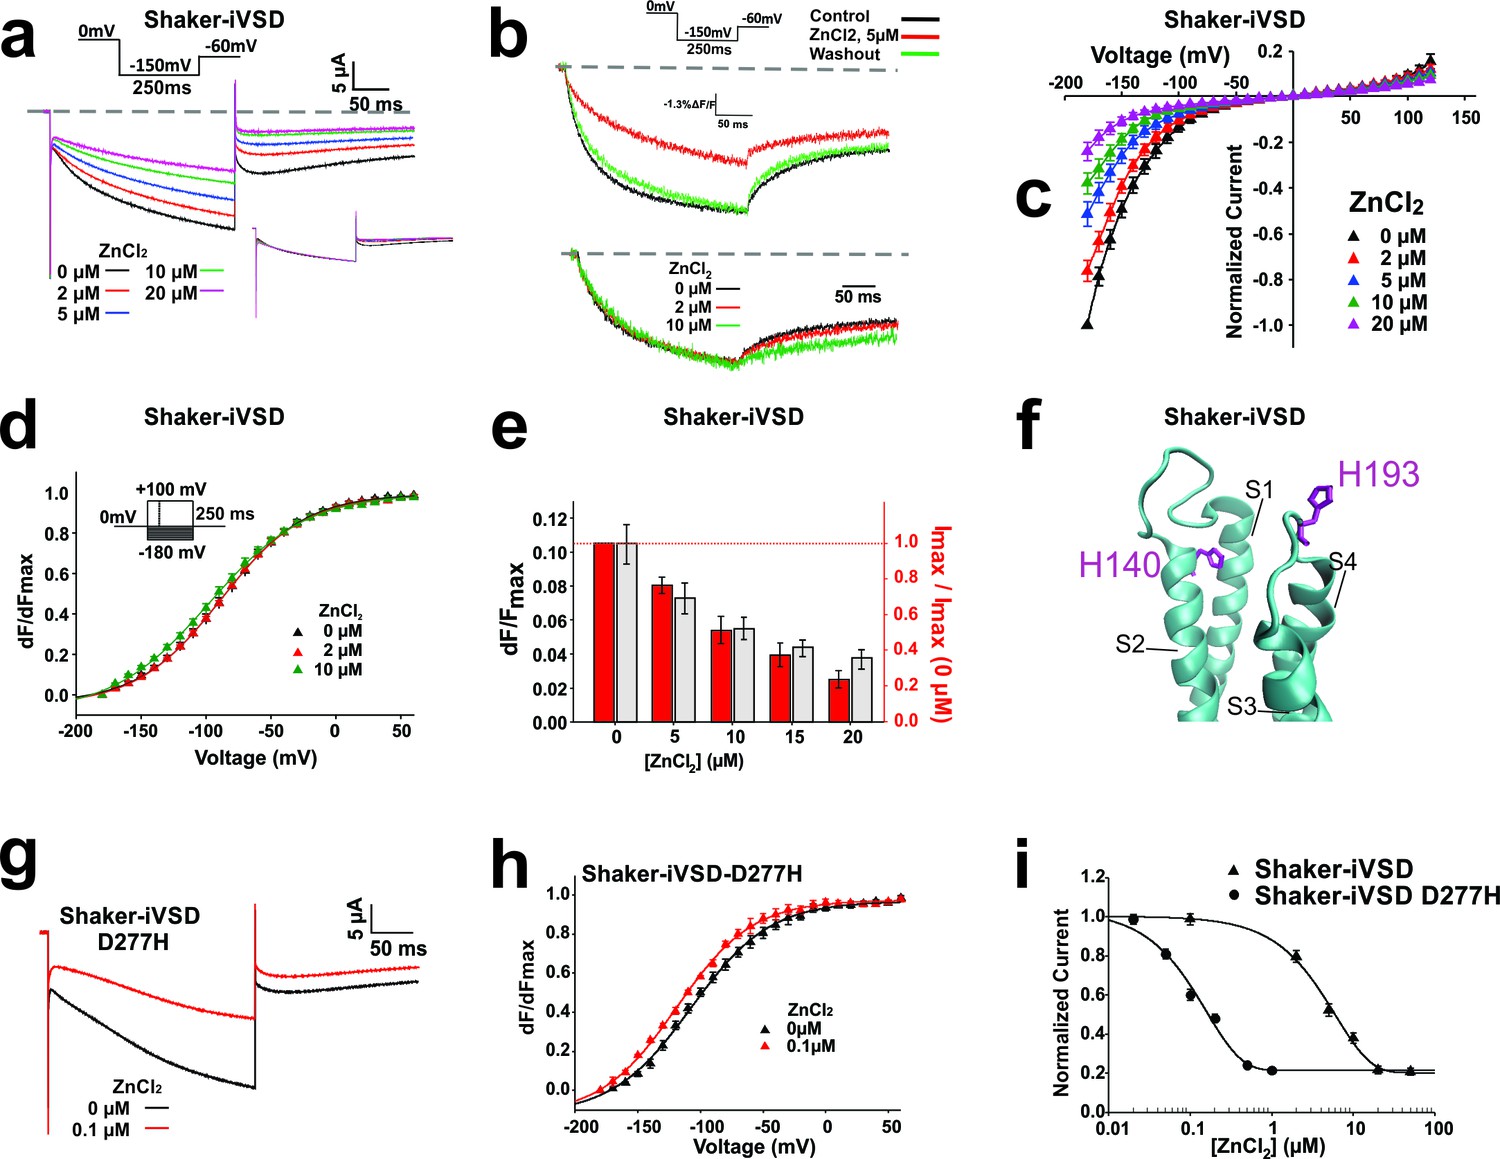
Inhibition of Shaker-iVSD-induced ionic currents by external ZnCl2.
(a) Ionic currents and normalized fluorescence traces recorded from oocytes expressing Shaker-iVSD before and after the application of 2~20 µM ZnCl2 using cut-open technique (see inset for protocol). Zero level is indicated by the grey dashed line. To illustrate the effects of ZnCl2 on kinetics, the same ionic currents were normalized to the value at the end of the 250 ms pulse (see lower inset). (b) Fluorescence traces to the recordings in a obtained from fluorescent labeling at position A359C atop S4. (c) IV-relations of Shaker-iVSD at increasing concentrations of ZnCl2. (for protocol see a). Currents were normalized to the maximal current amplitude in the absence of Zn2+. (d) Normalized FV relations in the absence (black) and presence of external 2 μM (red) or 10 μM (green) ZnCl2. Fluorescence curves were generated using the protocol shown as inset. Smooth curves are fits to a Boltzmann function yielding the following V1/2 and dV values: −88.2 ± 1.2 and 32.2 ± 1.7 mV for Shaker-iVSD control (n = 6); −89.6 ± 2.3 mV and 32.8 ± 2.6 mV for 2 μM ZnCl2(n = 6); −98.4 ± 2.9 mV and 37.5 ± 2.0 mV for 10 μM ZnCl2(n = 6). Each curve was normalized to its own maximal relative change dF/F. (e) Effect of Zn2+ on relative fluorescence change (dF/F, grey) and ionic current. The relative fluorescence change remains constant even during bleaching (Blunck et al., 2004), assuming not too high background fluorescence. A reduction of the relative fluorescence change is thus correlated with immobilization of the voltage sensors. The current values are the maximal current amplitudes of c normalized to the value in the absence of Zn2+. (f) Position of H140 (S2) and H193 (S3-S4 linker; numbering according to human Hv1) in the crystal structure of Hv1 (PDB: 3WKV) in the entry to the gating pore. Missing residues in the crystal structure were modeled using Modeller (Sali and Blundell, 1993). (g) Ionic current traces recorded from oocytes expressing Shaker-iVSD D277H in the absence (black) and presence (red) 0.1 µM ZnCl2 using cut-open technique (see inset in a for protocol). (h) Normalized FV relations in the absence (black triangle, n = 5) and presence (red triangle, n = 5) of 0.1 µM ZnCl2. Fluorescence signals were generated using the protocol shown as inset in d. Smooth curves are Boltzmann fits to the data with the following V1/2 and dV values: −99.0 ± 2.5 mV and 25.9 ± 1.3 for control; −110.4 ± 0.2 mV and 25.7 ± 1.9 mV for ZnCl2. (i) Dose-response curves of inhibition by external ZnCl2 for Shaker-iVSD and Shaker-iVSD D277H ionic currents. Data points correspond to normalized amplitudes of ionic currents elicited by step hyperpolarization to −150 mV (As shown in a), plotted as a function of ZnCl2 concentration, and fitted with the Hill equation. The IC50 value of ZnCl2 for the Shaker-iVSD D277H inward currents was 158.4 nM (maximum inhibition 79%, n = 5), which was significantly lower than the IC50 value obtained from Shaker-iVSD currents 6.04 µM (maximum inhibition 80%, n = 6).
Figure 3—figure supplement 1
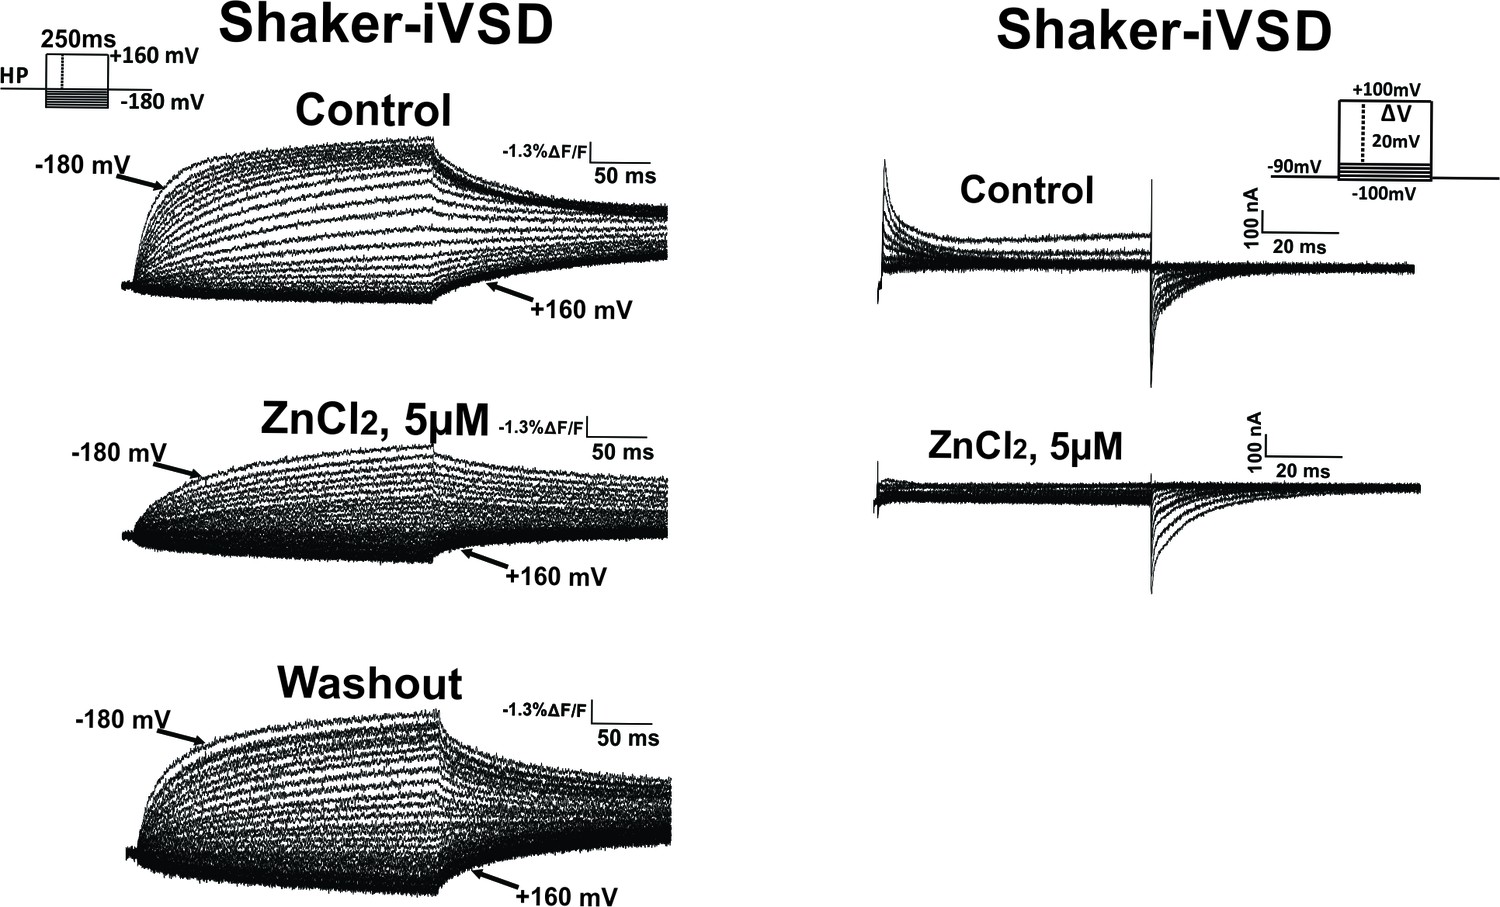
Effect of Zn2+ on fluorescence (left) and gating currents (right).
Fluorescence changes reduced significantly upon addition of Zn2+ and recover upon washout. Gating currents were inhibited upon addition of 5 µM Zn2+. At 5 µM Zn2+, tail currents at hyperpolarized potentials are still visible.
Figure 4
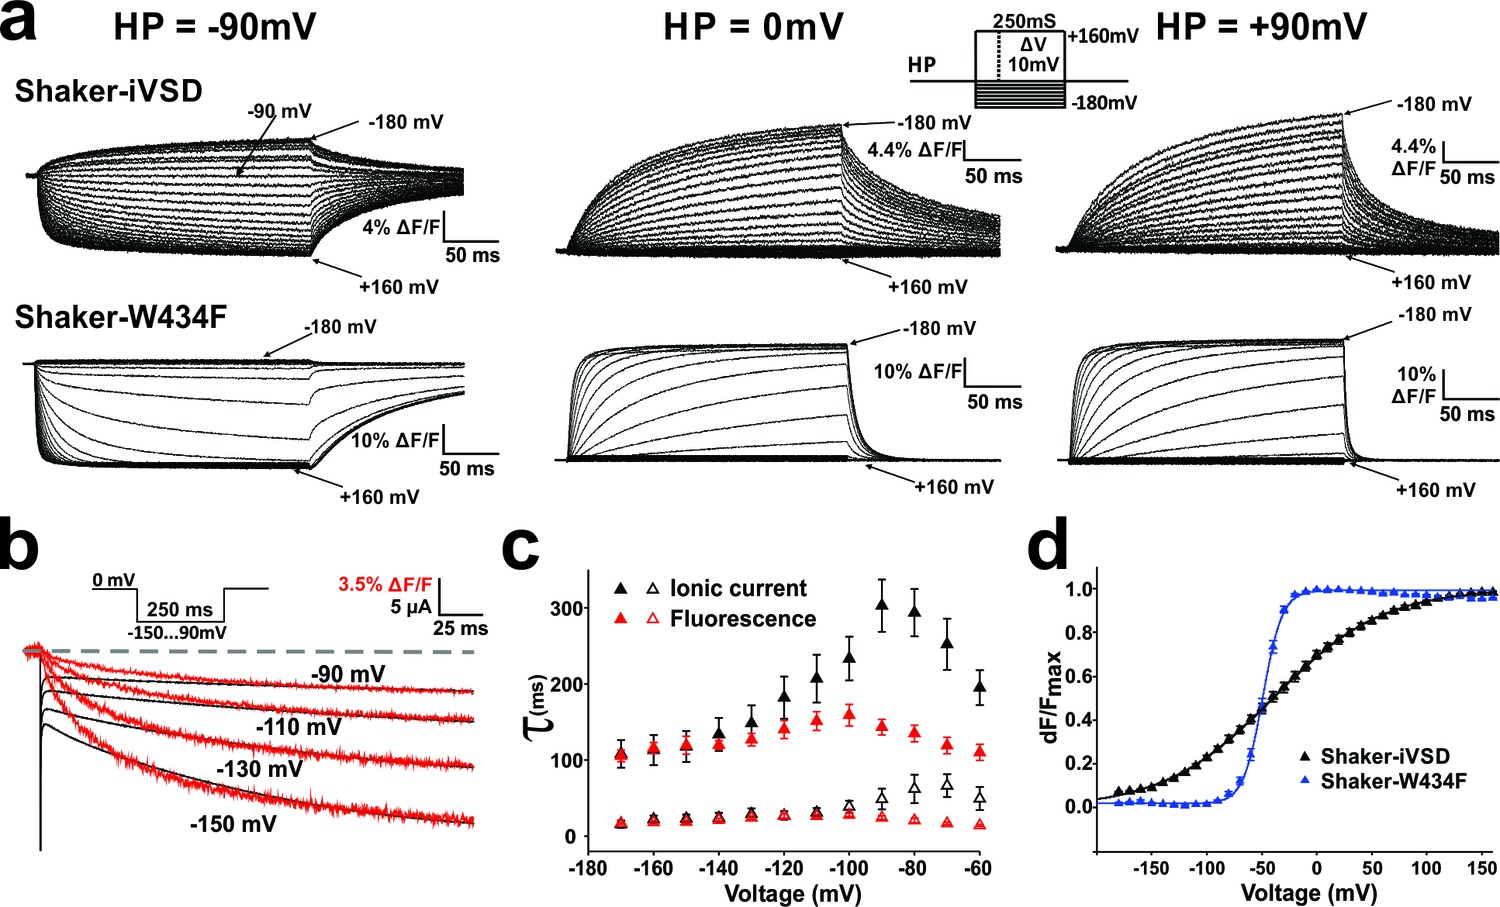
Conformational changes in Shaker-iVSD.
Shaker-iVSD displays slow voltage-dependent fluorescence quenching in oocytes under voltage-clamp using cut-open oocyte technique. (a) Typical fluorescence signals are shown for Shaker-iVSD and Shaker-W434F for 250 ms pulses between −180 and +160 mV from holding potentials of −90 mV (left), 0 mV (center), and +90 mV (right). The inset shows the corresponding clamp protocol. (b) Scaled and overlaid representative ionic current (black) and fluorescence traces (red) in response to a voltage step from 0 mV to −150,–130, −110 and −90 mV for Shaker-iVSD (see inset for protocol). Note that the fluorescence signal has been inverted for a direct kinetic comparison with the current traces. (c) The activation kinetics of the Shaker-iVSD ionic currents (as shown on the top of Figure 1c) and fluorescence traces during channel activation (as shown in a) were fitted by two exponential components, Ifast and Islow for ionic currents (n = 7), Ffast and Fslow for fluorescence traces (n = 7). The fitted time constants were plotted as a function of test potential. (d) FV relationships of Shaker-iVSD and Shaker-W434F at holding potential of −90 mV calculated by normalizing the mean ΔF values during the last 50 ms of the command pulse to the maximum fluorescence change, and plotted against voltage. Smooth curves were fits to a Boltzmann function yielding the following V1/2 and dV values: −38.8 ± 3.4 and 49.3 ± 2.3 mV for Shaker-iVSD (n = 12), −49.2 ± 1.3 and 8.6 ± 0.4 mV for Shaker-W434F (n = 12).
Figure 5
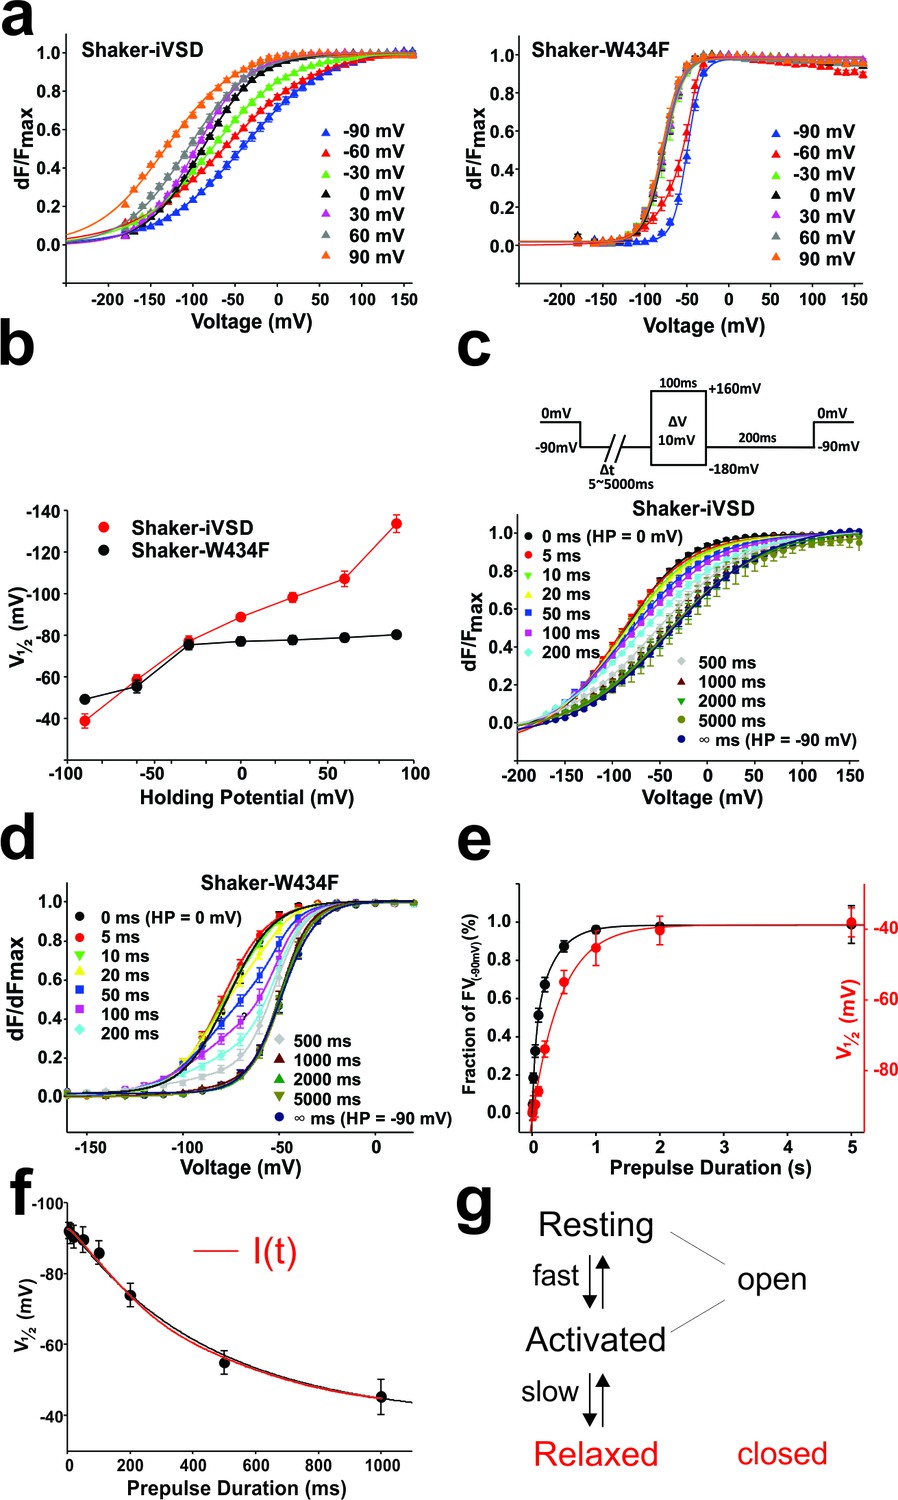
Mode shift in Shaker-iVSD.
(a) FV relationships at 7 different holding potentials of Shaker-iVSD (left) and Shaker-W434F (right). Smooth curves were fits to a Boltzmann function yielding the following V1/2 and dV values: for Shaker-iVSD, −38.8 ± 3.4 and 49.3 ± 2.3 mV at HP −90 mV (n = 12), −58.5 ± 2.5 and 57.4 ± 2.3 mV at HP −60 mV (n = 24), −77.0 ± 2.7 and 44.9 ± 1.3 mV at HP −30 mV (n = 20), −88.7 ± 1.4 and 33.6 ± 1.5 mV at HP 0 mV (n = 24), −98.2 ± 2.4 and 32.0¸± 2.0 mV at HP + 30 mV (n = 9), −107.1 ± 3.7 and 37.2 ± 2.0 mV at HP + 60 mV (n = 11), −133.7 ± 4.2 and 40.6 ± 1.9 mV at HP + 90 mV (n = 7); for Shaker-W434F, −49.2 ± 1.3 and 8.6 ± 0.4 mV at HP −90 mV (n = 12), −5.5 ± 3.0 and 14.2 ± 0.9 mV at HP −60 mV (n = 14), −75.4 ± 2.4 and 11.6 ± 1.1 mV at HP −30 mV (n = 14), −77.1 ± 2.0 and 11.2 ± 0.9 mV at HP 0 mV (n = 7), −77.7 ± 2.1 and 11.7 ± 0.8 mV at HP + 30 mV (n = 7), −78.9 ± 2.0 and 11.2 ± 0.8 mV at HP + 60 mV (n = 8), −80.3 ± 1.8 and 10.8 ± 0.5 mV at HP + 90 mV (n = 6). (b) V1/2 values from a plotted versus holding potential. (c–d) Normalized FV relations of Shaker-iVSD and Shaker-W434F from a holding potential of 0 mV to a pre-pulse of −90 mV for variable duration (5–5000 ms) followed by a series of test pulses of −180 to +160 mV in steps of 10 mV (see inset for protocol). For Shaker-iVSD, smooth curves are fits to a Boltzmann function with V1/2 values shown in e as a function of pre-pulse duration. For Shaker-W434F, the resulting distribution is a superposition of two Boltzmann curves representing the FV0 mV and the mode-shifted FV−90 mV. Smooth curves are fits of the data to a double Boltzmann function, and the fractional amplitudes of FV−90 mV component are shown in e as a function of pre-pulse duration. (e). Data points of Shaker-iVSD (red circle, right ordinate) were fitted by a single-exponential function with a time constant for entering the mode shift of 452 ms. Data points of Shaker-W434F (black circle, left ordinate) were fitted by a double-exponential function having time constants for entering the mode shift of 36 ms and 279 ms. (f) Comparision the time course for entering mode-shift with the development of the ionic current of Shaker-iVSD. The red data points are V1/2 values recorded from one oocyte plotted as a function of pre-pulse duration (5–1000 ms) (see protocol in c), and fitted by a single-exponential function (red curve). Ionic current recorded from the same oocyte (black) was scaled and overlaid with the red curve.
Download links
A two-part list of links to download the article, or parts of the article, in various formats.
Downloads (link to download the article as PDF)
Open citations (links to open the citations from this article in various online reference manager services)
Cite this article (links to download the citations from this article in formats compatible with various reference manager tools)
The isolated voltage sensing domain of the Shaker potassium channel forms a voltage-gated cation channel
eLife 5:e18130.
https://doi.org/10.7554/eLife.18130


