HID-1 is required for homotypic fusion of immature secretory granules during maturation
- Institute of Biophysics, Chinese Academy of Sciences, China
- University of Chinese Academy of Sciences, China
Figures
Figure 1 with 3 supplements
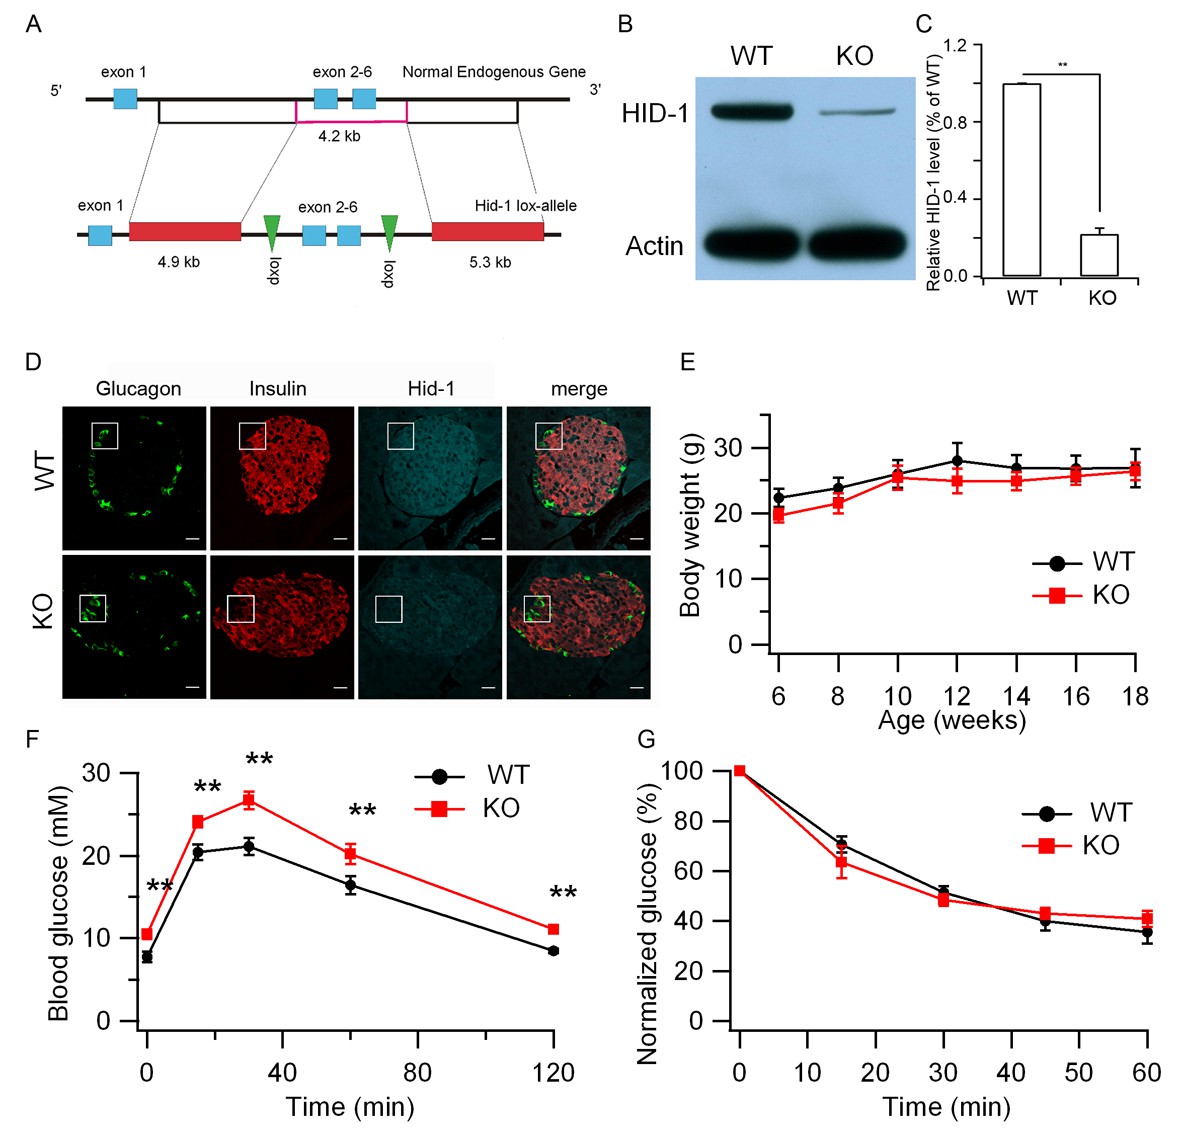
Hid1-betaKO mice exhibit glucose intolerance.
(A) A schematic diagram showing the endogenous mouse Hid-1 gene and the targeting floxed construct. (B) Western blot analysis of mouse HID-1 and actin in isolated islets from WT and Hid1-betaKO (KO) mice (five biological replicates from ten mice). (C) Quantitative analysis of the reduction of HID-1 protein in KO islets. (D) Immunofluorescent histochemical analysis of pancreas sections of WT and KO mice, showing glucagon (green), insulin (red) and HID-1 (cyan). The white squares were enlarged in Figure 1—figure supplement 1A for a magnified view. Scale bar: 20 μm. (E) Comparison of body weight (n = 6, three males and three females in each group) and (F) blood glucose during GTT (i.p. administration of 2 g/kg body weight glucose. WT, n = 8, four males and four females; KO, n = 11, five males and six females. p=0.003, 0.005, 0.001, 0.02 and 0.002 at 0, 15, 30, 60 and 120 min, respectively, t-test.) and (G) normalized blood glucose during ITT (i.p. administration of 0.5 U/kg body weight insulin. WT, n = 9, four males and five females; KO, n = 10, five males and five females) between WT and KO mice.
Figure 1—figure supplement 1
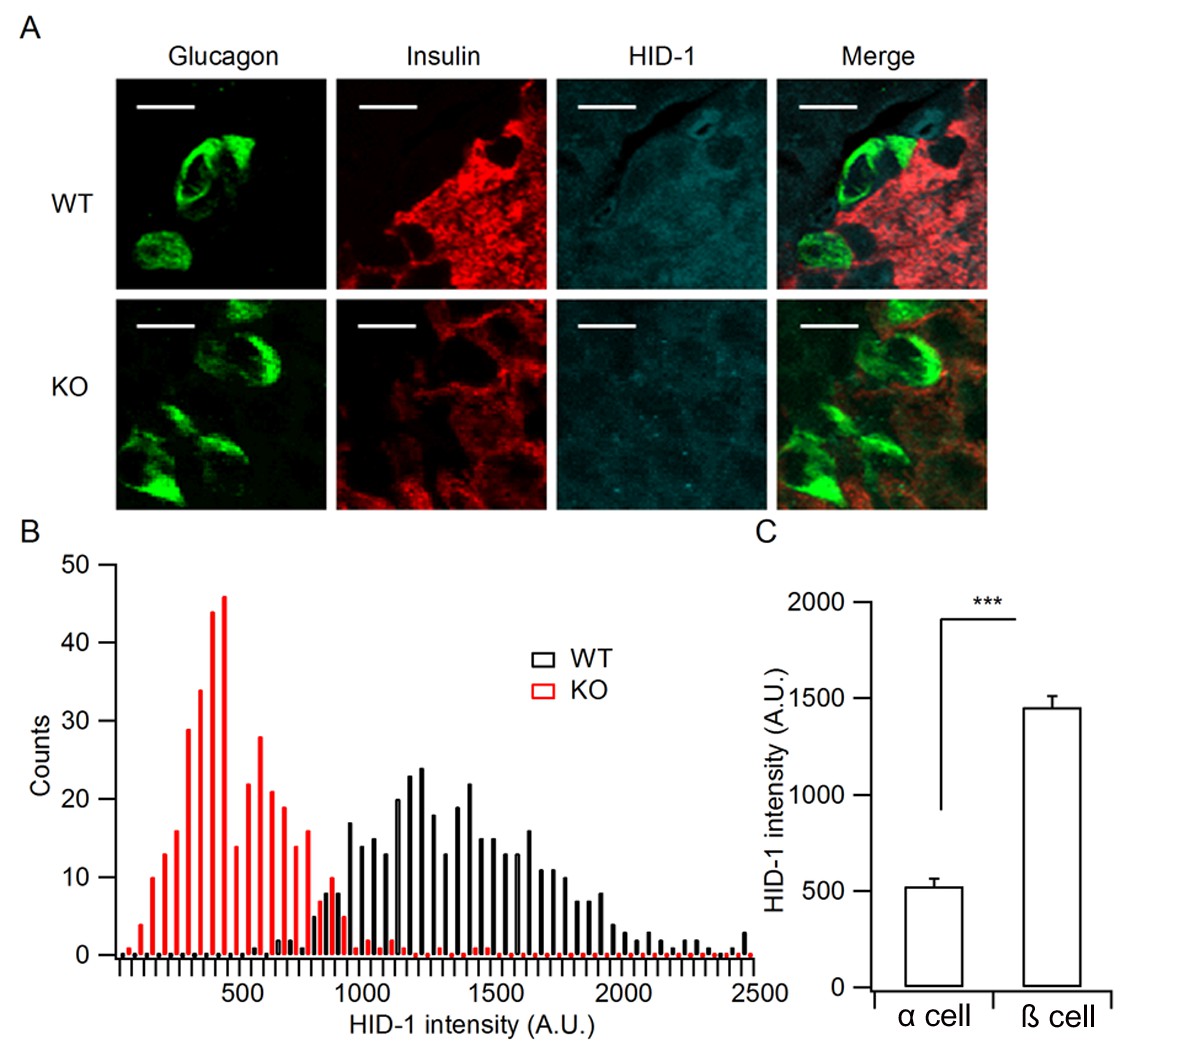
Quantification of HID-1 expression by immunofluorescence in pancreas sections.
(A) Magnified pictures of white squares in Figure 1D examining the expression of HID-1 at single cell levels. Please note the lower expression of HID-1 in glucagon-positive α cells (green) than in insulin-positive (red) β cells. Scale bar: 10 μm. (B) Histogram of HID-1 intensity between WT and KO β cells (n = 375 and 363 for WT and KO, respectively, three biological replicates from six mice). The difference is significant (p = 0.028, Kolmogorov-Smirnov test). (C) Quantification of HID-1 expression in α and β cells in WT islets (n = 375 and 52 for β and α cells, respectively, three biological replicates from six mice, p < 0.001, t-test).
Figure 1—figure supplement 2
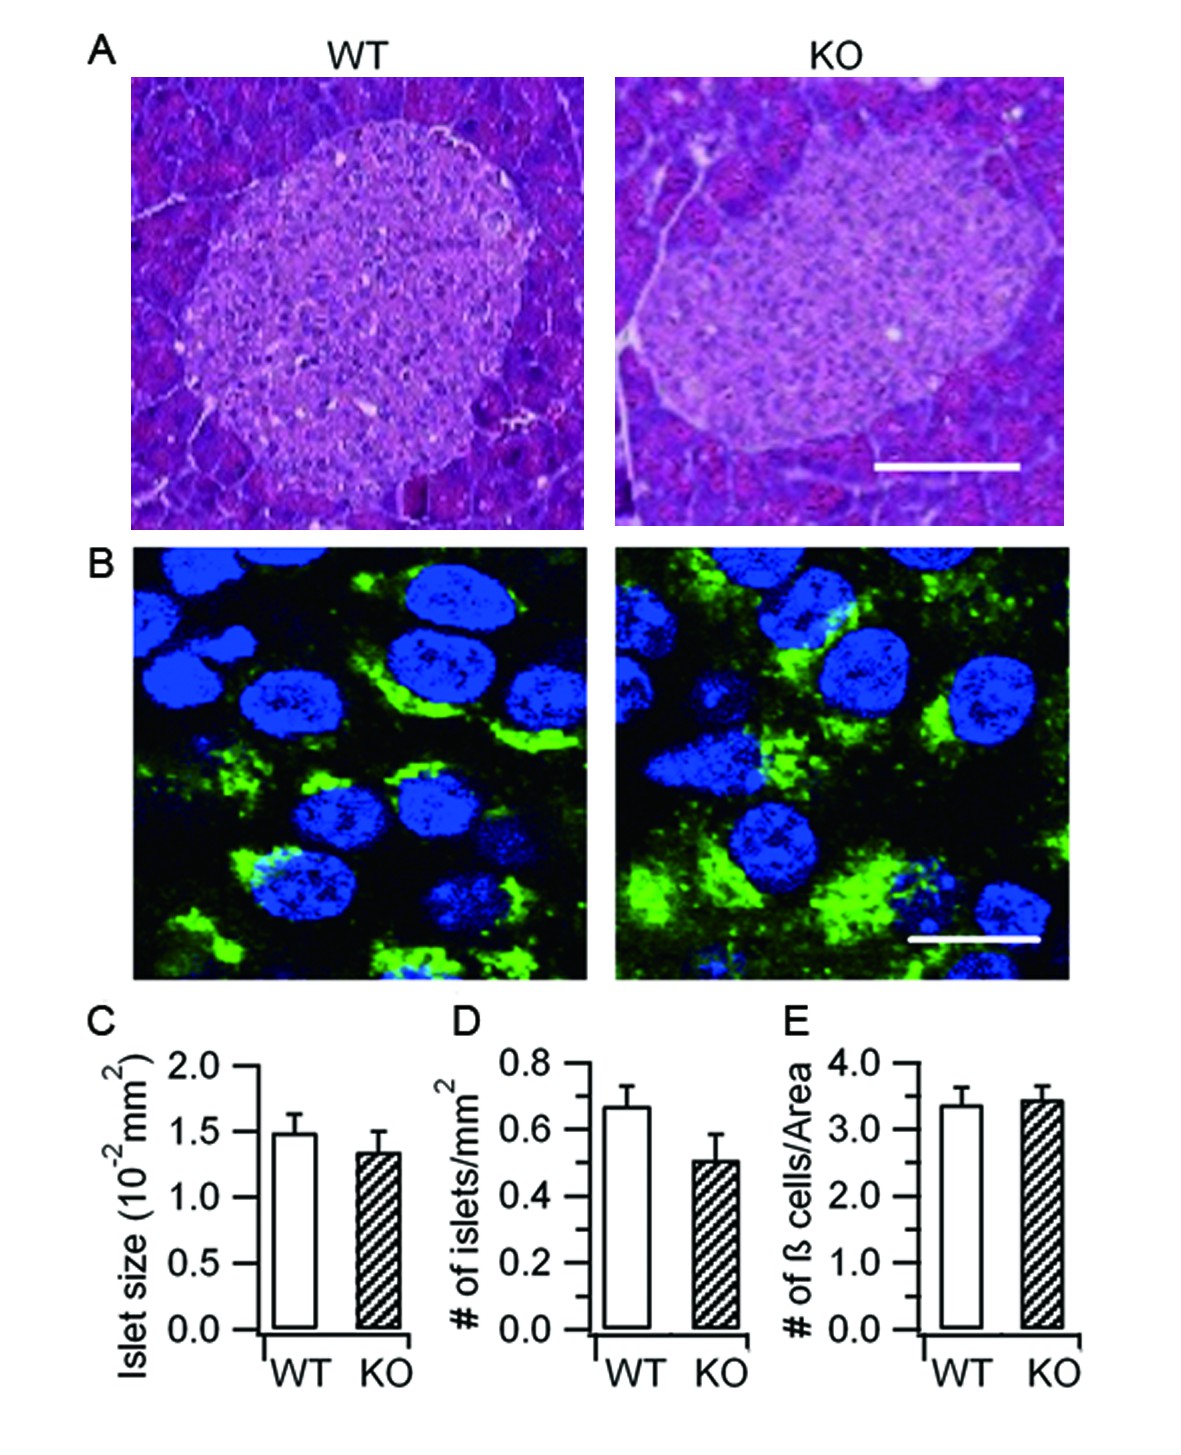
Hid1-betaKOmice show normal islet and β-cell morphology.
(A) Islets stained with hematoxylin and eosin from WT and Hid1-betaKO (KO) pancreas. Scale bar: 25 μm. (B) WT and KO pancreas slices were immunostained with a proinsulin-specific antibody (HyTest, CCI-3) (green) to analyze the densities of pancreatic β cells per unit area. Nuclei were labeled with Hoechst 3342 (blue). Scale bar: 50 μm. (C) Comparison of islet size, (D) number of islets per mm2 of pancreas , and (E) number of β cells per unit area between WT (n = 13 regions from three different mice) and KO (n = 24 from three different mice)
Figure 1—figure supplement 3
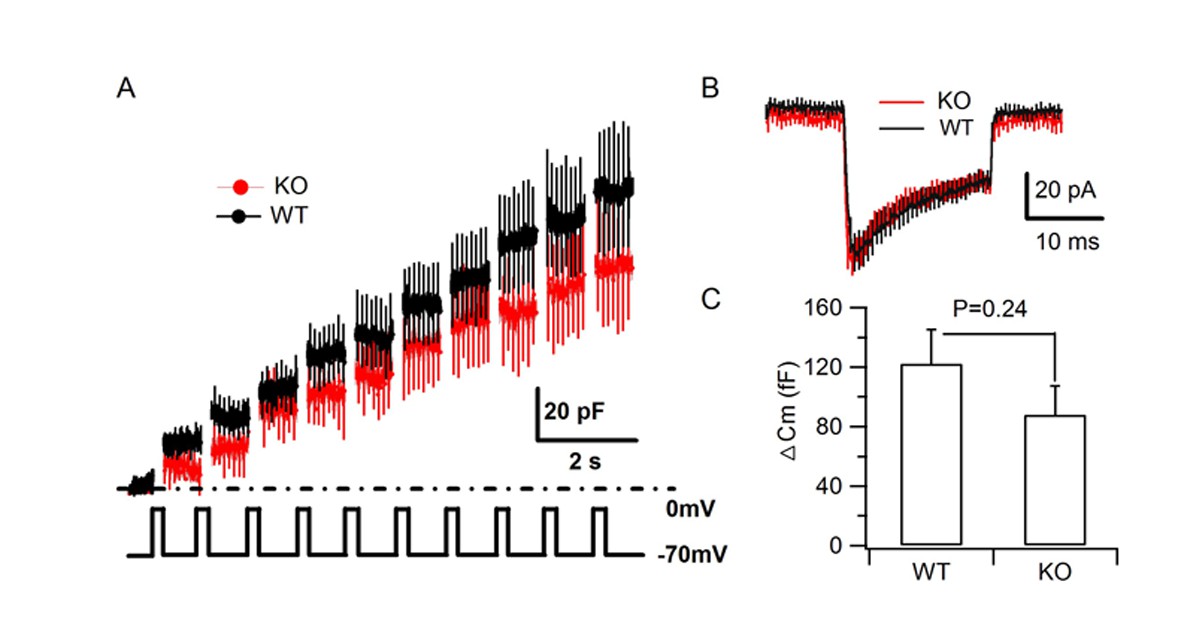
HID-1 deficiency does not impair depolarization-induced SG exocytosis.
(A–B) Averaged traces of membrane capacitance (Cm) and Ca2+ current of cultured primary β cells from WT and KO mice induced by trains of depolarization from –70 to 0 mv for 200 ms at 1 Hz using the standard whole cell configuration. (C) Comparison of the average Cm increment (ΔCm) of β cells from WT (n = 19 cells) and KO (n = 14 cells) mice (three biological replicates from six mice, p=0.24, t-test).
Figure 2 with 1 supplement

Increased proinsulin secretion in Hid1-betaKO mice.
(A) Hid1-betaKO (KO) mice exhibit a high basal serum proinsulin level and (B) a high proinsulin/insulin ratio under normal feeding conditions (WT, n = 9, five males and four females; KO, n = 17, nine males and eight females; p = 0.0011 and 0.0005 for A and B, respectively, t-test). (C) Glucose (20 mM) stimulates insulin and (D) proinsulin secretion from isolated islets of WT and KO mice (four biological replicates from eight mice, p = 0.022 and 0.02 for 5 and 30 min, respectively, in (C); and p = 0.004 and 0.005 for 0 and 5 min. in (D), respectively; t-test).
Figure 2—figure supplement 1
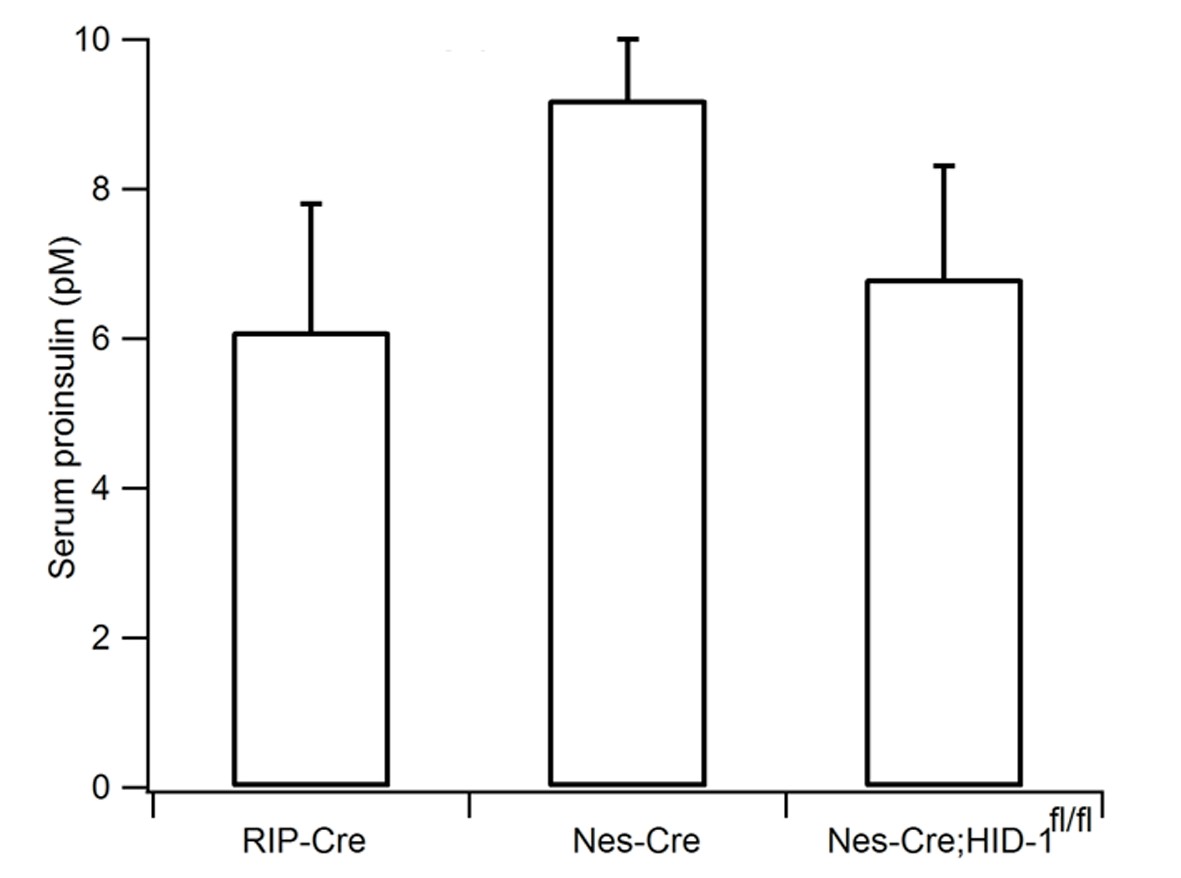
Pan-neuronal ablation of HID-1 fails to increase serum proinsulin.
RIP-Cre, Nes-Cre, and Nes-Cre;Hid1f/f mice have similar basal serum proinsulin levels under normal feeding conditions (n = 6–9, p = 0.054, one-way ANOVA).
Figure 3 with 2 supplements

HID-1 deficiency causes a defect in proinsulin processing.
(A) Western blotting of islets from WT and KO mice with an anti-insulin polyclonal antibody. The proinsulin level in KO mice is higher than that in WT mice. Results are representative of three experiments from six mice. (B) Pulse-chase experiment in WT and KO mice islets using radioactive [35S]-cysteine labeling. Insulin and proinsulin-related proteins were immunoprecipitated with anti-insulin polyclonal antibody coupled to Dynabeads. Densitometry of 35S-labeled insulin species was performed using a PhosphorImager. Results are representative of three experiments with three mice per group. (C) Kinetics of proinsulin processing in WT and KO mice islets (three biological replicates from nine mice, p = 0.006 at 180 min, t-test). (D) Insulin/proinsulin ratio during proinsulin processing in WT and KO mice islets (three biological replicates from nine mice, p = 0.006 at 180 min, t-test). (E) Western blotting with anti-HID-1 polyclonal antibody and anti-insulin polyclonal antibody in WT and HID-1 KO rat INS-1 cells. Absence of HID-1 confirms the KO effect. Proinsulin is significantly higher in HID-1 KO cells than in WT mice. (F) Kinetics of proinsulin1 processing analyzed with pulse-chase experiments followed by LC-MS quantification using stable isotopic [13C,15N]-isoleucine labeling in WT and HID-1 KO rat INS-1 cells (WT, n = 4; KO, n = 6, p = 0.008, <0.001 and 0.002 at 50, 100, 150 min, respectively, t-test). (G) Kinetics of insulin1 production in WT and HID-1 KO rat INS-1 cells (p = 0.005, 0.036 and 0.038 at 50, 100 and 150 min, respectively, t-test). (H) Insulin1/proinsulin1 ratio during proinsulin processing in WT and HID-1 KO rat INS-1 cells (p = 0.01, 0.01, and 0.019 at 50, 100 and 150 min, respectively, Mann-Whitney U Test).
Figure 3—figure supplement 1
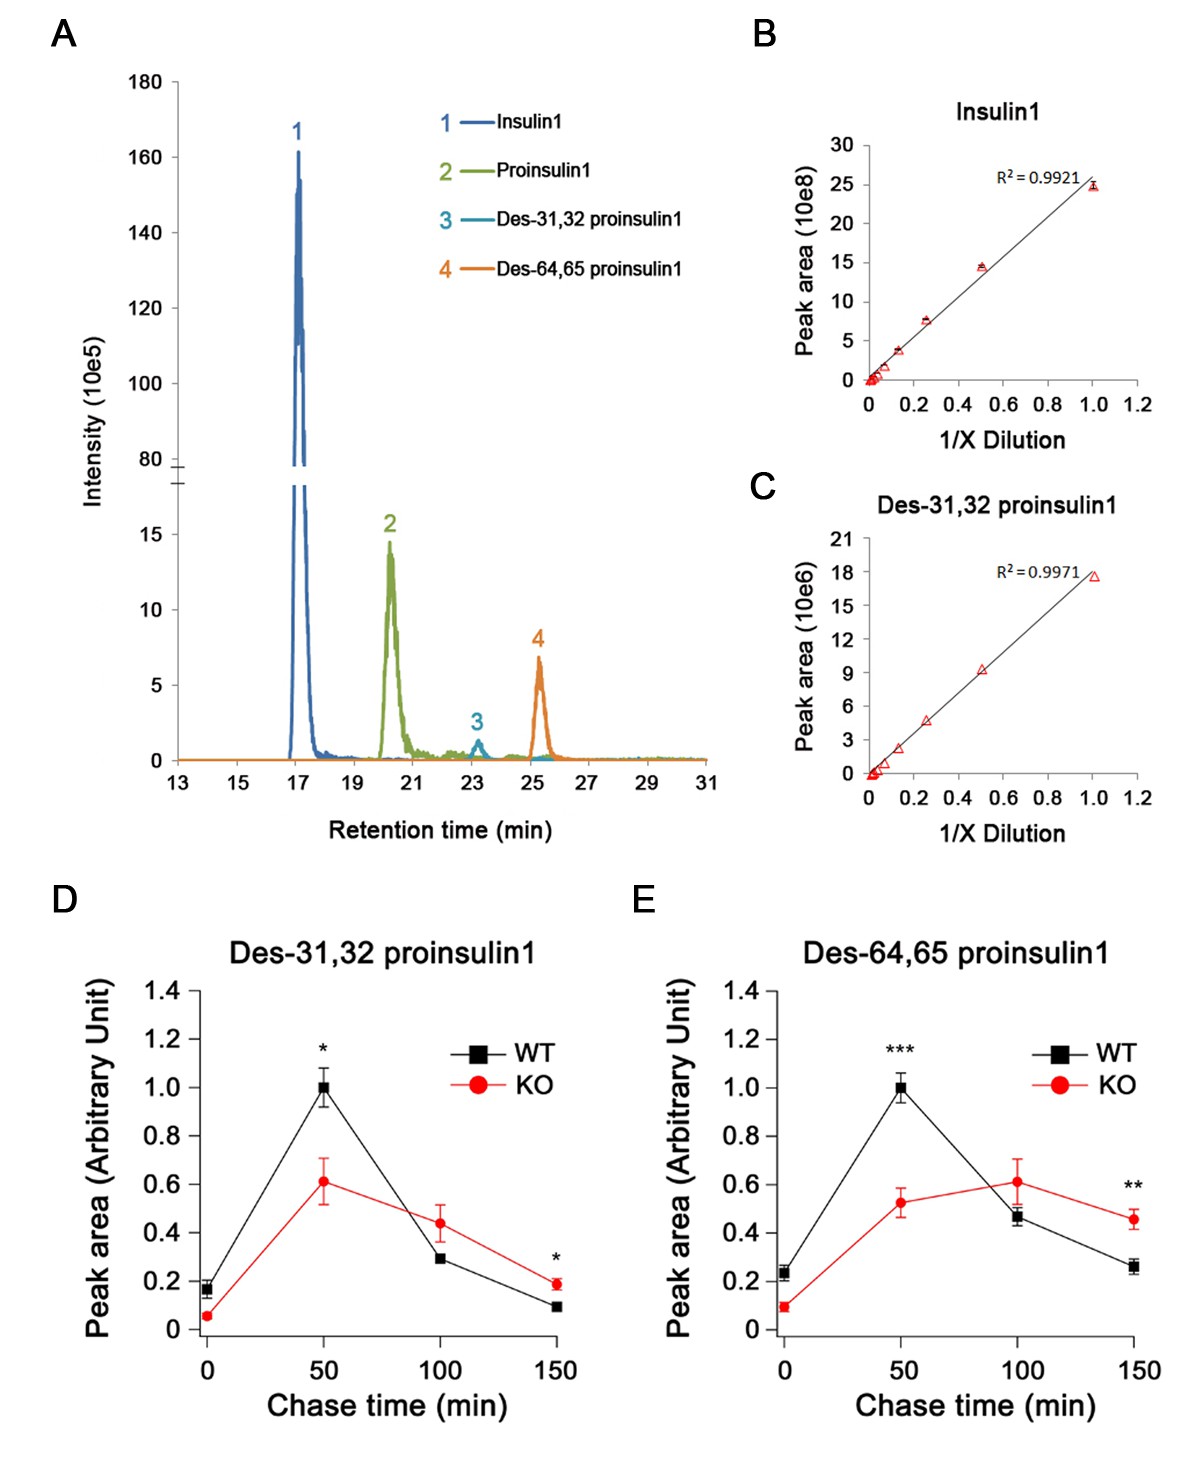
Quantification of proinsulin and its processing products by LC-MS in INS-1 cells.
(A) Extract ion chromatogram (EIC) of proinsulin1 and its processing products derived from the Ins1 gene in rat INS-1 cells. (B,C) The linear correlation between (B) the EIC peak area and the concentration of high-abundance insulin1 and (C) low-abundance des-31,32 proinsulin1 (four technical replicates for each point). (D) Des-31,32 proinsulin1 and (E) des-64,65 proinsulin1 were quantified in pulse-chase experiments using stable isotopic ([13C, 15N]-isoleucine) labeling and LC-MS in WT and HID-1 KO INS-1 cells (WT, n = 4; KO, n = 6; p = 0.021 and <0.001 at 50 min; p = 0.021 and 0.01 at 150 min for (D) and (E), respectively, t-test).
Figure 3—figure supplement 2
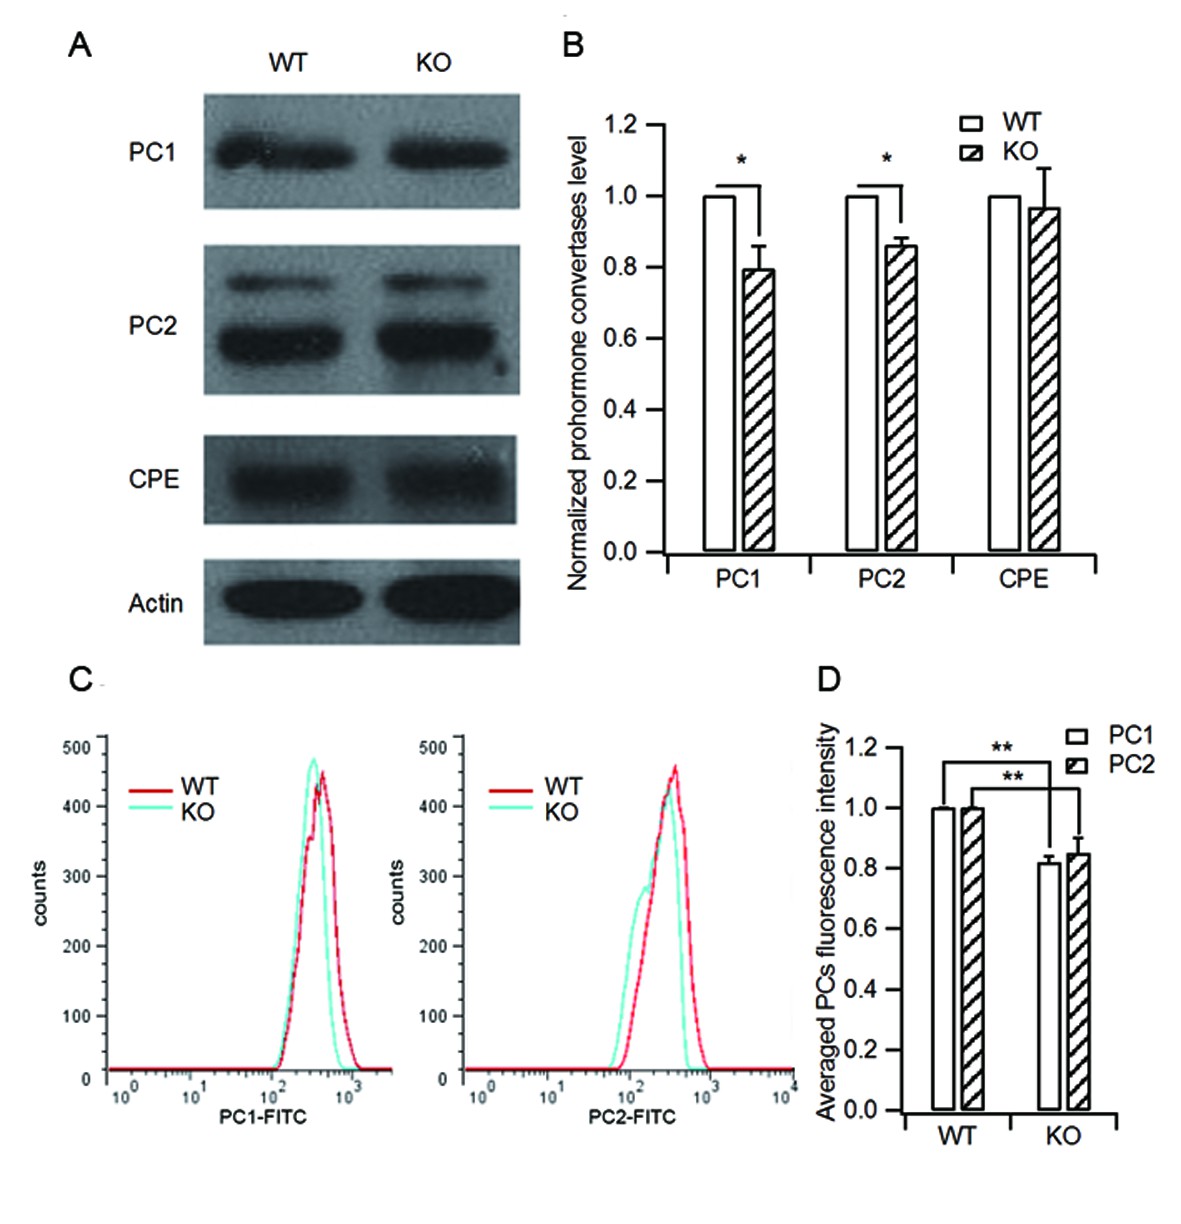
HID-1 deficiency causes a slight decrease in processing enzyme levels.
(A) Isolated islets of WT and KO mice were collected and lysed for western blot analysis of the processing enzymes PC1/3, PC2 and CPE. (B) Statistical analysis of the levels of PC1/3, PC2, CPE from three independent experiments as shown in (A). KO islets showed a slight decrease in PC1/3 and PC2 protein levels (20% and 14%, respectively) as compared with WT controls (three biological replicates from six mice, p(PC1/3) = 0.015, p(PC2) = 0.01, p(CPE) = 0.712, respectively, Wilcoxon test). (C) Representative histograms of PC1/3 and PC2 fluorescence in WT and KO β cells measured by flow cytometry. (D) Averaged PC1/3 and PC2 fluorescence intensity from (C). Consistent with the western blot results in (B), KO β cells displayed slightly decreased PC1/3 and PC2 fluorescence intensity (14.9% and 12.5% lower than WT, respectively, three biological replicates from six mice, p(PC1/3) = 0.016, p(PC2) = 0.04, respectively, Wilcoxon test).
Figure 4 with 2 supplements
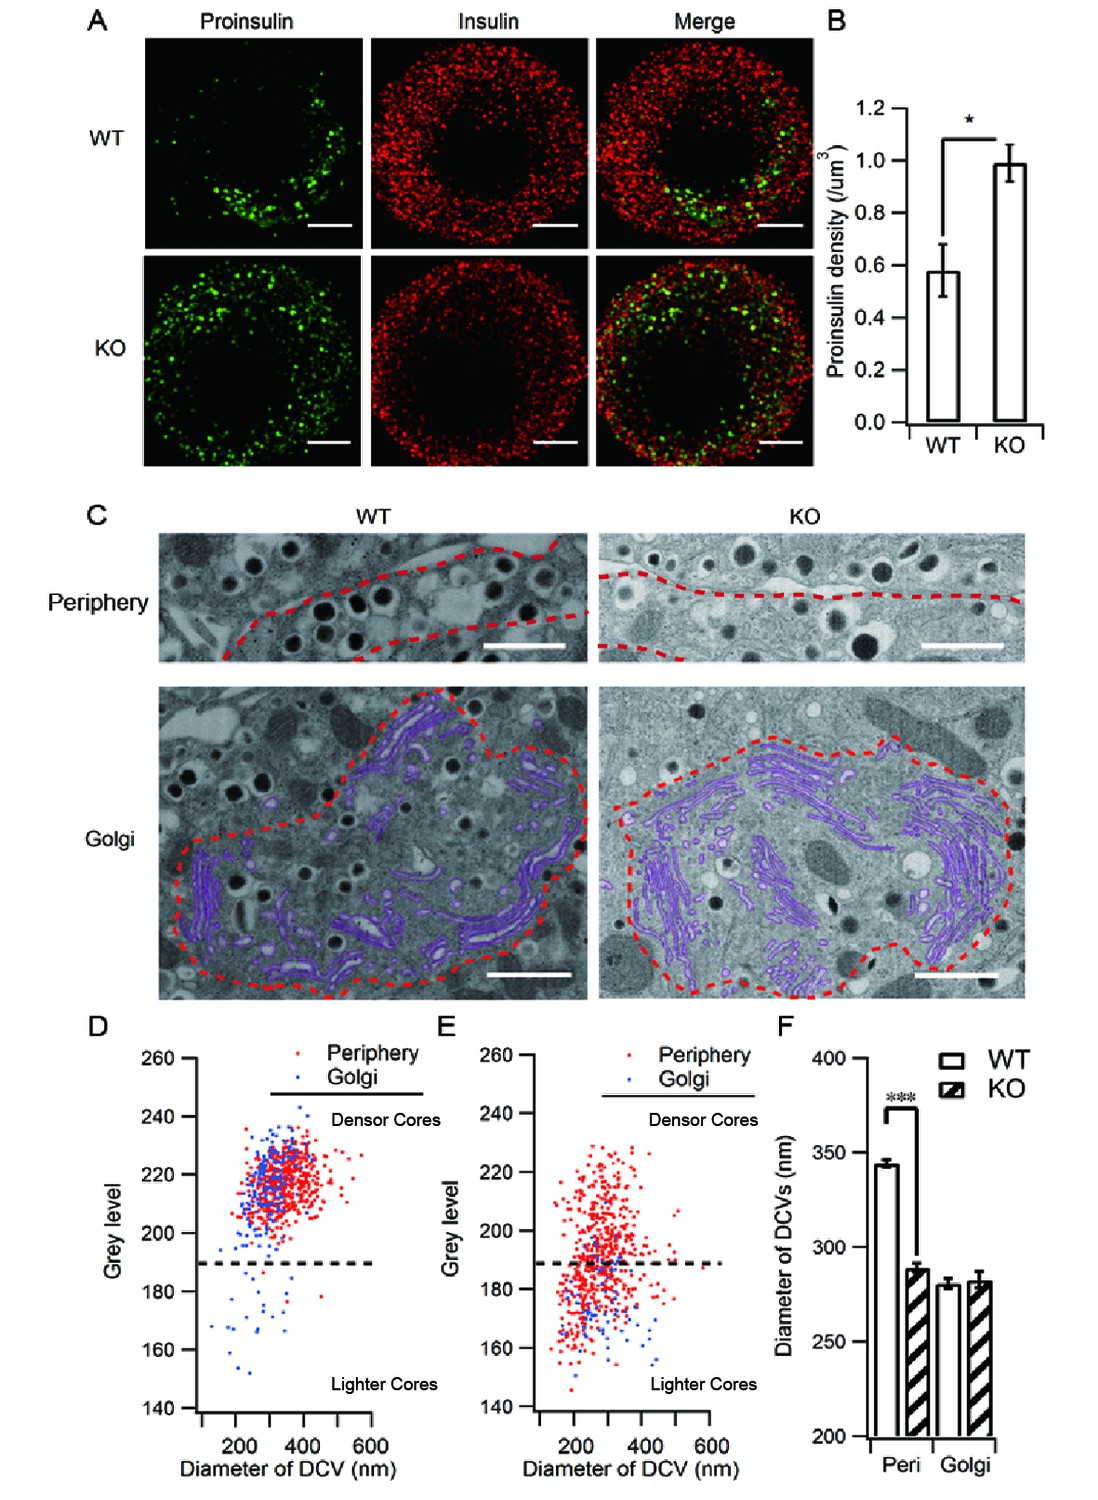
HID-1 deficiency increases the number of ISGs in β cells.
Immunofluorescence analysis of ISGs (labeled with proinsulin antibody) and MSGs (labeled with insulin antibody), showing (A) subcellular distribution and (B) density in WT (n = 8) and KO (n = 14) mice (three biological replicates from six mice, p = 0.015, Mann-Whitney U test). Scale bar, 2 µm. (C) Comparison of SG morphology between WT and KO β cells. There are many small and light SGs in the peripheral region (indicated by a dashed red line, upper panel) of KO cells. Golgi stacks (highlighted in purple) in β cells form an enclosed region, which is defined as the Golgi region (indicated by a dashed red line, lower panel). Scale bar, 1 µm. (D) Two-dimensional (2D) scatter plots of grey level against granule size in WT β cells (Golgi – n = 179, 21 denser cores; periphery – n = 517, four lighter cores). (E) 2D scatter plots of grey level against granule size in KO β cells (Golgi – n = 73, 65 lighter cores; periphery – n = 527, 252 lighter cores). Each point represents a single granule. The granules calculated were from the same reconstructed volume for both WT and KO to avoid artifacts caused by staining and SEM imaging. (F) Granules in the periphery (Peri) region of WT β cells are significantly larger than those from KO mice (344.0 ± 2.2 nm, n = 1,070; 289.1 ± 2.3 nm, n = 1,387; respectively, p < 0.001, Kolmogorov-Smirnov test). No significant difference in granules from Golgi regions was observed between WT and KO mice (280.7 ± 2.8 nm, n = 443, respectively; 282.7 ± 4.2 nm, n = 256, respectively; p = 0.756, Kolmogorov-Smirnov test).
Figure 4—figure supplement 1
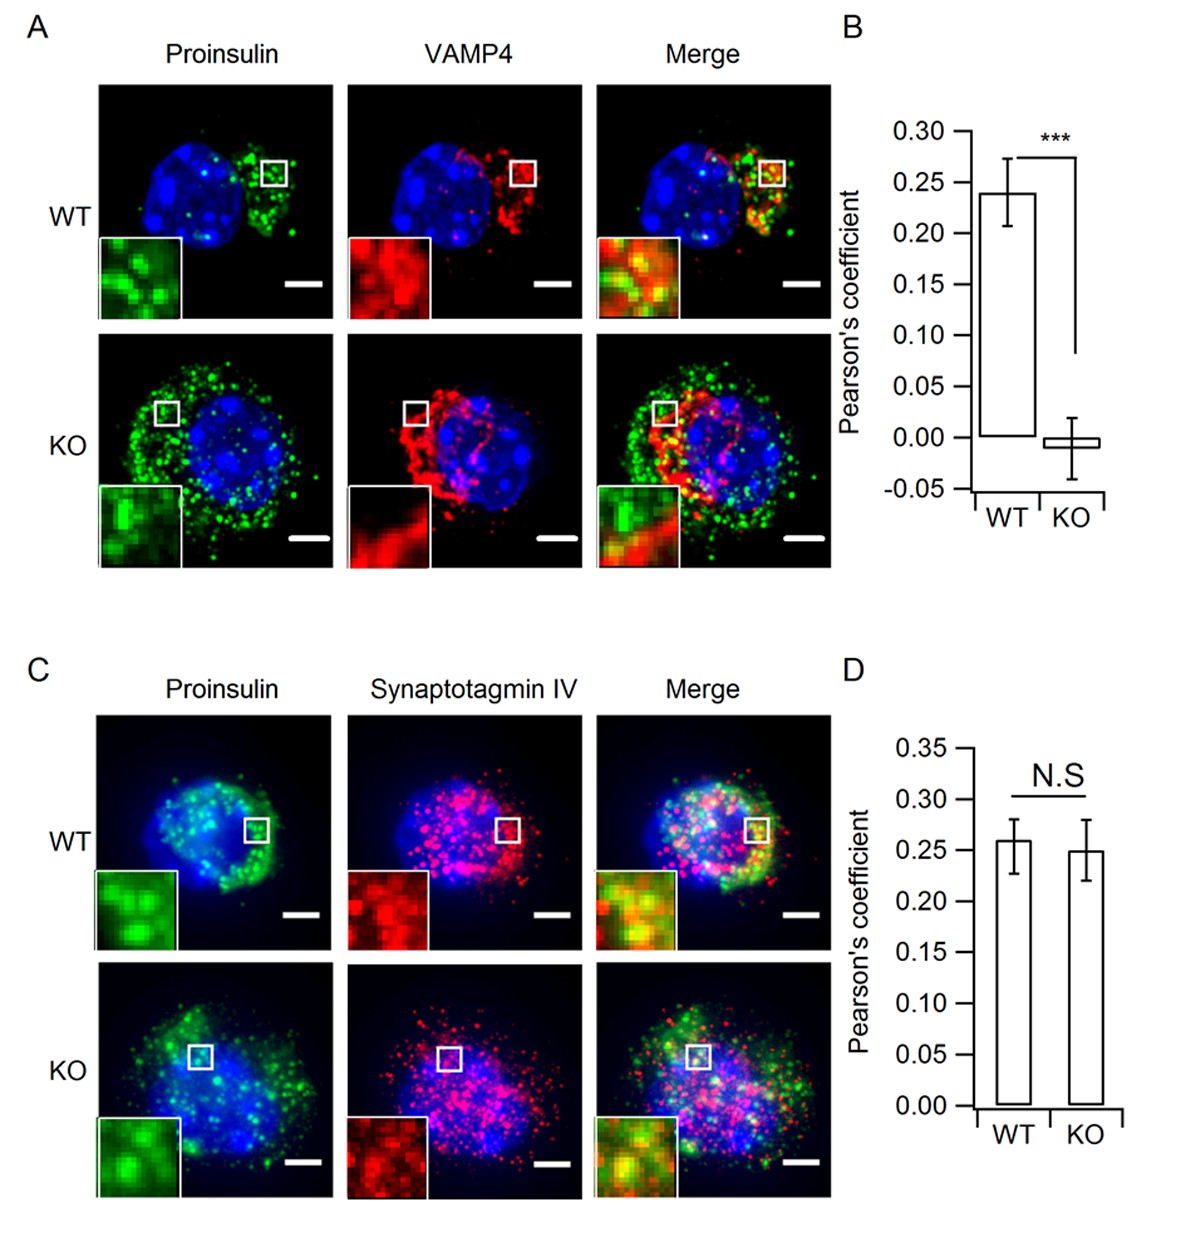
Depletion of HID-1 leads to reduced co-localization with VAMP4, but not with Syt-IV.
(A, C) The representative images showing a single beta cell stained for proinsulin (green channel), VAMP4/Syt-IV (red channel) and DAPI (blue channel). Each figure shows maximum intensity projection throughout the cell. Top: WT, bottom: KO; Scale bar, 2 µm. (B, D) Quantification of the Pearson's coefficient between green and red channels in (A) and (C) (n = 15, three biological replicates, p < 0.001, p = 0.601, respectively, Mann-Whitney U test). Scale bar, 2 µm.
Figure 4—figure supplement 2
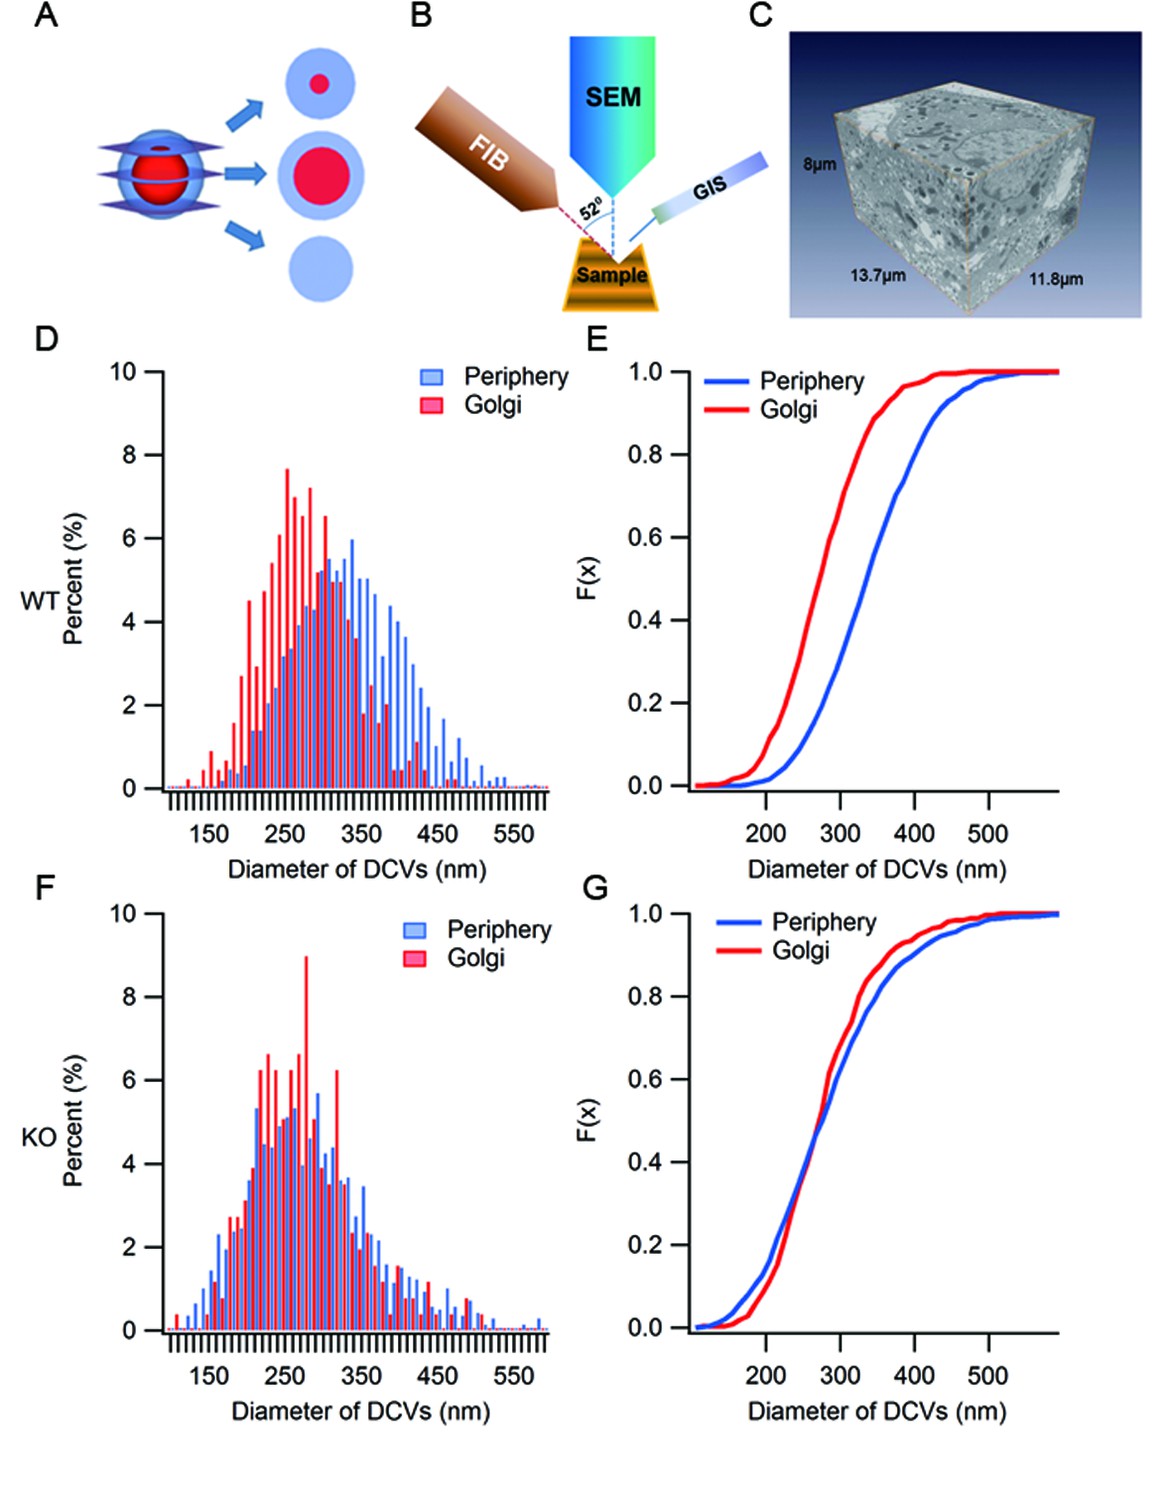
Ultrastructure analysis of SGs by large volume FIB/SEM.
(A) A diagram depicting the appearance of three different thin sections from a model SG depending on the location of the sectioning on the z-axis. (B) Schematic representation of focused ion beam (FIB)/scanning electron microscopy (SEM). A gallium ion beam is used to mill the material away, then the fresh surface is imaged under SEM. (C) A FIB/SEM reconstruction of a volume (13.7 x 11.8 x 8 μm3) of a β cell containing many intact SGs. Voxel size = 6.7 x 6.7 x 20 nm3. (D) Histogram of granule size from WT β cells. Granules in the Golgi region have smaller diameters than those from the peripheral region. (E) Cumulative distribution of granule size from the Golgi and periphery regions. The difference is significant (p < 0.001, Kolmogorov-Smirnov test). (F) Histogram of granule size in KO mice. (G) Cumulative distribution of granule size from the Golgi and periphery regions. There is no significant difference between the two (p = 0.125, Kolmogorov-Smirnov test).
Figure 5 with 1 supplement
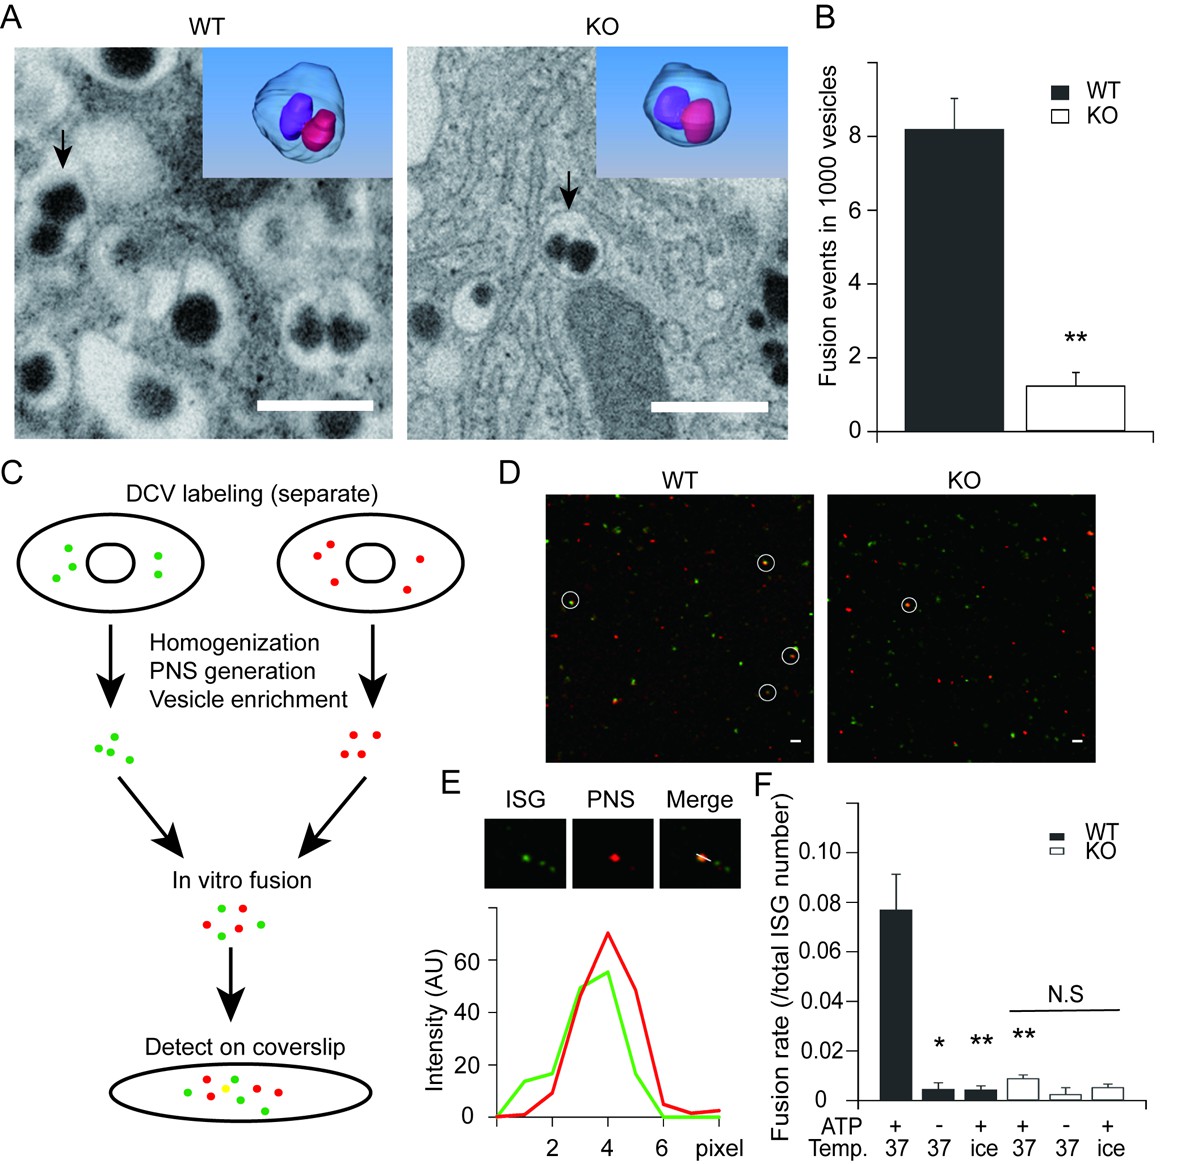
HID-1 deficiency disrupts homotypic fusion of ISGs.
(A) Representative sections from FIB/SEM reconstructions containing ISG fusion events. The arrowed fusion events are segmented and rendered in 3D (top corner). Scale bar, 500 nm. (B) Comparison of the frequency of fusion events. There were 8.2 ± 0.8 fusion events per 1,000 SGs in WT (19/2632, 4/532, 22/2253, n = 3 cells) and 1.2 ± 0.4 in KO (3/3024, 1/1043, 3/1539, n = 3 cells), p = 0.002, t-test. (C) An overview flowchart of the in vitro fusion assay. (D) Representative images of fusion reactions using either WT cells or HID-1 KO INS-1 cells. Fusion events are marked with white circles. Scale bar, 3 μm. (E) A typical fusion event as shown in panel (D). The graph shows the fluorescence intensity profiles of green SGs (ISG) and red SGs (PNS). (F) ISGs and PNS obtained from both WT and HID-1 KO INS-1 cells were subjected to in vitro fusion assays (n = 3) with or without ATP at 37°C or on ice. The fusion rate was calculated by dividing the number of fusion events by the total number of ISGs. (p = 0.03, 0.007 and 0.009 for WT37°C-ATP, WTice+ATP and KO37°C+ATP vs WT37°C+ATP, respectively, t-test. N.S = not significant.)
Figure 5—figure supplement 1
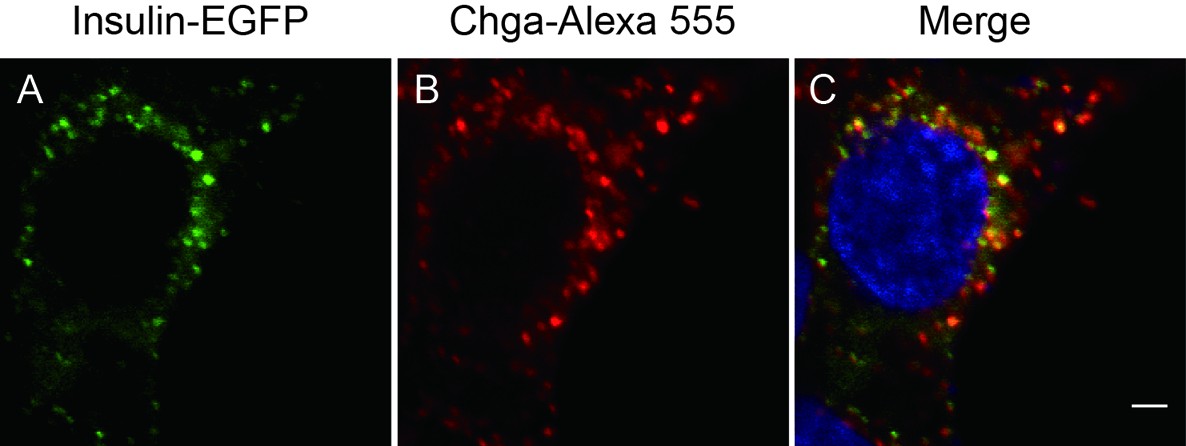
Insulin-EGFP protein localizes to SGs.
INS-1 cells transfected with insulin-egfp were subjected to immunohistochemistry with an antibody against chromogranin A (Chga, red) and detected by confocal microscopy. Scale bar: 2 μm.
Figure 6 with 1 supplement
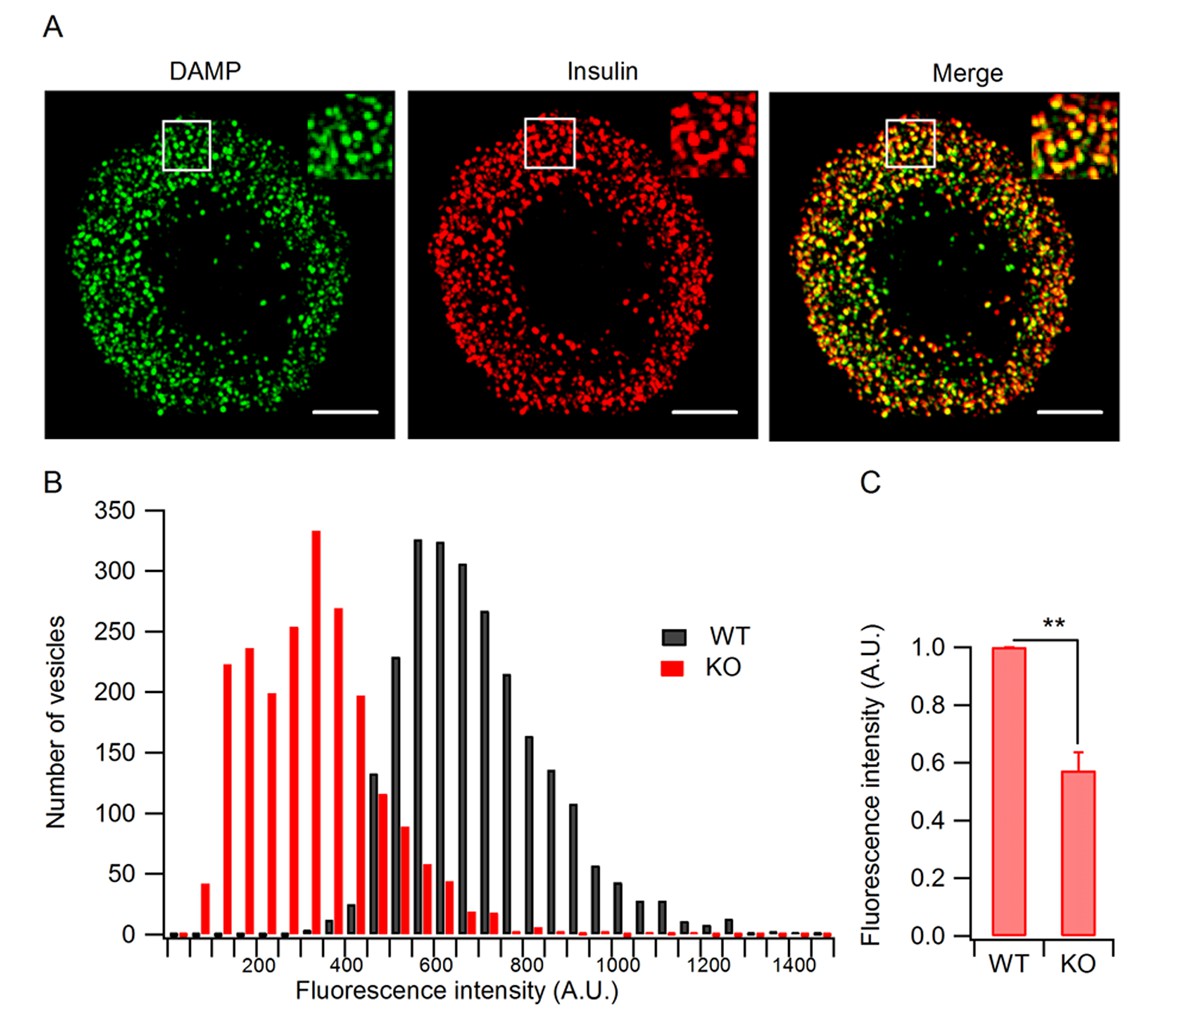
Granule acidification is blocked in HID-1 KO cells.
Indirect immunofluorescence was performed on dispersed β islet cells, after 1 hr of incubation with 30 μM DAMP in Hanks balanced salt solutions (4 mM glucose). Anti-DNP was used to detect DAMP. Anti-insulin was used to label insulin-containing granules. (A) 3D-SIM images of WT β cells, showing colocalization of DAMP (green) with insulin granules (red). Scale bar, 2 µm. (B) Comparison of DAMP intensity between WT (n = 2443) and KO (n = 2117) insulin granules (imaged by confocal microscopy, 50 cells for each group and three biological replicates with six mice). The difference is significant (p < 0.001, Kolmogorov-Smirnov test). (C) Mean fluorescence intensity of DAMP from insulin-immunoreactive cells was analyzed by flow cytometry (four biological replicates with eight mice, p = 0.015, Wilcoxon test).
Figure 6—figure supplement 1
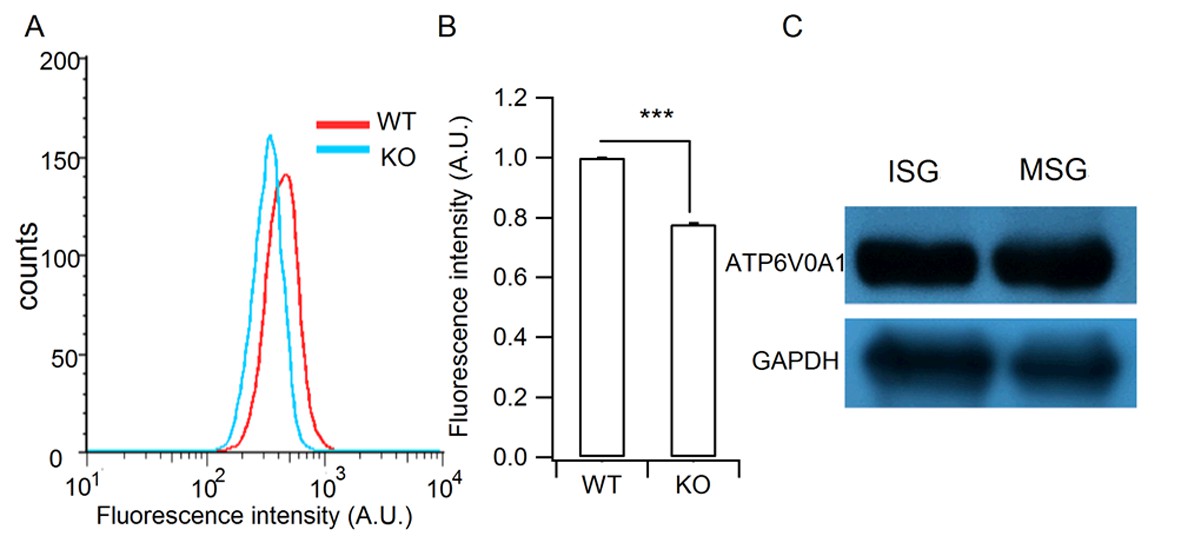
Verification of the granule acidification defect in HID-1 KO cells and the granular location of H+-ATPase.
(A) Representative histograms of lysosensor fluorescence in WT and KO β cells measured by flow cytometry. (B) Comparison of fluorescence intensity from (A) (p<0.001, five biological replicates, Wilcoxon test). (C) Western blot analysis of ISG and MSG fractions from WT INS-1 cells using antibodies against ATP6V0A1 (three biological replicates).
Author response image 1

Depletion of HID-1 leads to reduced co-localization with VAMP4, but not synaptotagmin-IV and VAMP2.
(A, C, E) The representative images showing a single β cell stained for Proinsulin (green channel),VAMP4/ synaptotagmin IV / VAMP2 (red channel) and DAPI (blue channel). Each figure shows maximum intensity projection throughout the cell. Top: WT, bottom: KO; Scale bar, 2 µm. (B, D, F) Quantitation of pearson's coefficient between green and red channels in A, C and E (n=15, 3 biological replicates, p <0.001, P=0.601, 0.282, respectively, Mann-Whitney U test). Scale bar, 2 µm.
Videos
Video 1
The morphology of SGs in WT mouse β cells.
https://doi.org/10.7554/eLife.18134.014
Video 2
The morphology of SGs in HID-1 KO mouse β cells.
https://doi.org/10.7554/eLife.18134.015
Video 3
3D reconstruction of the Golgi basket in a representative WT mouse β cell.
https://doi.org/10.7554/eLife.18134.020Download links
A two-part list of links to download the article, or parts of the article, in various formats.
Downloads (link to download the article as PDF)
Open citations (links to open the citations from this article in various online reference manager services)
Cite this article (links to download the citations from this article in formats compatible with various reference manager tools)
HID-1 is required for homotypic fusion of immature secretory granules during maturation
eLife 5:e18134.
https://doi.org/10.7554/eLife.18134


