The hominoid-specific gene TBC1D3 promotes generation of basal neural progenitors and induces cortical folding in mice
- Shanghai Institutes for Biological Sciences, Chinese Academy of Sciences, China
- Chinese Academy of Sciences, China
- Chinese Academy of Sciences University, China
- Shanghai University, China
- State Key Laboratory of Medical Neurobiology, Fudan University, China
- CAS Center for Excellence in Brain Science and Intelligence Technology, China
- ShanghaiTech University, China
Figures
Figure 1 with 2 supplements
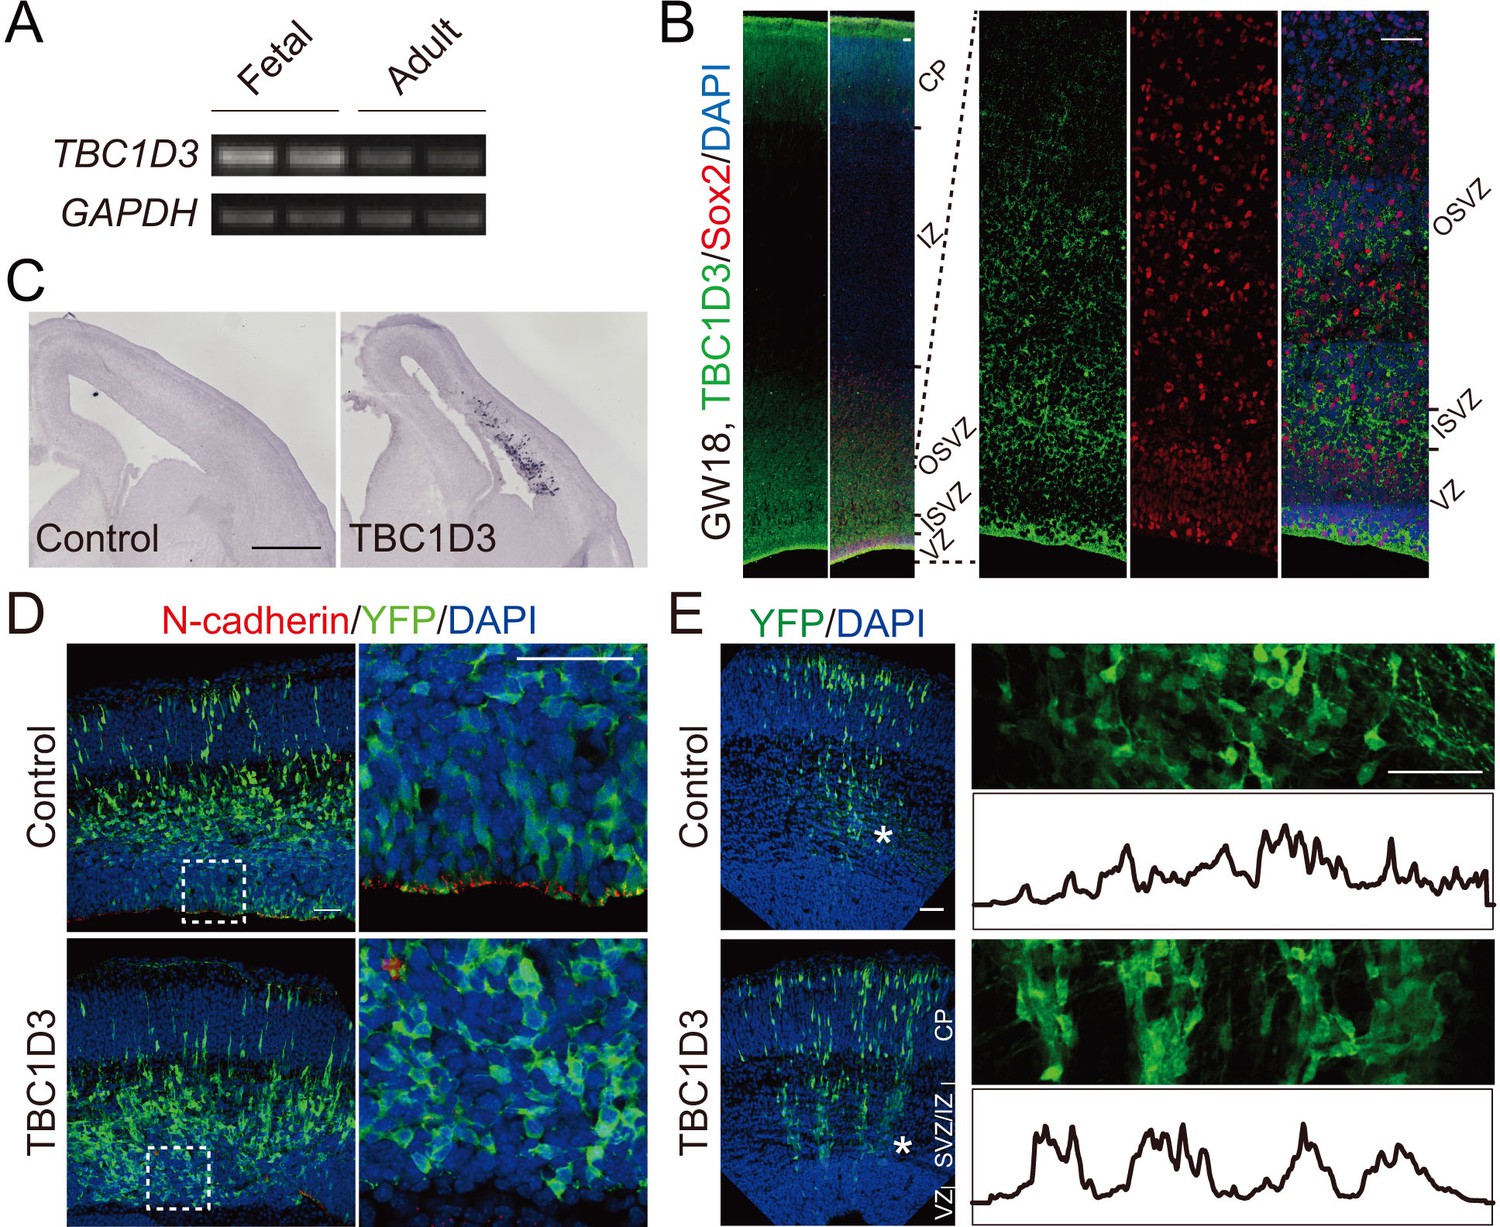
TBC1D3 expression in developing mice cortex disrupts adherens junctions and induces formation of column-like structures.
(A) RT-PCR analysis for the expression of TBC1D3 mRNA in developing (GW26 - 40) and adult (21–29 years) human whole brain with GAPDH as control. (B) The expression pattern of TBC1D3 in fetal human cortex at GW18. VZ, ventricular zone; ISVZ, inner subventricular zone; OSVZ, outer subventricular zone; IZ, intermediate zone; CP, cortical plate. Scale bars, 50 μm. (C–E) In utero electroporation (IUE) of the mouse cerebral cortex was performed at E13.5 and analyzed at E15.5 (C and D) or E16.5 (E). TBC1D3 or control plasmid was mixed with YFP. (C) In situ hybridization analysis for the expression of TBC1D3 in mouse brain sections. Scale bar, 500 μm. (D) Adherens junctions in the ventricular surface were marked by N-cadherin staining. Scale bars, 50 μm. (E) Distribution of GFP+ cells in E16.5 mice cortex. The right panels show magnified regions indicated by asterisks in left panels, with histograms outlining relative fluorescence intensity of tangentially distributed GFP+ cells. Scale bars, 50 μm.
Figure 1—figure supplement 1
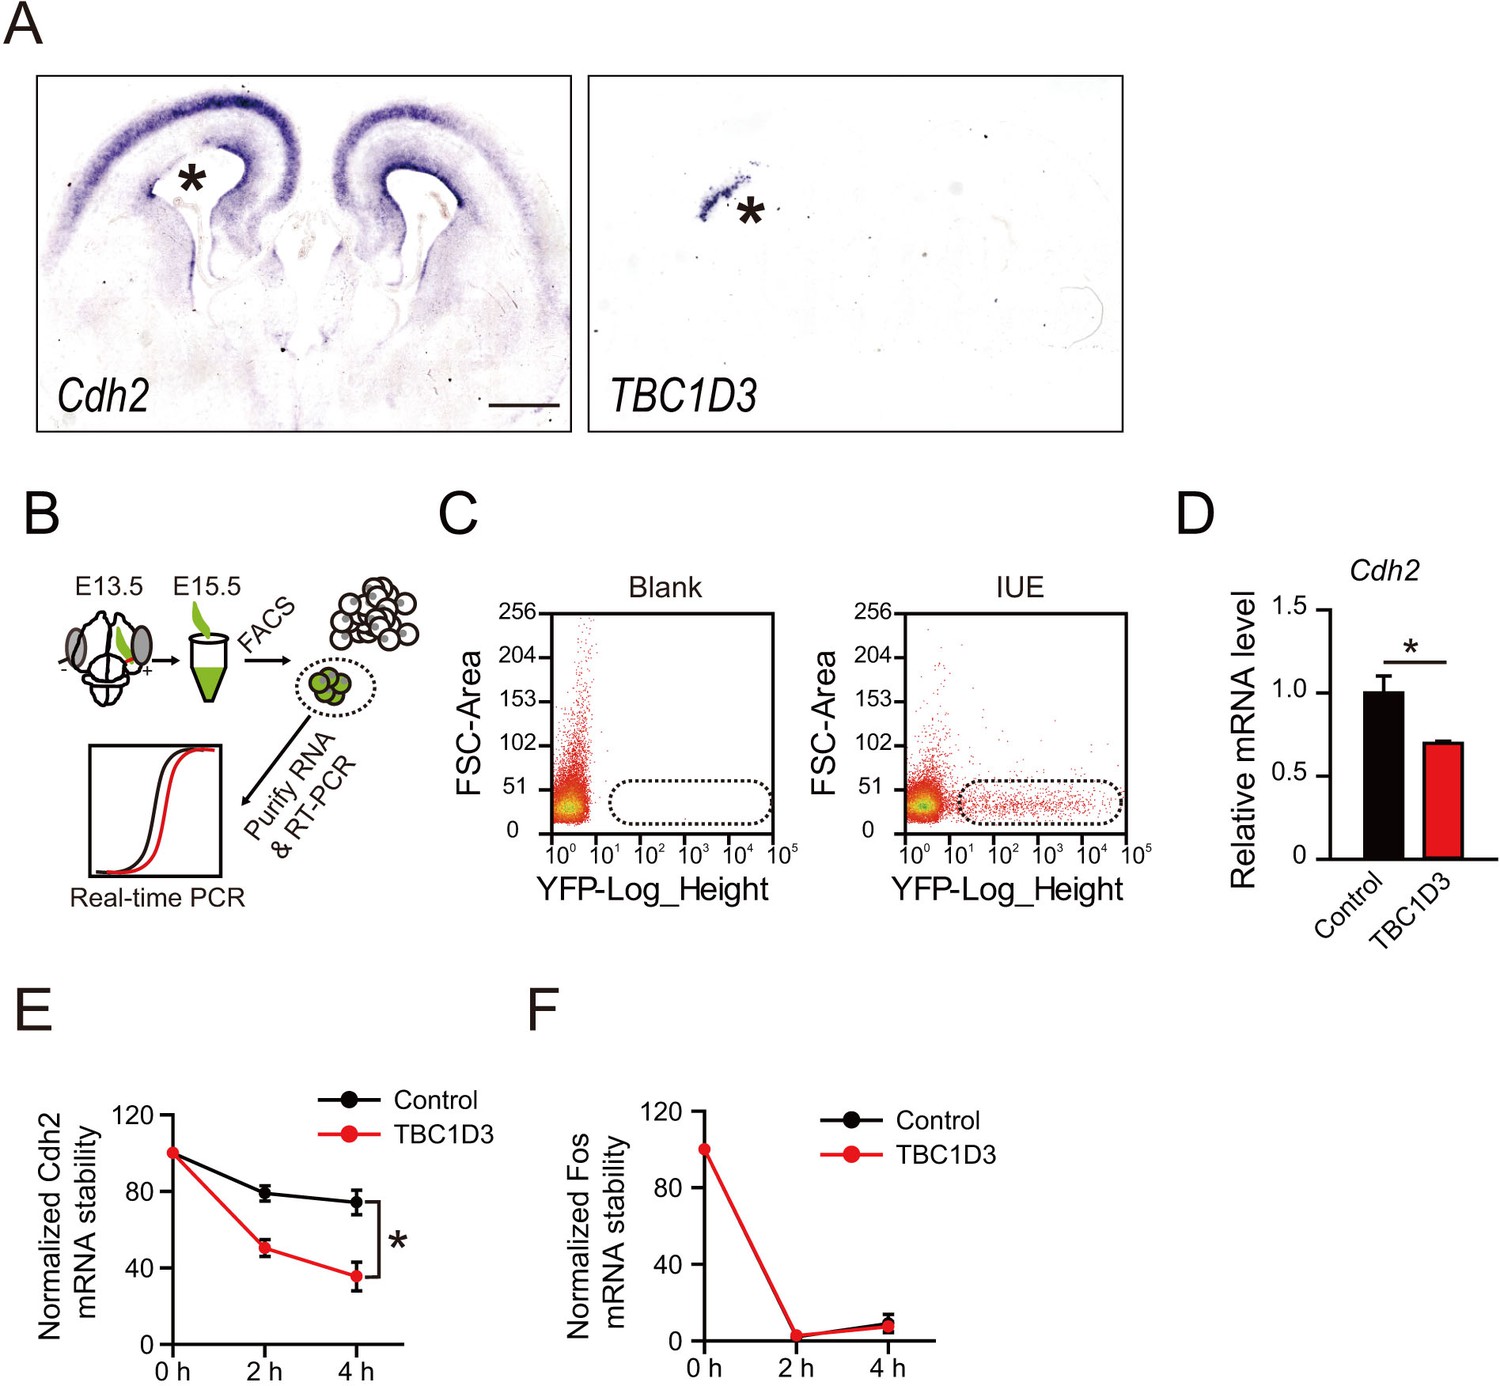
The mRNA level of N-cadherin gene is reduced by TBC1D3 expression in mouse cortex.
(A) In utero electroporation (IUE) of TBC1D3 or control plasmid, together with YFP, in mouse at E13.5 and examined at E15.5. Adjacent sections were subjected to in situ hybridization (ISH) to determine the mRNA level of N-cadherin (Cdh2) (left panel) or TBC1D3 (right panel). Asterisks indicate areas electroporated with TBC1D3. Scale bar, 50 μm. (B) Schematic diagram of electroporation, FACS sorting and real-time PCR analysis. (C) FACS sorting of YFP+ cells. Cells satisfied to the level of YFP expression (boxed areas) were selected for further RNA extraction and analysis. Blank, cells from cortical tissues without IUE. (D) Relative expression levels of Cdh2 relative to GAPDH, analyzed by real-time PCR, with control group normalized as 1 (n = 3 for each analysis; control: mean = 1.0, SEM = 0.1; TBC1D3: mean = 0.7, SEM = 0.013). p = 0.018. (E and F) Stability of Cdh2 or Fos mRNA relative to that of Hprt in ReNeuron cells, which were transfected with TBC1D3 or vehicle plasmid and treated with actinomycin D for indicated time. Data are shown as mean ± SEM of the percentage of remaining mRNA with the value from 0 hr treatment normalized as 100 (n = 3 experiments for each time point). Note the significant difference (p = 0.025) between Cdh2 mRNA levels in control (mean = 74.22, SEM = 6.41) and TBC1D3 (mean = 35.51, SEM = 6.13) groups 4 hr after actinomycin D treatment.
Figure 1—figure supplement 2
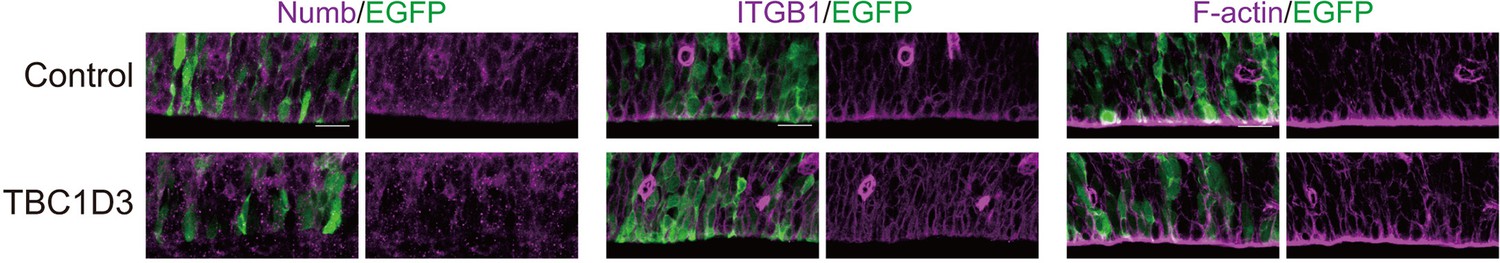
Dislocalization of adherens junctions proteins upon TBC1D3 expression in the VZ.
E13.5 mouse brain was subject to IUE with pCAGGS-TBC1D3-IRES-EGFP or vehicle control plasmids, following by staining at E15.5 with antibodies of Numb or integrin beta 1 (ITGB1), or fluorescein-labeled phalloidin for F-actin. Scale bars, 20 μm.
Figure 2 with 4 supplements
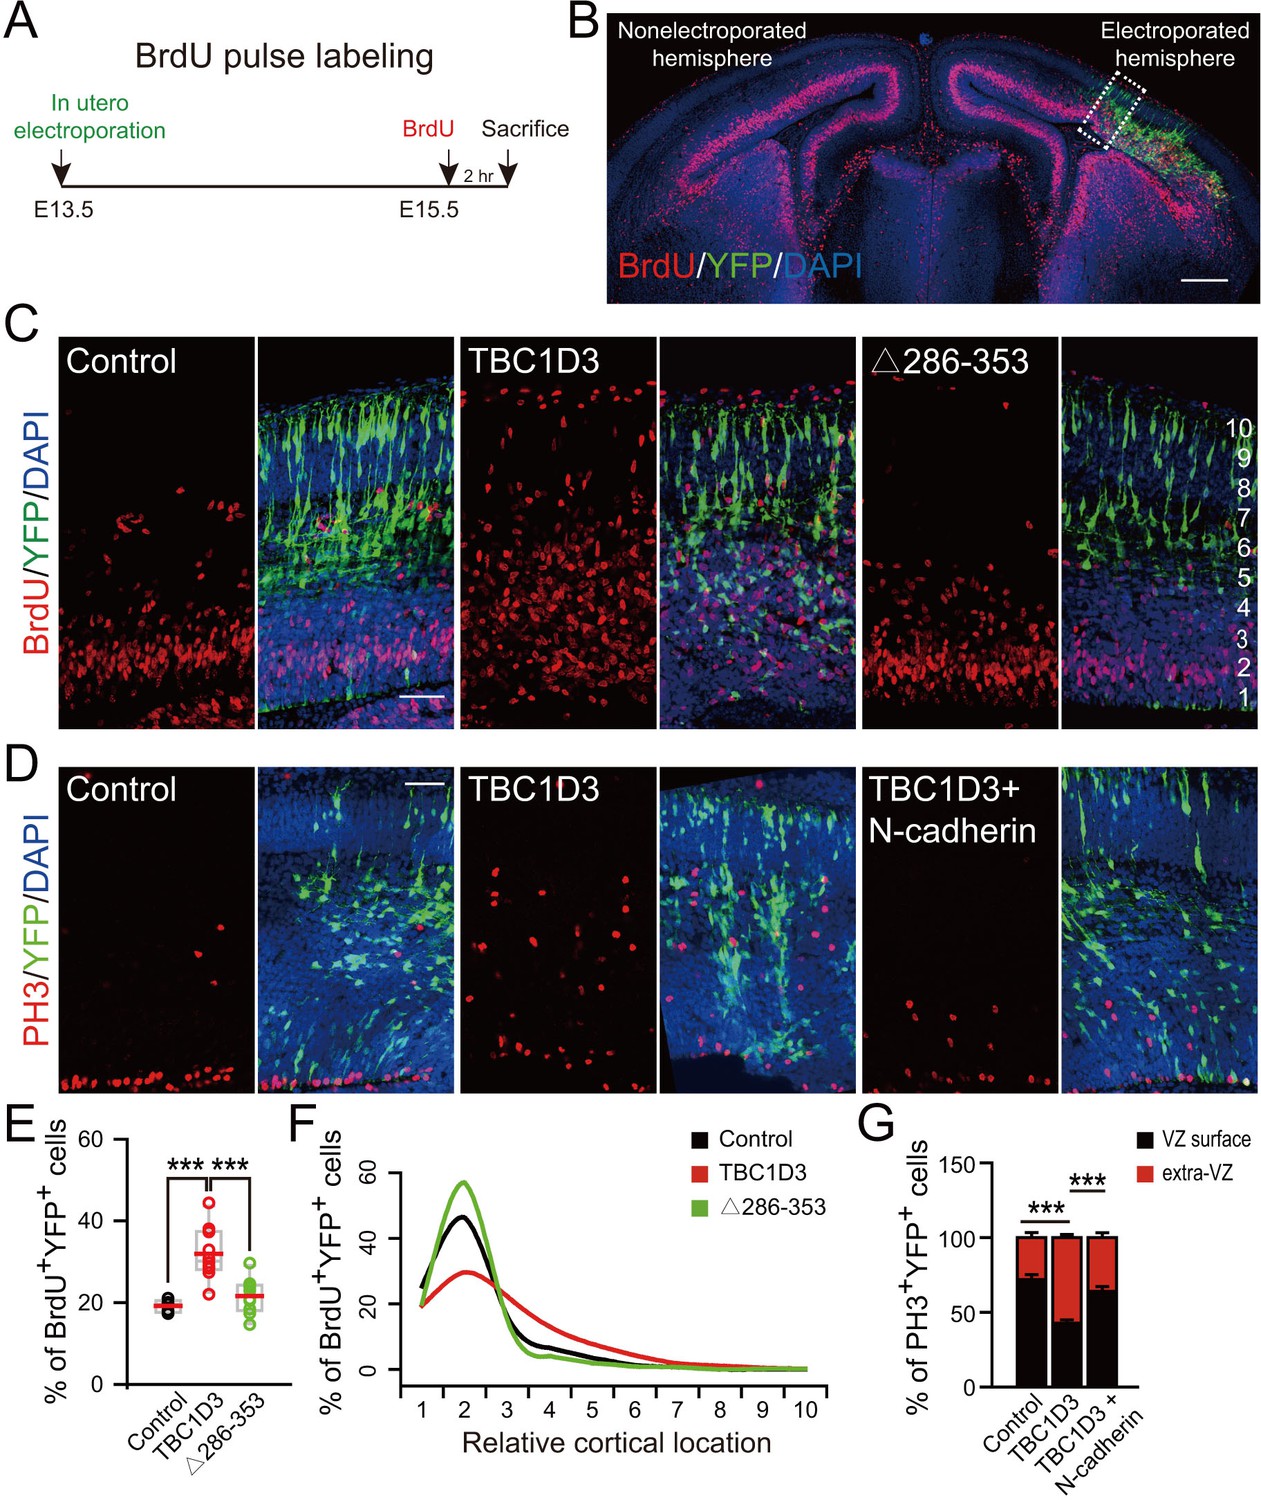
Expression of TBC1D3 induces an increase in cell proliferation in basal regions of developing mouse cortex.
(A) Schematic of BrdU pulse labeling. (B) E15.5 whole brain section incorporated with BrdU after IUE at E13.5. Dashed rectangle indicates cortical area for quantification. Scale bar, 200 μm. (C) BrdU incorporation in mice subjected to IUE with indicated plasmids. Scale bar, 50 μm. (D) Staining for phosphorylated Histone H3 (PH3) in E15.5 mice subjected to IUE at E13.5. Scale bar, 50 μm. (E) Quantification for the percentage of BrdU+ cells among electroporated YFP-labeled cells (control: n = 5 mice, mean = 19.18, SEM = 0.69; TBC1D3: n = 10 mice, mean = 31.91, SEM = 2.02; Δ286–353: n = 9 mice, mean = 21.62, SEM = 1.36). Respective p-values are 0.0003 (control vs TBC1D3) and 0.0004 (TBC1D3 vs Δ286–353). (F) Mean cortical distribution of BrdU+ cells among electroporated YFP-labeled cells (n = 5 mice). (G) Quantification for the percentage of PH3+ cells among electroporated YFP-labeled cells attached to ventricular surface (VZ surface) or out of ventricular zone (extra-VZ). Total number of PH3+ cells in VZ surface and extra-VZ were normalized to 100 for each group (n = 8 mice, mean = 28.10, SEM = 3.43 for extra-VZ of control; n = 10 mice, mean = 57.22, SEM = 2.24 for extra-VZ of TBC1D3; n = 8 mice, mean = 35.99, SEM = 3.26 for extra-VZ of TBC1D3 plus N-cadherin). ***p<0.001.
Figure 2—figure supplement 1
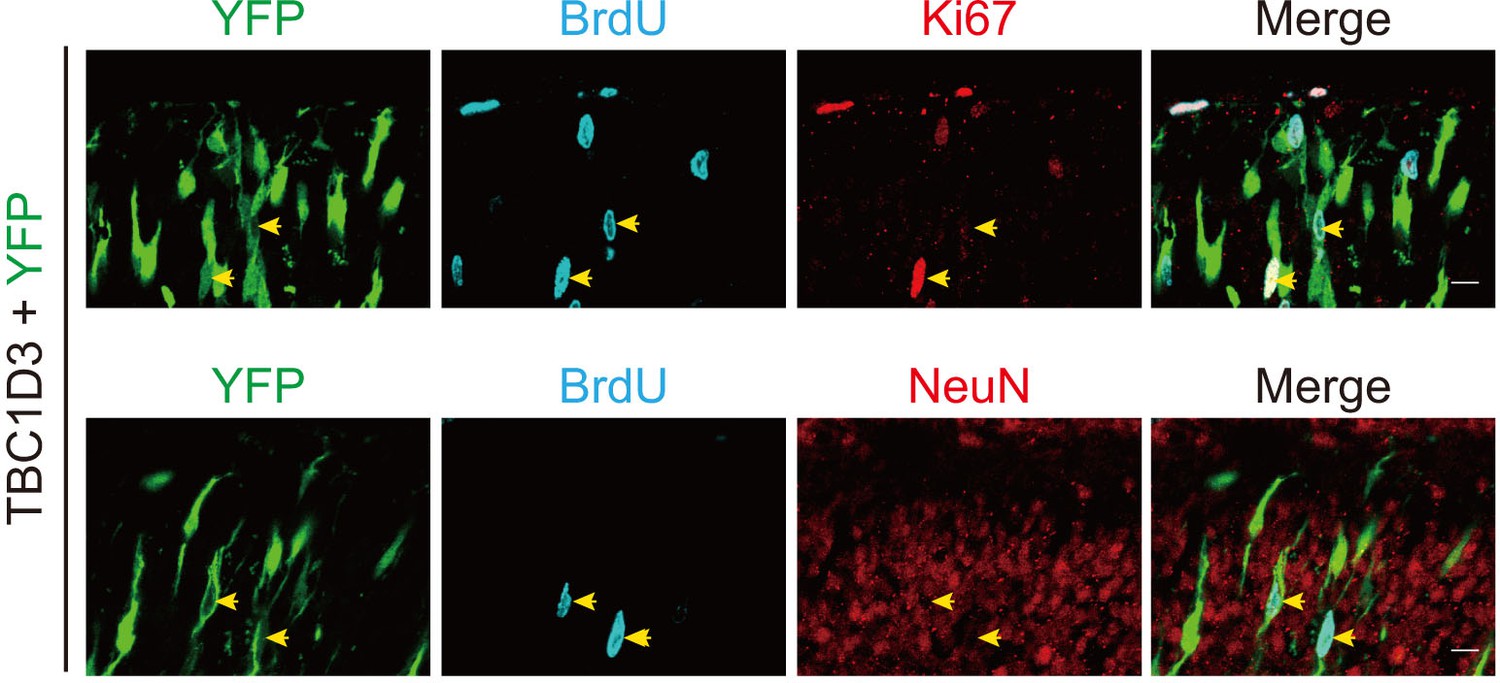
Colocalization between BrdU and Ki67 in TBC1D3-expressing BPs.
E13.5 mouse brain was subjected to IUE with TBC1D3 and YFP, followed by BrdU injection for 2 hr at E15.5, and immunostaining with Ki67 or NeuN antibody. Yellow arrows show BrdU+YFP+ cells co-labeled with Ki67 (top row) but not NeuN (bottom row) in the cortical plate. Scale bars, 10 μm.
Figure 2—figure supplement 2

Cell autonomous and non-cell autonomous effects of TBC1D3 on neural progenitors.
E13.5 mice were subjected to IUE with pCAGGS-TBC1D3-IRES-EGFP plasmid or pCAGGS-IRES-EGFP as the control, followed by 2 hr BrdU incorporation (A) or staining with PH3 antibody (C) at E15.5. Number of BrdU+ or PH3+ cells among EGFP+ or EGFP- cells, in apical or basal regions, were analyzed to determine cell autonomous or non-cell autonomous effects (B and D). Data are presented as mean ± SEM in each group (n = 7 brains for control, n = 10 brains for TBC1D3). **p<0.01, ***p<0.001. White arrows indicate EGFP+BrdU+ or EGFP+PH3+ cells. Scale bar, 20 μm. Apical, ventricular zone; Basal, regions outside of ventricular zone.
Figure 2—figure supplement 3

Detachment of vRGs induced by blocking N-cadherin-mediated adhesion does not promote generation of BPs.
(A) E13.5 mice were subjected to IUE with Myc-EC1 or vehicle plasmid, together with YFP plasmid to mark cell morphology. Dash lines indicate endfeet of vRG cells attached to the ventricular surface of E14.5 mouse cortex. Scale bar, 20 μm. (B) Quantification for the percentage of YFP+ cells with endfeet attached to the ventricular surface (control: n = 9 slices, mean = 13.98, SEM = 1.61; EC1: n = 10 slices, mean = 5.21, SEM = 1.15). p = 0.0003. (C) E15.5 mouse brain subjected to IUE at E13.5 was labeled by BrdU for 2 hr and stained with indicated antibody. Scale bar, 20 μm. (D–F) Quantification for the percentage of BrdU+YFP+ (control apical: mean = 39.51, SEM = 2.68; EC1 apical: mean = 44.26, SEM = 1.71; control basal: mean = 4.19, SEM = 0.73; EC1 basal: mean = 5.40, SEM = 0.91), or PH3+YFP+ (control apical: mean = 6.48, SEM = 0.80; EC1 apical: mean = 8.16, SEM = 0.69; control basal: mean = 0.29, SEM = 0.19; EC1 basal: mean = 0.47, SEM = 0.24) cells in apical or basal regions or total YFP+ cells in basal regions (control: mean = 57.53, SEM = 1.81; EC1: mean = 59.08, SEM = 2.28). No significant difference was observed between the EC1 and the control group (n = 7 slices for control, n = 9 slices for EC1).
Figure 2—figure supplement 4
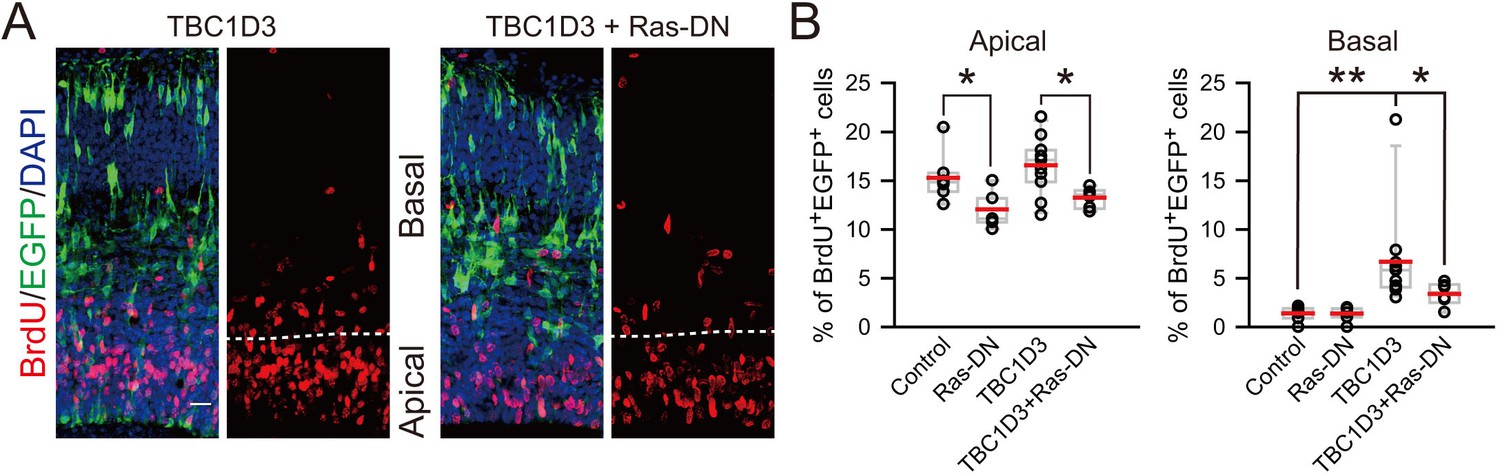
Effect of dominant-negative form of Ras on proliferation of TBC1D3-induced BPs.
(A) E13.5 mice were subjected to IUE with TBC1D3, Ras-DN (RasS17N), TBC1D3 plus Ras-DN, or control plasmids, mixed with EGFP, followed by BrdU incorporation for 2 hr at E15.5 and staining. Shown are representative images of TBC1D3 and TBC1D3 plus Ras-DN groups. Scale bar, 20 μm. (B) Quantification for the percentage of BrdU+ among total EGFP+ cells in apical (control: n = 7 mice, mean = 15.30, SEM = 0.94; Ras-DN: n = 7 mice, mean = 12.07, SEM = 0.67; TBC1D3: n = 11 mice, mean = 16.59, SEM = 0.87; TBC1D3 plus Ras-DN: n = 6 mice, mean = 13.26, SEM = 0.41; p = 0.037, control vs Ras-DN; p = 0.023, TBC1D3 vs TBC1D3 plus Ras-DN.) or basal regions (n = 7 mice, mean = 1.40, SEM = 0.28 for control; n = 7 mice, mean = 1.39, SEM = 0.26 for Ras-DN; n = 11 mice, mean = 6.69, SEM = 1.52 for TBC1D3; n = 6 mice, mean = 3.40, SEM = 0.48 for TBC1D3 plus Ras-DN). p = 0.005, control vs TBC1D3; p = 0.049 TBC1D3 vs TBC1D3 plus Ras-DN.
Figure 3 with 2 supplements
TBC1D3 expression in the mouse cortex elevates proliferative oRG cells.
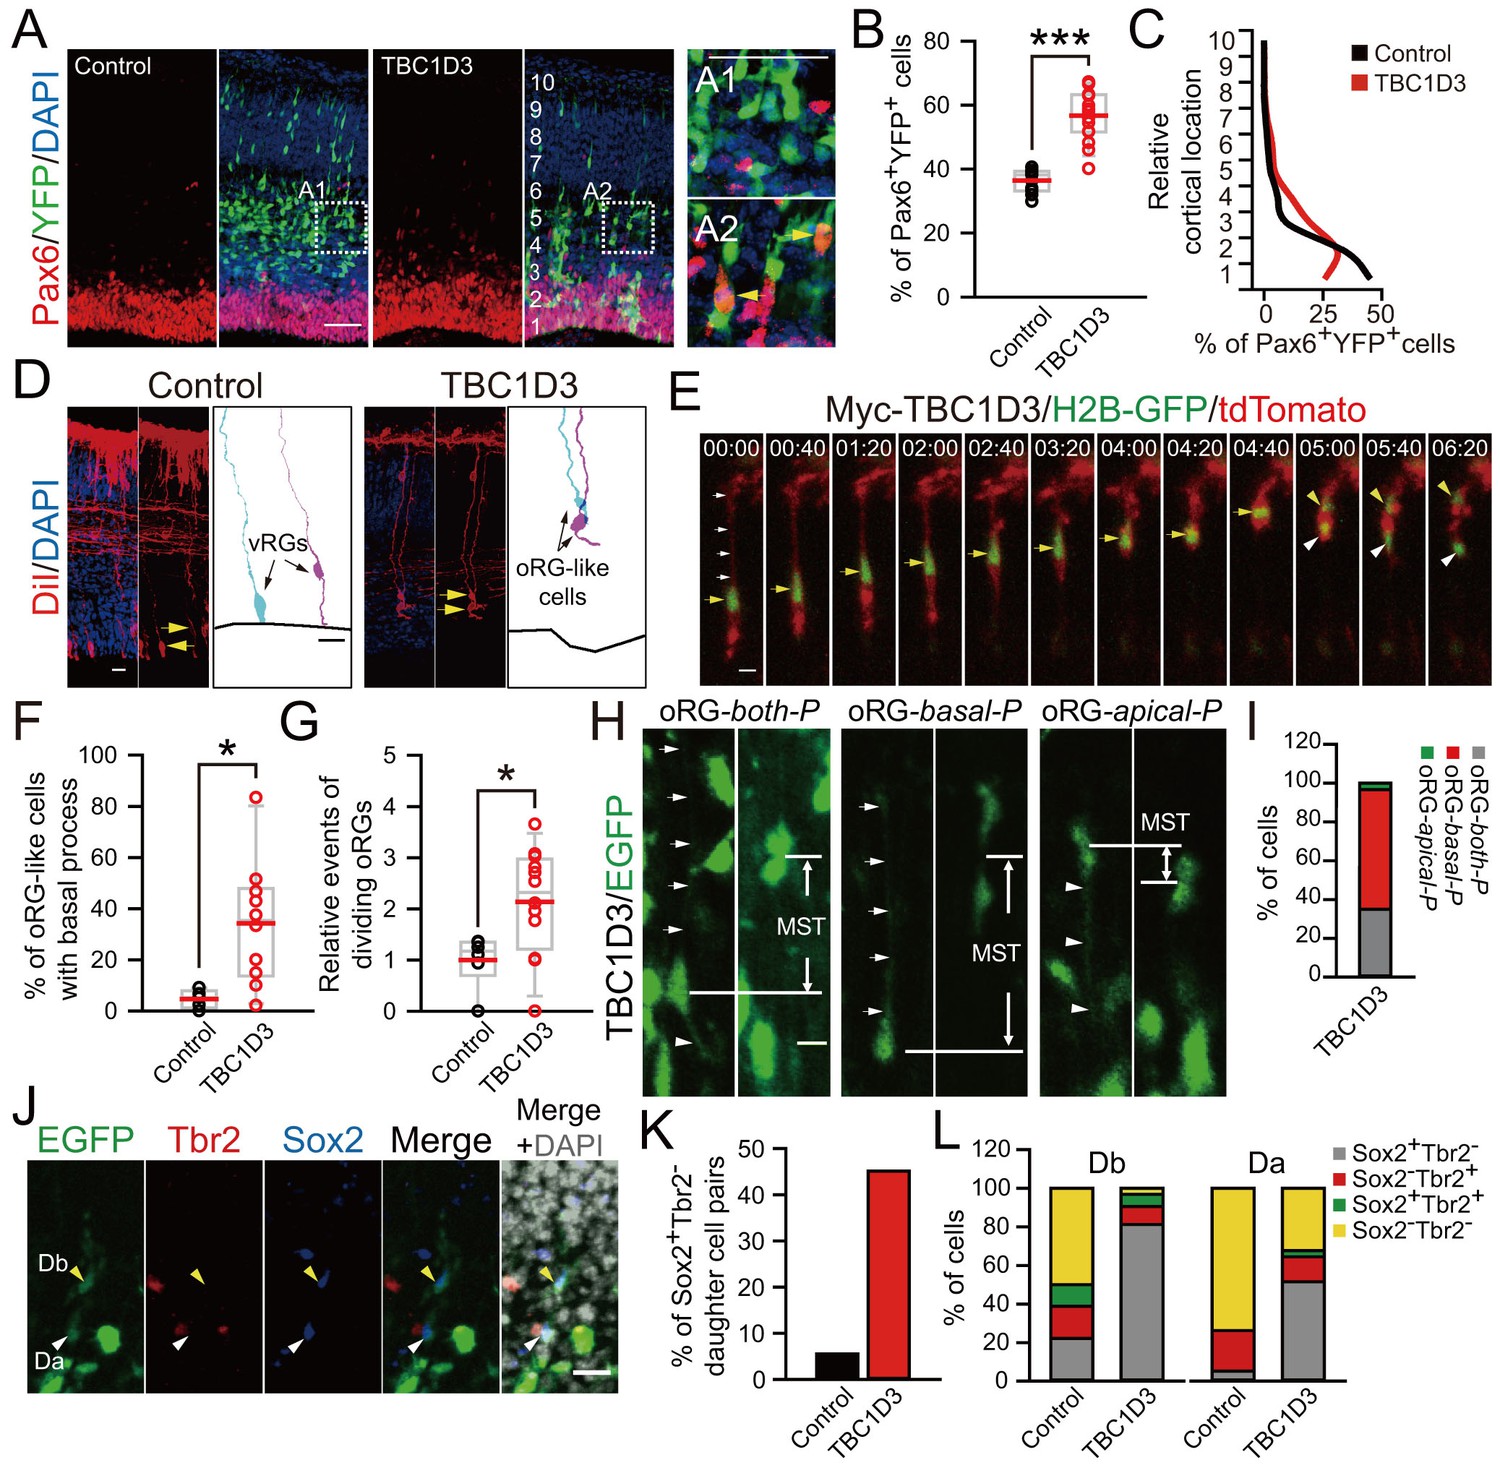
(A) Staining for Pax6 in E15.5 mice after IUE at E13.5 with pE/nestin-TBC1D3 or pE/nestin (control), together with YFP to mark cell morphology. Scale bars, 50 μm. (B) Quantification for the percentage of Pax6+YFP+ cells (control: n = 10 mice, mean = 36.40, SEM = 1.09; TBC1D3: n = 16 mice, mean = 56.68, SEM = 1.97). p<0.0001. (C) Mean distribution of Pax6+YFP+ cells. (D) DiI-labeling of bipolar ventricular RG cells (vRGs) and oRG-like cells with a basal process attaching the pial surface in E15.5 mouse cortex after IUE at E13.5. Scale bars, 20 μm. (E) Time-lapse imaging of TBC1D3-expressing oRG cells (yellow arrows) undergoing division in cultured E14.5 mouse slices after IUE with pCS2-Myc-TBC1D3 and pCAG-H2BGFP-2A-tdTomato at E13.5. H2B-GFP represents cell nucleus. Scale bar, 10 μm. (F) Quantification for the percentage of oRG-like cells with a basal process attached to the pial surface and soma located in SVZ or IZ regions, among total RGs including vRGs with soma located in the VZ (control: n = 5 mice, mean = 4.67, SEM = 1.60; TBC1D3: n = 10 mice, mean = 34.21, SEM = 7.56). p = 0.018. (G) Quantification for the relative number of basal progenitors with oRG-like divisions, identified by time-lapse imaging in (E), per unit of tangential length of the VZ electroporated (control: n = 6 slices, mean = 1.00, SEM = 0.21; TBC1D3: n = 12 slices, mean = 2.14, SEM = 0.30). p = 0.025. (H and I) Types of TBC1D3-expressing oRG-like cells before division [n = 120 cells in (I)]. Scale bar, 10 μm. (J) Immunostaining for Tbr2 and Sox2 in the brain slices after time-lapse imaging. Note daughter cells toward basal (Db) or apical (Da) direction upon division. Scale bar, 20 μm. (K and L) Quantification for Sox2+Tbr2- daughter cell pairs (K) and daughter cells with indicated marker combinations (L) (n = 18 cells for control, n = 31 cells for TBC1D3).
Figure 3—figure supplement 1
oRG-like cells and IPs increase in the basal region of TBC1D3-expressing mouse cortex.
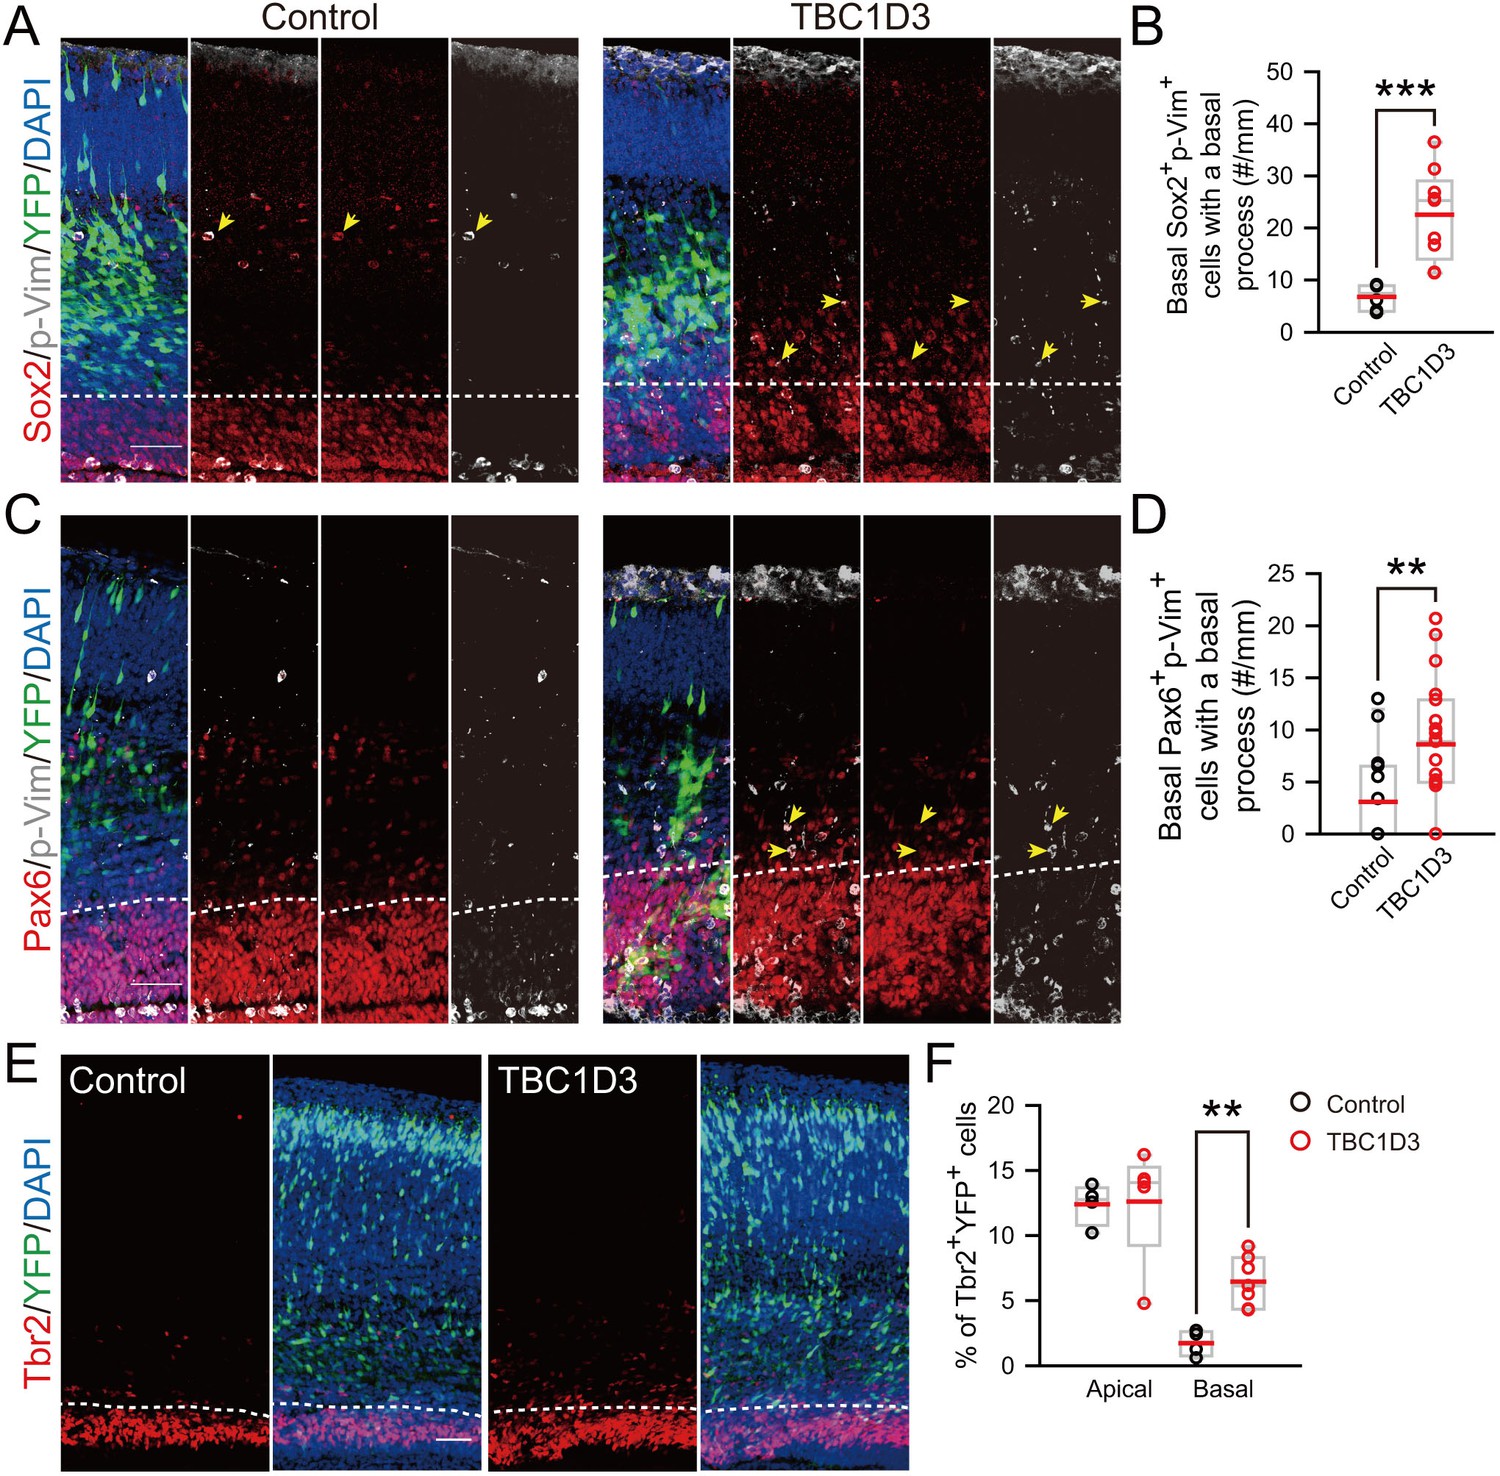
(A and C) Staining for phospho-Vimention (p-Vim) and Sox2 (A) or p-Vim and Pax6 (C) in E15.5 mice subjected to IUE at E13.5. Dash lines indicate the boundary between basal (outer VZ) and apical (VZ) regions in mouse neocortex. Note the cells double positive for p-Vim and Sox2 or Pax6 (yellow arrows) with the basal process with coherent patterned intermittent p-Vim signals. Scale bars, 50 μm. (B and D) Quantification for the number of p-Vim+ Sox2+ (control: n = 6 mice, mean = 6.79, SEM = 1.02; TBC1D3: n = 9 mice, mean = 22.53, SEM = 2.91; p = 0.0009) or p-Vim+ Pax6+ (control: n = 15 mice, mean = 3.10, SEM = 1.16; TBC1D3: n = 19 mice, mean = 8.63, SEM = 1.39; p = 0.009) cells with basal processes in the basal region of electroporated cortex per unit length along the VZ surface. (E) Tbr2 staining for E17.5 mouse brains, which were subjected to IUE at E13.5 with TBC1D3 or vehicle control, together with YFP. Dash lines indicate boundaries between apical (VZ) and basal (outer VZ) regions. Scale bar, 50 μm. (F) Quantification for the percentage of Tbr2+ cells among electroporated YFP+ cells in apical (control: n = 4 mice, mean = 12.40, SEM = 0.79; TBC1D3: n= 7 mice, mean = 12.61, SEM = 2.01; p = 0.286) and basal regions (control: mean = 1.73, SEM = 0.49; TBC1D3: mean = 6.45, SEM = 0.72; p = 0.006).
Figure 3—figure supplement 2

Birth dating analysis for division patterns of neuroprogenitors after IUE.
(A) Schematic of BrdU/EdU double labeling. (B) E13.5 mice were subjected to IUE with TBC1D3 or vehicle plasmid, together with YFP plasmid, and then injected with BrdU at E14.5 and EdU at E15.5, to label dividing cells sequentially. Boxed areas indicate apical [(A1) for control, (A2) for TBC1D3] or basal [(B1) for control, (B2) for TBC1D3] regions analyzed. Note the cells double labeled by BrdU and EdU in electroporated YFP-positive cells (yellow arrowheads). Scale bars, 50 μm. (C) Quantification for the percentage of BrdU+EdU+ cells among YFP+BrdU+ cells in apical and basal regions. Apical: n = 10 mice, mean = 18.63, SEM = 3.41 for control, n = 14 mice, mean = 23.37, SEM = 2.0 for TBC1D3, p = 0.215; Basal: mean = 5.22, SEM = 1.48 for control, mean = 10.47, SEM = 1.79 for TBC1D3, p = 0.045.
Figure 4
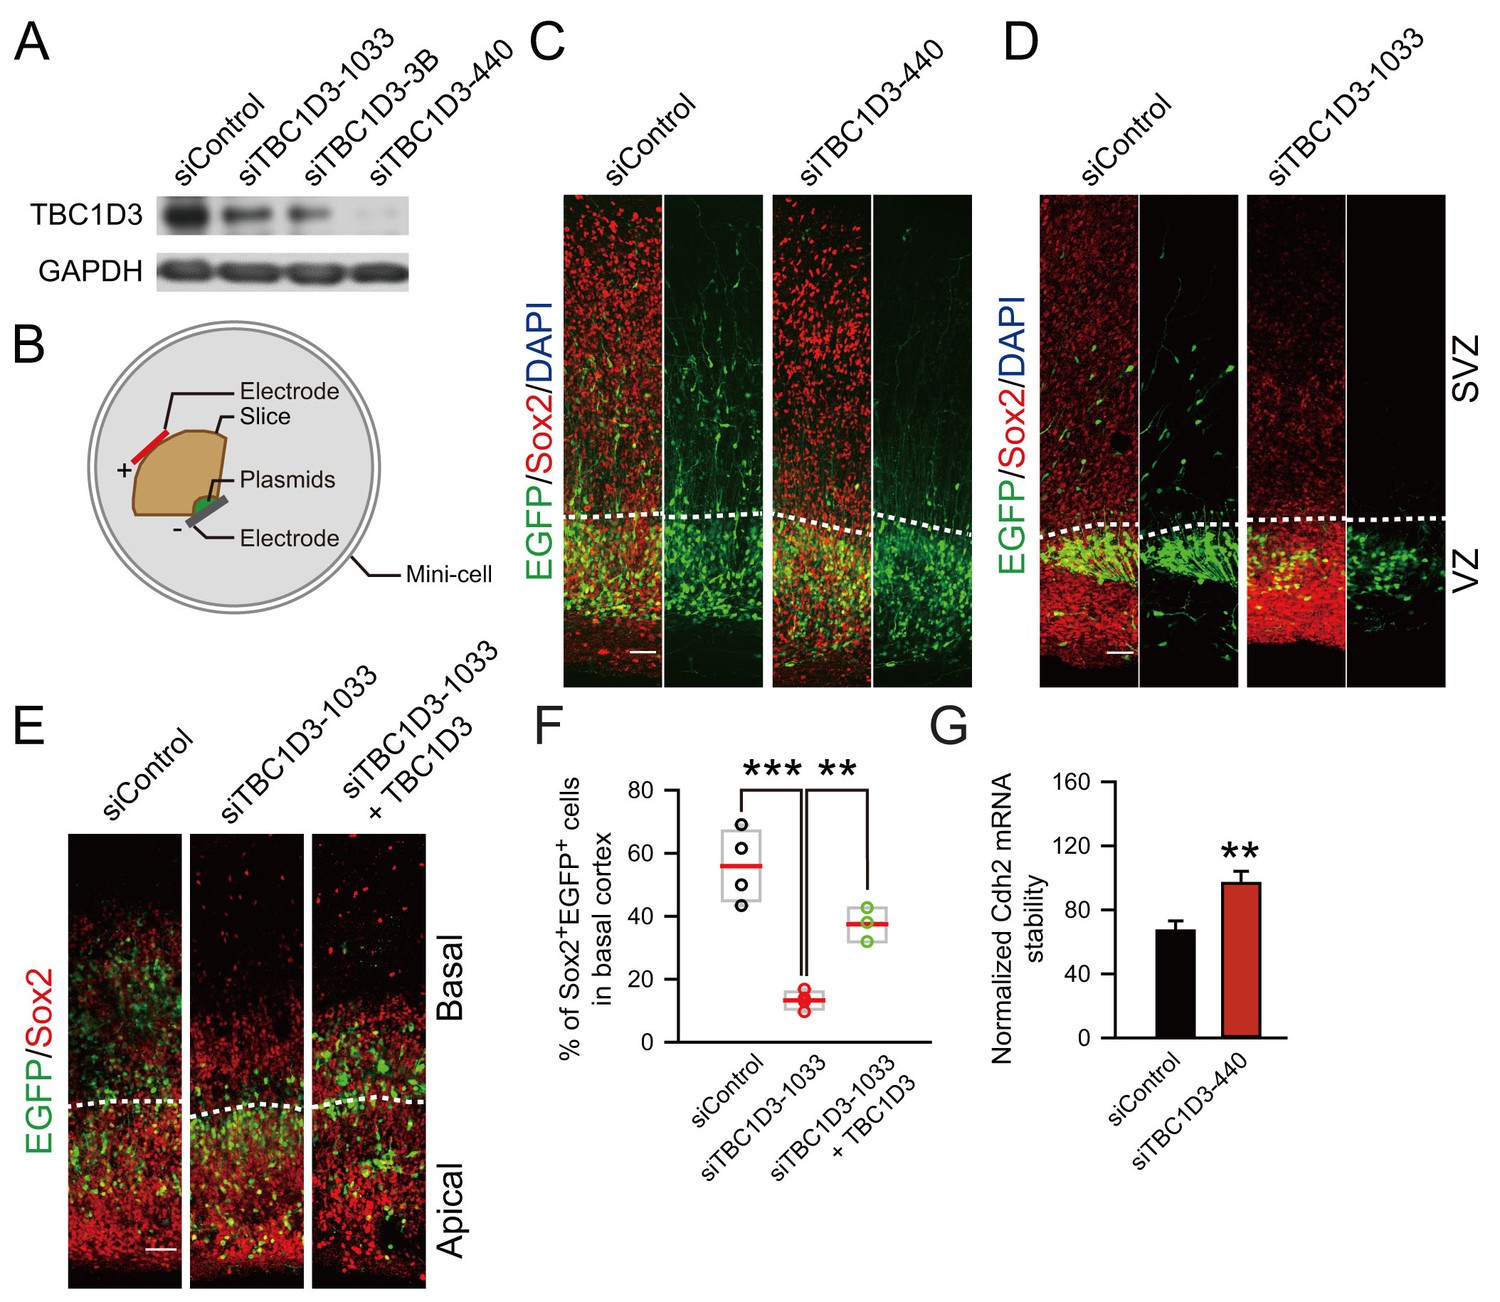
Knockdown of TBC1D3 in human vRGs inhibits the generation of oRGs.
(A) Detection of TBC1D3 protein levels in Hela cells transfected with pSuper-siTBC1D3 plasmids, with a scramble sequence as the control. (B) Paradigm of culture and electroporation of human brain slice. (C–E) The VZ of human brain slices at GW14.5 (C), GW17.1 (D), GW13.5 (E) were transfected with pSuper-siTBC1D3 plasmids or a plasmid encoding scrambled sequence as the control, without or with co-transfection with TBC1D3 expression plasmid (pCS2-Myc-TBC1D3) by electroporation method as described in (B), followed by staining with Sox2 antibody at 72 hr post electroporation. Scale bars, 50 μm. (F) Quantification for the percentage of Sox2+ cells among total EGFP+ cells in basal regions (control: n = 4 slices, mean = 55.91, SEM = 5.76; siTBC1D3: n = 4 slices, mean = 13.32, SEM = 1.46; siTBC1D3 plus TBC1D3: n = 3 slices, mean = 37.47, SEM = 3.12). p = 0.0002, control vs siTBC1D3; p = 0.004, siTBC1D3 vs siTBC1D3 plus TBC1D3. (G) Human ReNeuron cells were transfected with siTBC1D3 or control plasmid for 3 days followed by treatment with actinomycin D for 4 hr. The mRNA levels of Cdh2 in ReNeuron cells after actinomycin D treatment were quantified (control: n = 6 experiments; mean = 66.99, SEM = 6.21; siTBC1D3: mean = 96.62, SEM = 7.62; p = 0.003), normalized to that in cells with 0 hr of actinomycin D treatment.
Figure 5 with 4 supplements

Cortical folding and gyrification induced by TBC1D3 expression in mice.
(A) E13.5 mice were subjected to IUE with pE/nestin-TBC1D3 or vehicle control plasmids, together with RFP to mark electroporated cells, and analyzed at the indicated time. White arrows indicate cortical folds. Scale bars, 200 μm. (B and C) Slices from WT or TG mice at E14.5 (B) or E18.5 (C) were stained for Cux1 and Ctip2. Note the protrusions (white arrows) in TG mice (B2 and C2) compared to smooth surfaces in WT mice (B1 and C1). Scale bars, 50 μm. (D) Images from whole mount P3.5 WT and TG brains. Note the convoluted cortical surfaces indicated by red asterisks in TG mice. Scale bar, 1 mm. (E and F) Nissl staining of sagittal sections of TG or WT mice at P3.5 (E) or adult stage (F, 3 months). Note the apparent gyrus-like structures (black arrows) in boxed areas. Scale bars, 1 mm (E and F) or 50 μm (E1 and E2). (G and H) Immunostaining for Cux1 and Ctip2 (G) or NeuN and GFAP (H) in the adult WT and TG mouse brain sections. Note the folded cortical surfaces outlined by dash lines; Scale bars, 1 mm.
Figure 5—figure supplement 1
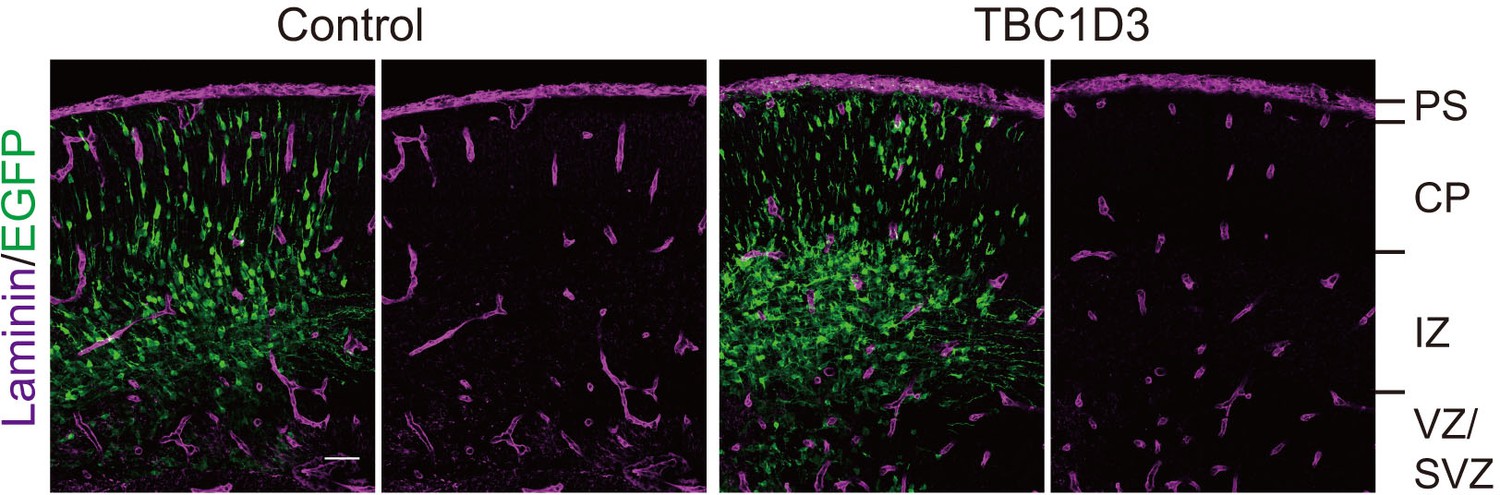
TBC1D3 electroporation has no effect on the pial basement membrane integrity.
Shown are representative images of E15.5 brain slices (IUE with pCAGGS-TBC1D3-IRES-EGFP or control vehicle at E13.5) stained with laminin antibody. PS, pial surface; CP, cortical plate. Scale bar, 50 μm.
Figure 5—figure supplement 2

Generation of TBC1D3 transgenic mouse.
(A) Schematic structure of the construct used for generating TBC1D3 transgenic mice. The expression of TBC1D3 was under the control of promoter composed of the second intron enhancer of rat nestin gene and the minimum promoter of heat shock protein 68 (hsp68) (Kawaguchi et al., 2001). P1 and P2, primers used for genotyping. (B) Relative copy numbers of TBC1D3 genes inserted in the genome of transgenic mouse founders (10#, 14#, 51#) were determined by real-time PCR using the tail genomic DNA as template. The number of inserted TBC1D3 gene was normalized to that of glcoe4 (n = 8 mice, mean = 3.15, SEM = 0.47 for 10#; n = 2 mice, mean = 0.54, SEM = 0.03 for 14#; n = 4, mean = 0.46, SEM = 0.03 for 51#). (C) Protein levels of TBC1D3 in brains of E12.5 TG mouse lines (L10, L51), from founders 10# or 51#, were measured by immunoblot (left panel) and quantified (right panel). GAPDH was used as the internal control (L10: n = 4 mice, mean = 2.92, SEM = 0.72; L51: n = 5 mice, mean = 1.00, SEM = 0.08). (D) Immunostaining for the expression of TBC1D3 in E12.5 TG (L10) mouse brain. Note the magnified area (D1) showing cytosol distribution of TBC1D3. Scale bars, 200 μm (D) and 20 μm (D1). (E) TBC1D3 protein levels in TG mice (L10) at indicated developmental stages. Shown in the histogram is mean of 2 mice in each stage with GAPDH as control.
Figure 5—figure supplement 3
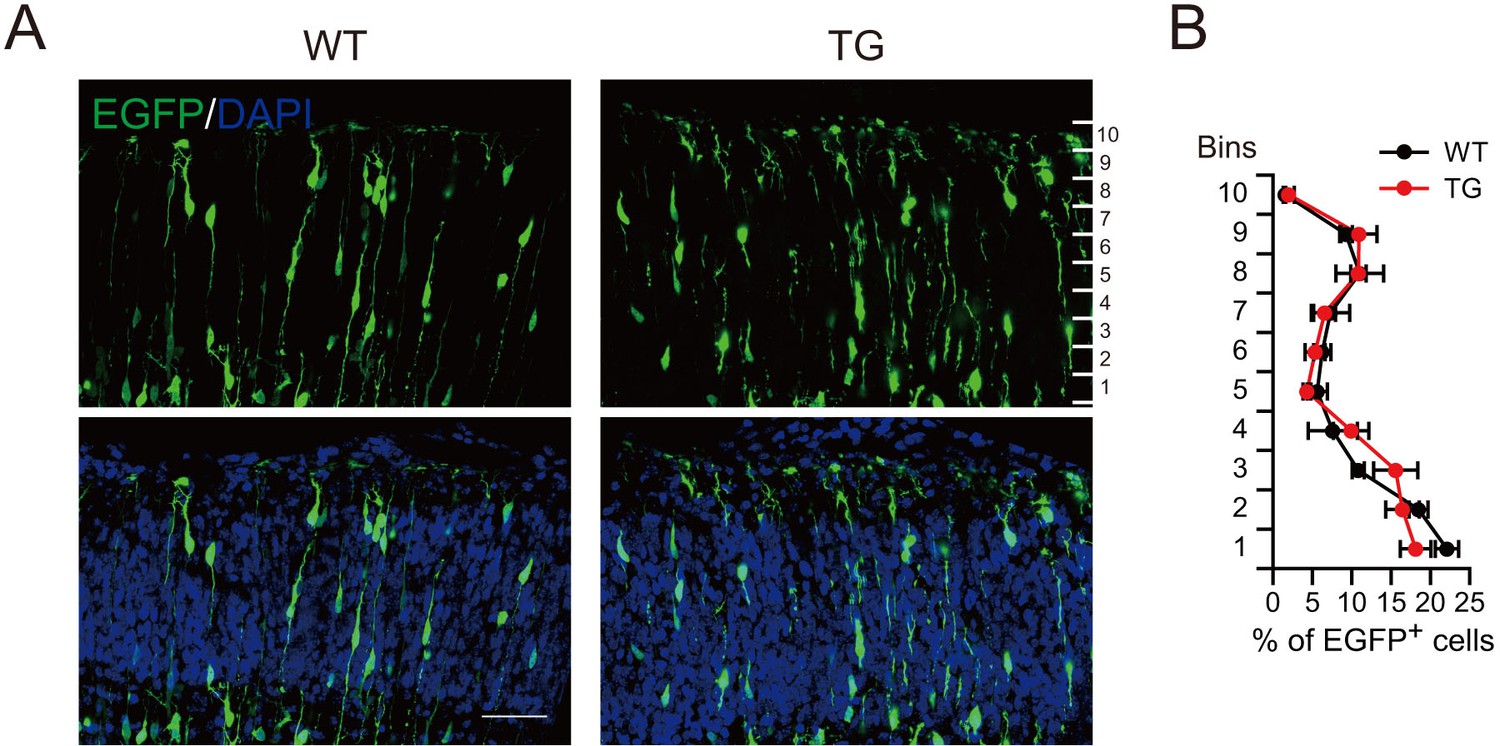
Normal neuronal migration in the cortical plate of TG mice.
(A) E13.5 WT or TG mice were subjected to IUE with EGFP expression plasmids, and the cortical plates of mice at E16.5 were examined for the distribution of EGFP+ cells. (B) Percentage of EGFP+ cells in different vertical layers of the cortical plate in WT or TG mice (n = 3 mice for WT, n = 4 mice for TG). Scale bar, 50 μm.
Figure 5—figure supplement 4
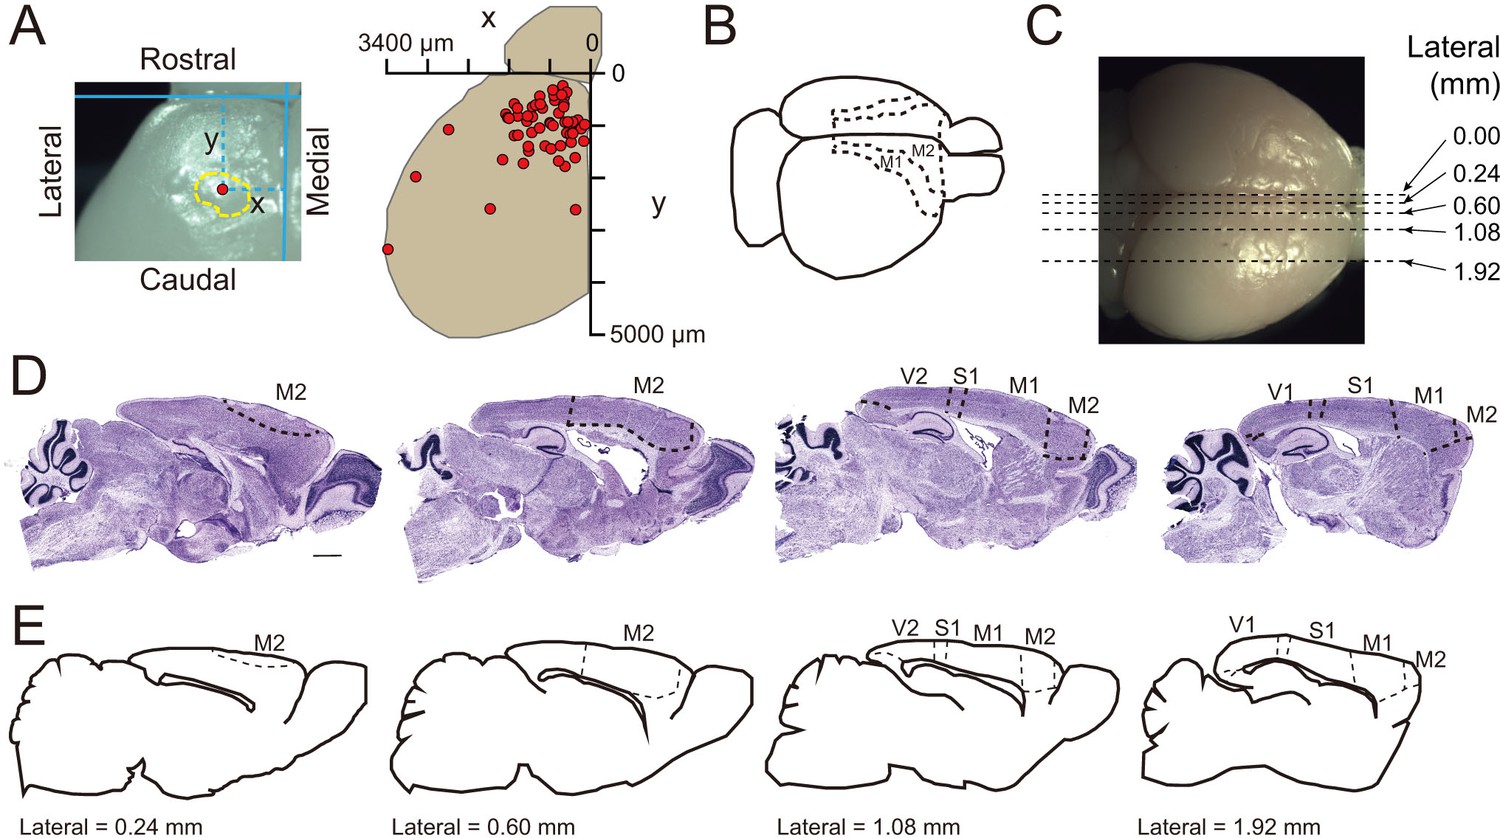
Cortical folding mainly occurs in the motor cortex of TBC1D3-transgenic mice.
(A) Top view of a P3.5 TG mouse brain hemisphere shows the position of a cortical fold (left panel) and a summary distribution of cortical folds (right panel) on the brain surfaces from 3 TG mice at P3.5. Red dots indicate the cortical folds. (B) Schematic locations of the primary (M1) and secondary (M2) cortex in mice. (C) Schematic of section positions (dash lines) in the whole brain visualized by Nissl staining in (D). (D) Nissl staining in four consecutive brain sections, along the medial-lateral axis, of adult TG mice. S1, primary somatosensory cortex. V1, primary visual cortex. V2, secondary visual cortex. Scale bar, 1 mm. (E) Parallel sagittal section schematics corresponding to slices in (D) according to the Allen Brain Atlas. Dash lines indicate the boundary of brain regions.
Figure 6 with 3 supplements
Cortical basal progenitors are increased and display columnar distribution in the cortex of TBC1D3-transgenic mice.
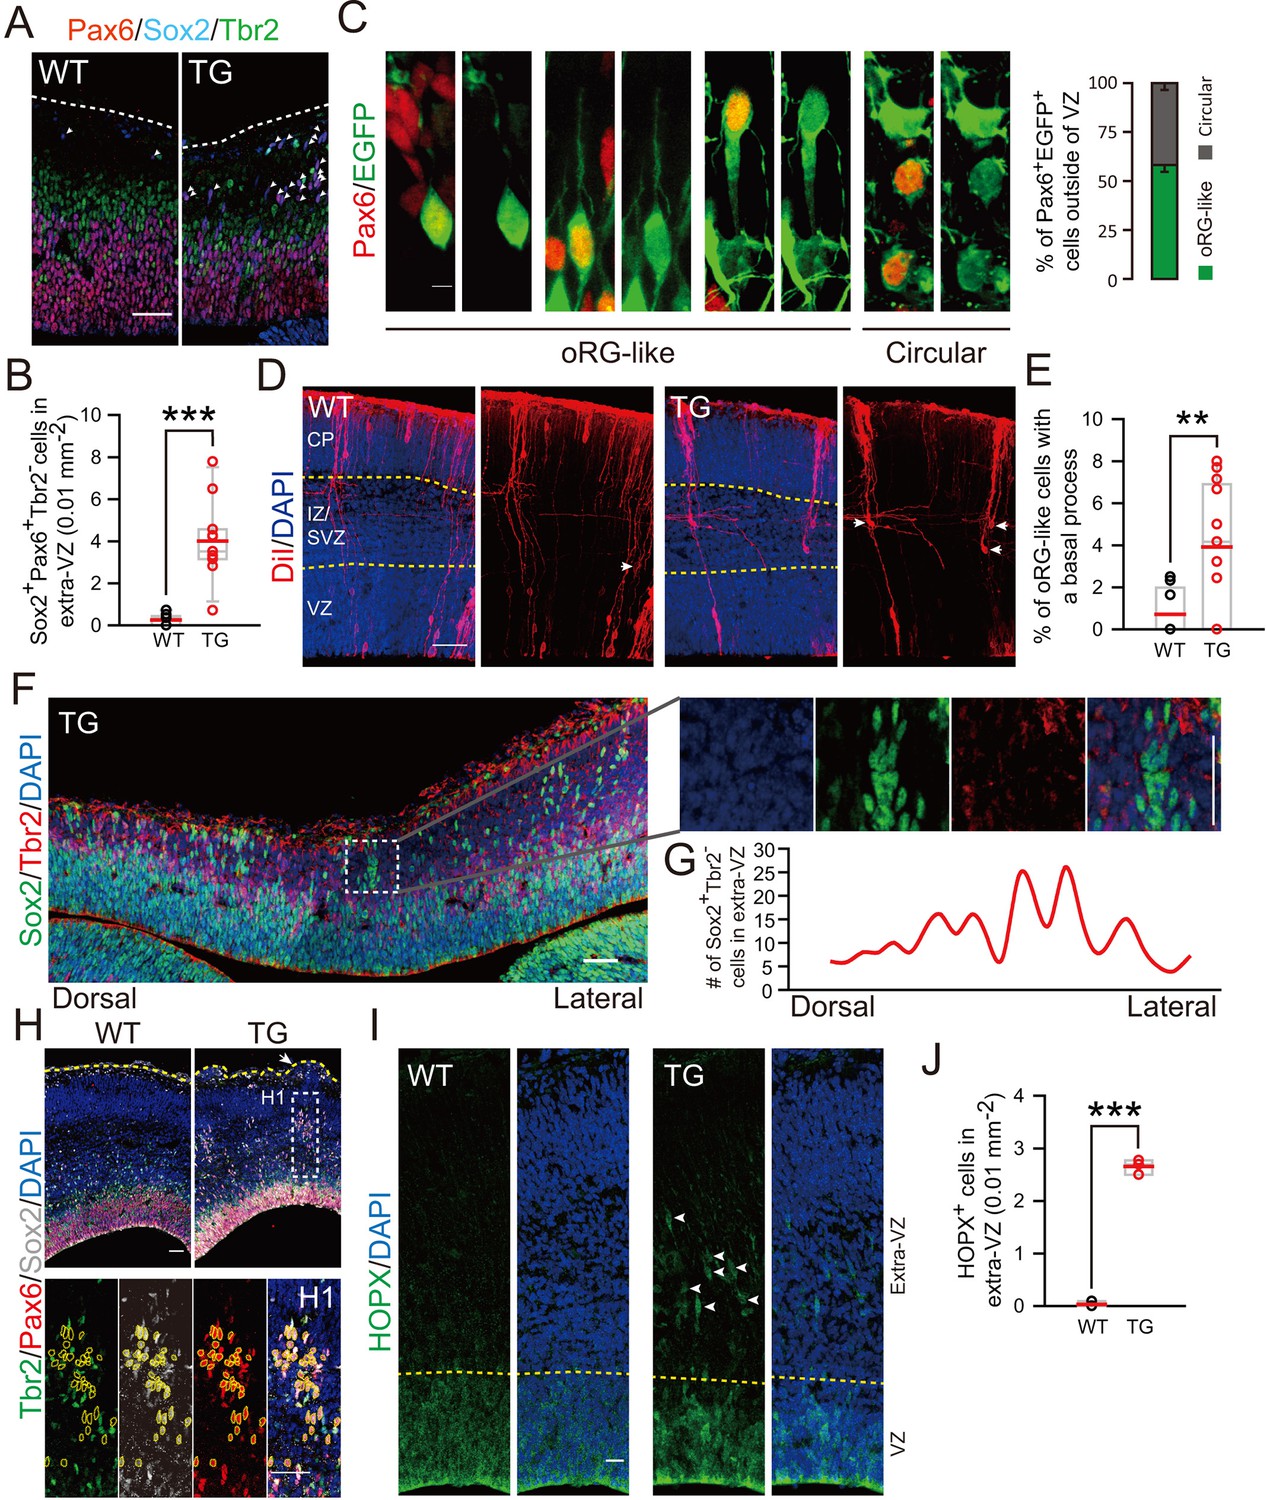
(A) Staining for Pax6, Sox2, and Tbr2 in E12.5 WT and TG mice. Dash lines indicate pial surfaces. Note the increase in Pax6+Sox2+Tbr2- cells (white arrowheads) in the basal region of TG mice. Scale bar, 50 μm. (B) Quantification for the density of Pax6+Sox2+Tbr2- cells in extra-VZ regions (WT: n = 9 slices from 3 mice, mean = 0.26, SEM = 0.09; TG: n = 11 slices from 4 mice, mean = 4.01, SEM = 0.57). p<0.0001. (C) E13.5 TG mice were subjected to IUE with EGFP-expressing plasmids to label cell morphology, and brain sections were stained for Pax6 at E16.5 (left panel). Scale bar, 5 μm. Three types of oRG-like cells constitute more than half of Pax6+ BPs (right panel, 82 Pax6+EGFP+ cells from 5 brains were analyzed). (D and E) DiI labeling (D) and quantification (E) of RG cells in E14.5 WT and TG mice (WT: n = 9 slices, mean = 0.72, SEM = 0.37; TG: n = 13 slices, mean = 3.92, SEM = 0.88). p = 0.009. White arrows indicate typical oRG-like cells with soma located in the SVZ/IZ and a basal process attached to the pial surface. Scale bar, 50 μm. (F) E12.5 TG mice were stained with Sox2, and Tbr2. Note the columnar distribution of Sox2+Tbr2- cells in basal regions, as illustrated for the boxed area. Scale bar, 50 μm. (G) Distribution profile of Sox2+Tbr2- cells in the basal region of TG mice cortex ranging from dorsal to lateral cortical regions. (H) Immunostaining for Sox2, Pax6, Tbr2 in E14.5 WT and TG mice cortex. Yellow dash lines indicate the brain surface. Note the apparent columnar distribution of Sox2+Pax6+Tbr2- cells (yellow dotted circles) in the boxed area below a cortical gyrus-like structure (white arrow). Scale bars, 50 μm. (I and J) Immunostaining (I) and quantification (J) of HOPX cells in the extra-VZ (white arrowheads) of E14.5 WT and TG mice cortices (WT: n = 3 brains, mean = 0.03, SEM = 0.03; TG: n = 3 brains, mean = 2.66, SEM = 0.08). p<0.0001. Scale bar, 20 μm.
Figure 6—figure supplement 1
Cortical basal progenitors are increased in the cortex of TBC1D3-transgenic mice.
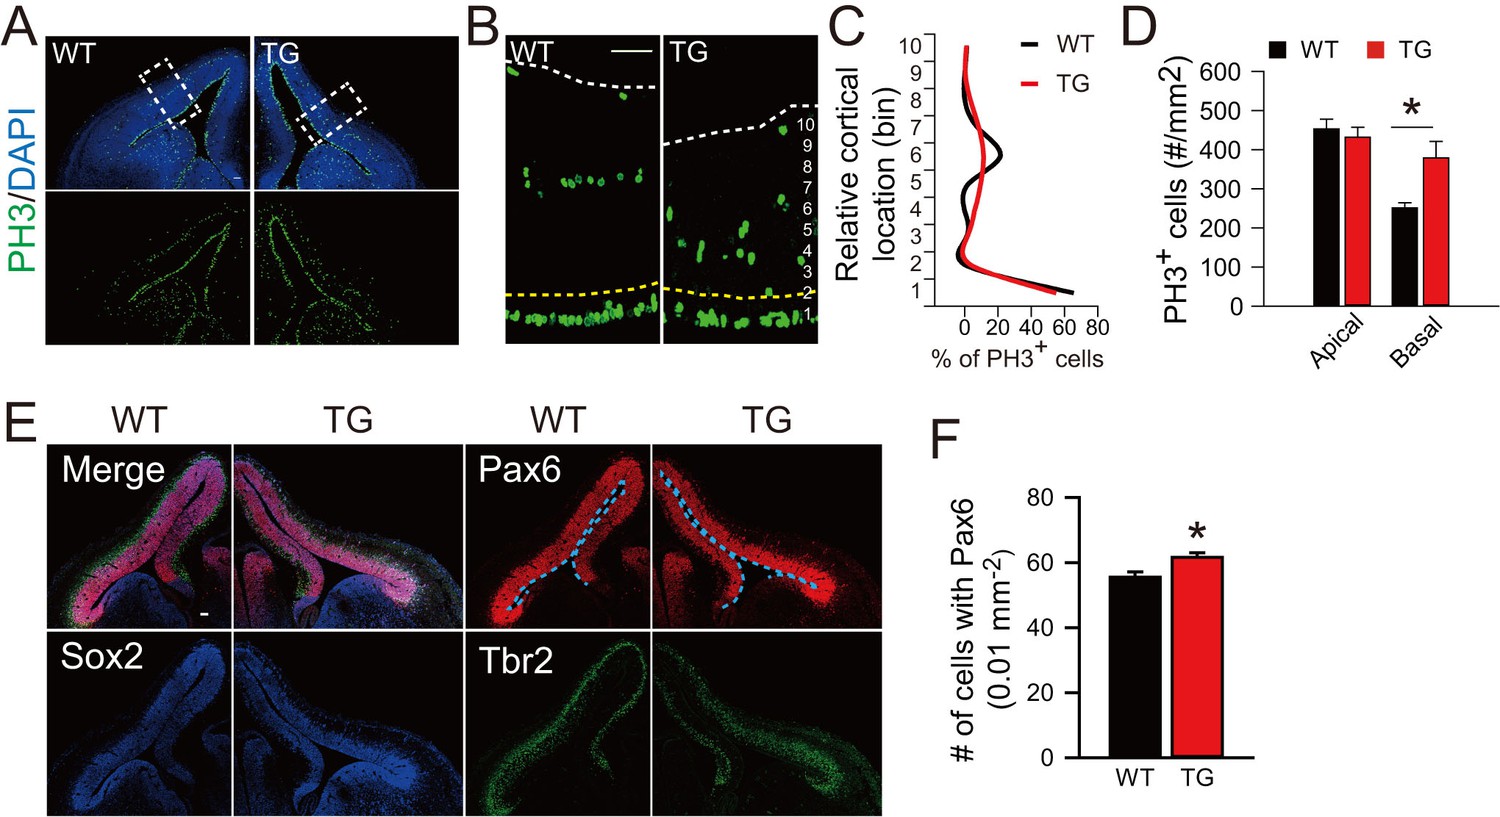
(A and B) Immunostaining for PH3 in WT and TBC1D3 TG mice at E12.5. White dash lines in enlarged areas (B) indicate cortical surfaces, and yellow dash lines indicate the boundary between apical and basal regions. Scale bars, 50 μm. (C and D) Quantification for the density of PH3+ cells distributed radially (C, from ventricular to pial surface) or in apical/basal regions (D), respectively. Apical: n = 3 mice, mean = 453.37, SEM = 24.89 for WT, n = 4 mice, mean = 432.36, SEM = 24.99 for TG; Basal: mean = 251.14, SEM = 13.09 for WT; mean = 378.62, SEM = 42.49 for TG. p-values are 0.570 (apical) and 0.017 (basal). (E) Staining for Pax6, Sox2, and Tbr2 in E12.5 WT and TG mice. Scale bar, 50 μm. (F) The densitys of Pax6+ cells in the cortex of WT and TG mice were quantified (WT: n = 3 mice, mean = 55.5, SEM = 1.67; TG: n = 4 mice, mean = 61.59, SEM = 1.43). p = 0.014.
Figure 6—figure supplement 2
Increased proliferation potency of BPs in TBC1D3-transgenic Mice.
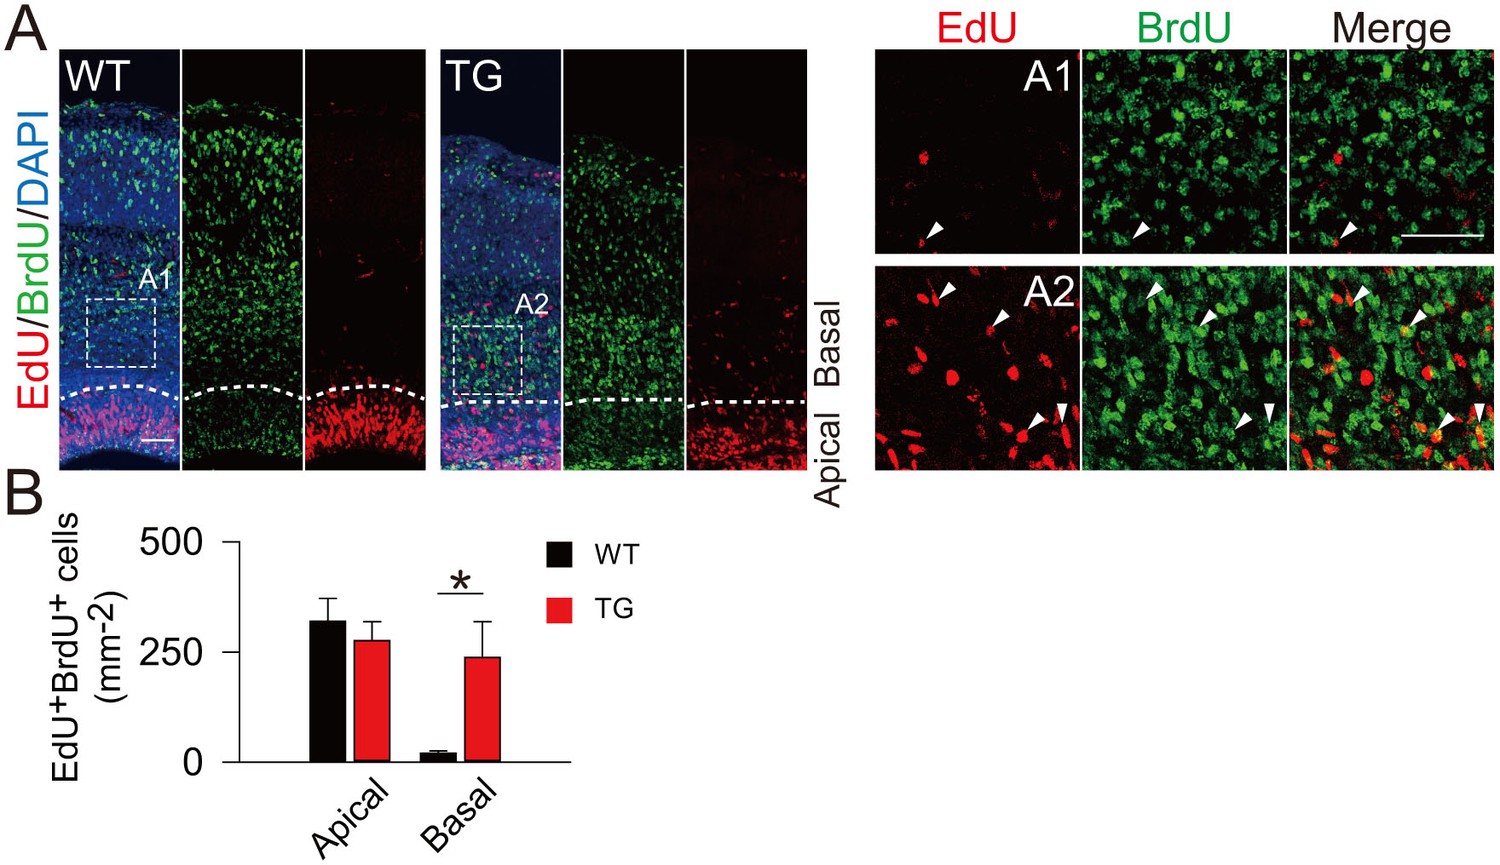
(A) BrdU and EdU were sequentially administered into TG or WT mice, at E13.5 and E16.5, respectively. Double positive cells from cerebral cortex of mice 2 hr after EdU injection were analyzed. Note the cells indicated by white arrows in magnified areas (A1 and A2). Dash lines indicate the boundary of apical and basal regions in cortex. Scale bars, 50 μm. (B) Quantification for the density of BrdU/EdU double positive (BrdU+EdU+) cells in the dorsal cerebral cortex of WT (apical: mean = 319.94, SEM = 52.36; basal: mean = 20.34, SEM = 5.09) and TG (apical: mean = 276.19, SEM = 43.31; basal: mean = 237.93, SEM = 81.52) mice. p-values WT vs TG are 0.544 (apical) and 0.029 (basal) (n = 4 mice in each group).
Figure 6—figure supplement 3
Increased neurons in the superficial layer of the cortex of TBC1D3-transgenic mice.
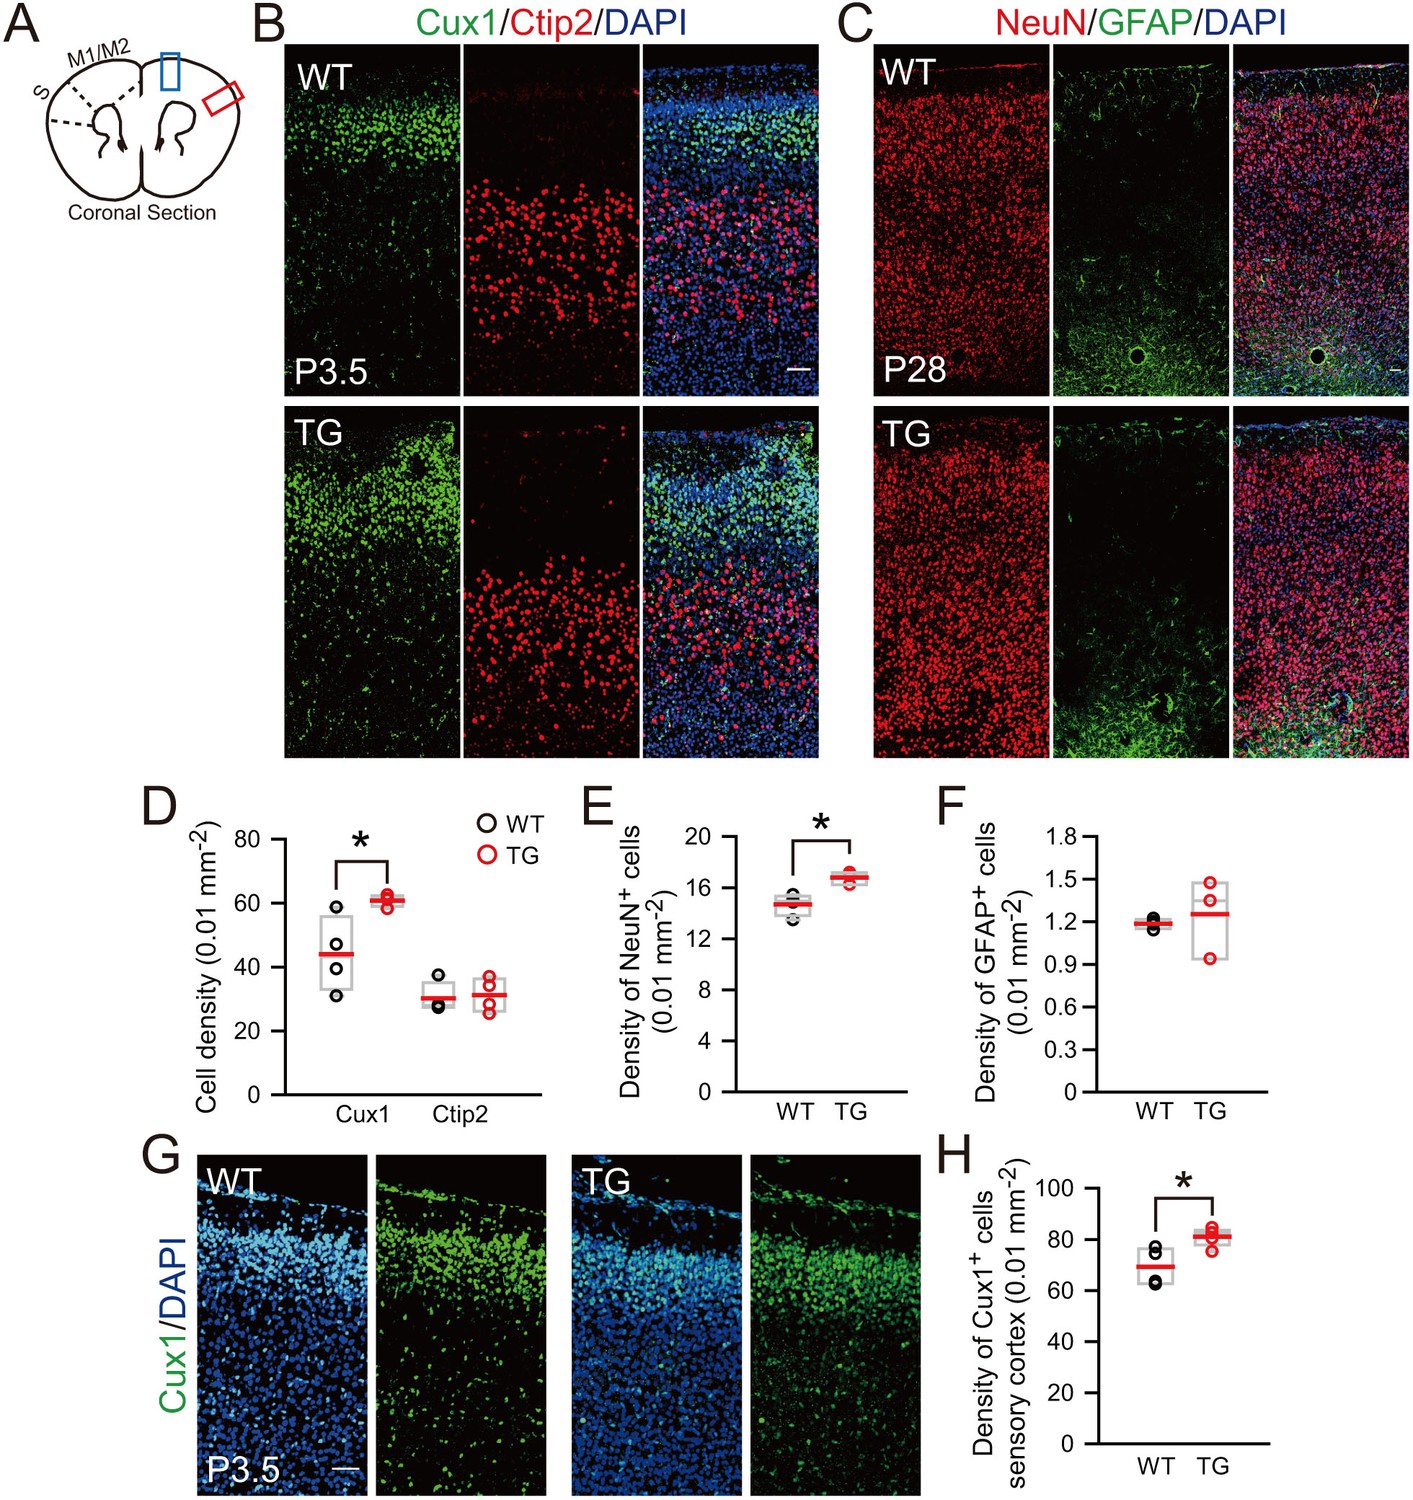
(A) Schematic for the motor cortex (M1/M2) and sensory (S) cortex, and the brain regions (blue or red rectangle) for the staining analysis. (B) Staining for the superfical layer marker Cux1 and the deep layer marker Ctip2 in the motor cortex of P3.5 mice. Scale bar = 50 μm. (C) Staining for NeuN and GFAP signals in the motor cortex of P28 mice. Scale bar = 50 μm. (D) Quantification for the density of Cux1+ (WT: mean = 44.02, SEM = 5.91; TG: mean = 60.83, SEM = 0.92; p = 0.031) or Ctip2+ (WT: mean = 30.17, SEM = 2.43; TG: mean = 31.19, SEM = 2.64; p = 0.786) neurons in the motor cortex of P3.5 mice (n = 4 mice). (E and F) Quantification for the density of NeuN+ neurons (WT: n = 4 mice, mean = 14.70, SEM = 0.43; TG: n = 3 mice, mean = 16.79, SEM = 2.85; p = 0.014) and GFAP+ astrocytes (WT: n = 4 mice, mean = 1.19, SEM = 0.02; TG: n = 3 mice, mean = 1.25, SEM = 0.16; p = 0.645) in the motor cortex of P28 mice. (G and H) Immunostaining and quantification for the superficial layer marker Cux1 in the sensory cortex (red rectangle in A) of P3.5 mice. Scale bar, 50 μm. n = 4 mice, mean = 69.33, SEM = 3.71 for WT; n = 5 mice, mean = 81.07, SEM = 1.59 for TG. p = 0.016.
Figure 7
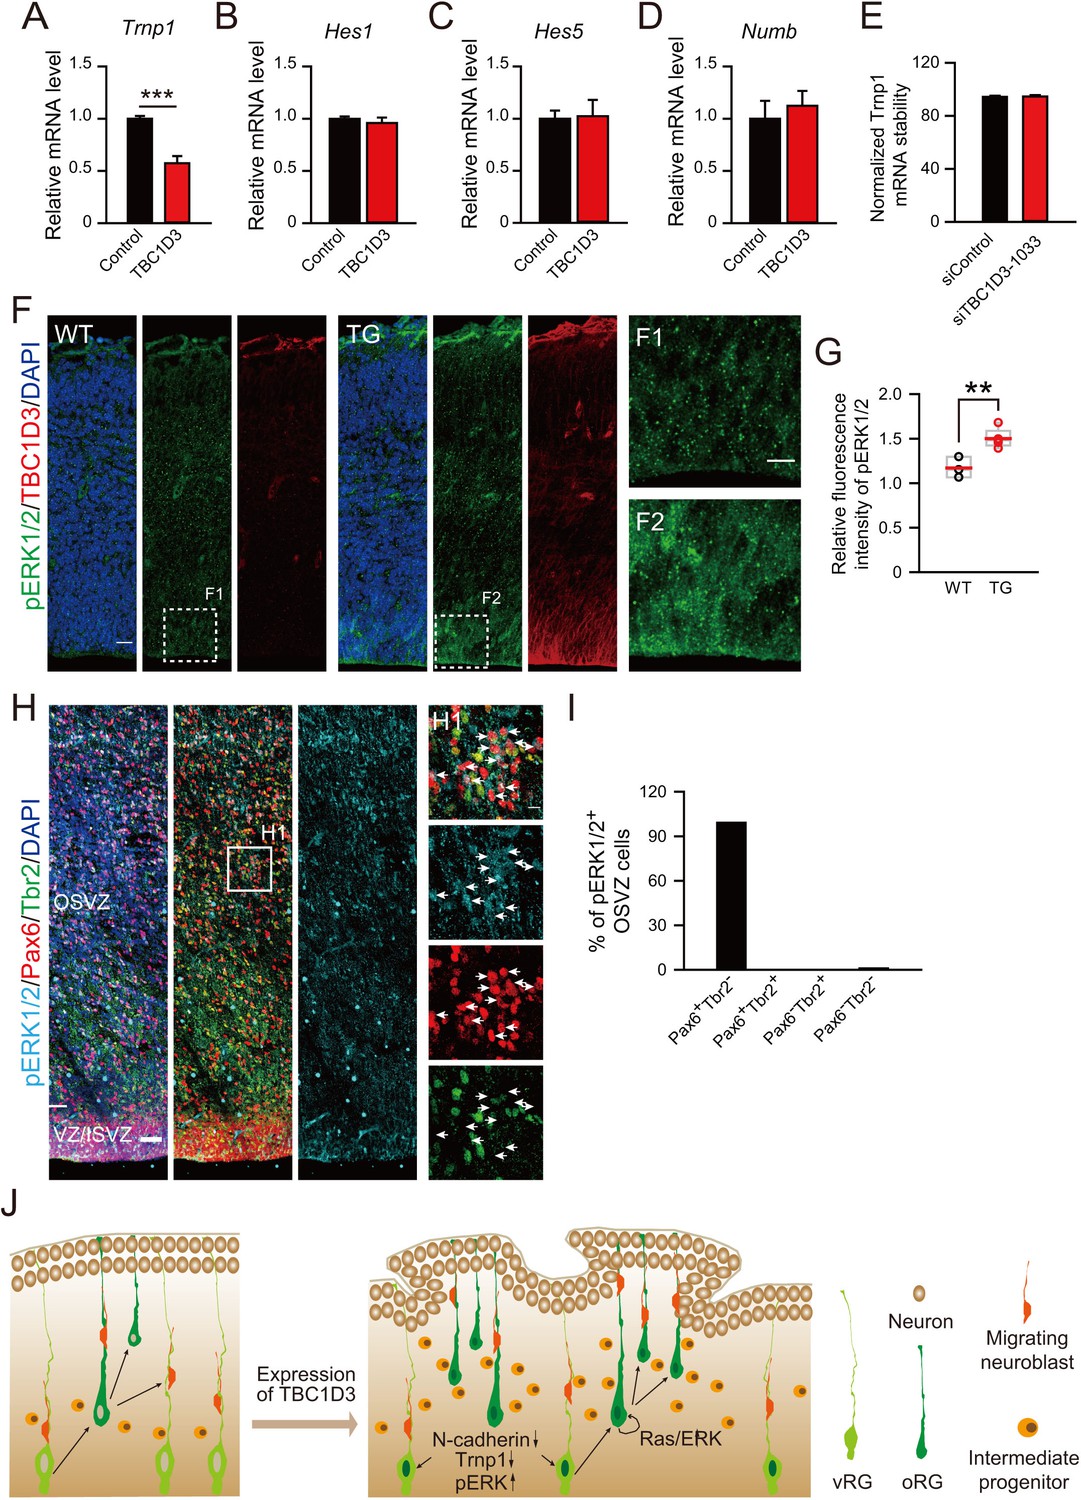
Effect of TBC1D3 on intrinsic stemness signaling pathways and model for the TBC1D3 function in cortical folding.
(A–D) E13.5 mice were subjected to IUE with TBC1D3 or vehicle control plasmid, together with YFP plasmid, and at E15.5, FACS-sorted transfected cells (see Figure 1—figure supplement 1B,C) were analyzed for mRNA levels of indicated genes relative to GAPDH with values from control groups normalized as 1.0 (n = 3 experiments for each group). Trnp1: mean = 1.00, SEM = 0.03 for control; mean = 0.57, SEM = 0.07 for TBC1D3 (p = 0.0003). Hes1: mean = 1.00, SEM = 0.02 for control; mean = 0.96, SEM = 0.05 for TBC1D3 (p = 0.561). Hes5: mean = 1.00, SEM = 0.20 for control; mean = 0.85, SEM = 0.34 for TBC1D3 (p = 0.762). Numb: mean = 1.00, SEM = 0.17 for control; mean = 1.12, SEM = 0.14 for TBC1D3 (p = 0.612). (E) ReNeuron cells were transfected with constructs encoding siRNA targeting TBC1D3 or scrambled sequence. After 3 days, transfected cells were treated with actinomycin D for 4 hr and the mRNA level of Trnp1 relative to Hprt was quantified (n = 4 experiments; mean = 94.40, SEM =0.89 for control; mean = 94.67, SEM = 1.05 for siTBC1D3; p = 0.851). Data are presented as mean ± SEM of percentage of Trnp1 mRNA compared to the value prior to actinomycin D treatment. (F) Cortices of E14.5 WT and TG mice were stained for pERK1/2 and TBC1D3. Scale bars, 20 μm (F), 10 μm (F1). (G) Quantification for the ratio of pERK1/2 intensity in VZ/SVZ regions to that in CP (WT: n = 3 mice, mean = 1.17, SEM = 0.07; TG: n = 5 mice, mean = 1.50, SEM = 0.05). p = 0.006. (H) GW15.5 human brain slice was stained with pERK1/2, Pax6, and Tbr2 antibodies. Scale bars, 50 μm (H) and 10 μm (H1). (I) Quantification of pERK1/2 levels in different types of OSVZ progenitors (n = 2 slices). Note that almost all pERK1/2 signals are detected in Pax6+Tbr2- cells. (J) Proposed model for the role of TBC1D3 in cortical folding. TBC1D3 expression causes delamination of vRG cells, through down-regulating the level of N-cadherin and Trnp1, and promotes proliferation of oRG-like cells by regulating cell stemness pathways, including Ras/ERK signaling. The increased generation of the oRG-like cells, the IP cells, and subsequently regional increase in the density of new born neurons, induces cortical folding in mice.
Videos
Video 1
oRGs in cultured organotypic slices from control mice.
This movie illustrates the behavior of the sparse oRGs in organotypic slice cultures from control mice electroporated with vehicle plasmid. IUE was done at E13.5 and organotypic slice culture was prepared at E14.5 and observed 2–3 hr after culture preparation. White arrows indicate oRGs before division, and cyan and red arrowheads indicate daughter cells dividing towards the pial and ventricular surface, respectively. Scale bar, 50 μm.
Video 2
oRGs in cultured organotypic slices from TBC1D3-electroporated mice.
This movie illustrates the behavior of TBC1D3-expressing oRGs. IUE was done at E13.5 and organotypic slice culture prepared at E14.5 and observed 2–3 hr after culture preparation. White arrows indicate oRGs before division, and cyan and red arrowheads indicate daughter cells dividing towards the pial and ventricular surface, respectively. Scale bar, 50 μm.
Download links
A two-part list of links to download the article, or parts of the article, in various formats.
Downloads (link to download the article as PDF)
Open citations (links to open the citations from this article in various online reference manager services)
Cite this article (links to download the citations from this article in formats compatible with various reference manager tools)
The hominoid-specific gene TBC1D3 promotes generation of basal neural progenitors and induces cortical folding in mice
eLife 5:e18197.
https://doi.org/10.7554/eLife.18197


