Mechanism for nuclease regulation in RecBCD
- Imperial College London, United Kingdom
Figures
Figure 1 with 2 supplements
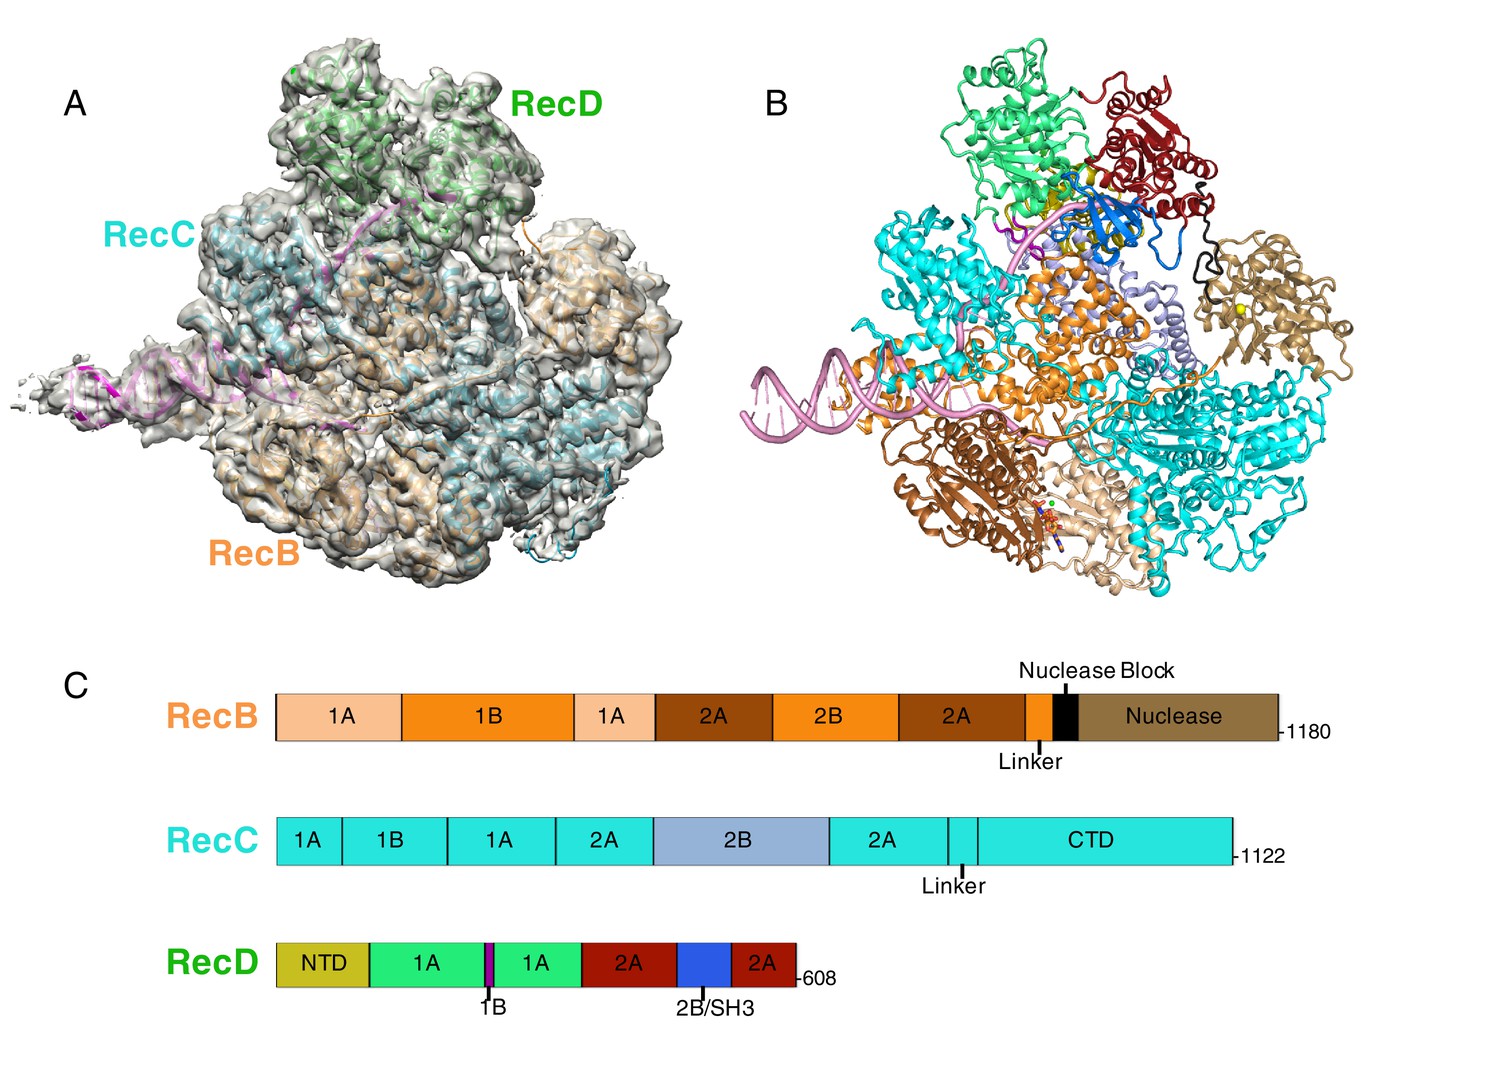
CryoEM structure of RecBCD/DNA complex at 3.8 Å resolution.
(A) Cartoon representation of the RecBCD complex within a transparent surface showing the electron density. The RecB subunit is in orange, RecC in cyan, RecD is in green, and the DNA is in pink, (B) ‘Road map’ for colour scheme used in subsequent figures using the colour scheme shown in (C), (C) Linear representation of the sequences, with labelling of relevant domains, of the three subunits showing the colour scheme used in subsequent figures. Further information about the quality of the CryoEM structure is presented in Figure 1—figure supplement 1. Examples of the quality of the electron density are shown in Figure 1—figure supplement 2.
Figure 1—figure supplement 1
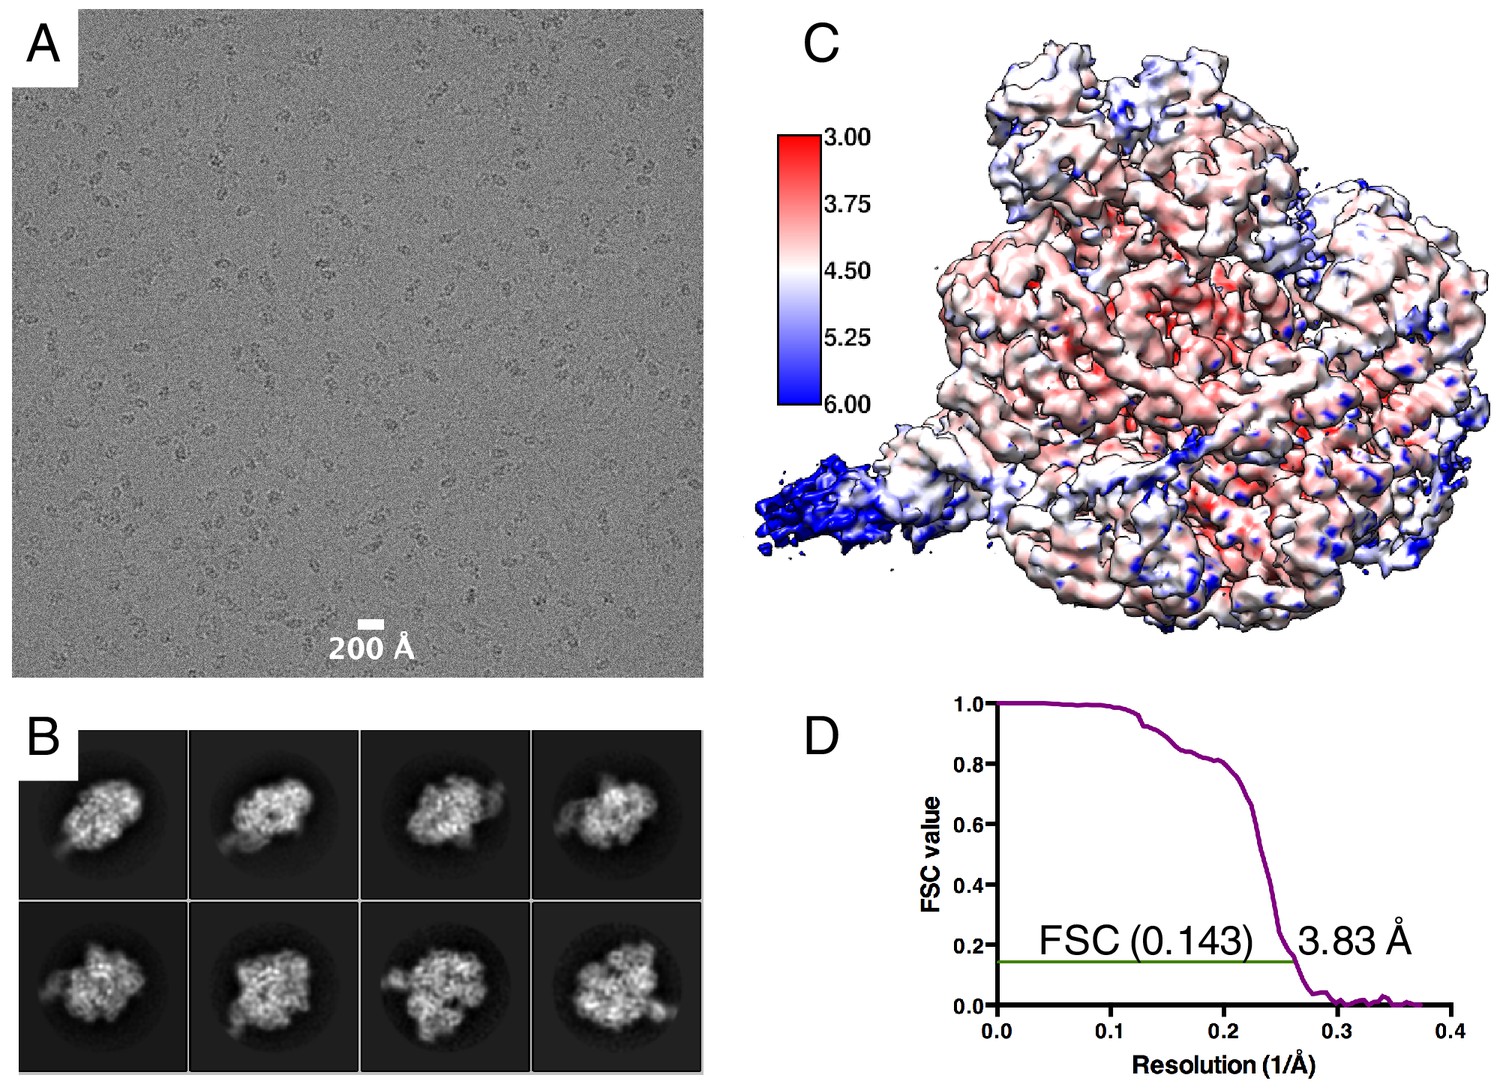
EM Data statistics.
(A) An example of an aligned and summed image stack showing particle distribution. (B) Selection of 2D class averages representing different particle views. (C) Final map coloured by local resolution as estimated by ResMap (Kucukelbir et al., 2014). Scale bar shows colour scale with resolution in Å. (D) ‘Gold standard’ FSC curve showing estimated global resolution of 3.83 Å.
Figure 1—figure supplement 2
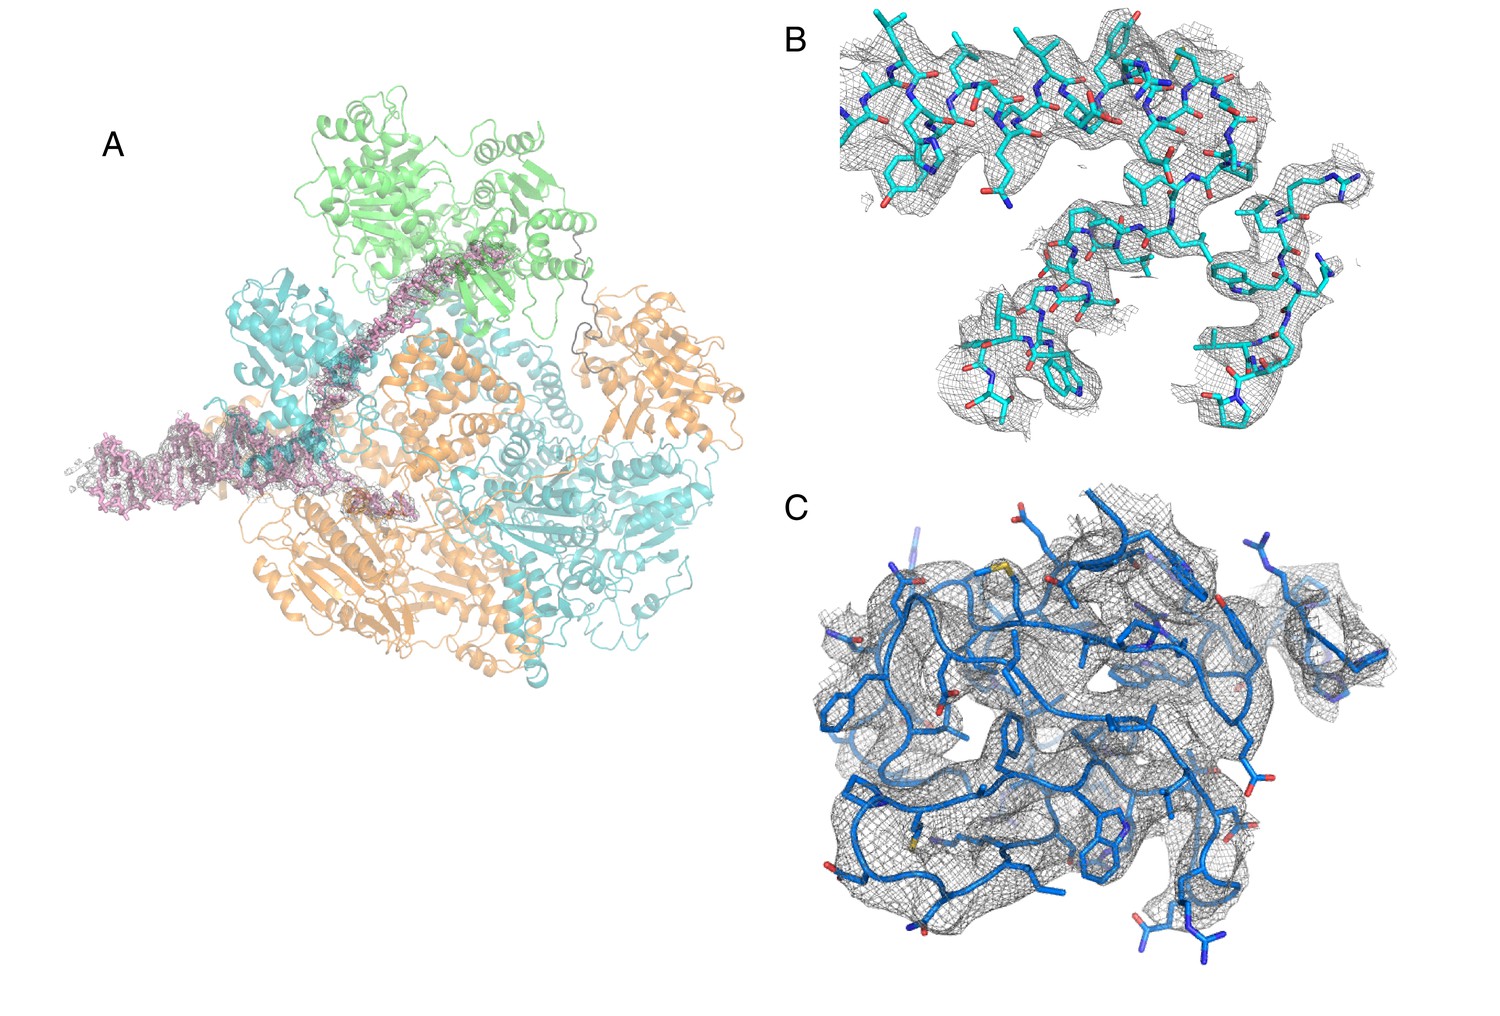
Representative sections of electron density (contorted at 4 σ).
(A) Electron density corresponding to the bound DNA fork substrate, (B) Representative regions at the centre of the RecBCD complex to illustrate the quality of the maps, (C) The 2B/SH3 domain of the RecD subunit.
Figure 2 with 2 supplements

Interactions with the 5’-tail and the RecD subunit.
Inset: location of the close ups shown in this figure relative to Figure 1. (A) Binding of the 5’-tail of the DNA fork across the RecD subunit, (B) Close up of the electron density (contoured at 4 σ) for the bound 5’-tail of the DNA fork showing details of the contacts between the protein and bound DNA. Further details about interactions within the RecD subunit are presented in Figure 1—figure supplement 1, and details about interactions within the RecB subunit are presented in Figure 2—figure supplement 2
Figure 2—figure supplement 1
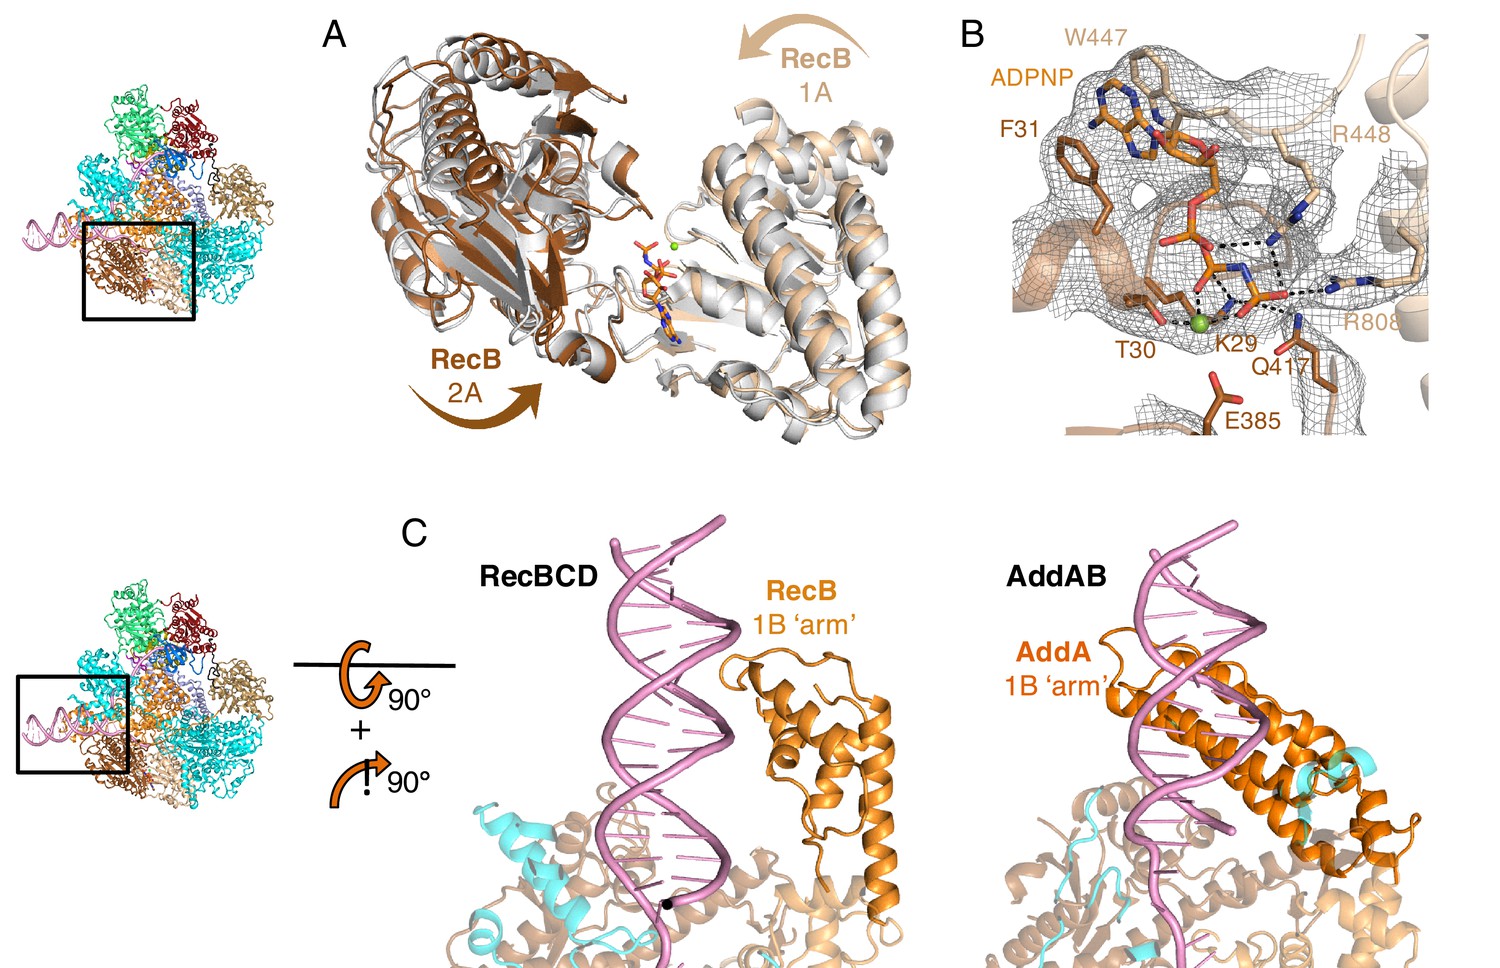
Structural features of the RecB subunit.
Insets show location of the zoomed in regions. (A) Conformational changes of the 1A and 2A domains of RecB associated with nucleotide binding (initiation complex (Singleton et al., 2004) shown in grey, ADPNP bound structure in orange), (B) Electron density (contoured at 4 σ) at the ATP-binding site of the RecB subunit showing the unusual arrangement of adenine binding with the base sandwiched between two aromatic residues, (C) Interaction of the ‘arm’ domain with the minor groove (RecB, left) or the major groove (AddA, right) of the DNA duplex.
Figure 2—figure supplement 2
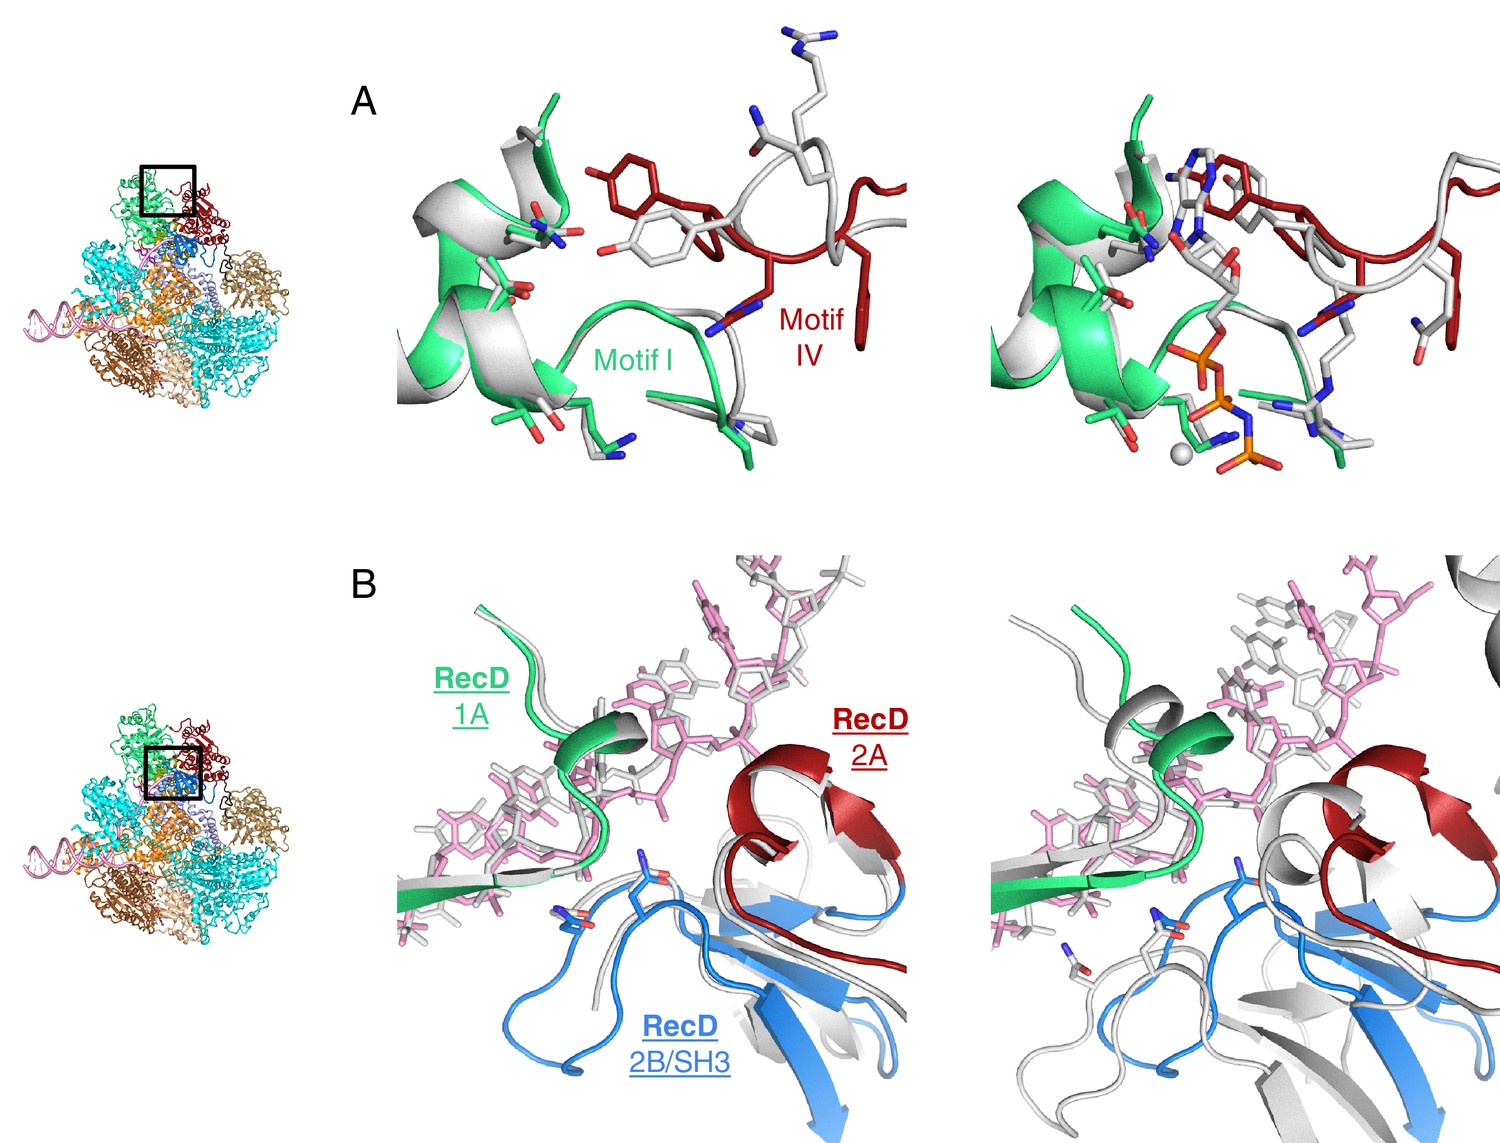
Nucleotide binding at the RecD subunit.
Surprisingly, only very weak electron density for bound nucleotide is visible at the ATP-binding site of RecD even though ADPNP is bound at the ATP-binding site of the RecB subunit. However, the conformation of the conserved helicase motif IV is in a conformation that suggests nucleotide is bound to the subunit, albeit at low occupancy (Panel A). Comparison with the RecD2 structures (Panel B) reveals the 1A and 2A domains to be most similar in conformation to that of the protein without bound nucleotide (Saikrishnan et al., 2009). Indeed, these structures also suggest that a steric clash with the RecB subunit would prevent the RecD subunit from sliding along the ssDNA in response to ATP-binding as seen for RecD2. This suggests that the DNA substrate we used here is still at least one base too short on the 5’-tail to permit this final conformational change. As a consequence, the nucleotide binds less tightly to the RecD subunit when this conformational change is prevented. (A) Helicase motif IV of RecD (red) adopts a conformation more similar to that seen in the nucleotide-bound state of RecD2 (right, grey) (Saikrishnan et al., 2009) than to the binary complex (left, grey), (B) By contrast, the ssDNA contacts through the 2A/SH3 domains most resemble those seen in the nucleotide free RecD2 structure (left, grey) than the nucleotide-bound state (right, grey).
Figure 3
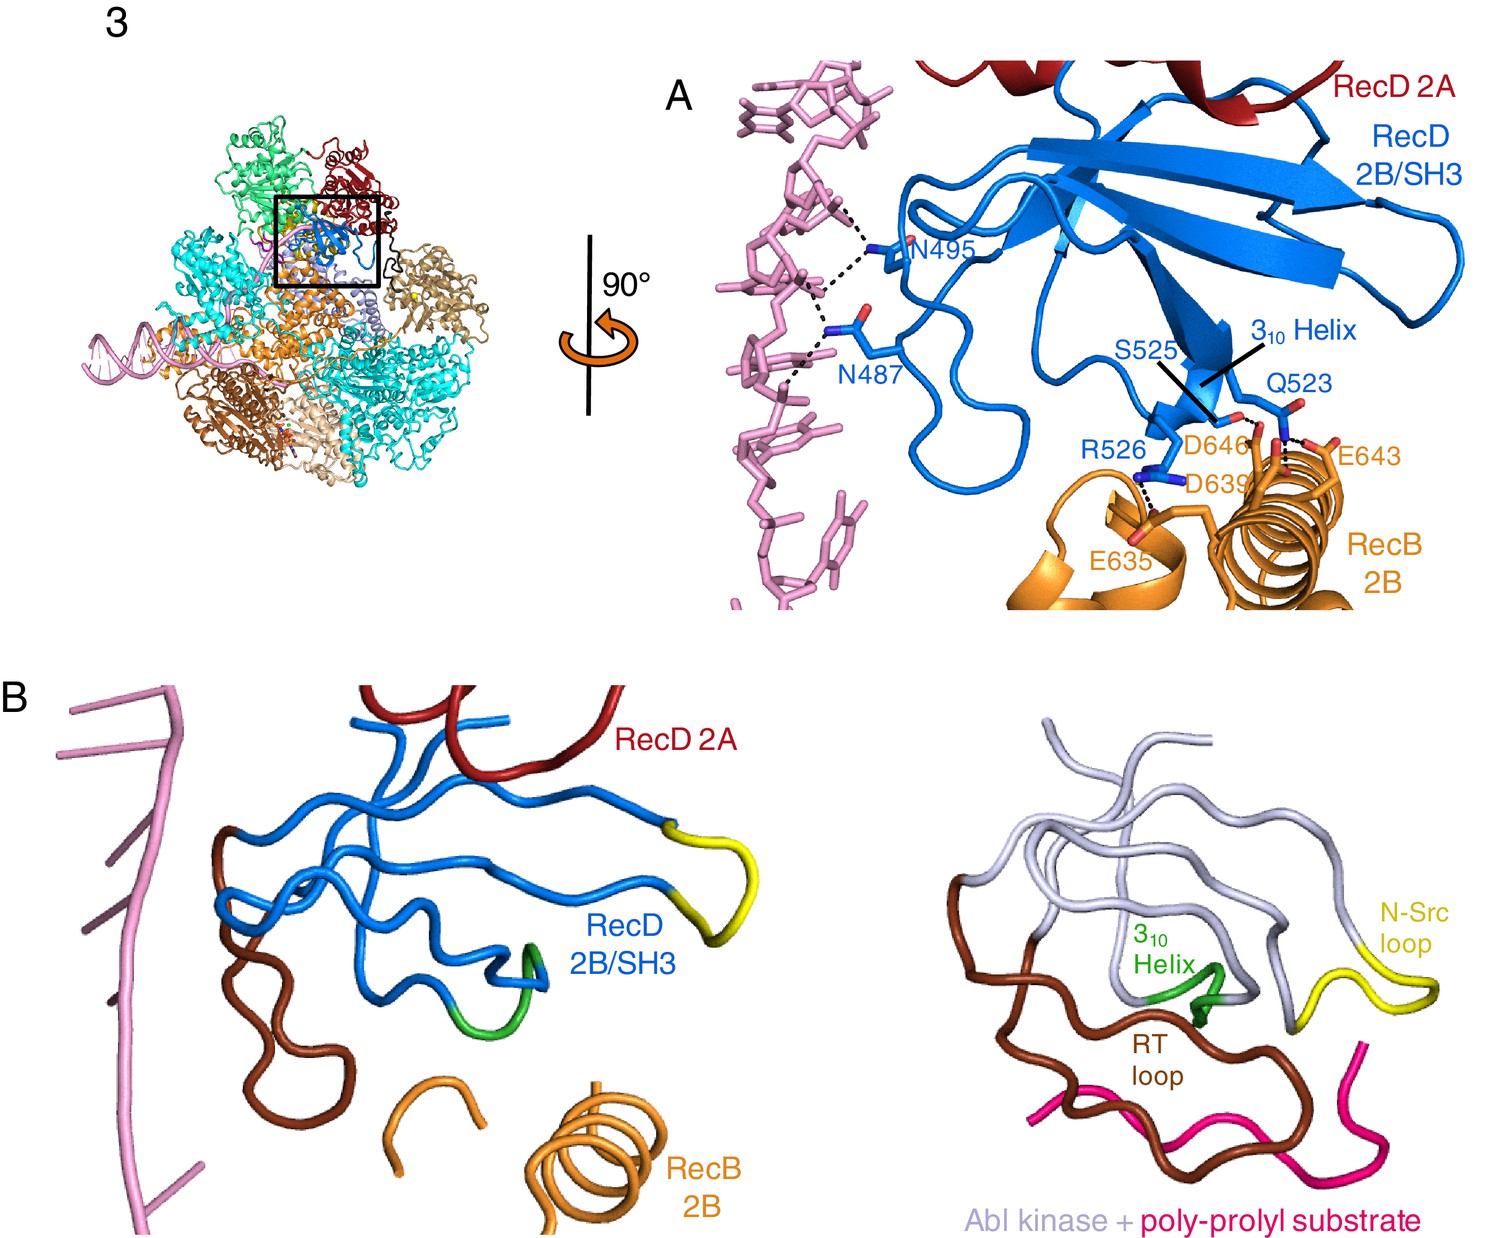
SH3 fold in RecD.
Inset: location of the close ups shown in this figure relative to Figure 1. (A) Contact regions of the SH3 domain (blue) with DNA (pink) and peptide (RecB, orange), (B) Cartoon representation of the SH3 domain of Abl kinase (right) with bound peptide (magenta). The key contact regions (Saksela and Permi, 2012) are highlighted in different colours. The equivalent view of the RecD SH3 domain is shown on the left.
Figure 4 with 1 supplement

Conformational changes that result in nuclease activation.
Inset: location of the close ups shown in this figure. The series of conformational changes from the initiation complex (grey) begins in the top left corner. Supplementary Videos 1–3 show these conformational changes. (A) Overall changes in the structure in the RecD subunit. Note that the SH3 domain is disordered in the initiation complex (see also Videos 1 and 2), (B) Overall changes in the structure in the RecC subunit (see also Video 2), (C) Overall changes in the structure in the RecB nuclease domain (see also Video 2), (D) The linker polypeptide region, including the α-helix (black) that blocks the active site, relocates to a new position (see also Video 3). Electron density for this region is shown in Figure 4—figure supplement 1.
Figure 4—figure supplement 1
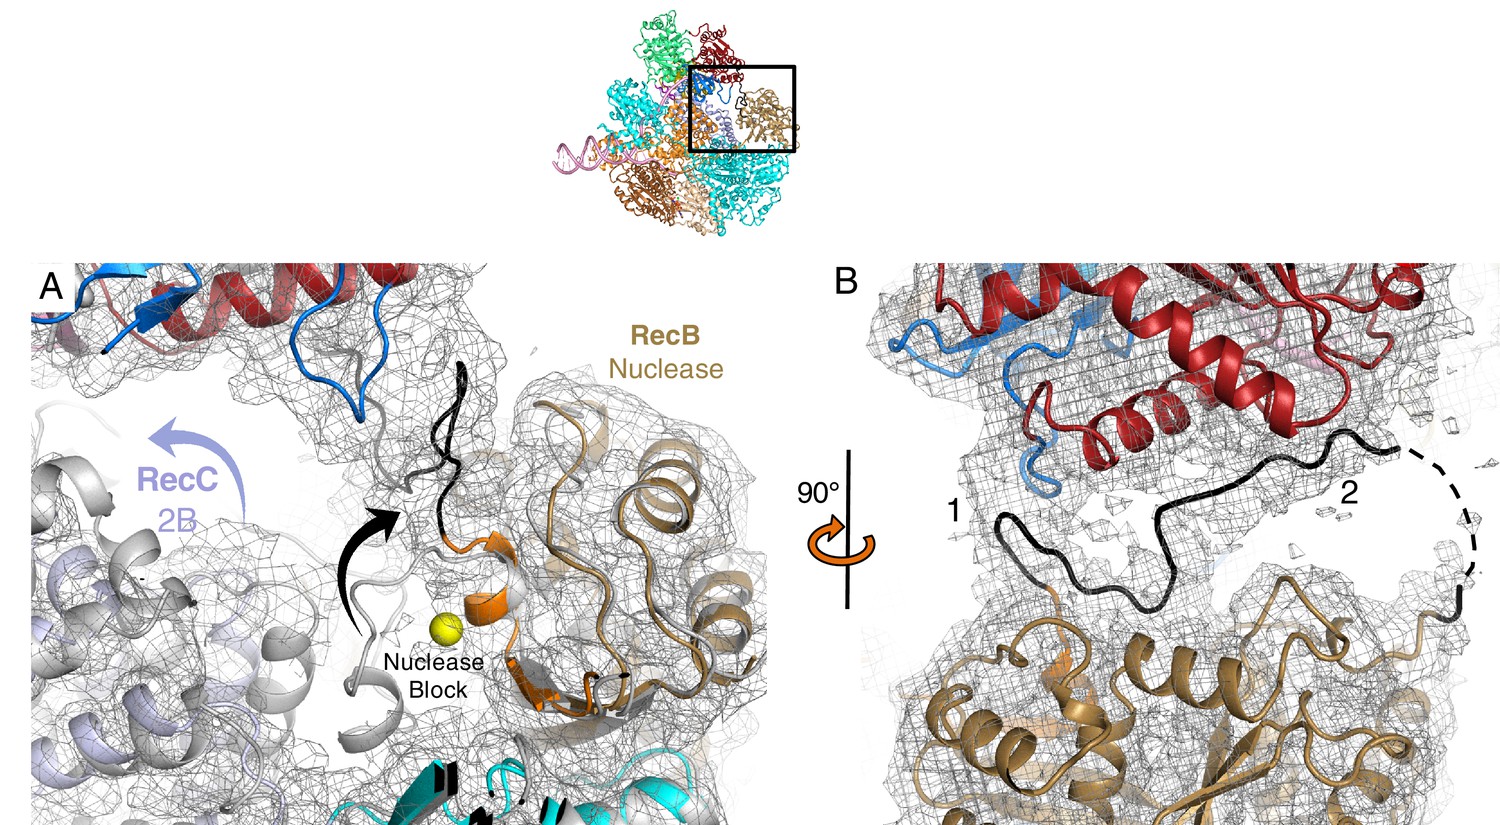
Electron density showing relocation of the linker peptide and nuclease blocking helix.
Inset shows location of the zoomed in region. (A) Electron density (contoured at 2.5 σ) showing lack of density for the nuclease blocking helix in the position seen in the initiation complex (grey). The electron density is too weak to build the structure with confidence but shows an alternative path for the connecting linker peptide and blocking helix (shown in black). The nuclease active site can be located by the yellow sphere which represents a calcium ion in the initiation complex structure, (B) the same region but rotated by 90 degrees.
Figure 5
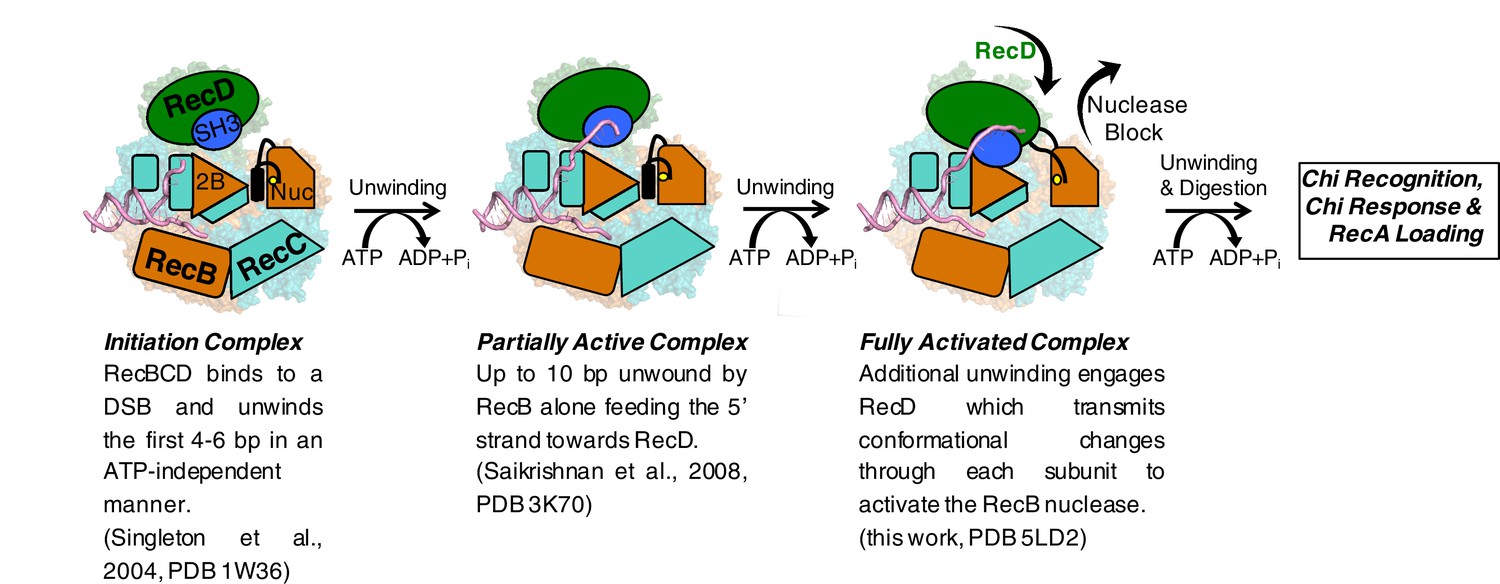
Cartoon summarising the conformational changes that proceed from the initiation complex to nuclease activation.
https://doi.org/10.7554/eLife.18227.015Videos
Video 1
Overall changes in the RecD subunit.
https://doi.org/10.7554/eLife.18227.012
Video 2
Overall changes in the RecC subunit.
https://doi.org/10.7554/eLife.18227.013
Video 3
Changes in the linker peptide region.
https://doi.org/10.7554/eLife.18227.014Tables
Table 1
Refinement of the final model.
| Final particles | 74656 |
| Resolution (Å) | 3.8 |
| CC (whole map) | 0.838 |
| CC (around atoms) | 0.875 |
| R.m.s. deviations | |
| Bond lengths (Å) | 0.01 |
| Bond angles (°) | 1.04 |
| Ramachandran | |
| Favoured (%) | 94.1 |
| Outliers | 8/2874 |
| Rotamers | |
| Favoured (%) | 99.1 |
| Outliers | 1/2426 |
Download links
A two-part list of links to download the article, or parts of the article, in various formats.
Downloads (link to download the article as PDF)
Open citations (links to open the citations from this article in various online reference manager services)
Cite this article (links to download the citations from this article in formats compatible with various reference manager tools)
Mechanism for nuclease regulation in RecBCD
eLife 5:e18227.
https://doi.org/10.7554/eLife.18227


