MYC activation and BCL2L11 silencing by a tumour virus through the large-scale reconfiguration of enhancer-promoter hubs
- University of Sussex, United Kingdom
- College of Medical and Dental Sciences, University of Birmingham, United Kingdom
- Babraham Institute, United Kingdom
- King's College London School of Medicine, Guy's Hospital, United Kingdom
Figures
Figure 1 with 1 supplement
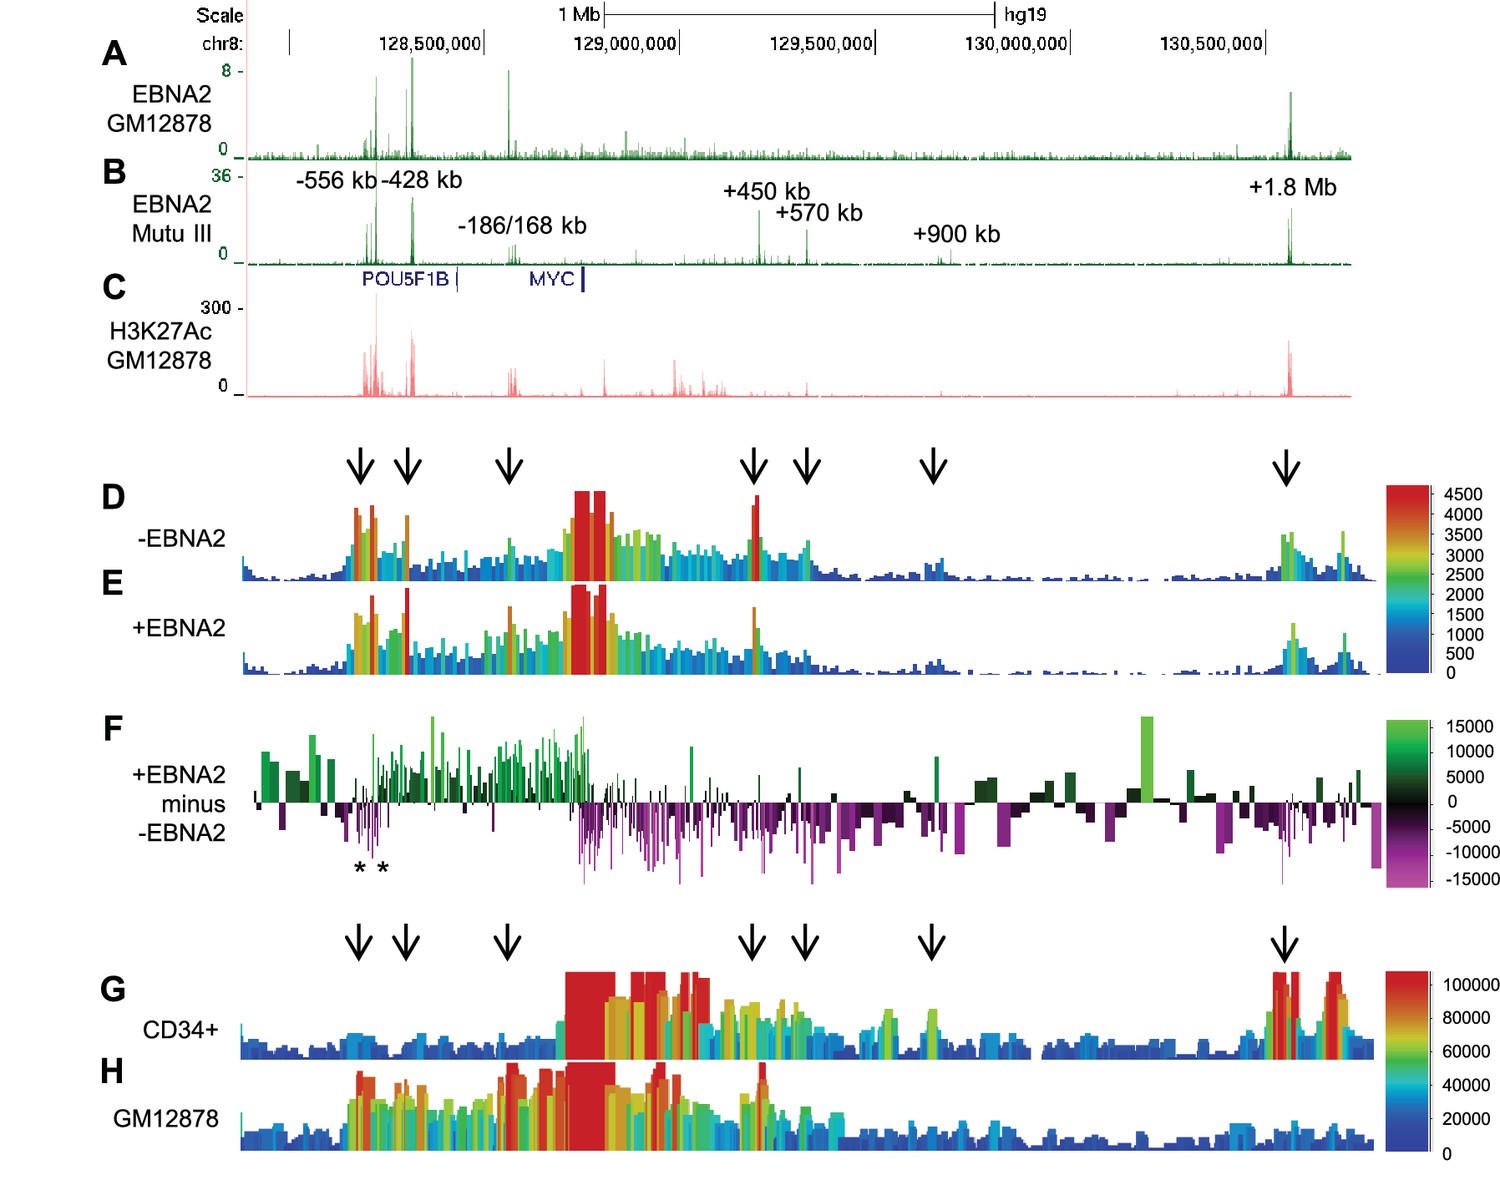
EBNA2 binding induces directional reorganisation of MYC promoter-enhancer interactions.
(A) EBNA2 ChIP-sequencing reads in EBV-infected GM12878 cells (B) in EBV positive Mutu III BL cells (that express all latent EBV proteins). (C) H3K27ac signals in GM12878 from ENCODE. Numbering indicates the location of the major enhancer clusters relative to the MYC transcription start site. (D) Sequencing reads from circularised chromosome conformation capture-sequencing (4C-seq) using the MYC promoter as bait in ER-EB 2.5 cells expressing an EBNA2-ER fusion protein cultured in the absence of β-estradiol (-EBNA2). Reads shown are from one of two replicates. The scale bar shows reads per 10 kb window per million reads of sequencing library. (E) 4C-seq data from cells incubated in the presence of β-estradiol (+EBNA2). (F) Subtraction of -EBNA2 4C-sequence reads from +EBNA2 4C-sequence reads. The scale bar shows the normalised interaction read count difference (see Materials and methods for more details). Asterisks indicate the positions of CTCF sites. (G) Capture Hi-C sequencing reads using a MYC promoter bait and a CD34+ haemopoietic progenitor cell Hi-C library. Arrows denote positions where statistically significant MYC interactions correspond to EBNA2 binding sites. The scale bar shows reads for five merged consecutive genome fragments per million reads of sequencing library. (H) MYC promoter Capture Hi-C reads obtained from a GM12878 CHi-C libary.
Figure 1—figure supplement 1
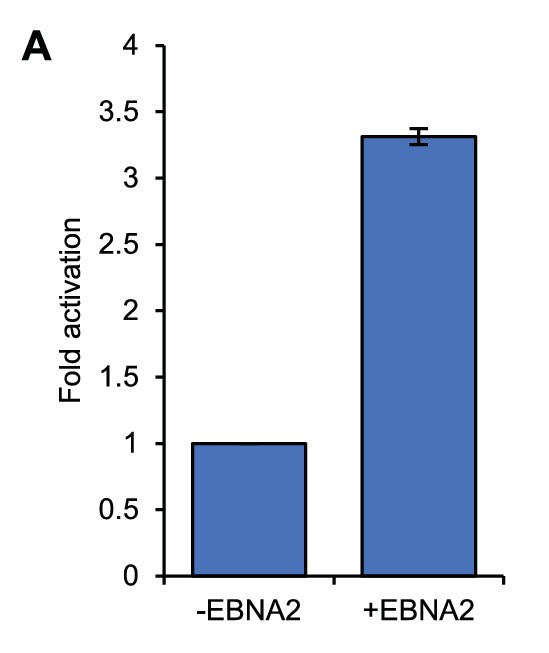
MYC mRNA induction in ER-EB 2.5 cells.
RT-QPCR analysis of MYC mRNA expression in ER-EB 2.5 cell samples used for 4C-seq analysis. Cells were cultured in the absence of β-estradiol for 4 days and then for a further 17 hr with (+EBNA2) or without β-estradiol (-EBNA2). Signals were normalised to GAPDH mRNA levels. Results show the mean ± standard deviation of QPCR duplicates.
Figure 2 with 1 supplement
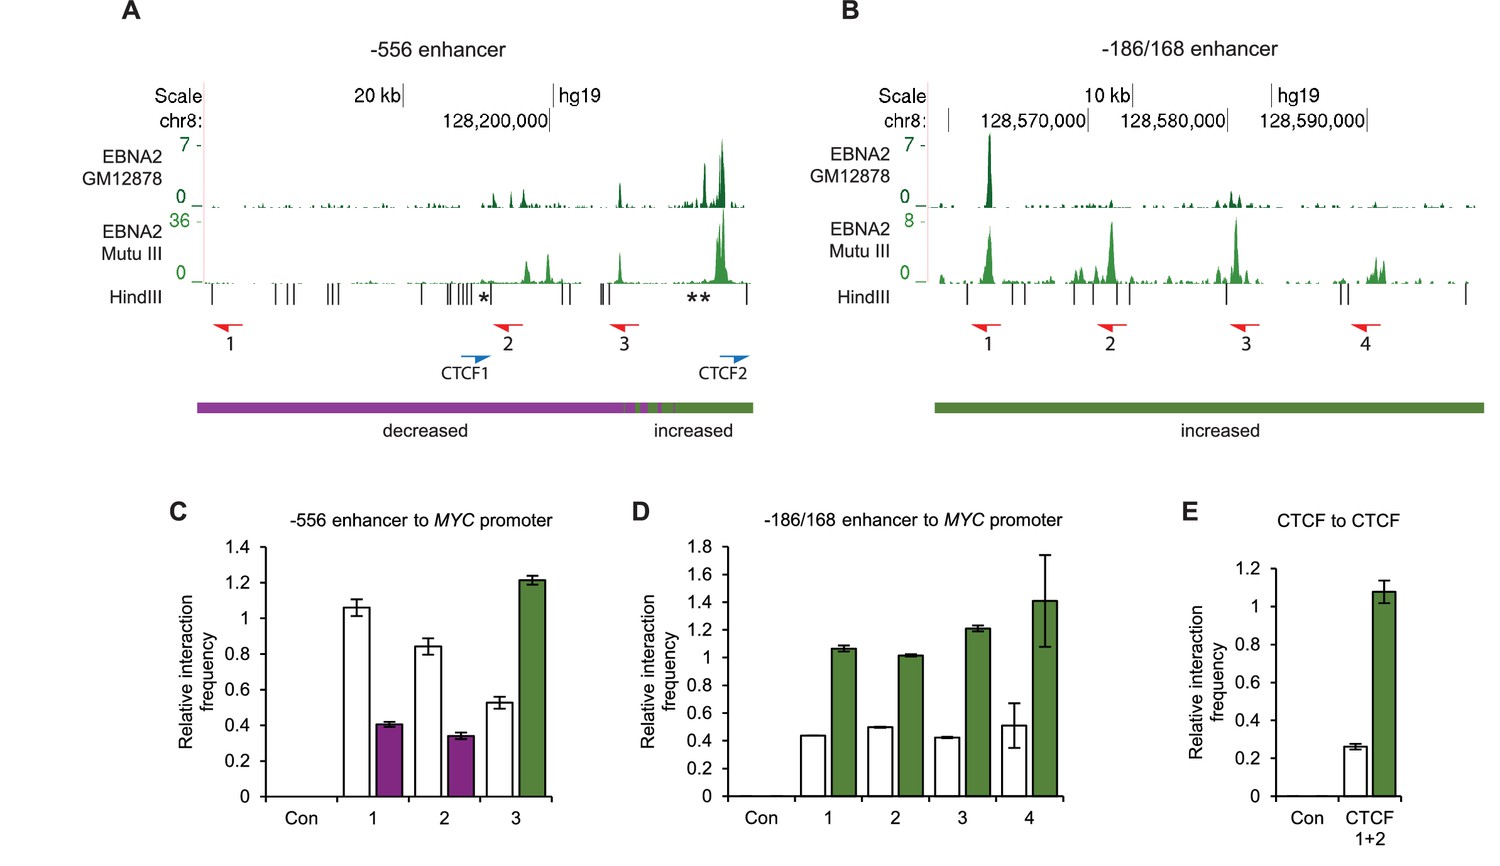
Chromosome conformation capture (3C) confirms EBNA2-induced changes at MYC and detects altered CTCF site interactions.
(A) EBNA2 binding at the −556 super-enhancer region. The positions of the HindIII restriction enzyme sites and the primers used for 3C are indicated. Red arrows indicate the position of the MYC enhancer primers used for promoter interaction analysis. Blue arrows indicate the position of the CTCF site primers used to analyse CTCF site interactions. Asterisks indicate the position of CTCF sites. There are two adjacent sites at the 3’ end of the region (see Figure 2—figure supplement 1). Primer design is unidirectional (Naumova et al., 2012). Purple and green lines indicate the regions that show reduced or increased interactions with the MYC promoter in 4C, with the transition area displaying a mix of increased and decreased interactions indicated by the checked line (see Figure 1). (B) EBNA2 binding and MYC enhancer primer positions in the −186/168 enhancer region (C) 3C analysis of interactions between the indicated −556 super-enhancer regions and the MYC promoter in the absence or presence of EBNA2 in ER-EB 2.5 cells. Promoter interactions with a region upstream of the −556 super-enhancer not bound by EBNA2 were analysed as a control (Con). Results show the mean ± standard deviation of signals from duplicate PCRs. (D) 3C analysis of interactions between the indicated EBNA2-bound −186/168 enhancer regions and the MYC promoter in the absence or presence of EBNA2. Control interaction analysis (Con) as in C. (E) 3C analysis of interactions between the CTCF sites in the −556 super-enhancer region in the absence and presence of EBNA2. CTCF site 2 interactions with the upstream control region were also analysed (Con).
Figure 2—figure supplement 1
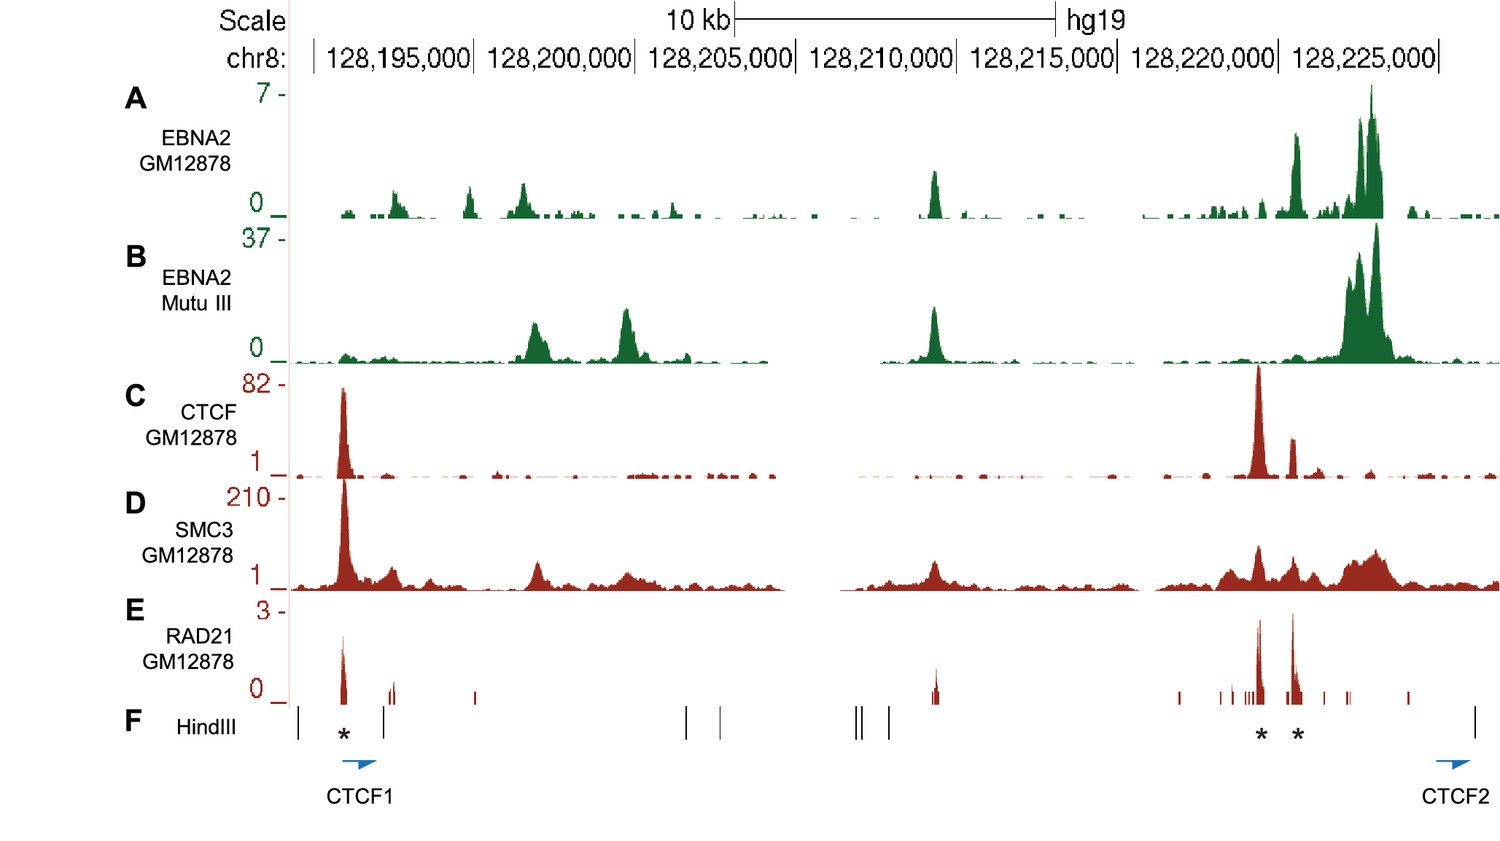
CTCF and Cohesin binding in the MYC -556 super-enhancer region.
(A) EBNA2 ChIP-sequencing reads in the GM12878 LCL and (B) Mutu III BL cells in the −556 region (as in Figure 2). ENCODE GM12878 ChIP-sequencing data for CTCF (C) and the cohesin subunits SMC3 (D) and RAD21 (E). (F) HindIII restriction enzyme sites and the location of the CTCF site primers used for 3C analysis (Figure 2). Asterisks indicate the position of three CTCF consensus binding motifs.
Figure 3 with 1 supplement
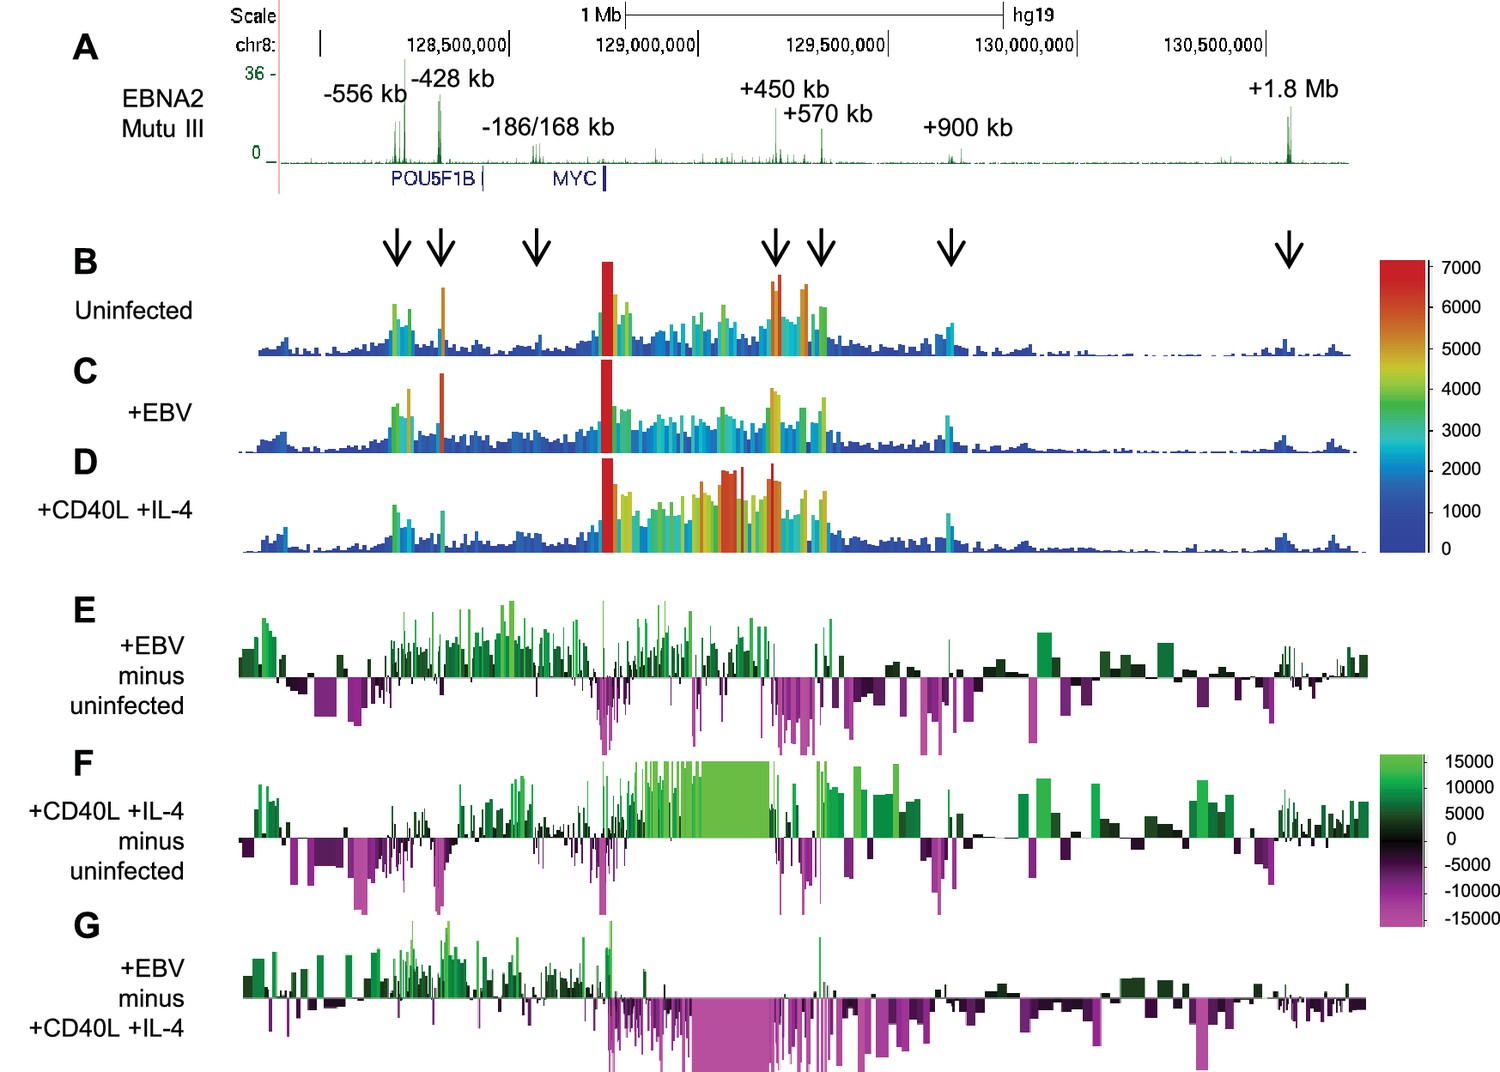
EBV infection of naïve B cells induces directional reorganisation of MYC promoter-enhancer interactions.
(A) EBNA 2 ChIP-sequencing reads in Mutu III BL cells (as in Figure 1). Interactions captured by 4C-seq using the MYC promoter as bait (as in Figure 1) in uninfected naïve B cells (B), B cells 48 hr post-EBV infection (C) and B cells 48 hr post-stimulation with CD40L/IL-4 (D). Subtraction of 4C-seq reads from uninfected B cells from those obtained from EBV-infected cells (E) or CD40L/IL-4 treated cells (F). Reads shown are from both replicates combined. The scale bar shows reads per 10 kb window per million reads of sequencing library. (G) Subtraction of 4C-seq reads from CD40L/IL4-treated cells from those obtained from EBV-infected cells. The scale bar shows the normalised interaction read count difference.
Figure 3—figure supplement 1
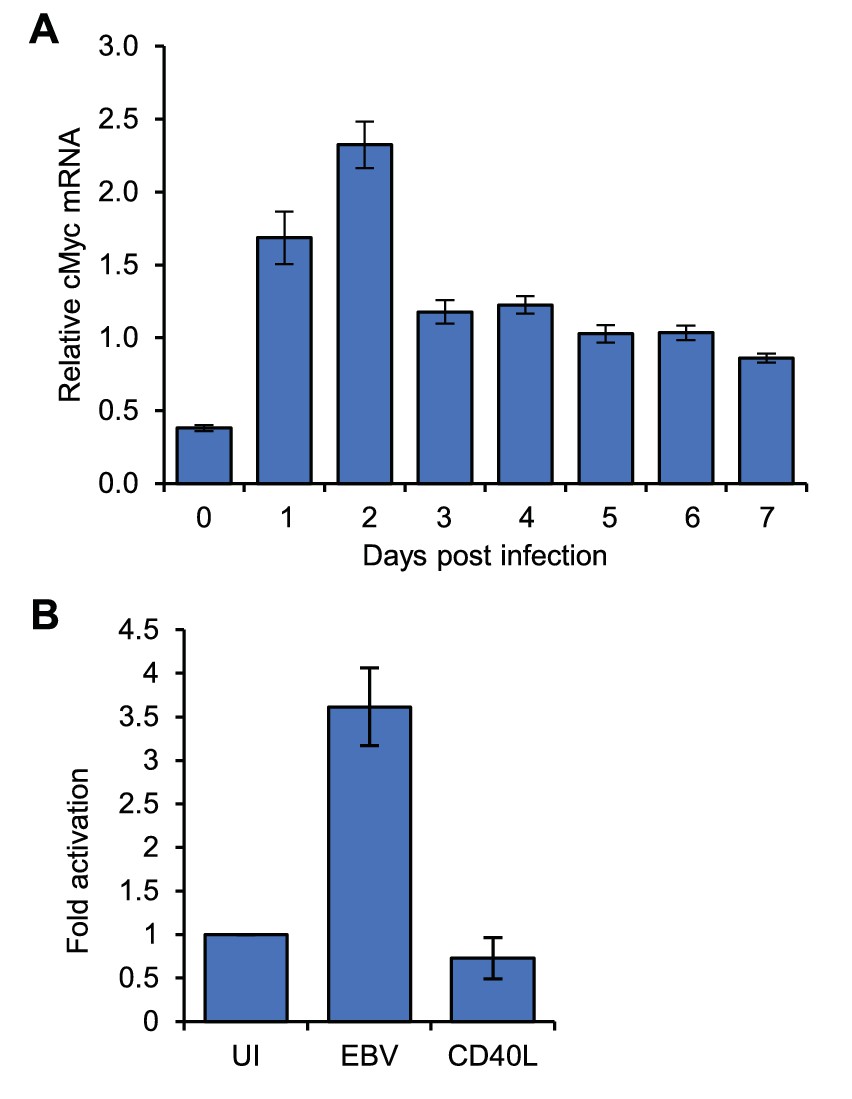
MYC mRNA induction on EBV infection.
(A) RT-QPCR analysis of MYC mRNA expression over a B-cell infection time course to determine the optimum time for MYC induction. (B) RT-QPCR analysis of MYC mRNA expression in the naïve, EBV-infected and CD40L/IL-4 B cell samples used for 4C-seq. Signals were normalised to β2-microglobulin mRNA levels as GAPDH is induced on B-cell infection. Results show the mean ± standard deviation of QPCR duplicates.
Figure 4
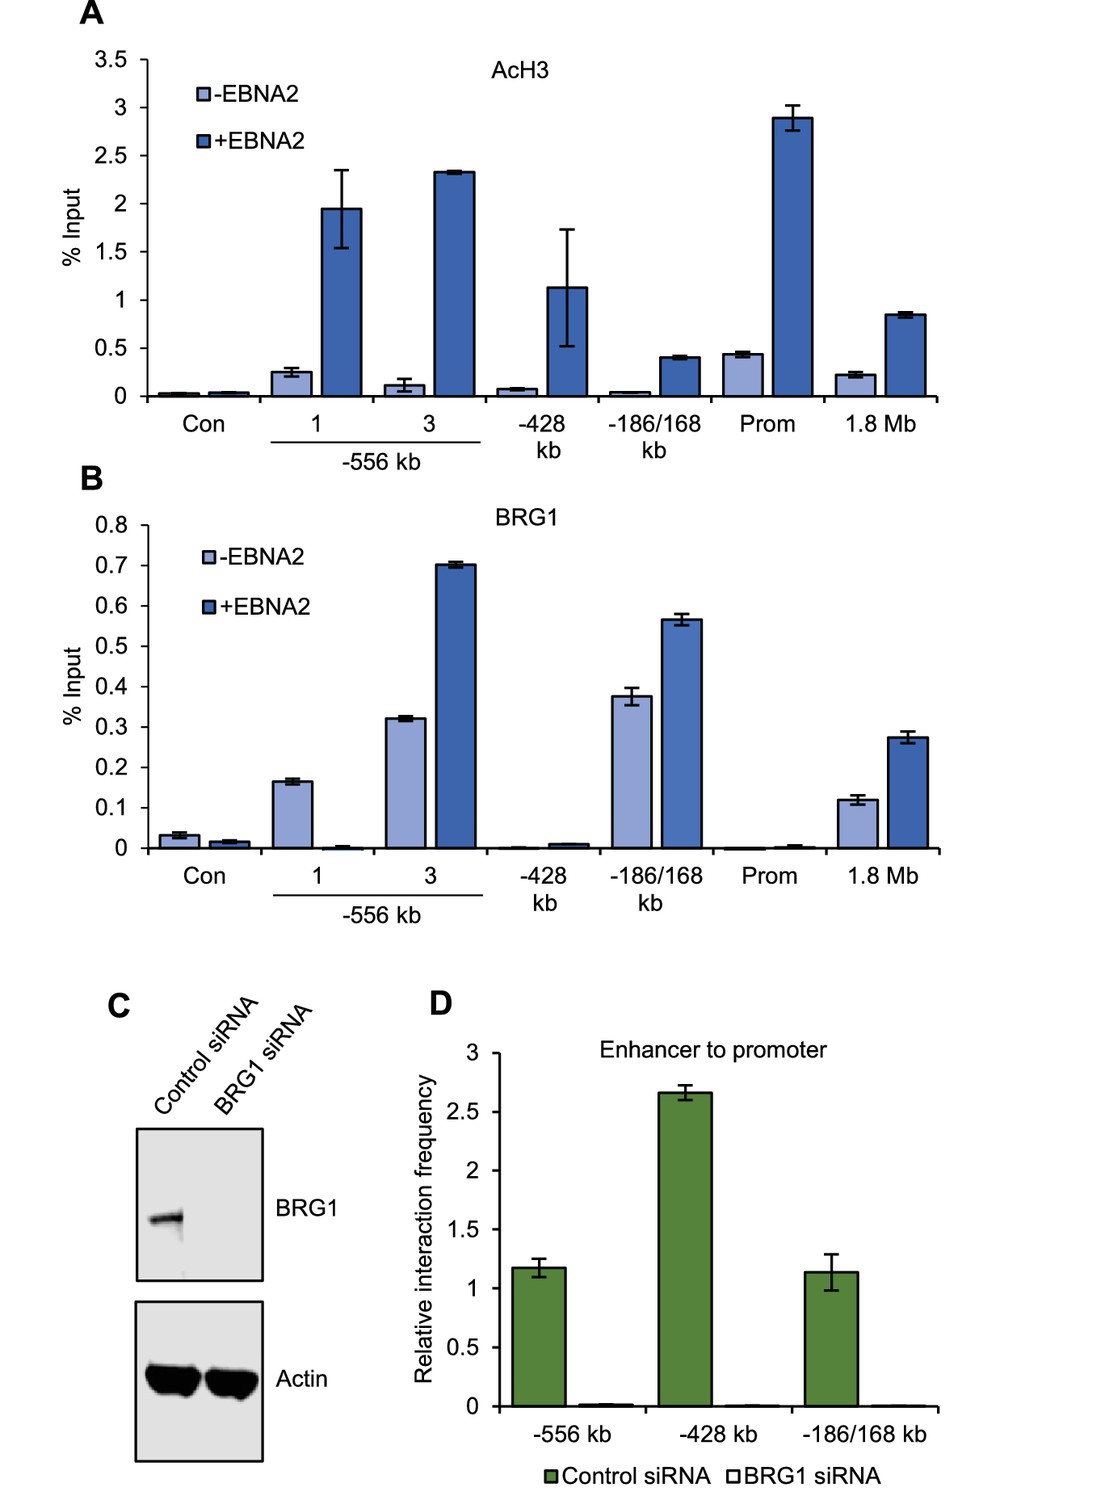
BRG1 is required for upstream MYC enhancer-promoter interactions in EBV-infected cells.
(A) ChIP-QPCR analysis of H3 acetylation at MYC in ER-EB 2.5 cells minus or plus β-estradiol (± EBNA2). Precipitated DNA was analysed using primer sets located at the main EBNA2-bound enhancers. For the −556 SE analysis included a region where decreased interactions were observed (1) and the −556 main peak where increased interactions were observed (3) (see Figure 2). The signal at a control region not bound by EBNA2 (used for 3C analysis in Figure 2) was used as a negative control for binding (Con). Mean percentage input signals, after subtraction of no antibody controls, are shown ± standard deviation for two independent ChIP experiments. (B) ChIP-QPCR analysis of BRG1 binding at MYC in ER-EB 2.5 cells minus or plus β-estradiol (± EBNA2). (C) Western blot analysis of BRG1 expression in GM12878 transiently transfected with control or BRG1-specific siRNAs. Actin was used as a loading control. (D) Chromosome conformation capture analysis of the interaction of EBNA2-bound upstream enhancerswith the MYC promoter in control and BRG1 siRNA transfected GM12878 cells. Results show the mean ± standard deviation of signals from duplicate PCRs.
Figure 5 with 2 supplements
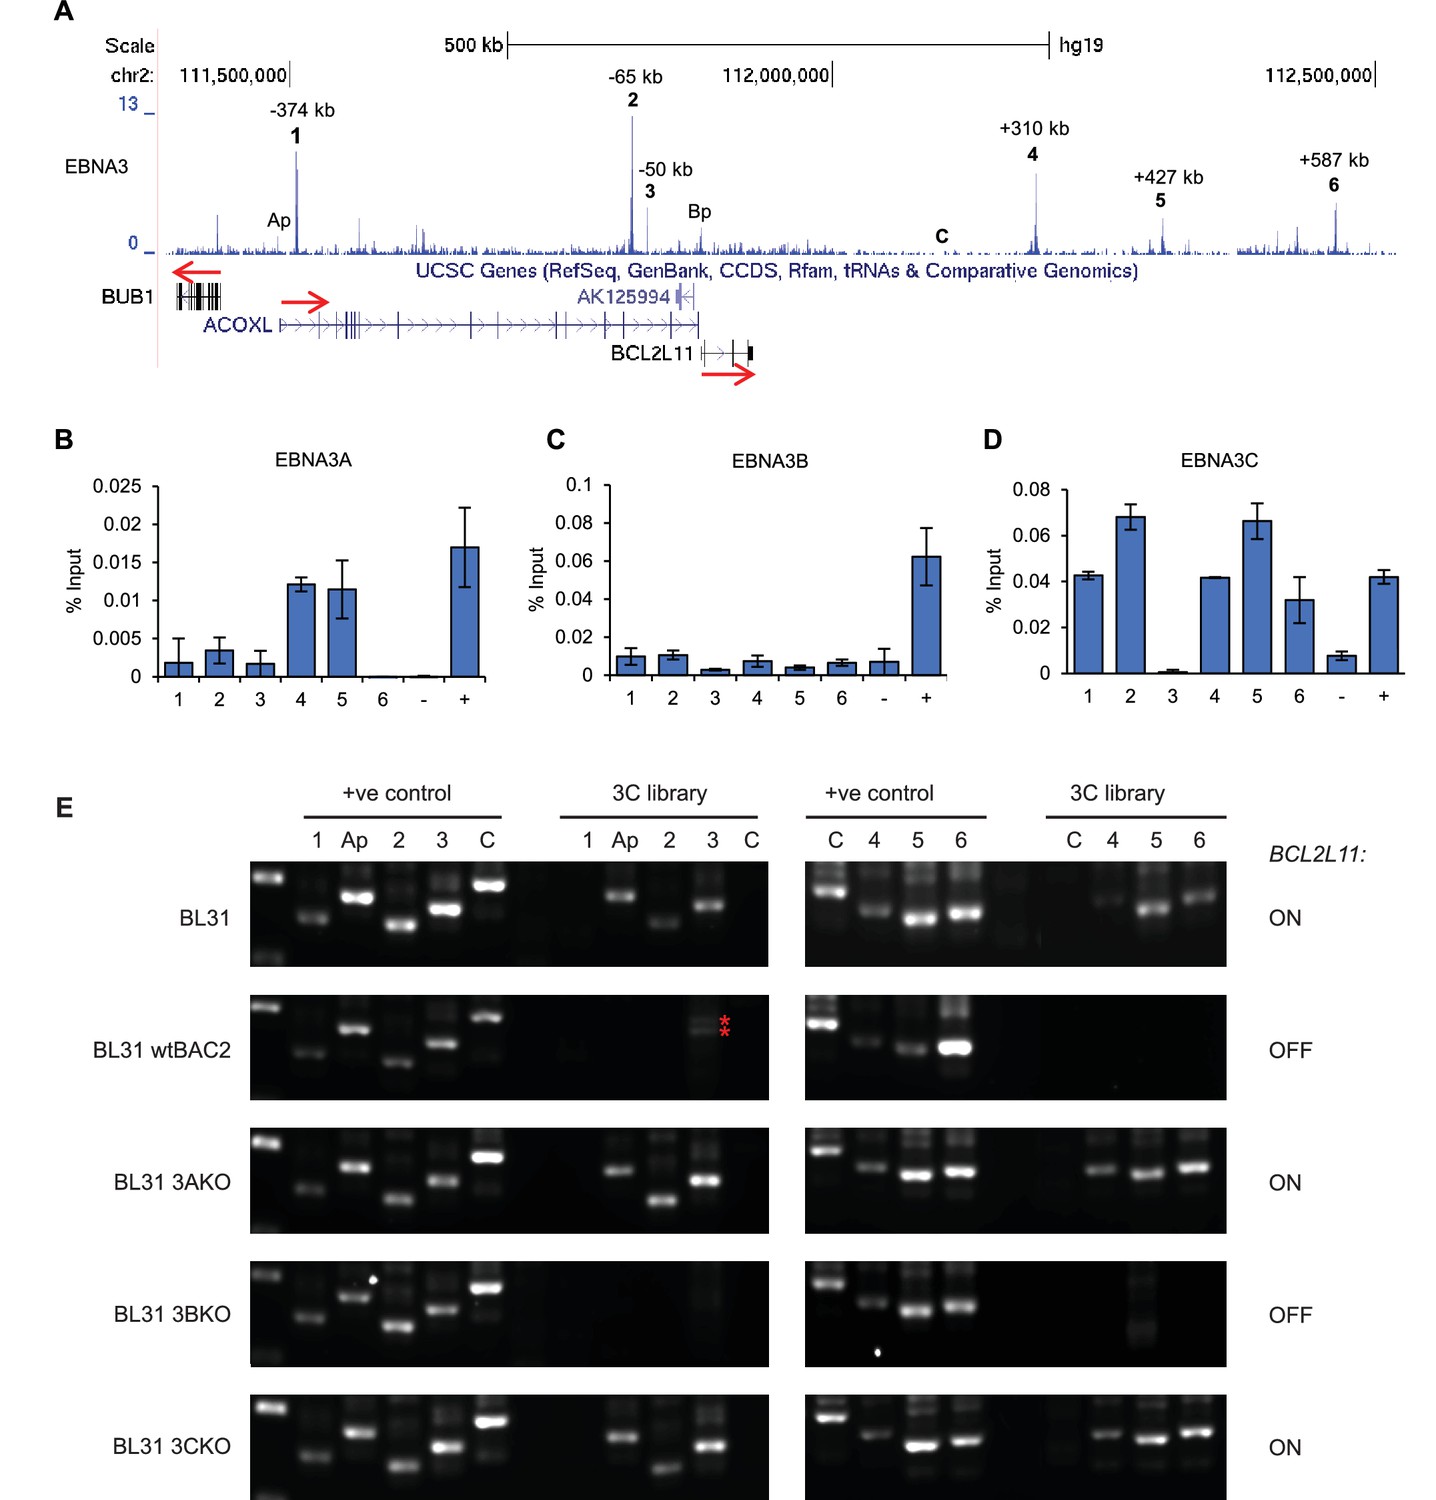
EBNA3A and 3C repress BCL2L11 by inactivating a long-range enhancer hub.
(A) ChIP-sequencing reads for EBNA3A/3B/3C at the BCL2L11 locus in Mutu III BL cells. The major EBNA3-bound sites are numbered 1–6 and their location relative to the transcription start site of the BCL2L11 promoter is indicated. Binding peaks at the ACOXL (Ap) and BCL2L11 promoters (Bp) are also indicated. ChIP-QPCR analysis of EBNA3A binding (B) EBNA3B binding (C) and EBNA3C binding (D) in the EBV-negative BL31 BL cell-line infected with wild-type recombinant EBV (BL31 wtBAC2). Precipitated DNA was analysed using primer sets located at EBNA3A/3B/3C binding sites (binding at the BCL2L11 promoter has been previously characterised [McClellan et al., 2013]). The signal at the transcription start site of PPIA was used as a negative control for binding (−).The previously characterised CTBP2 binding site was used as a positive control for EBNA3A and EBNA3C binding (+). The RUNX3 superenhancer was used as a positive control for EBNA3B binding (Gunnell et al., 2016). Mean percentage input signals, after subtraction of no antibody controls, are shown ± standard deviation for two independent ChIP experiments. (E) Chromosome conformation capture (3C) analysis of BCL2L11 promoter interactions between enhancers 1–6 and the ACOXL promoter in the EBV-negative BL cell-line BL31 and in BL31 cells infected with wild-type recombinant EBV (wt BAC2), EBNA3A knock-out EBV (EBNA3AKO), EBNA3B knock-out EBV (EBNA3BKO) and EBNA3C knock-out EBV (EBNA3CKO). A control region (C) not bound by the EBNAs was also included in the analysis. Positive controls show amplification of a digested and ligated genomic PCR fragment library containing all ligation junctions. The expression status of BCL2L11 in each line is indicated on the right. The red asterisks indicates non-specific amplification products of incorrect size.
Figure 5—figure supplement 1
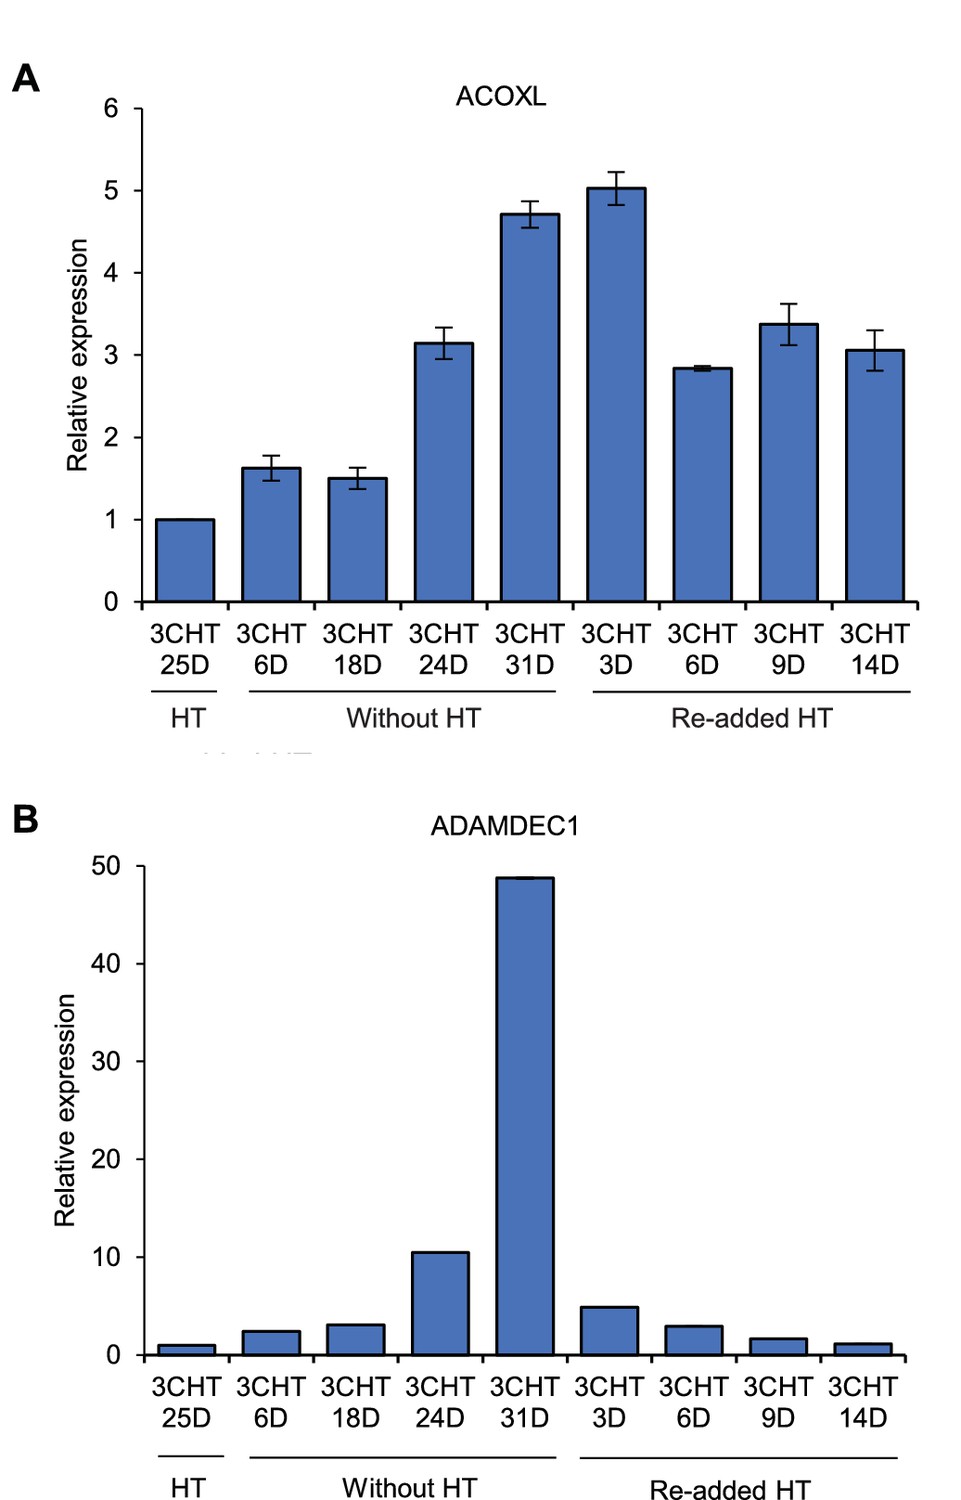
ACOXL is repressed by EBNA3C.
LCLs expressing HT-EBNA3C were grown in the presence of HT for 25 days (EBNA3C on) and then HT was washed off and cells cultured in its absence for 21 days (EBNA3C off). Cells then either had HT re-added and were cultured for up to another 14 days to re-instate EBNA3C function or were maintained in HT for a further 10 days to maintain EBNA3C inactivity. (A) ACOXL mRNA levels were determined by RT-PCR and signals were normalised to GAPDH and expressed relative to the expression level at the start of the experiment. Results show the mean ± standard deviation for duplicate QPCR samples from a representative experiment. (B) ADAMDEC1 mRNA analysis. ADAMDEC1 (McClellan et al., 2012) is a known EBNA3C repressed gene and serves as a control for the EBNA3C-HT withdrawal and add back.
Figure 5—figure supplement 2
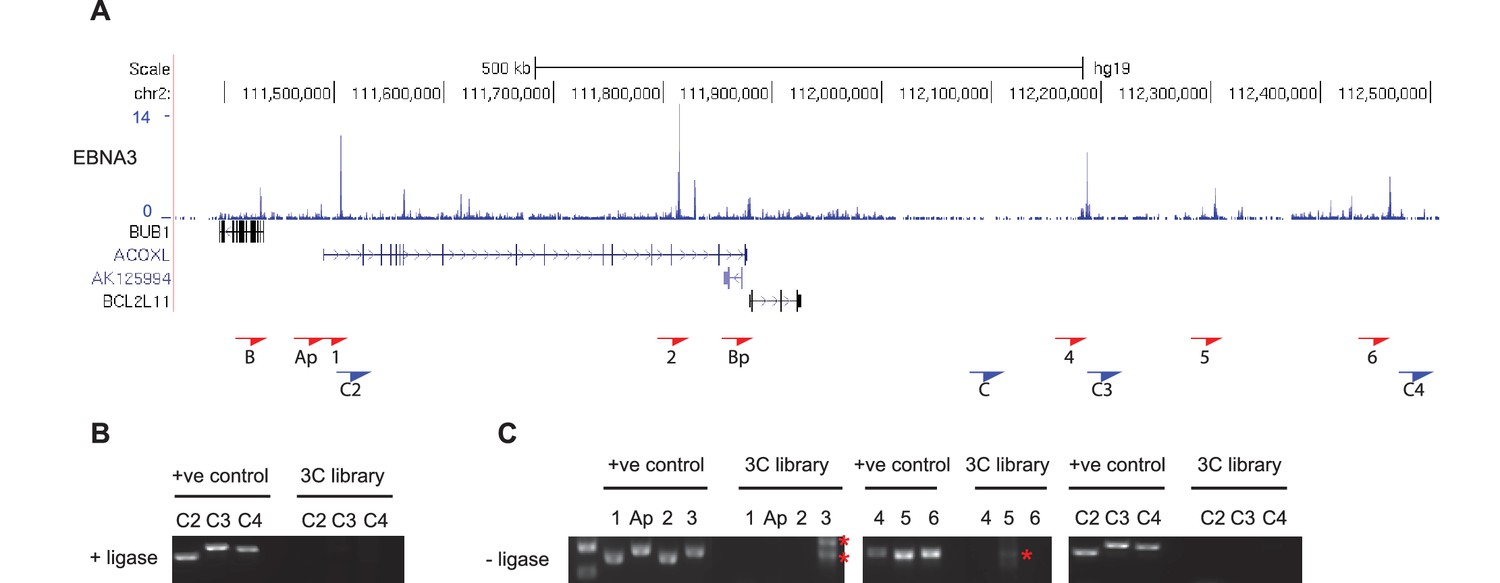
Additional BCL2L11 chromosome conformation capture controls.
(A) EBNA3A/3B/3C binding at the BCL2L11 locus as in Figure 5 showing the locations of the primers used for 3C analysis. Primer design is unidirectional. (B) 3C analysis in BL31 cells to examine BCL2L11 promoter interactions with additional intervening control regions where there is no EBNA3A or EBNA3C binding (C2, C3, C4). (C) Control 3C analysis using BL31 cell chromatin that was digested but incubated in the absence of ligase (-ligase). Analysis was performed using primers to detect enhancer-promoter and promoter-promoter interactions as in Figure 5 and using the additional control primers. Red asterisks indicate the position of non-specific PCR products of the incorrect sizes (verified by sequencing).
Figure 6 with 1 supplement
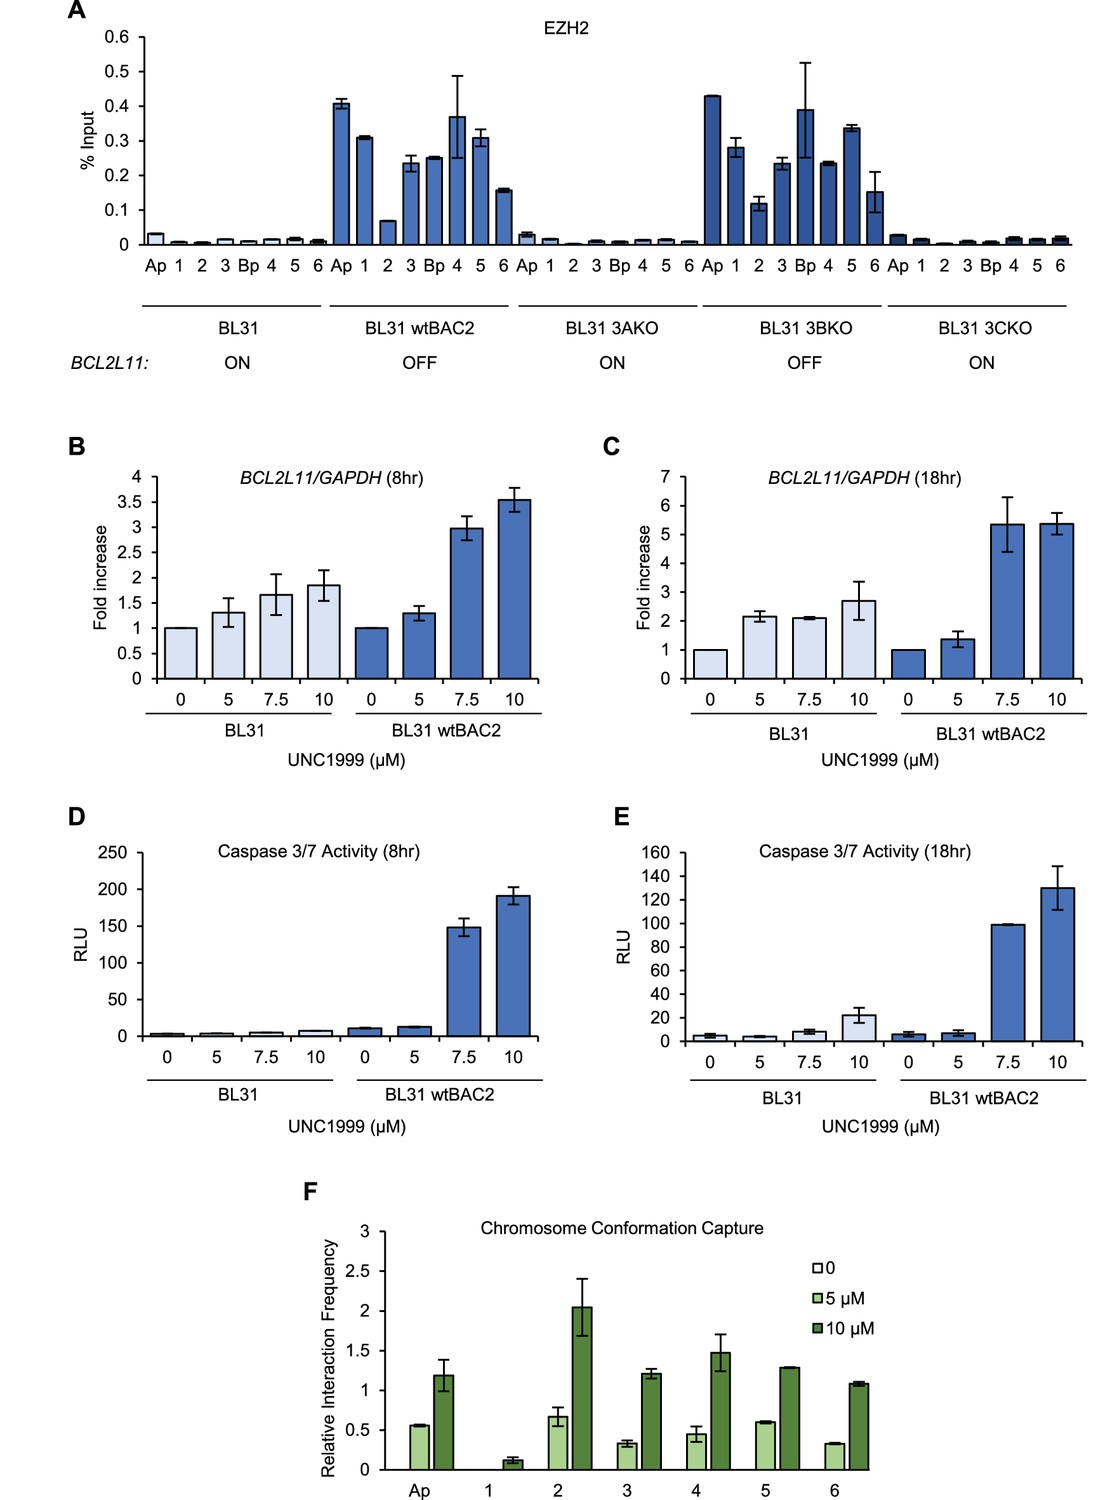
EZH1/2 activity is required for the disruption of the BCL2L11 and ACOXL enhancer hub.
(A) ChIP-QPCR analysis of EZH2 binding in the BL31 cell line series used in Figure 5. The expression status of BCL2L11 in each cell line is shown. (B) RT-QPCR analysis of BCL2L11 mRNA expression in EBV negative BL31 cells or BL31 cells infected with wild-type recombinant EBV (BL31 wtBAC2) treated with the EZH2 inhibitor UNC1999 for 8 hr. Signals were normalised to GAPDH mRNA levels and expressed as fold increase compared to untreated cells. (C) BCL2L11 mRNA expression in BL31 and BL31 wtBAC2 cells treated with UNC1999 for 18 hr. (D) Caspase 3/7 activity in BL31 or BL31 wtBAC2 cells treated with UNC1999 for 8 hr. Caspase signals shown are corrected for the number of live cells. (E) Caspase 3/7 activity in cells treated for 18 hr. (F) Chromosome conformation capture analysis of BCL2L11 promoter interactions between enhancers 1–6 and the ACOXL promoter in BL31 wtBAC2 cells treated with UNC1999 for 24 hr. Primers are as in Figure 5 and Figure 5—figure supplement 2.
Figure 6—figure supplement 1
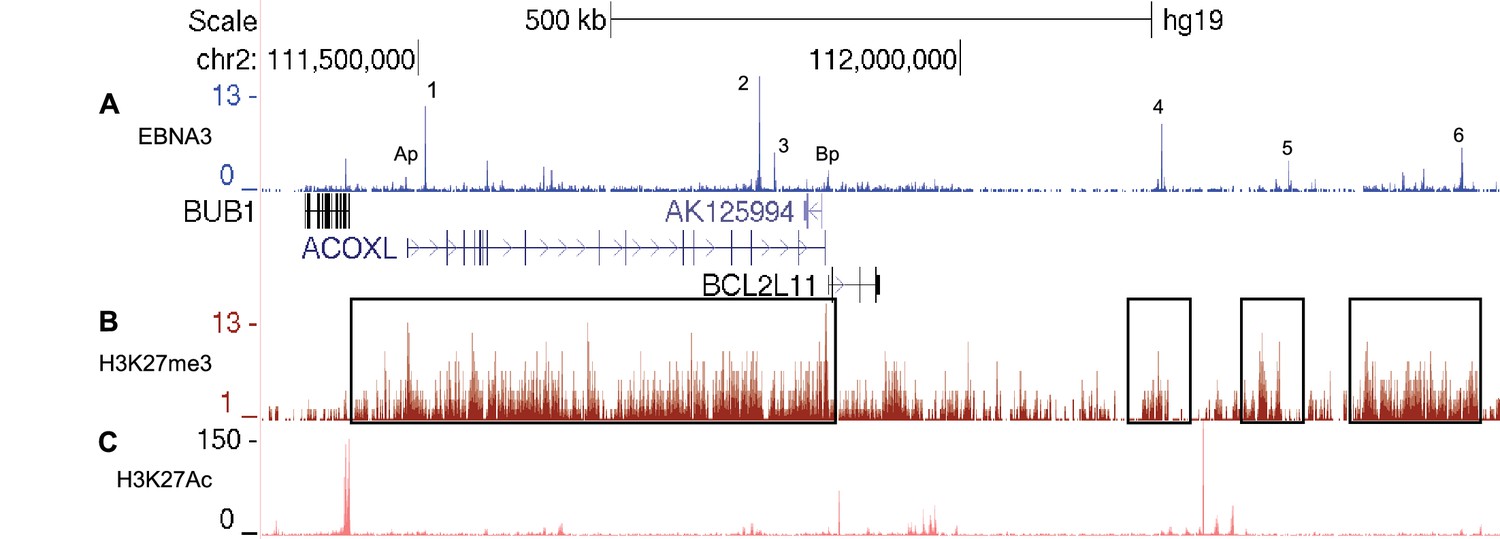
EBNA3A and EBNA3C-bound enhancers at the BCL2L11/ACOXL locus are within H3K27me3 repressed domains.
(A) EBNA3A/3B/3C ChIP-sequencing from Mutu III BL cells as in Figure 5. (B) H3K27me3 ChIP-sequencing signals in GM12878 cells (ENCODE). Boxes show the H3K27me3 domain encompassing the entire ACOXL gene and the BCL2L11 promoter (and enhancers 1–3) and the domains that encompass enhancers 4, 5 and 6.(C) H3K27Ac ChIP-sequencing signals in GM12878 (ENCODE).
Figure 7
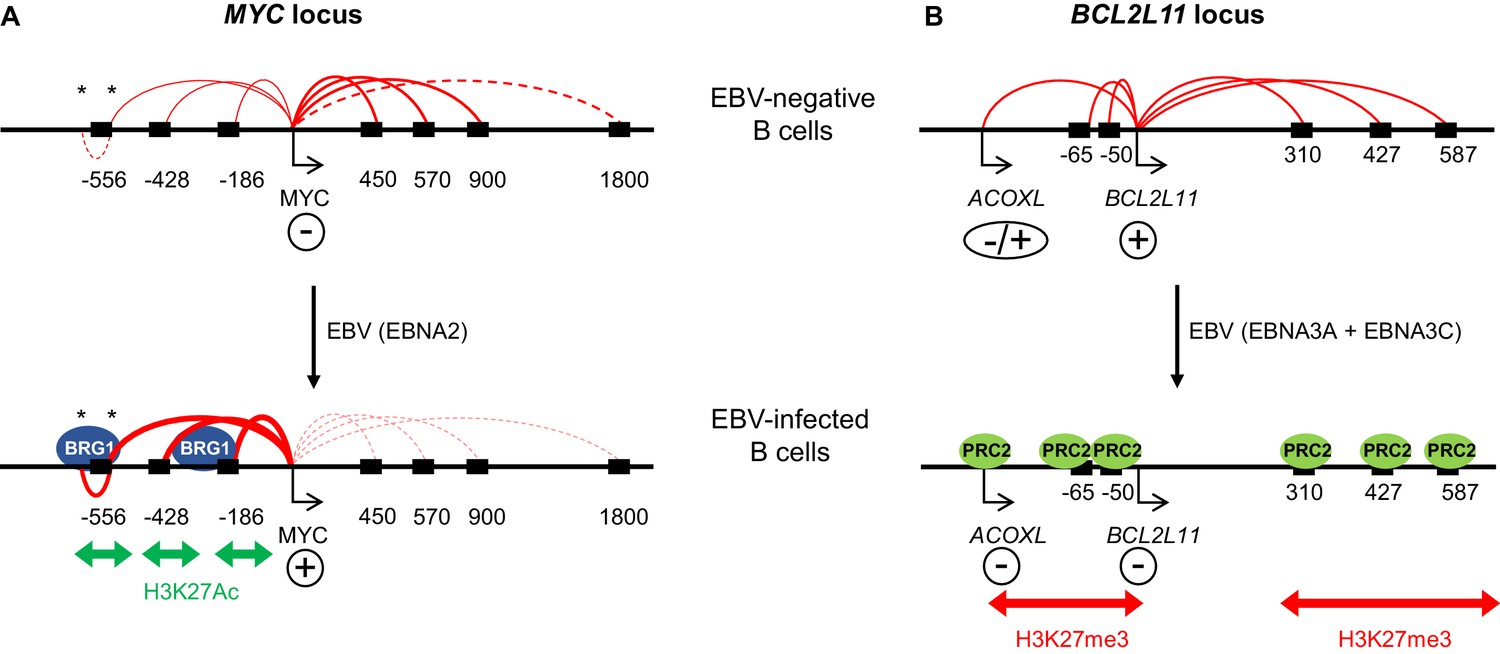
Model showing the mechanism of MYC activation and BCL2L11 repression by EBV transcription factors.
(A) In uninfected B cells, MYC promoter interactions with downstream enhancers dominate. MYC activation on EBV infection by the EBV TF EBNA2 occurs through the activation of three major clusters of upstream enhancers at −556, −428 and −186/168 kb (indicated by black boxes). This is associated with increased H3K27ac and BRG1 binding. EBNA2 promotes interactions between the MYC promoter and these upstream enhancers and reduces interactions with downstream enhancers. As part of this three-dimensional MYC enhancer reorganisation, EBNA2 also increases interactions between CTCF-bound regions (asterisks) in the −556 kb super-enhancer. (B) BCL2L11 is repressed on EBV-infection by the EBV repressors EBNA3A and EBNA3C through the inactivation of multiple enhancers in regulatory hub encompassing the ACOXL gene. Enhancer inactivation is associated with PRC2 (EZH2) binding, increased H3K27me3 and the loss of enhancer-promoter interactions. Arrows indicate transcription start sites. Genes are indicated as expressed (+) or repressed (−). ACOXL is repressed or expressed at low-level (±).
Additional files
-
Supplementary file 1
Super-enhancers predicted by H3K27ac signal and profile at EBNA2-bound MYC enhancers in normal and cancer cells by dbSUPER (http://bioinfo.au.tsinghua.edu.cn/dbsuper/29).
- https://doi.org/10.7554/eLife.18270.016
-
Supplementary file 2
Super-enhancers predicted by H3K27ac signal and profile at EBNA3A or EBNA3C-bound BCL2L11 enhancers in normal and cancer cells as in Supplementary file 1.
- https://doi.org/10.7554/eLife.18270.017
-
Supplementary file 3
Primers used for 4C and 3C analysis.
- https://doi.org/10.7554/eLife.18270.018
-
Supplementary file 4
Primers for ChIP-Q-PCR and RT-QPCR analysis.
- https://doi.org/10.7554/eLife.18270.019
Download links
A two-part list of links to download the article, or parts of the article, in various formats.
Downloads (link to download the article as PDF)
Open citations (links to open the citations from this article in various online reference manager services)
Cite this article (links to download the citations from this article in formats compatible with various reference manager tools)
MYC activation and BCL2L11 silencing by a tumour virus through the large-scale reconfiguration of enhancer-promoter hubs
eLife 5:e18270.
https://doi.org/10.7554/eLife.18270


