A multi-protein receptor-ligand complex underlies combinatorial dendrite guidance choices in C. elegans
- Howard Hughes Medical Institute, Stanford University, United States
- University of California, Davis, United States
Figures
Figure 1 with 1 supplement
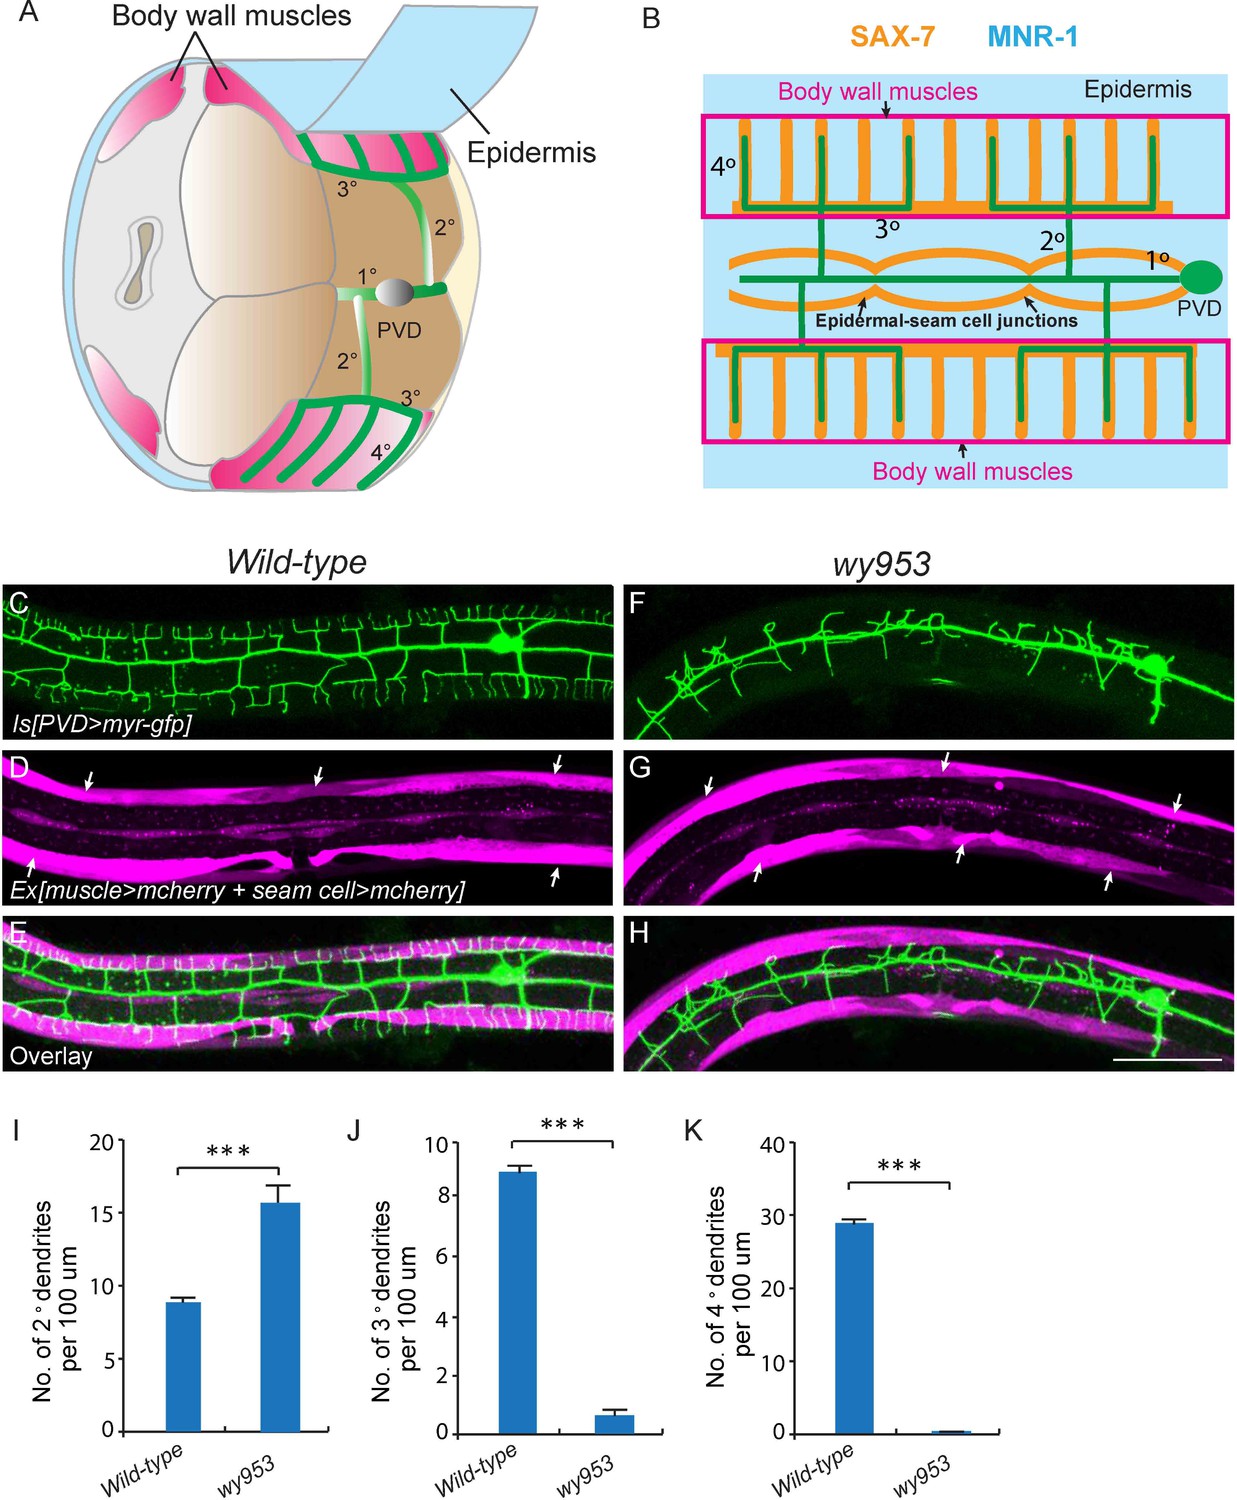
wy953 mutants show severe dendritic guidance defects.
(A) A cartoon showing the morphology of part of a PVD dendritic tree and its growth environment (adapted from Albeg et al., 2011). 1°: primary dendrites; 2°: secondary dendrites; 3°: tertiary dendrites; 4°: quaternary dendrites; Note that tertiary dendrites grow along the border of outer body wall muscles, and quaternary dendrites are sandwiched between epidermis and body wall muscles. (B) A cartoon showing the morphology of PVD dendritic arbors and the localization of SAX-7 and MNR-1, which regulate PVD dendritic patterning. MNR-1 is evenly distributed on the epidermis. SAX-7 is enriched along tertiary lines, quaternary stripes and epidermal-seam cell junctions. Red boxes highlight the quaternary dendrites that are sandwiched between the epidermis and body wall muscles. (C–H) Confocal images showing PVD dendrites (labeled in green using transgene ser2prom3>myr-gfp here and in subsequent figures), body wall muscles (arrows, labeled in magenta using transgene Pmyo-3>mcherry here and in subsequent figures) and seam cells (labeled in magenta using transgene Pnhr-81>mcherry here and in subsequent figures, close to the 1° dendrites of PVD neurons) in wild-type (C–E) and wy953mutant (F–H) worms. Scale bar: 50 μm. (I–K) Quantifications showing the number of 2°, 3° and 4° dendrites in a 100 μm region anterior to the cell body of PVD neurons. Student’s t-test was used for statistical analysis. ***p<0.0001. Data are represented as mean ± SEM. 16 animals were quantified for each genotype.
Figure 1—figure supplement 1
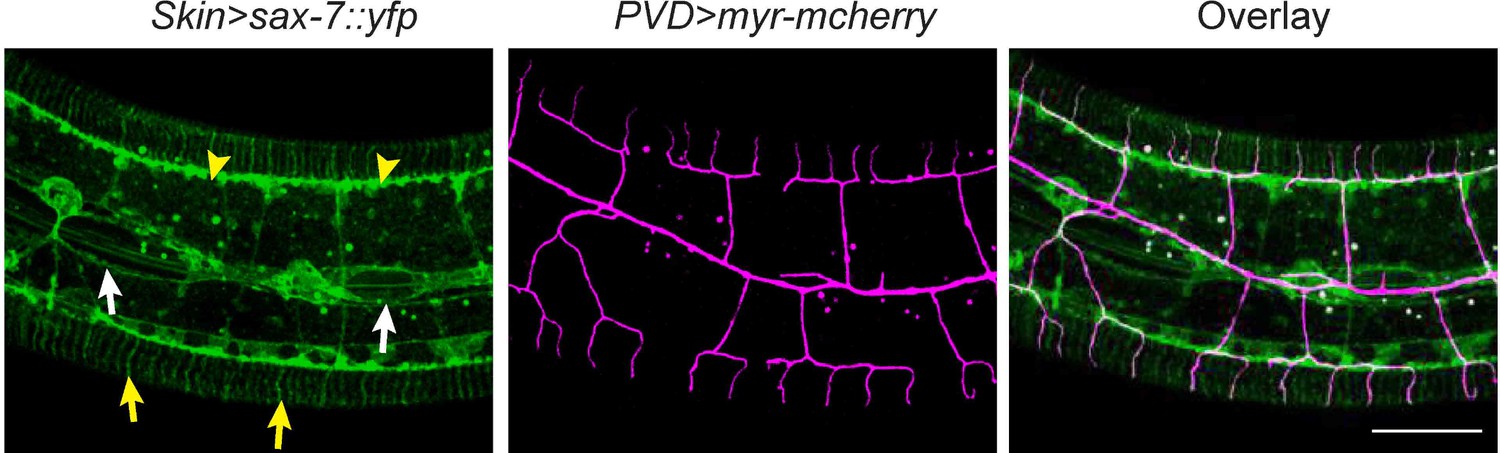
PVD dendrites do not grow along all the SAX-7 positive loci.
Confocal images showing the subcellular localization of SAX-7::YFP expressed in the epidermis(left), the morphology of PVD dendritic arbors (middle) and overlay (right). Arrow heads: tertiary line along the border of outer body wall muscles; Yellow arrows: quaternary stripes where quaternary dendrites grow along. White arrows: epidermal-seam cell junctions labeled by SAX-7::YFP. Note that PVD dendrites mainly grow along the SAX-7 signal in the epidermal-muscle interface but rarely grow along the epidermal-seam cell junctions. Scale bar: 20 μm.
Figure 2 with 1 supplement

Cloning and rescue of lect-2.
(A) Schematic of the LECT-2 protein with alleles indicated. (B–C) Confocal images showing the PVD dendritic arbors in lect-2(ok2617) mutants and lect-2(ok2617); wyTi3 [loxp -Plect-2>lect-2::SL2:: mcherry-loxp]. Body wall muscles were labeled in both images, while seam cells were labeled in B but not C. Scale bar: 50 μm. (D–F) Quantifications showing the number of 2°, 3° and 4° dendrites in a 100 μm region anterior to the cell body of PVD neurons. One way ANOVA with the Dunnett’s correction was used for statistical analysis. ***p<0.0001. Data are represented as mean ± SEM. 16, 12 and 12 animals were quantified for each genotype, respectively.
Figure 2—figure supplement 1
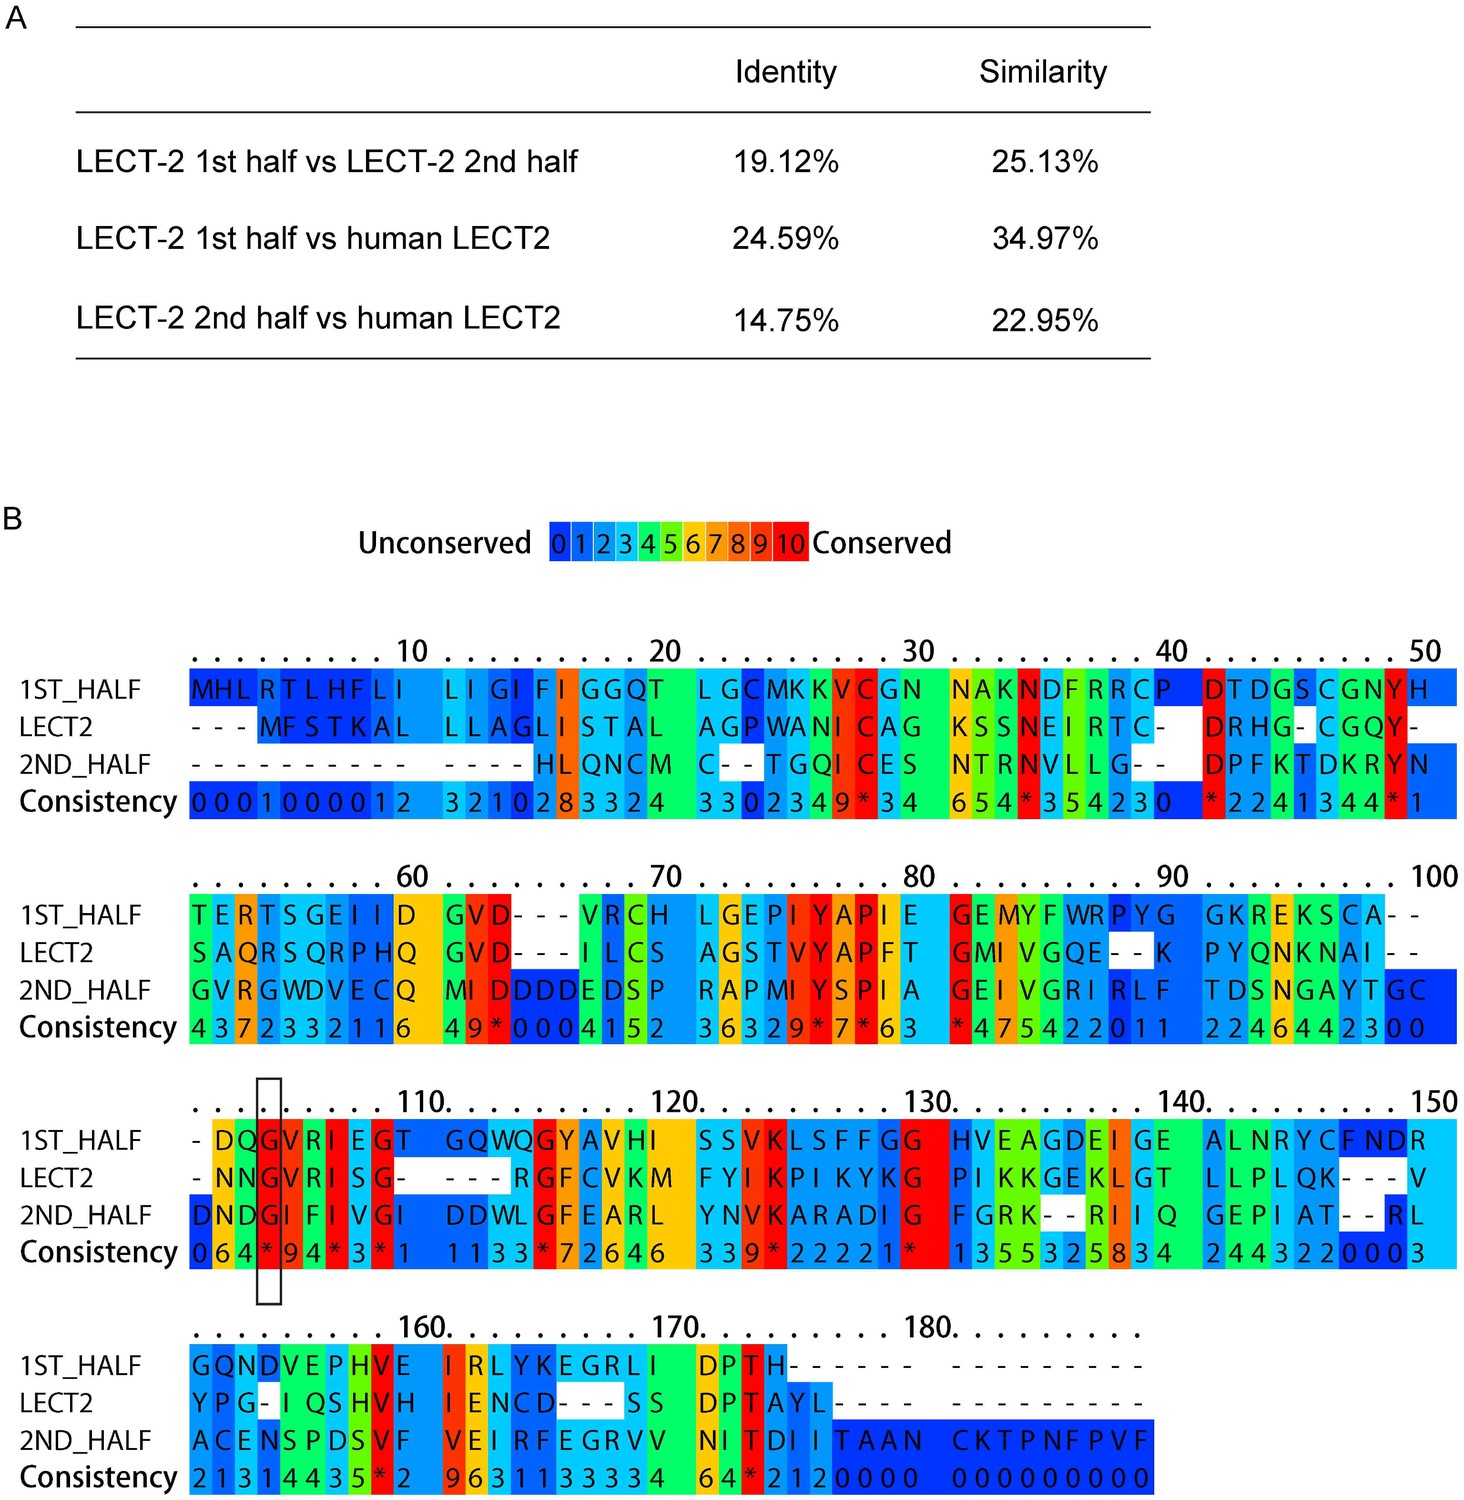
LECT-2 is homologous to human LECT2.
(A) Scores of identify and similarity between LECT-2 first half (1–168 amino acids), LECT-2 second half (169–333 amino acids) and human LECT2 (151 amino acids) using SIAS (http://imed.med.ucm.es/Tools/sias.html). (B) Alignment of the amino acid sequences of LECT-2 first half, LECT-2second half and human LECT2 using PRALINE (http://www.ibi.vu.nl/programs/pralinewww/). The conserved glycine residues mutated in wy953 and wy935 mutants were highlighted by a black box.
Figure 3
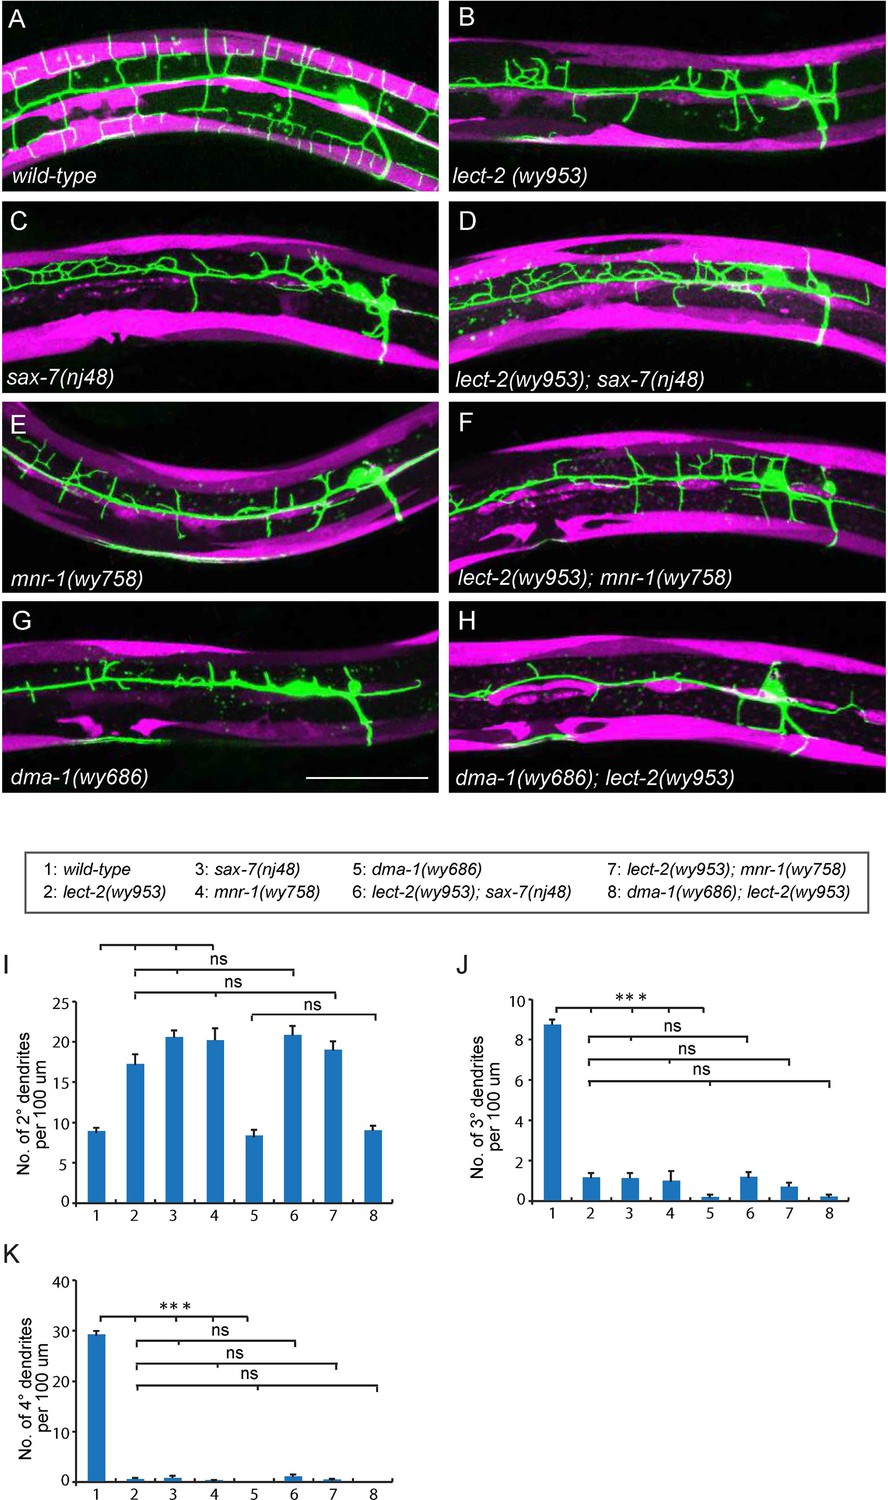
lect-2 functions in the same genetic pathway as sax-7, mnr-1 and dma-1.
(A–H) Confocal images showing PVD dendritic arbors, body wall muscles and seam cells in (A) wild-type; (B) lect-2(wy953); (C) sax-7(nj48); (D) lect-2(wy953); sax-7(nj48); (E) mnr-1(wy758); (F) lect-2(wy953); mnr-1(wy758); (G) dma-1(wy686) and (H) dma-1(wy686); lect-2(wy953) mutants. Scale bar: 50 μm. (I–K) Quantifications of (I) number of 2° dendrites; (J) number of 3° dendrites; (K) number of 4° dendrites in a 100 μm region anterior to the cell body of PVD neurons. One way ANOVA with the Tukey correction was used for statistical analysis. ***p<0.0001. ns: not significant. Data are represented as mean ± SEM. 16 animals were quantified for each genotype, except for lect-2; sax-7 (13 animals were quantified).
Figure 4 with 1 supplement
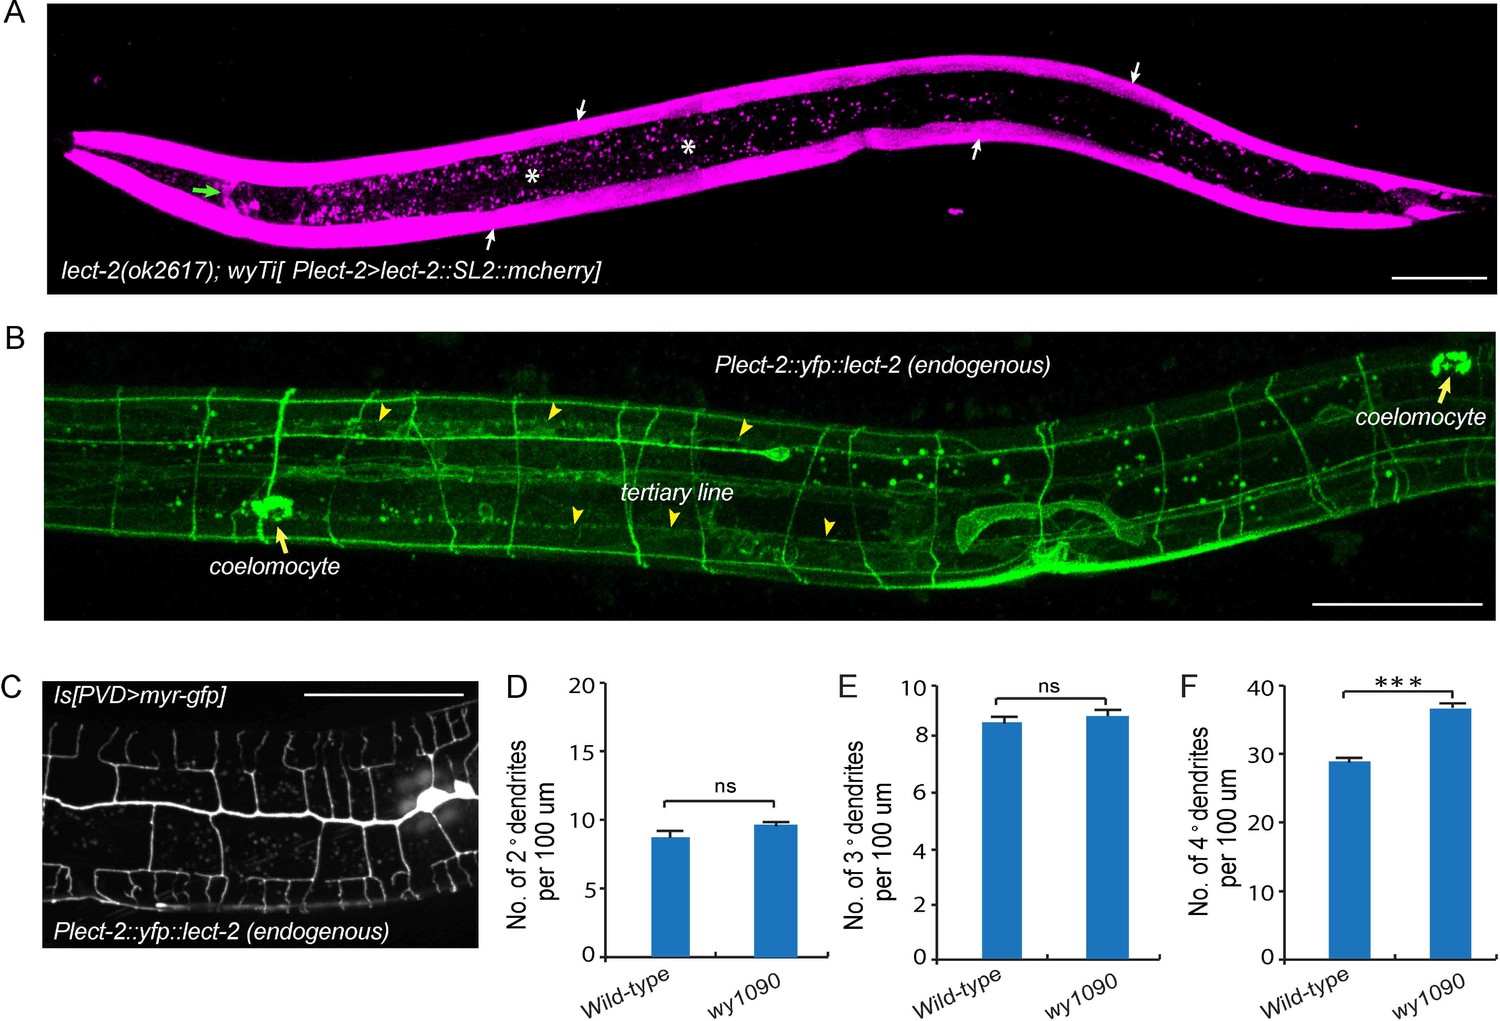
Transcriptional and translational expression patterns of lect-2.
(A) A confocal image showing the transcriptional expression pattern of lect-2 in an L4 stage animal. White arrows: body wall muscles. Green arrow: head neurons. Asterisks: auto fluorescence from the gut granules in the intestinal cells. Scale bar: 50 μm. (B) A confocal image showing the translational expression pattern of endogenously expressed YFP::LECT-2 in an L4 stage animal. Scale bar: 50 μm. (C) A confocal image showing the morphology of PVD dendritic arbors of a yfp::lect-2 knock-in animal at L4 stage. Arrow heads: tertiary line along the border of outer body wall muscles. Arrows: coelomocytes. Scale bar: 50 μm. (D–F) Quantifications showing the number of 2°, 3° and 4° dendrites in a 100 μm region anterior to the cell body of PVD neurons. Student’s t-test was used for statistical analysis. ***p<0.0001. ns: not significant. Data are represented as mean ± SEM. 16 animals were quantified for each genotype.
Figure 4—figure supplement 1
lect-2 is expressed in some ventral cord neurons.
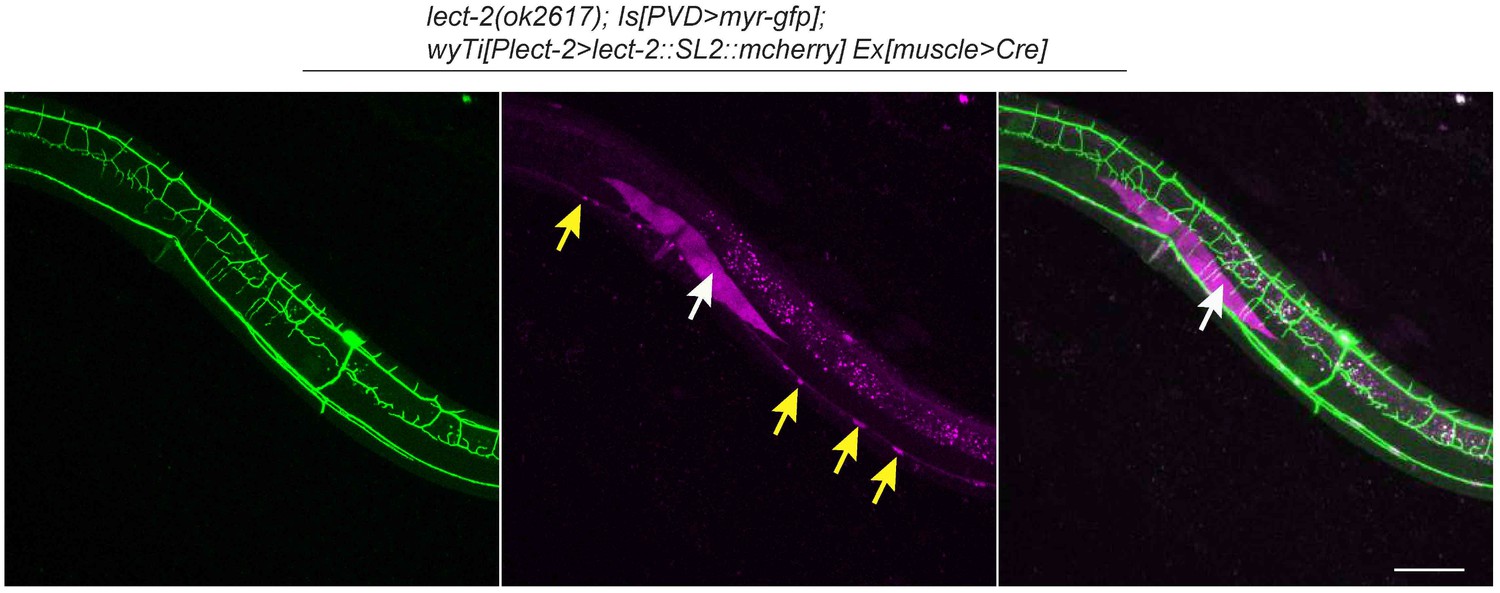
Confocal images showing the morphology of PVD dendritic arbors and the mCherry expression driven by lect-2 endogenous promoter. Yellow arrow: ventral cord neurons. White arrow: a single body wall muscle. Note that one muscle cell was mCherry positive, while other muscles were not labeled by mCherry as wyTi3 [loxp- Plect-2>lect-2::SL2::mcherry -loxp] was deleted by Cre in these cells. 4° dendrites were formed on top of the lect-2(+) muscle but not other lect-2(-) muscles. Scale bar: 50 μm.
Figure 5

Body wall muscle-expressed LECT-2 is required for the patterning of 4° but not 2° or 3° dendrites.
(A–B) Confocal images showing the PVD dendritic arbors (labeled in green using transgene ser2prom3>myr-gfp) in lect-2(ok2617); wyTi3 [loxp-Plect-2>lect-2::SL2:: mcherry-loxp] without (A) or with (B) muscle expressed Cre transgenes. Note that all the body wall muscles were labeled by mCherry in A, while most of the muscles (labeled by dashed lines) were not labeled in B. Scale bar: 50 μm. (C–E) Quantifications of number of 2°, 3° and 4° dendrites in a 100 μm region anterior to the cell body of PVD neurons. One way ANOVA with the Tukey correction was used for statistical analysis. ***p<0.0001. Data are represented as mean ± SEM. 16 animals were quantified for each genotype, except for lect-2(ok2617) (12 animals were quantified).
Figure 6 with 1 supplement

Muscle mosaic analysis.
(A–C) Confocal images showing PVD dendritic arbors, body wall muscles (arrow, labeled in magenta using transgene Phlh-1>lect-2::SL2::mcherry) and seam cells in a lect-2(ok2617) mutant animal which carried muscle-expressed LECT-2 transgene. The inset images are enlarged views (two fold) of the regions indicated by the boxes. Note that these images are partially lateral views and only the ventral half of PVD dendritic arbors could be imaged. Scale bar: 50 μm. (D) Quantification of number of 2°, 3° and 4° dendrites in lect-2(+) zone and lect-2(-) zone.. For this quantification, number of dendrites growing in different zones was counted separately. The length of muscles along the anterior-posterior axis was also quantified. Dendritic density = number of dendrites/ length of muscles. Number of dendrites per 100 μm in lect-2(+) zone and lect-2(-) zone were shown. For each mosaic animal, either the dorsal or the ventral half of the PVD dendritic arbors was quantified, as only partially dorsal-up or ventral-up, but not fully lateral-up worms could be identified as muscle mosaic worms and used for imaging and quantification. Similar way was used to quantified wild-type and lect-2(ok2617) animals. One way ANOVA with the Tukey correction was used for statistical analysis. ***p<0.0001. Data are represented as mean ± SEM. 11 animals were quantified for each group.
Figure 6—figure supplement 1
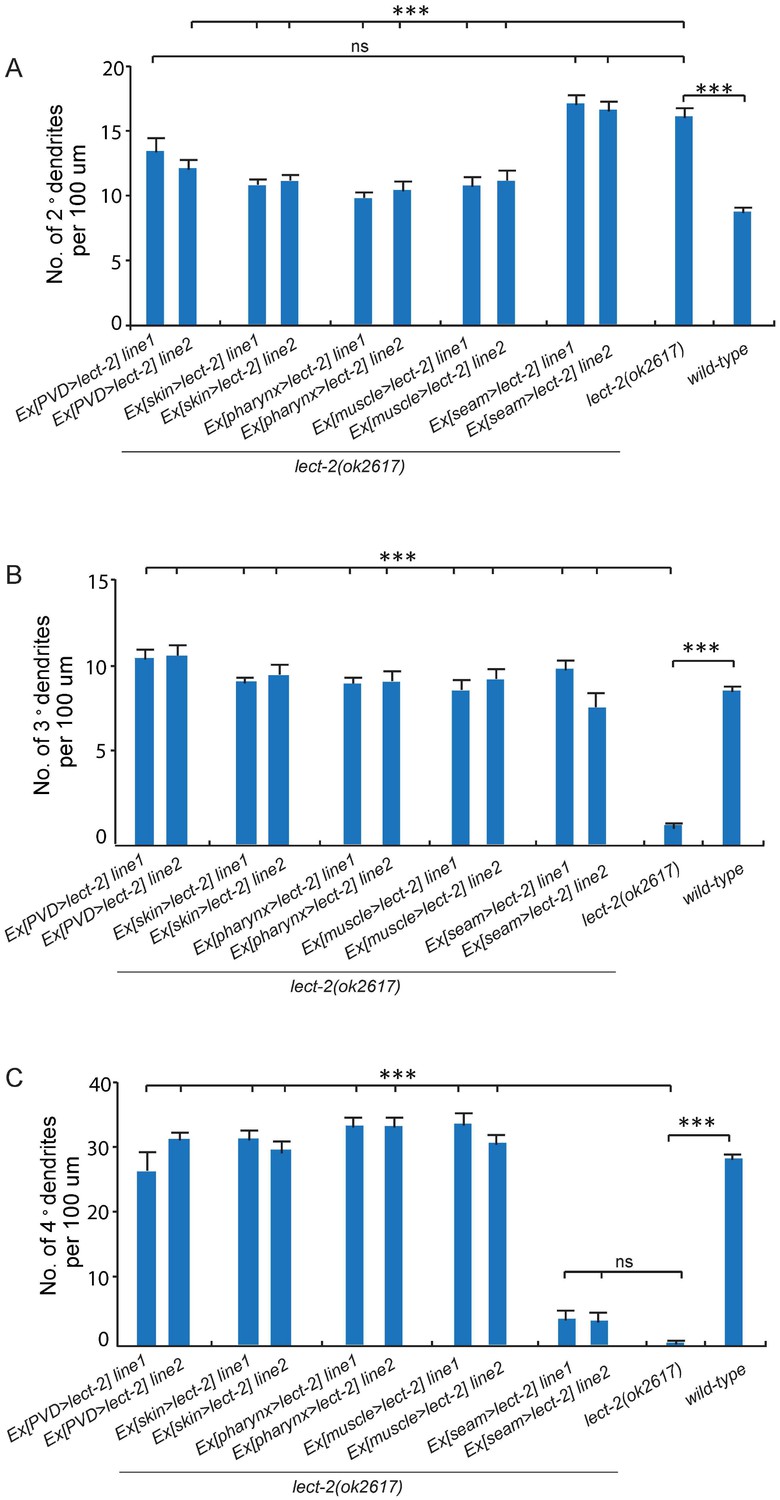
PVD patterning defect of lect-2 mutants is rescued by over-expressed LECT-2 secreted from multiple types of tissues.
(A–C) Quantifications showing the number of 2°, 3° and 4° dendrites in a 100 μm region anterior to the cell body of PVD neurons. One way ANOVA with the Tukey correction was used for statistical analysis. ***p<0.0001. ns: not significant. Data are represented as mean ± SEM. 12 animals were quantified for each genotype. ser2prom3, Pdpy-7, Pmyo-2, Phlh-1 and Pnhr-81 were used to express LECT-2 in PVD neurons, epidermis, pharyngeal muscles, body wall muscles and seam cells, respectively.
Figure 7
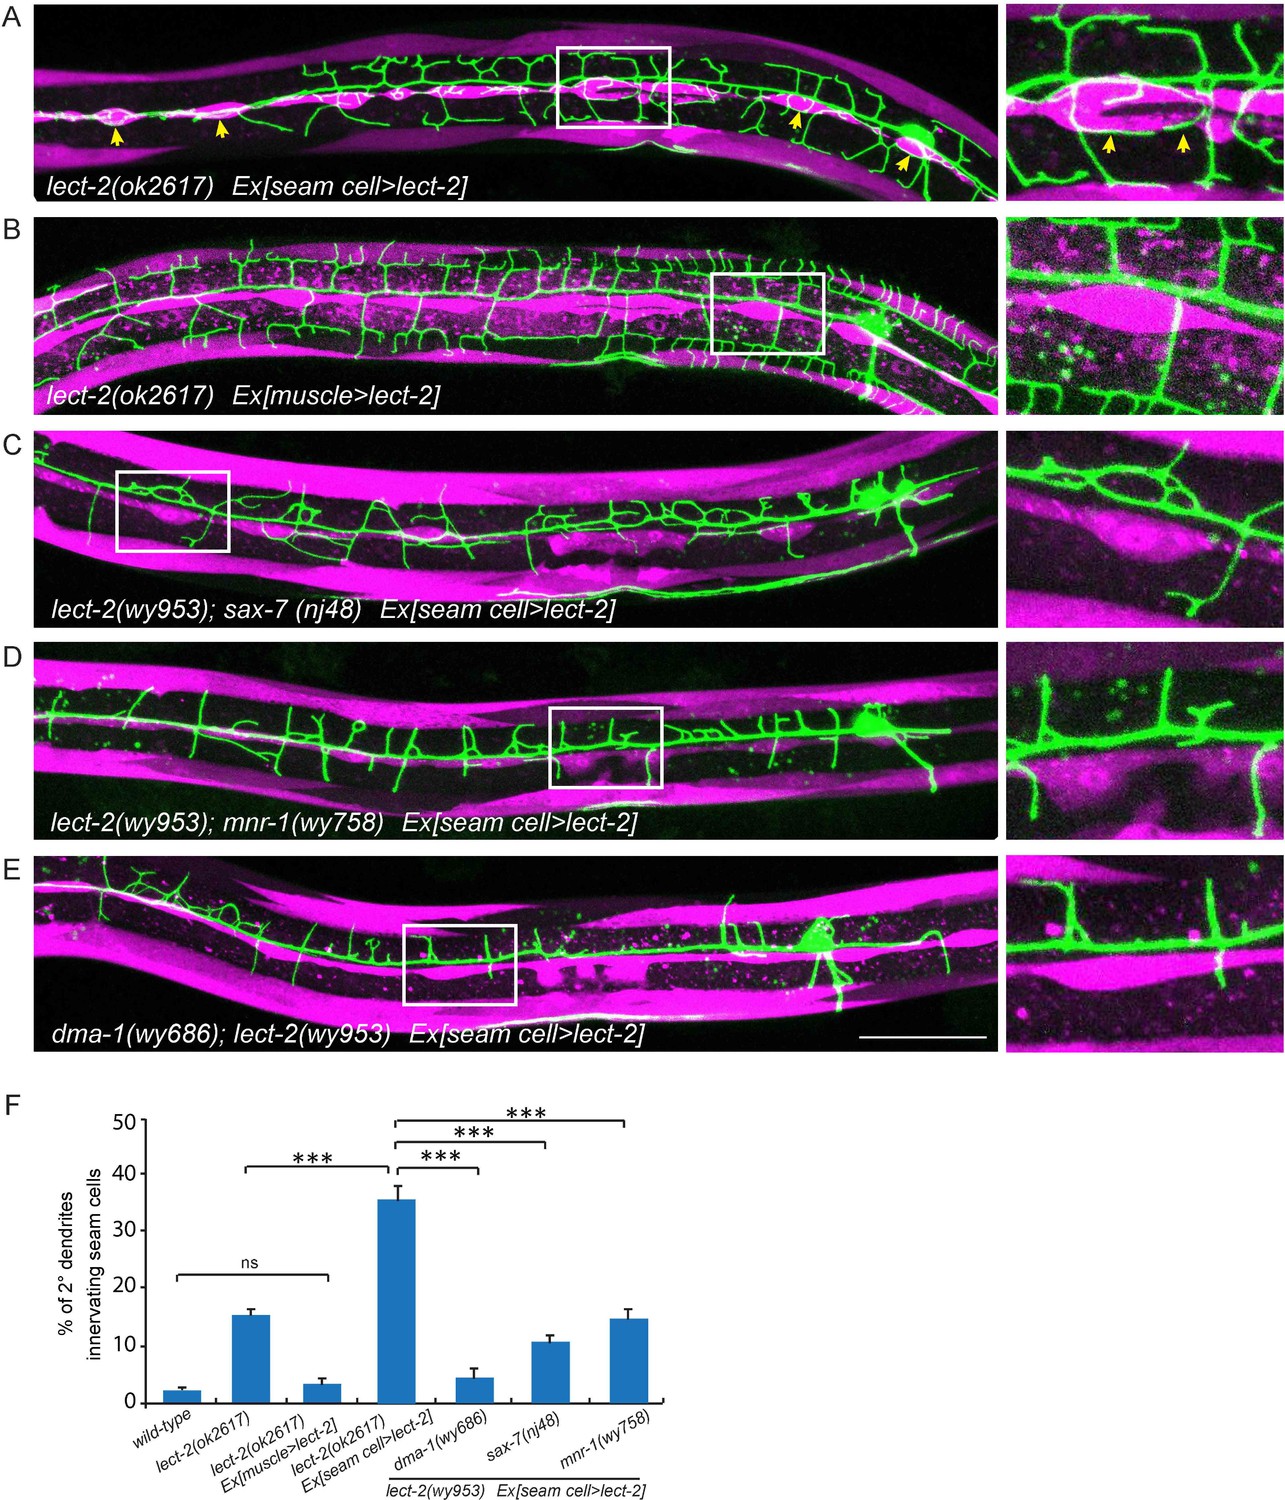
Seam cell-secreted LECT-2 could misguide dendrites onto seam cells.
(E) Confocal images showing PVD dendritic arbors, body wall muscles (labeled in magenta using transgene Pmyo-3>mcherry (for A, C–E) or Phlh-1> lect-2::SL2::mcherry (for C)) and seam cells. The inset images are enlarged views (2 fold) of the regions indicated by the boxes. Arrows: dendrites innervating seam cells. Scale bar: 50 μm. (F) Quantifications of percentage of 2° dendrites innervating seam cells. One way ANOVA with the Tukey correction was used for statistical analysis. ***p<0.0001. ns: not significant. Data are represented as mean ± SEM. Number of 2° dendrites quantified for each genotype: 540, 489, 518, 929, 179, 349 and 269, respectively.
Figure 8 with 2 supplements
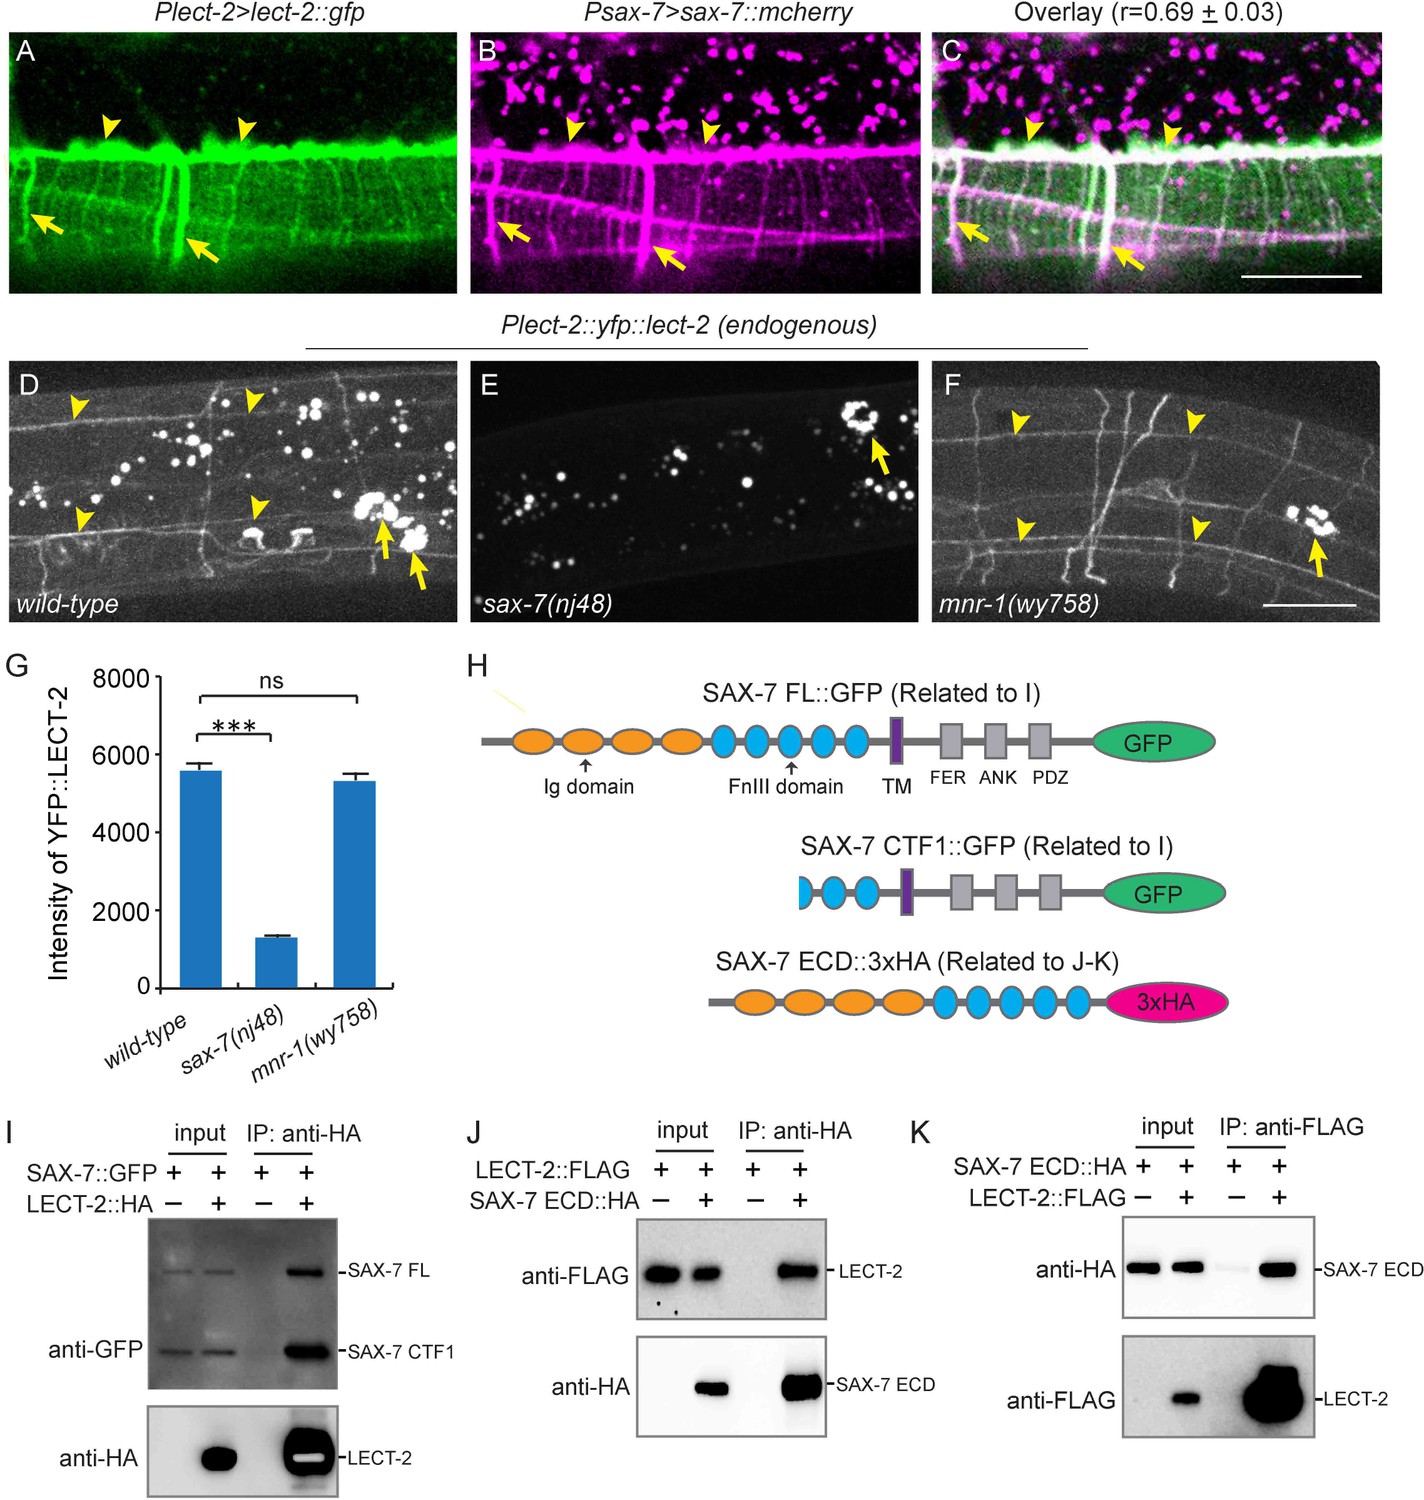
LECT-2 interacts with SAX-7.
(A–C) Confocal images showing co-localization between LECT-2::GFP (green) and SAX-7::mCHERRY (magenta). Arrow heads: tertiary line along the border of outer body wall muscles; Arrows: quaternary stripes where quaternary dendrites grow along. Scale bar: 20 μm. The Pearson’s coefficient index was measured from 12 animals. Data are represented as mean ± SEM. (D–F) Confocal images showing the patterns of endogenously expressed YFP::LECT-2 in (D) wild-type, (E) sax-7(nj48) and (F) mnr-1(wy758) mutant animals. Scale bar: 20 μm. (G) Quantifications of intensity of YFP::LECT-2 along the border of outer body wall muscles. Intensity of background was measured in the region outside of worms and subtracted. One way ANOVA with the Dunnett’s test was used for statistical analysis. ***p<0.0001. ns: not significant. Data are represented as mean ± SEM. 10 animals were quantified for each genotype. (H) Schematics of tagged full length or truncated SAX-7 expressed in Drosophila S2 cells for co-immunoprecipitation (co-IP) experiments. FL: full length. Ig: immunoglobulin domain. FnIII: fibronectin domain III. TM: transmembrane domain. FER: conserved FERM domain. ANK: Ankyrin-binding domain. PDZ: PDZ domain. CTF1: C-terminal fragment 1 (generated by cleavage through a putative furin cleavage site in the third FnIII domain). ECD: extracellular domain. (I) Western blot images showing co-IP between LECT-2::HA and SAX-7::GFP. IP: immunoprecipitation. WB: western blot. (J–K) Western blot images showing co-IP between LECT-2::FLAG and SAX-7 ECD::HA. Note that in these experiments a mutant form of SAX-7 ECD::HA construct with furin cleavage site mutations was utilized.
Figure 8—figure supplement 1
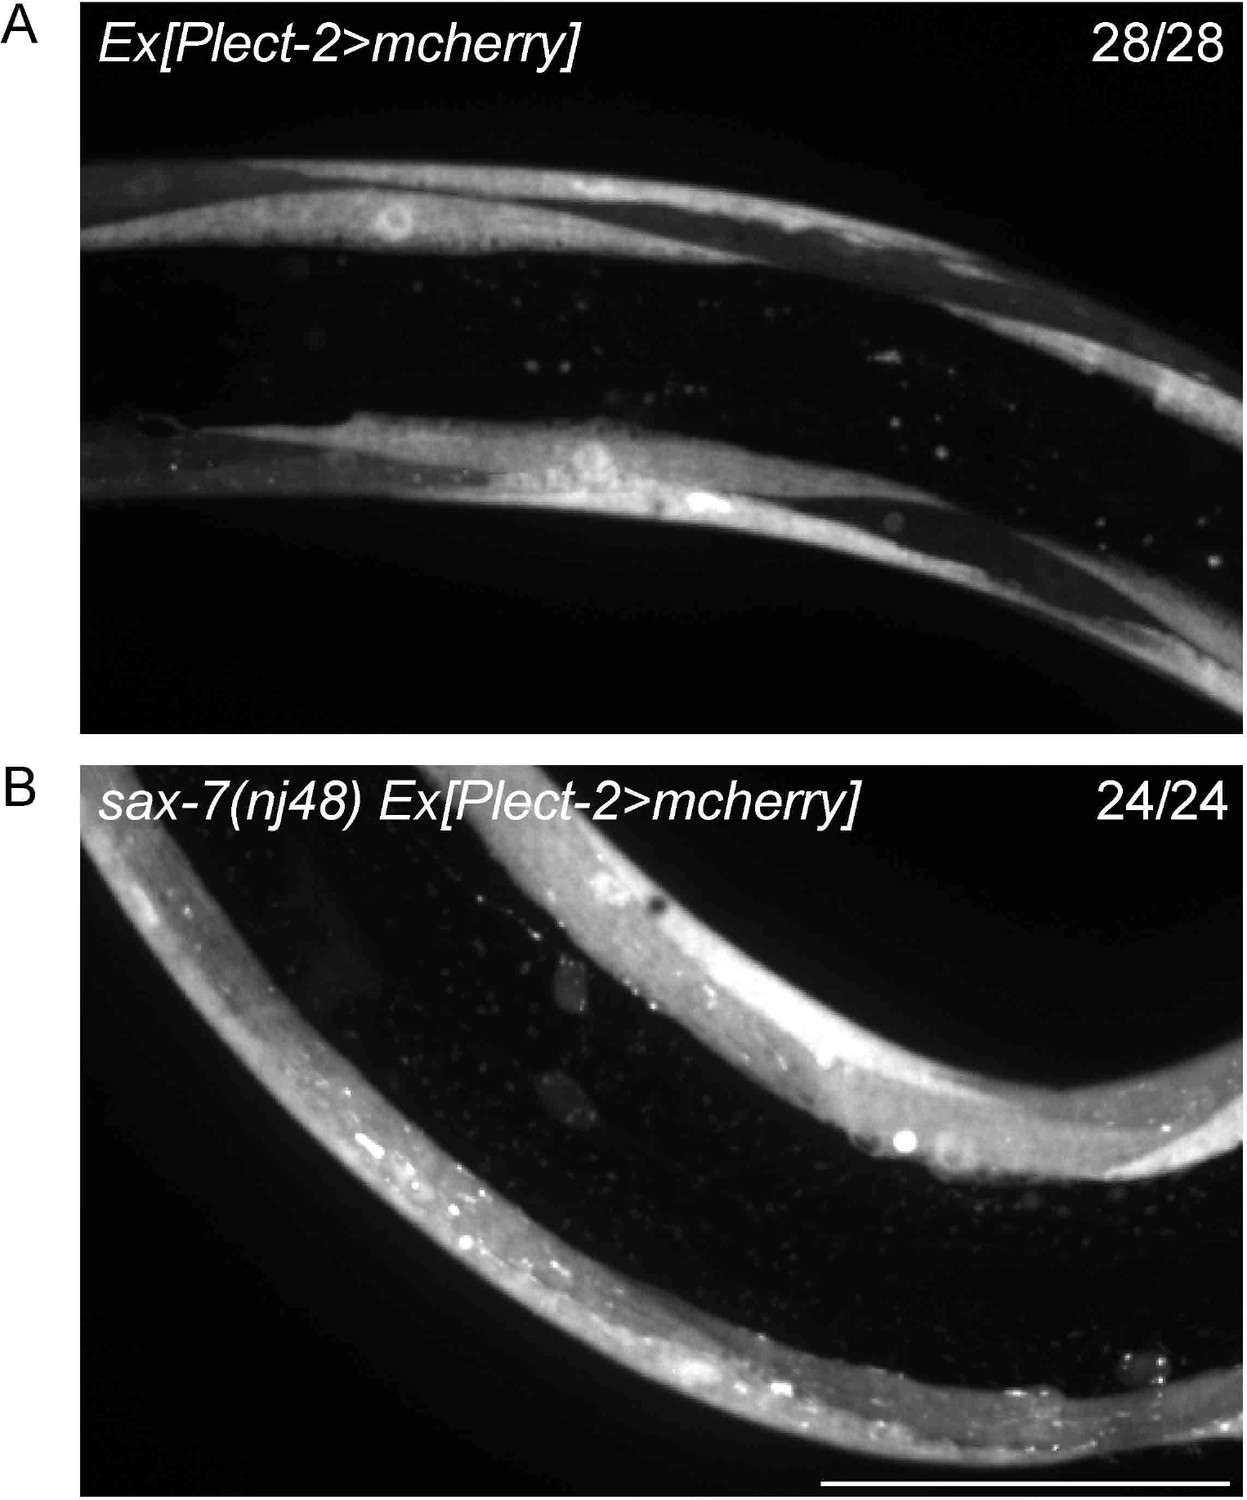
Transcription of lect-2 is largely not affected by loss of sax-7.
(A–B) Confocal images showing the transcription reporter of lect-2 (Plect-2>mcherry) in wild-type and sax-7 (nj48) mutant animals. 28 and 24 animals were imaged for each genotype, respectively. No obvious difference was observed. Scale bar: 50 μm.
Figure 8—figure supplement 2
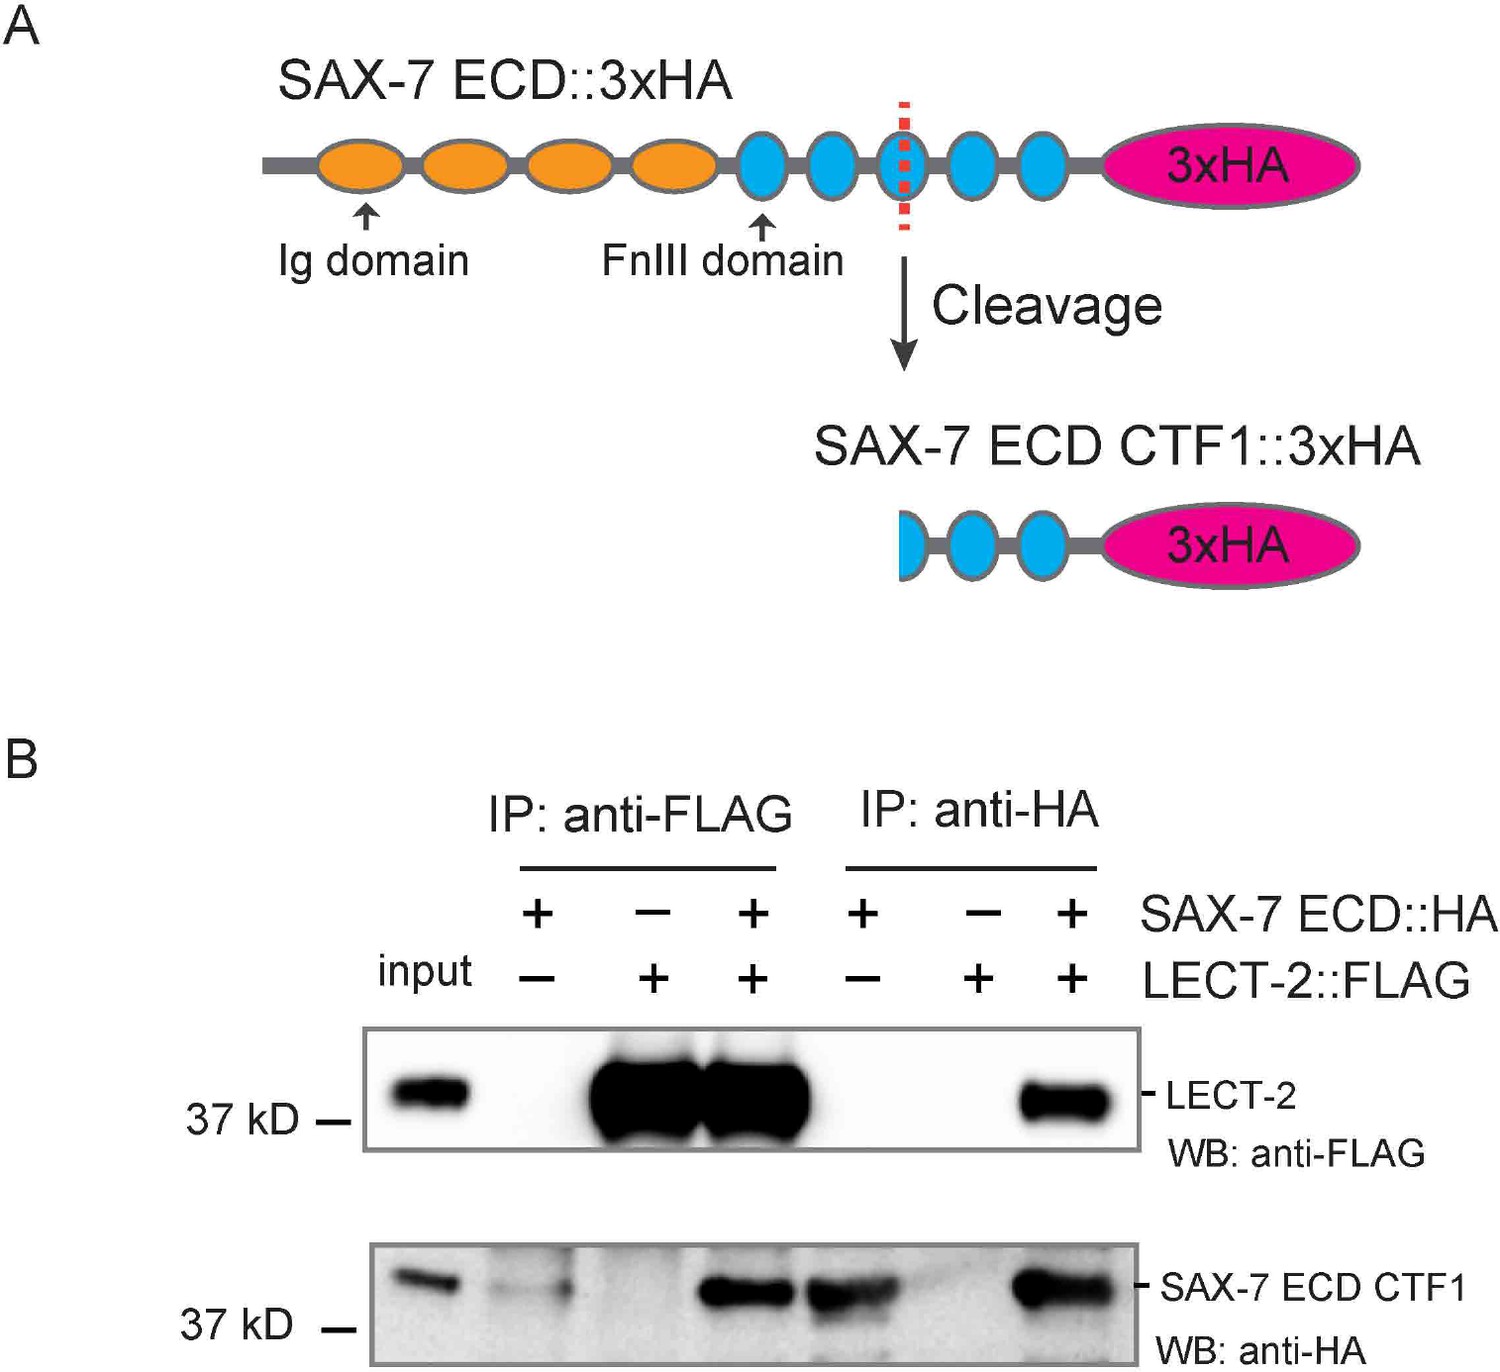
The last two FnIII domains of SAX-7 are sufficient to interact with LECT-2.
(A) Schematics showing that SAX-7 ECD CTF1 was generated through cleavage, likely in the third FnIII domain. (B) Western blot images showing co-IP results betweenLECT-2::FLAG and SAX-7 ECD CTF1::HA. WB: western blot. IP: immunoprecipitation. ECD: extra-cellular domain. CTF1: C-terminal fragment 1.
Figure 9 with 1 supplement

LECT-2 forms a multi-protein complex with SAX-7, MNR-1 and DMA-1.
(A) A cartoon showing how the single-molecule pull-down (SiMPull) assays were performed. (B–J) Representive fluorescent images showing the results of SiMPull assays. Specific pull-down of LECT-2 (green) and SAX-7 (magenta) were only observed from lysate co-expressing DMA-1::FLAG and MNR-1 (E–G), but not lysates without DMA-1::FLAG(B-D) nor MNR-1(H–J). Scale bar: 5 μm. (K) Quantification of 10 different regions of the imaging surface for each group. (L) Single-molecule colocalization between LECT-2::GFP and SAX-7::mCherry. The number of molecules where colocalization occurred divided by the total number of mCherry molecules was calculated as percentage of colocalization. 10 different regions of the imaging surface were imaged and quantified. One way ANOVA with the Dunnett’s correction was used for statistical analysis. ***p<0.0001. Data are represented as mean ± SEM.
Figure 9—figure supplement 1
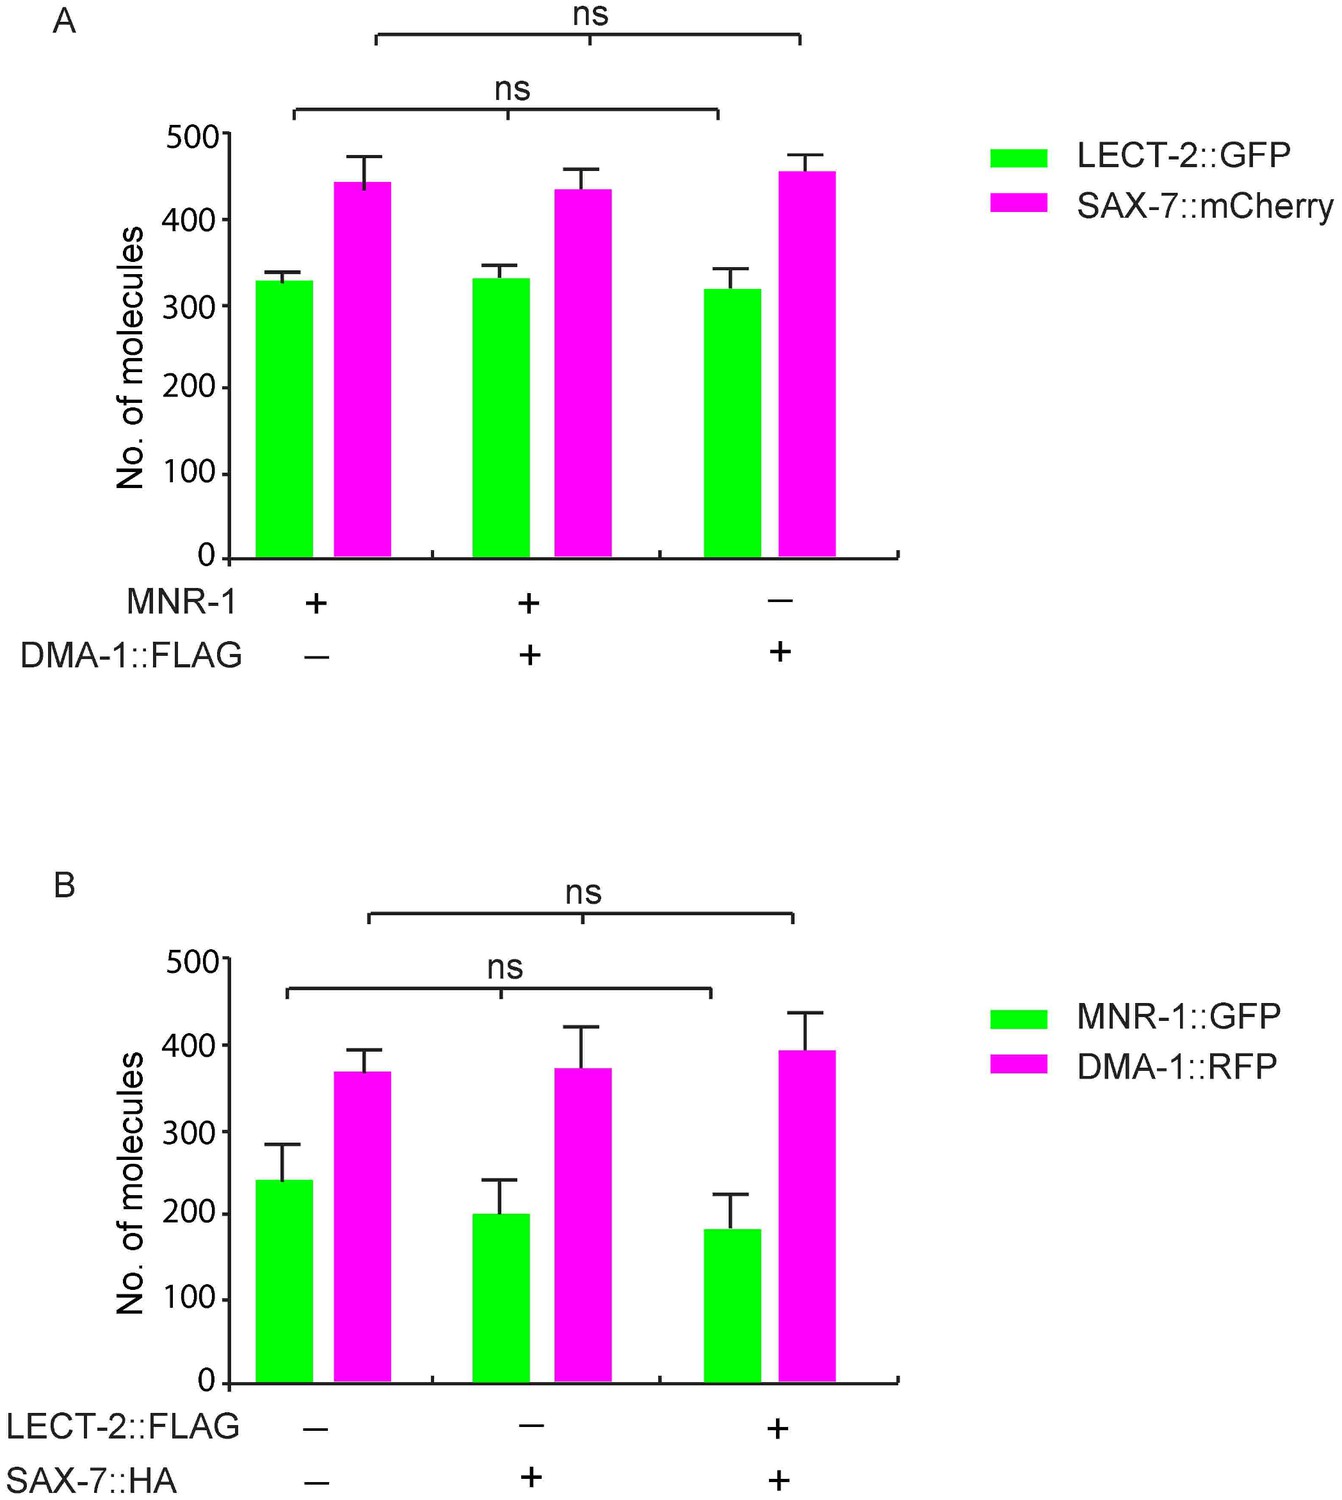
Prey proteins are expressed at similar levels in different groups.
(A) C. elegans expressed LECT-2::GFP, SAX-7::mCherry, with or without co-expression of DMA-1::FLAG and MNR-1, were used in SiMPull. Lysates were applied to a chamber coated with anti-GFP or anti-RFP antibody to compare the concentration of LECT-2::GFP and SAX-7::mCherry. 5 different regions of the imaging surface were imaged and quantified. One way ANOVA was used for statistical analysis. ns: not significant. Data are represented as mean ± SEM. (B) Drosophila S2 cells expressed DMA-1::RFP, MNR-1::GFP, with or without co-expression of SAX-7::HA and LECT-2::FLAG, were used in SiMPull. Lysates were applied to a chamber coated with anti-GFP or anti-RFP antibody. 5 different regions of the imaging surface were imaged and quantified. One way ANOVA was used for statistical analysis. ns: not significant. Data are represented as mean ± SEM.
Figure 10 with 1 supplement
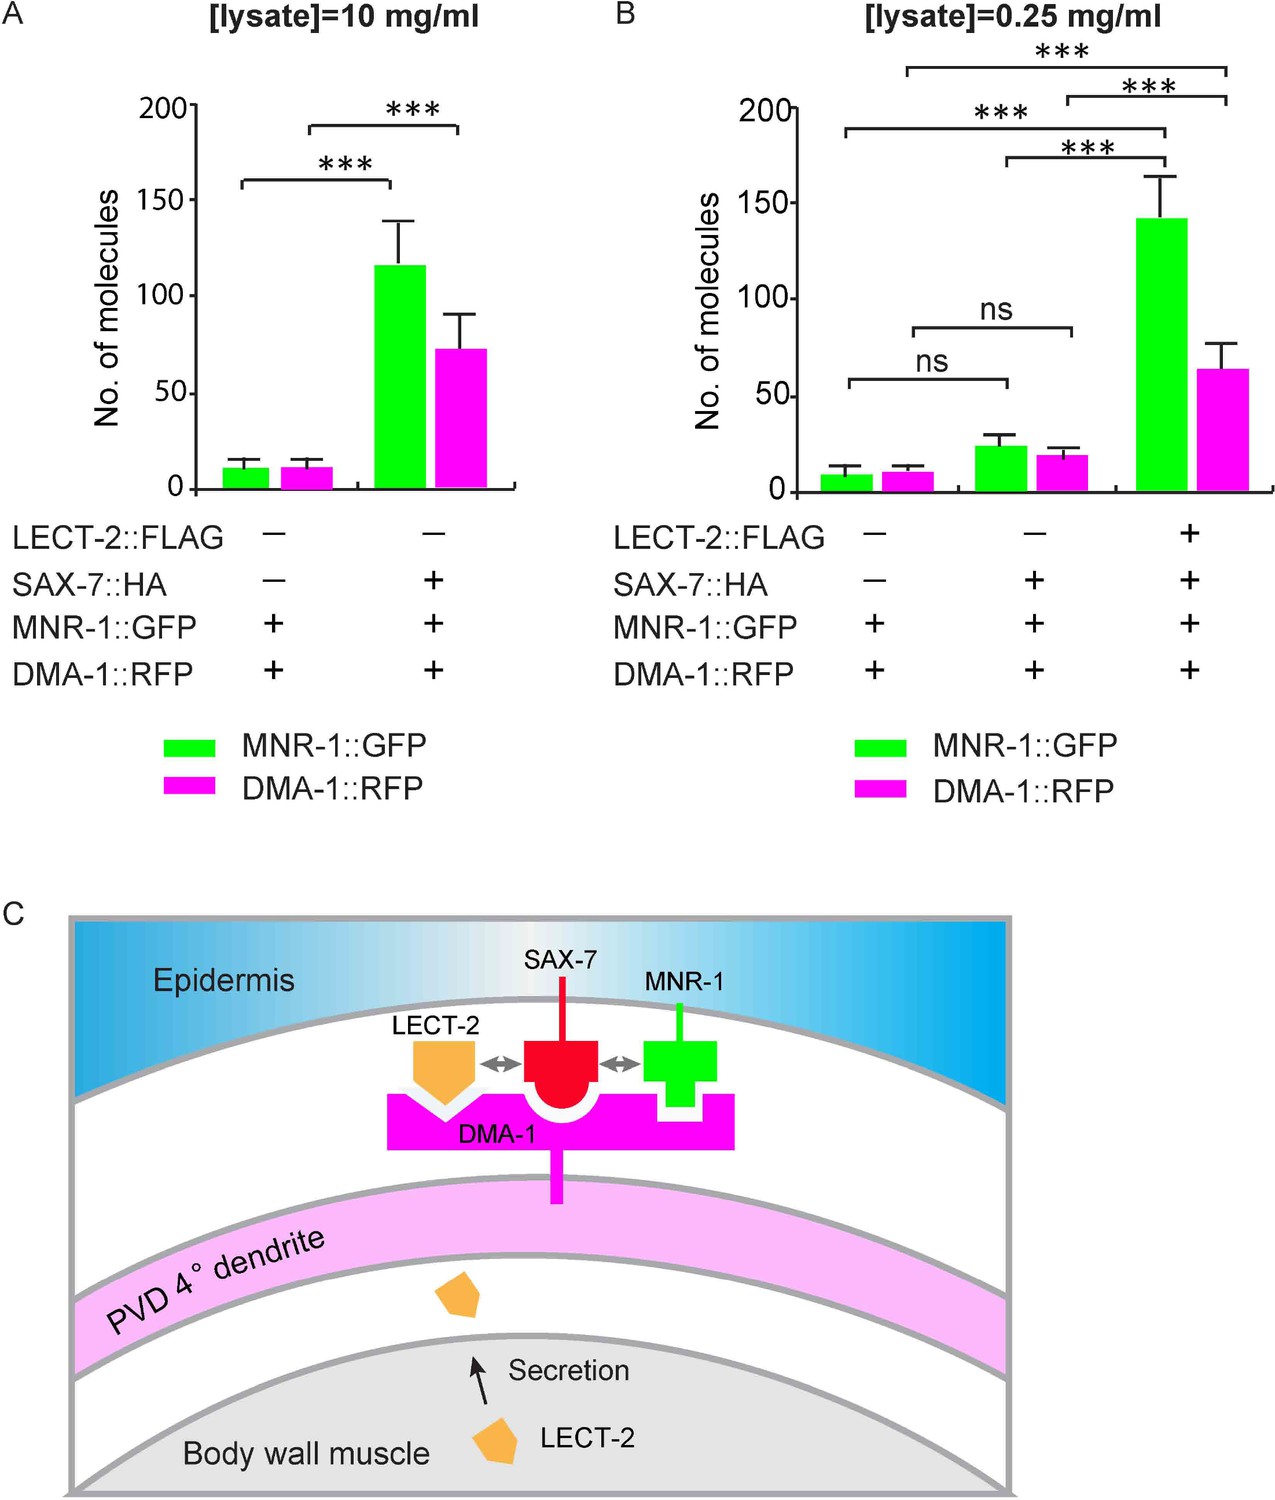
LECT-2 enhances the binding among SAX-7, MNR-1 and DMA-1 in vitro.
(A–B) Drosophila S2 cells expressing DMA-1::RFP and MNR-1::GFP, with or without co-expression of SAX-7::HA and LECT-2::FLAG, were used to detect protein interactions by SiMPull. Lysates were applied to a chamber coated with anti-HA antibody. Different lysate concentrations (10 and 0.25 mg/ml for A and B, respectively) were used in order to achieve an optimum density of fluorescent proteins. Specific pull-down of DMA-1 and MNR-1 were observed from lysate co-expressing SAX-7 HA, but not lysates without SAX-7::HA. The addition of LECT-2::FLAG required 40-folds less concentration of input than the sample without LECT-2 co-expression, to achieve similar MNR-1 and DMA-1 pull-down outputs. 10 and 13 different regions of the imaging surface were imaged and quantified for the two groups shown in (A). 5, 5 and 12 different regions of the imaging surface were imaged and quantified for the three groups shown in (B). One way ANOVA with the Tukey correction was used for statistical analysis. ***p<0.0001. ns: not significant. Data are represented as mean ± SEM. (C) A cartoon showing that LECT-2 is secreted from body wall muscles and captured by SAX-7 on the epidermis. SAX-7 also directly binds to MNR-1. LECT-2, SAX-7 and MNR-1 form a combinational dendritic guidance cue to bind and activate dendritic receptor DMA-1 to regulate targeting and morphogenesis of PVD dendrites.
Figure 10—figure supplement 1
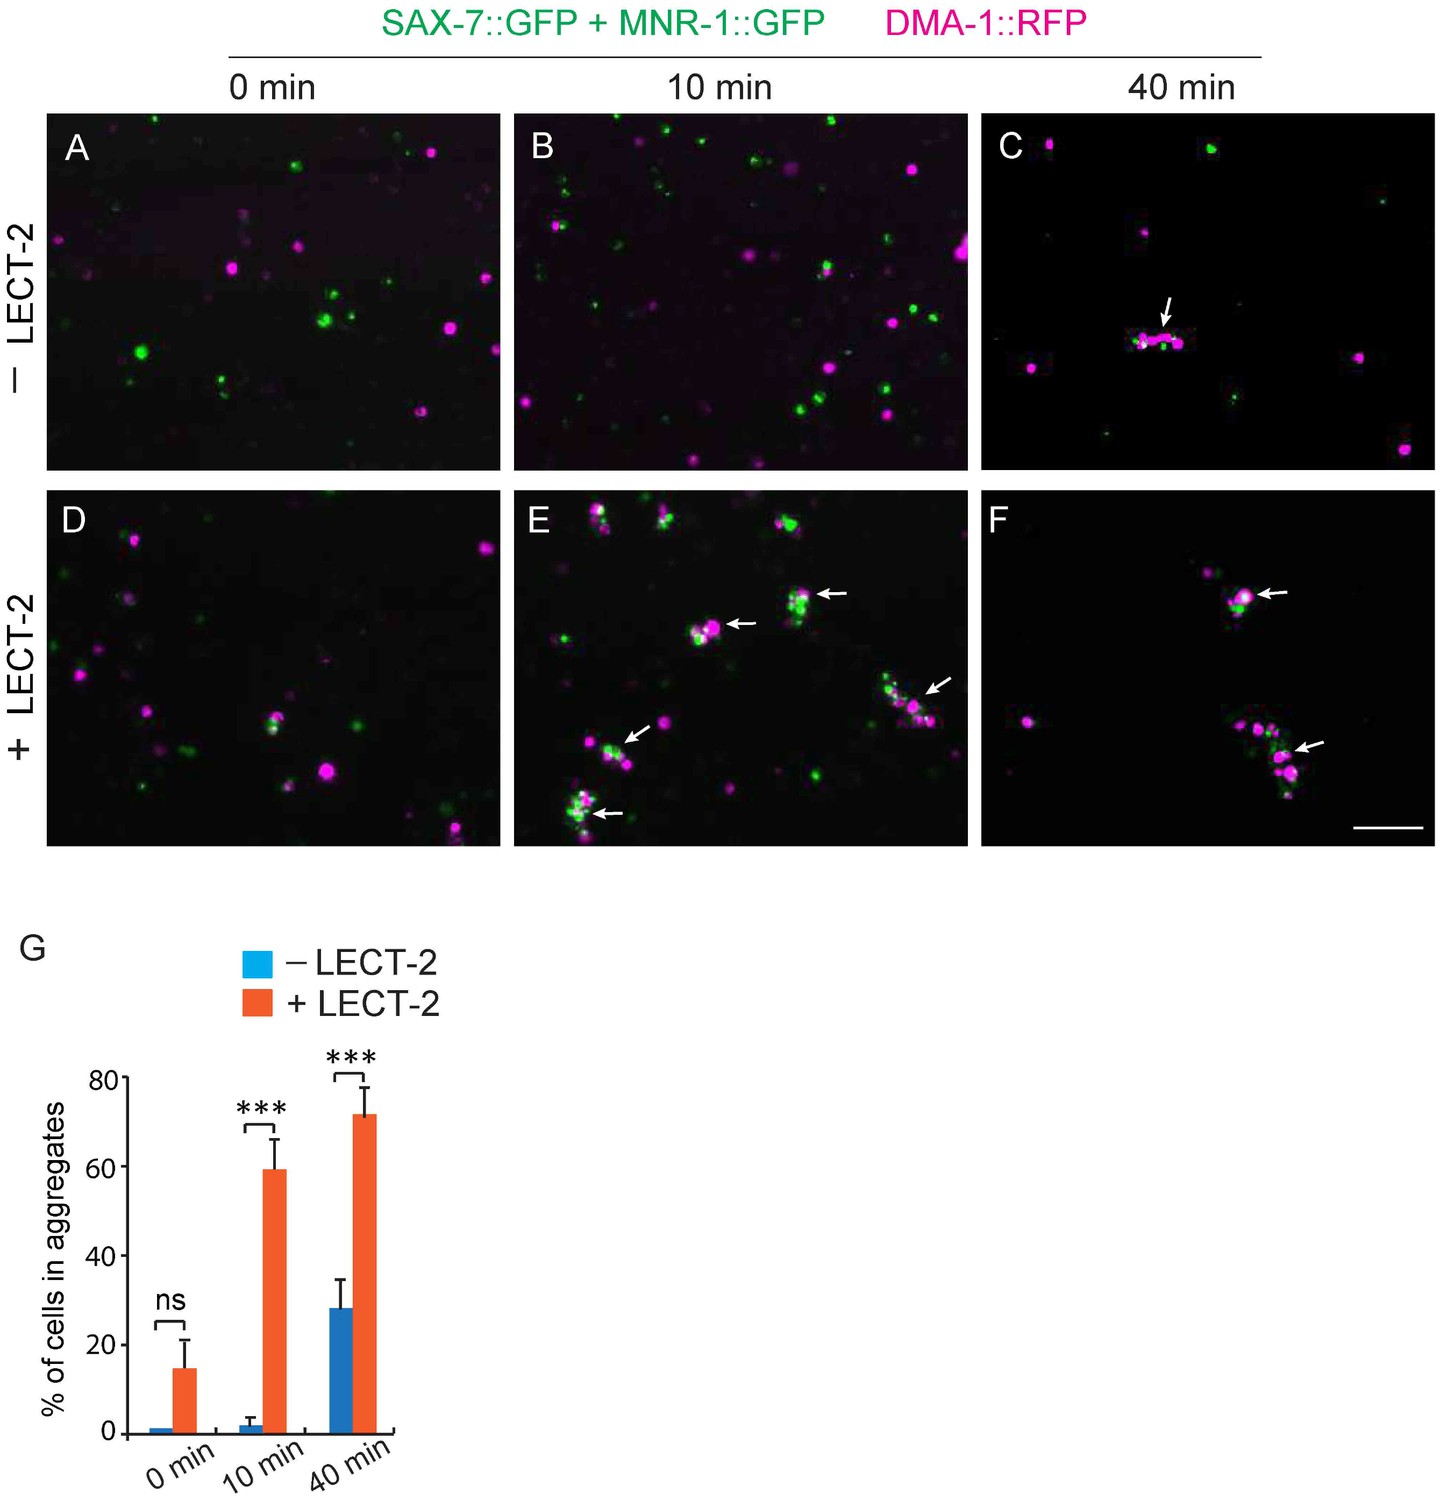
Adding LECT-2::FLAG increases the aggregation formation between DMA-1::RFP and SAX-7::GFP-MNR-1::GFP -expressing S2 cells.
(A–F) Fluorescent images showing the results of S2 cell aggregation assays at specific time points. Magenta cells: expressing DMA-1::RFP; Green cells: expressing SAX-7::GFP and MNR-1::GFP. –LECT-2: medium collected from non-transfected S2 cells was used; +LECT-2: medium collected from Pactin>lect-2::flag cells was used. Arrows: S2 cell aggregates. (G) Quantification of percentage of cells in aggregates. %=total number of cells in aggregates (green cells+ red cells)/ total number of cells (green cells+ red cells). Student’s t-test was used for statistical analysis. ***p<0.0001. ns: not significant. Data are represented as mean ± SEM. Scale bar: 100 μm.
Additional files
-
Supplementary file 1
Strains and plasmids used in this study.
(a) Strains used in this study. (b) Plasmids used in this study.
- https://doi.org/10.7554/eLife.18345.020
Download links
A two-part list of links to download the article, or parts of the article, in various formats.
Downloads (link to download the article as PDF)
Open citations (links to open the citations from this article in various online reference manager services)
Cite this article (links to download the citations from this article in formats compatible with various reference manager tools)
A multi-protein receptor-ligand complex underlies combinatorial dendrite guidance choices in C. elegans
eLife 5:e18345.
https://doi.org/10.7554/eLife.18345


