The aspartyl protease DDI2 activates Nrf1 to compensate for proteasome dysfunction
- The University of Tokyo, Japan
Figures
Figure 1 with 1 supplement

A genome-wide siRNA screen for regulators of Nrf1 translocation to the nucleus in response to proteasome inhibition.
(A) Representative images of Nrf1 localization in control cells (no siRNA) and cells transfected with siRNA targeting p97 or SEL1L in the primary screen. Yellow-boxed regions are magnified and displayed in the right panels. (B) B score of all samples in the primary screen. Data are ordered from lowest to highest. Dashed blue line represents a cutoff value for positive hits. Some of the representative final hits are shown as red dots. The list of B scores for all samples in the primary screen are available in the Figure 1—source data 1. (C) Workflow and summary of the genome-wide siRNA screen. (D) List of the 14 final hit genes and the score in each assay throughout the screening process.
-
Figure 1—source data 1
List of B-score in the primary screen.
- https://doi.org/10.7554/eLife.18357.004
Figure 1—figure supplement 1
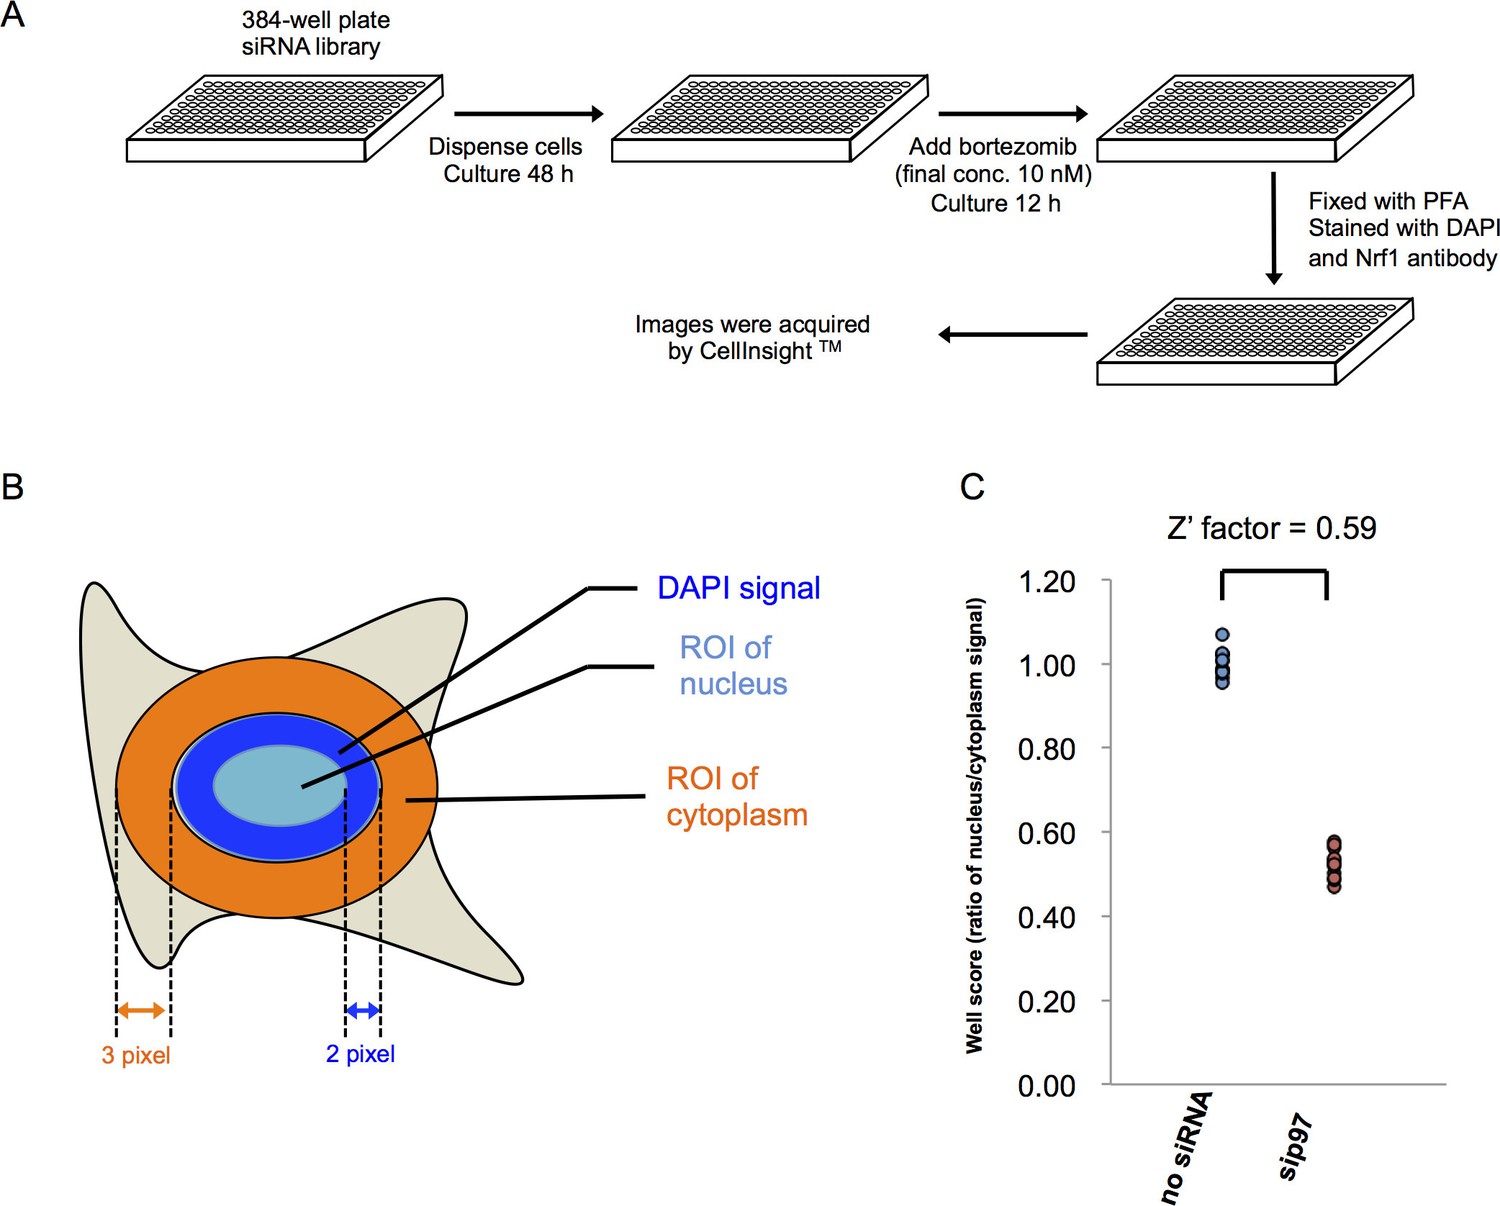
Methods for the genome-wide screen.
(A) A schematic view of the workflow in the primary screen using HEK293A cells. (B) Definition of nucleus and cytoplasm in the screen. Region of interest (ROI) of the nucleus was defined as a circle drawn two pixels inside of the outermost DAPI signal. ROI of the cytoplasm was defined as a three-pixel wide ring around DAPI signal. No gap between the rings and DAPI signals was set in the analysis using HEK293A cells, whereas a one-pixel gap was set in the analysis using HT1080 cells. (C) The well score of negative (no siRNA) and positive (si p97) controls. The well score is the fluorescence intensity ratio of ROI of nucleus to cytoplasm as defined in (B). The Z’ factor was calculated from 12 individual wells on each plate.
Figure 2 with 1 supplement
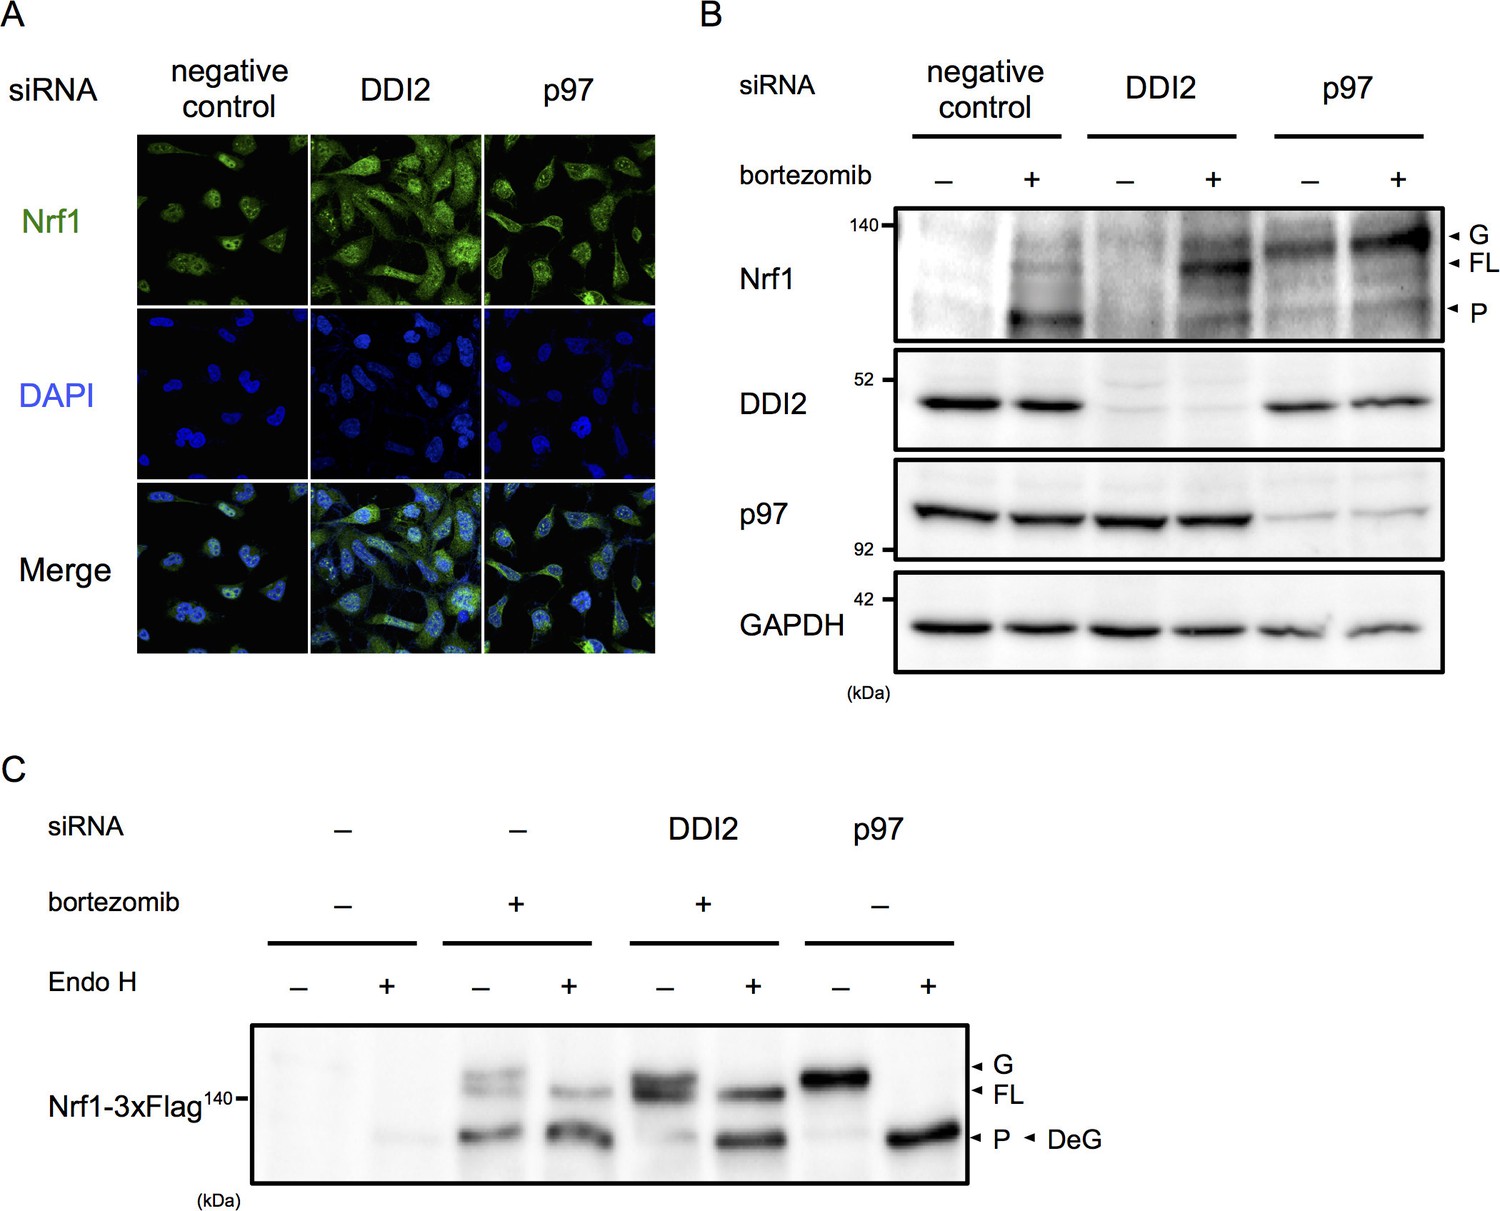
DDI2 is involved in Nrf1 processing and translocation to the nucleus.
(A) Representative images of Nrf1 localization. HEK293A cells were transfected with a non-targeting control (negative control), DDI2, or p97 siRNA and then treated with 50 nM bortezomib for 14 hr before fixation. (B) Immunoblotting of whole-cell lysates of cells in (A) treated with or without bortezomib. Nrf1 is detected as three different forms; a glycosylated form (G), full-length form (FL), and processed form (P). (C) Immunoblotting of Nrf1 after deglycosylation treatment. HEK293A cells were transfected with DDI2 or p97 siRNA, followed by transfection with Nrf1-3×Flag, and then treated with or without 50 nM bortezomib. The cell lysates were treated with or without Endo H. DeG denotes deglycosylated Nrf1.
Figure 2—figure supplement 1

The expression and localization of DDI2 were not affected by bortezomib treatment.
(A) Relative mRNA expression of DDI2 in HCT116 cells treated with or without bortezomib (50 nM, 14 hr). The data represent mean + standard error of the mean (SEM) (n = 3, biological replicates). (B) Subcellular localization of DDI2. HEK293A cells stably expressing Venus-Sec61β (ER marker) were transfected with Flag-DDI2 and treated with or without bortezomib.
Figure 3 with 1 supplement
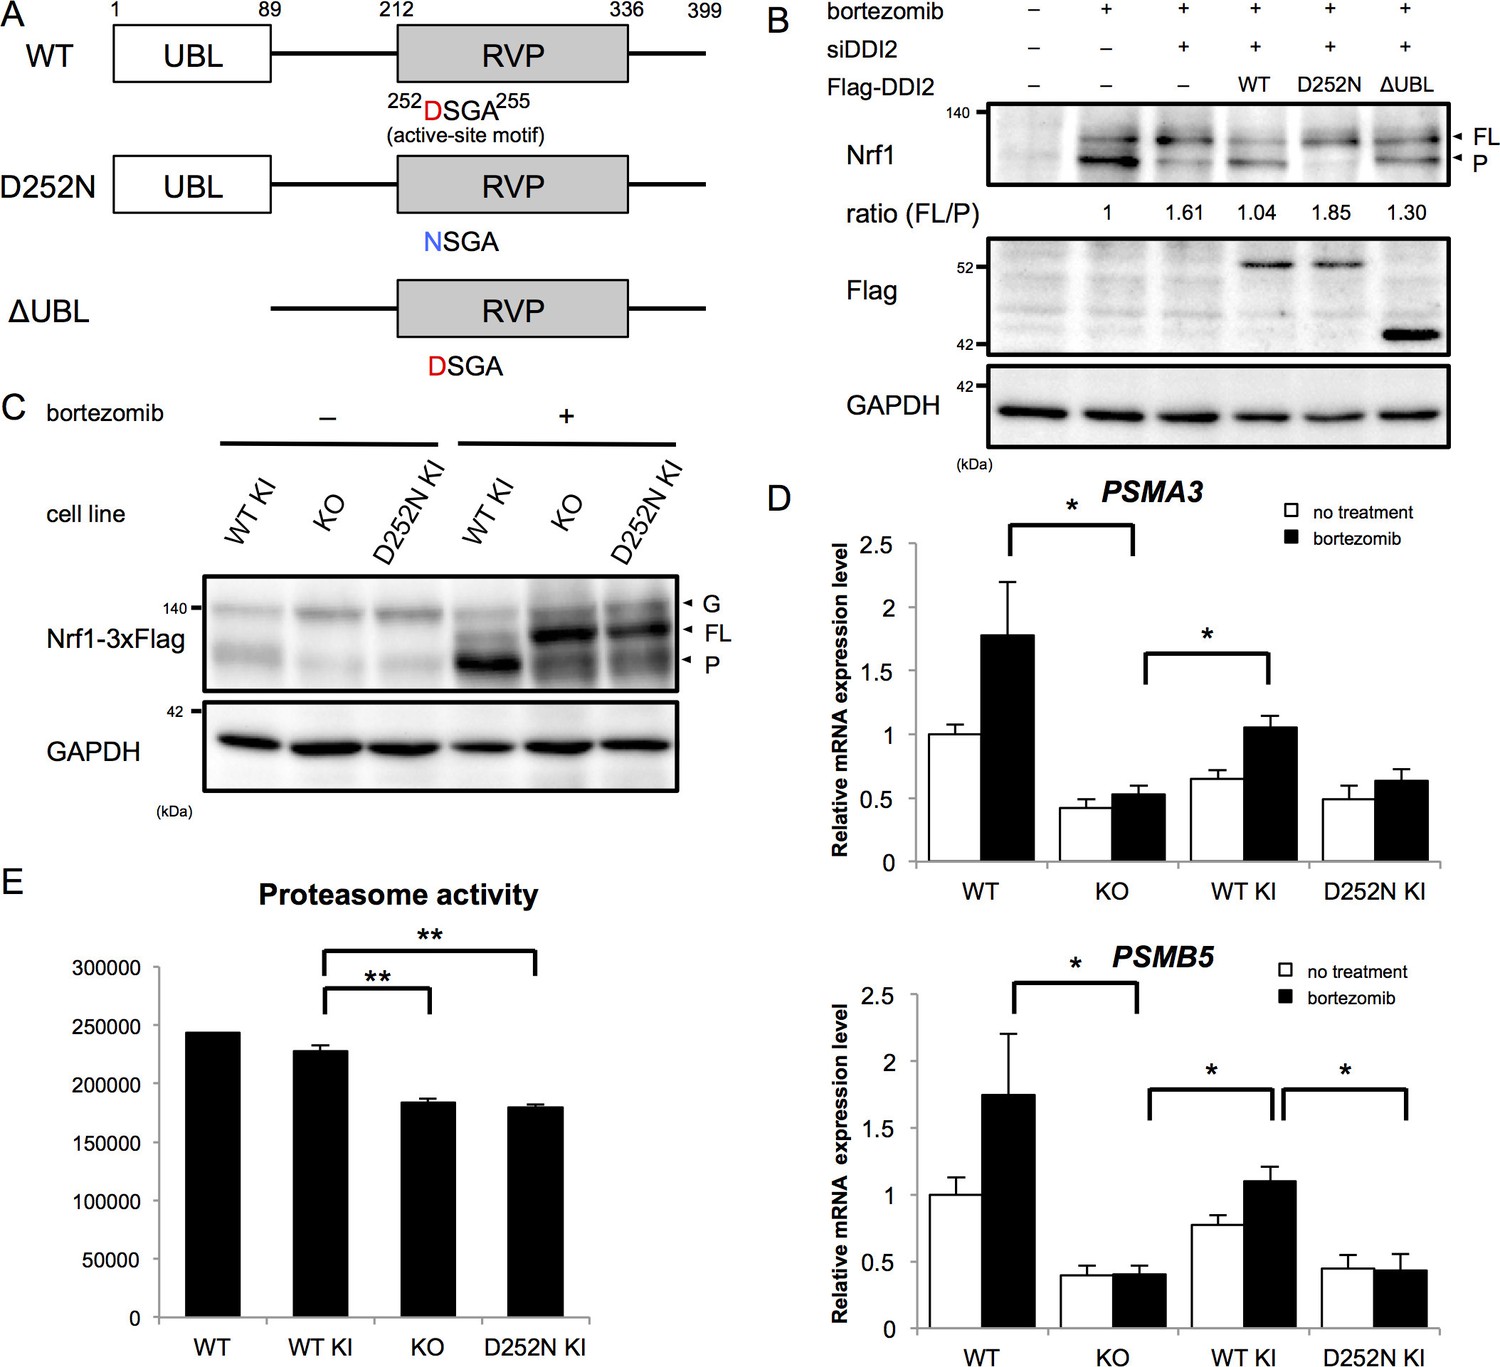
The protease activity of DDI2 is necessary for Nrf1 processing and its transcriptional activity.
(A) Schematic diagram of wild-type (WT) and each mutant of DDI2. Ubiquitin-like (UBL) domain and retroviral protease-like (RVP) domain are represented as filled rectangles. The putative aspartyl protease active site amino acid sequence is shown. (B) HEK293A cells were transfected with DDI2 siRNA and after 24 hr were transfected with a plasmid encoding WT or mutant DDI2 shown in (A), followed by 50 nM bortezomib treatment for 14 hr before harvest. The signal intensity ratio of Nrf1 full-length form (FL) to the processed form (P) was calculated, where the ratio for bortezomib treatment alone was set as 1. (C) Immunoblotting of whole cell lysates of DDI2 WT knock-in (KI), DDI2 knockout (KO), and DDI2 D252N KI HCT116 cells. The cells transfected with Nrf1-3×Flag were treated with or without 50 nM borteaomib. (D) Relative mRNA expression of the proteasome genes PSMA3 and PSMB5 in WT, DDI2 KO, DDI2 WT KI, and DDI2 D252N KI HCT116 cells. mRNA levels of target genes were normalized by GUSB mRNA levels. The data represent mean + standard error of the mean (SEM) (n = 3, biological replicates). Statistical comparison was made by Tukey’s test (*p<0.05). (E) Proteasome peptidase activity of cell lysates of the indicated cell lines. The data represent mean + SEM (n = 3, biological replicates). Statistical comparison was made by Tukey’s test (**p<0.01).
Figure 3—figure supplement 1
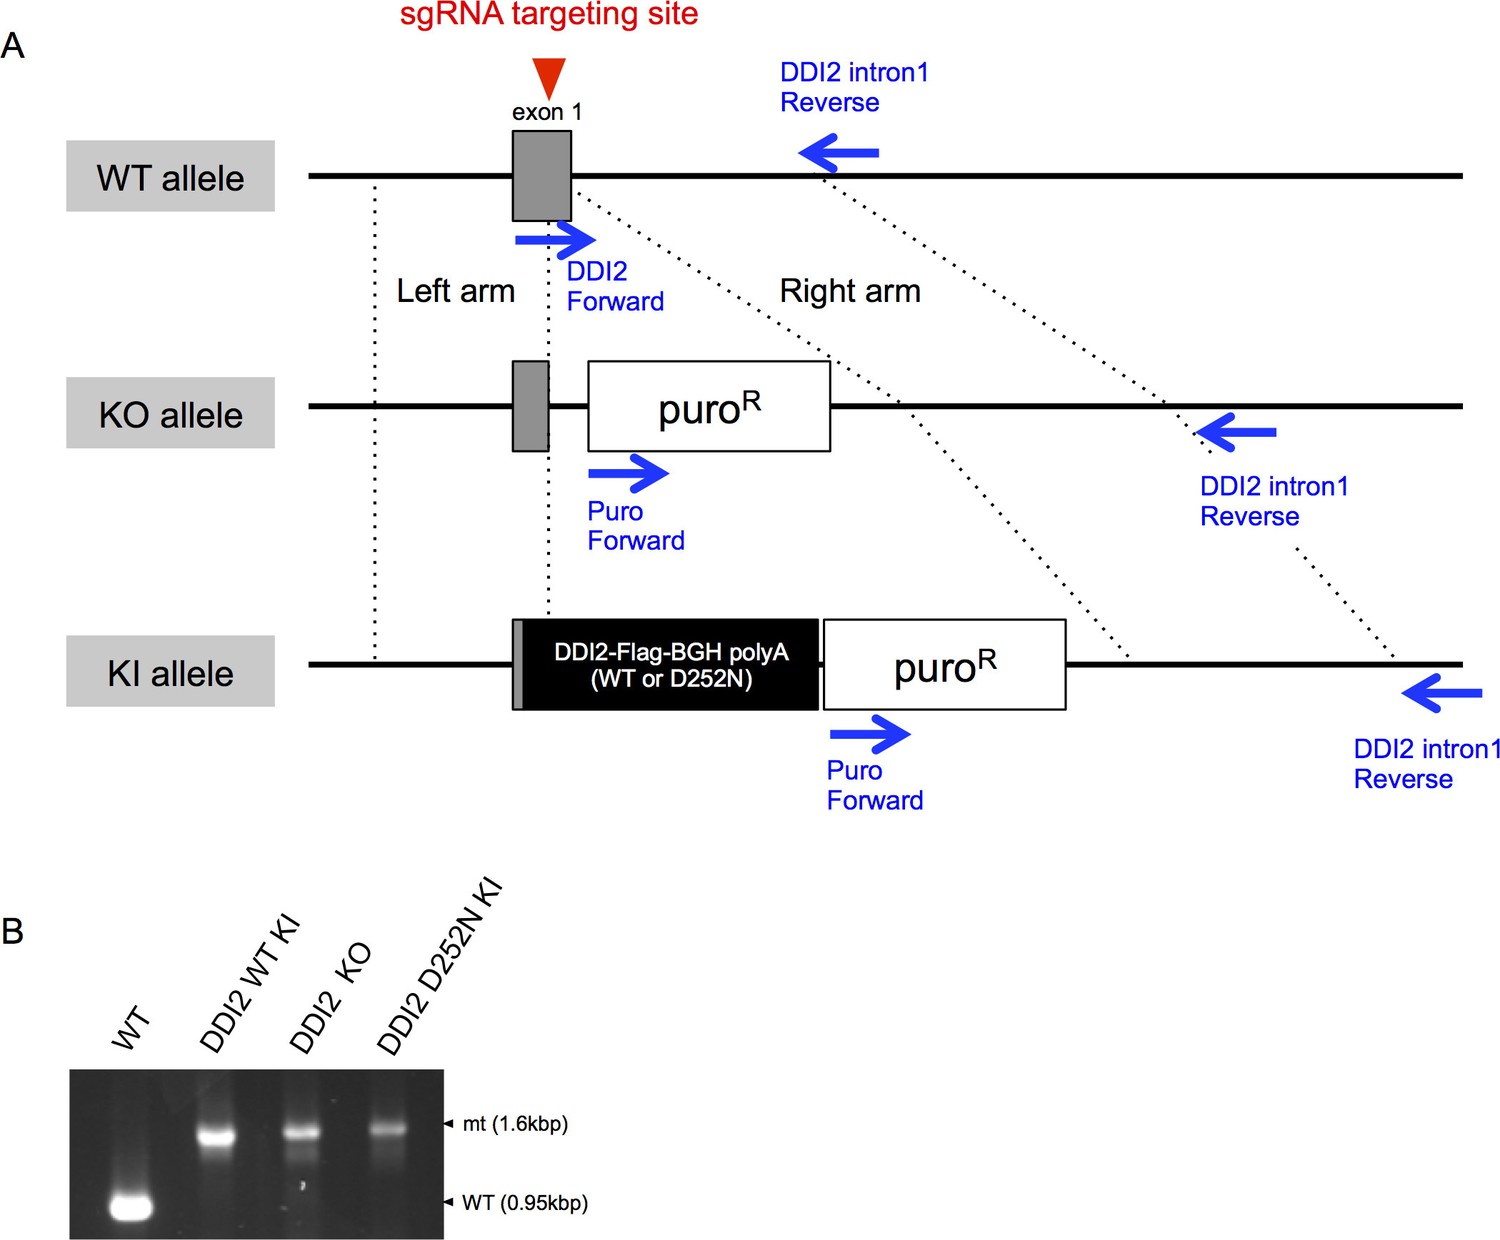
Genome editing of DDI2 locus by CRISPR-Cas9 system.
(A) Schematic diagram of DDI2 wild-type (WT), knockout (KO), and knock-in (KI) alleles. Red arrowhead indicates sgRNA targeting site, and blue arrows indicate PCR primers for confirmation of homologous recombination. puroR indicates a puromycin resistant cassette. (B) Confirmation of successful genome editing at the DDI2 locus. The genome DNA of each cell line was extracted and amplified by PCR using primer pairs shown in (A).
Download links
A two-part list of links to download the article, or parts of the article, in various formats.
Downloads (link to download the article as PDF)
Open citations (links to open the citations from this article in various online reference manager services)
Cite this article (links to download the citations from this article in formats compatible with various reference manager tools)
The aspartyl protease DDI2 activates Nrf1 to compensate for proteasome dysfunction
eLife 5:e18357.
https://doi.org/10.7554/eLife.18357


