Antiparallel protocadherin homodimers use distinct affinity- and specificity-mediating regions in cadherin repeats 1-4
- Harvard University, United States
- Harvard Medical School, United States
- University of Tübingen, Germany
Figures
Figure 1 with 4 supplements
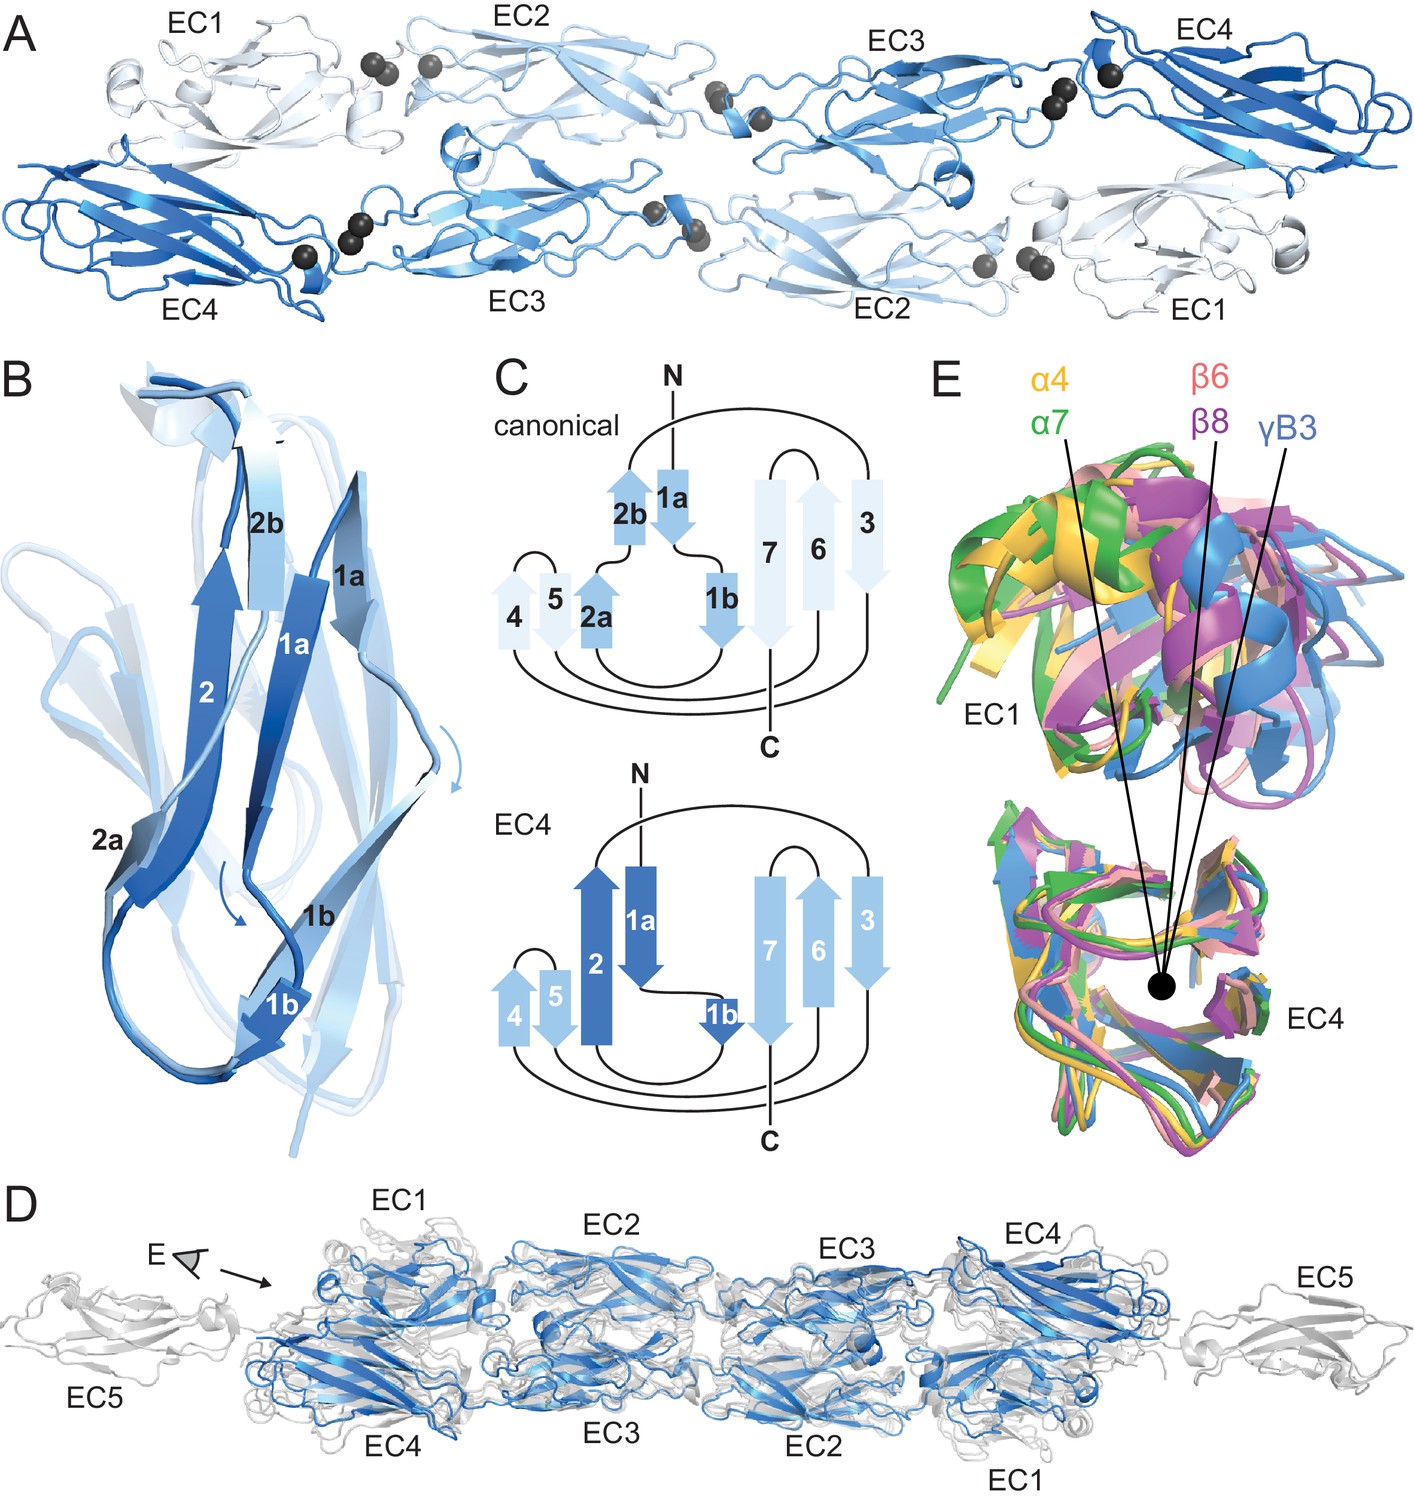
PcdhγB3 EC1-4 extended antiparallel dimer relies on unusual EC4 β-strand arrangement and is similar to other clustered Pcdh dimers.
(A) Structure of the PcdhγB3 EC1-4 antiparallel dimer, with each EC a different shade of blue and the Ca2+ ions in grey. (B) Superposition of PcdhγB3 EC2 and EC4 highlighting the differences in β-strands 1 and 2. (C) Comparison of the canonical cadherin (top) and EC4 (bottom) β-strand arrangement. (D) The structures of Pcdh dimers α4 EC1-4, α7 EC1-5, β6 EC1-4, and β8 EC1-4 (grey) were superimposed using the dimeric EC2-3 region onto γB3 EC1-4 (blue), illustrating variations in twist/corkscrew. (E) The EC4 domains of clustered Pcdh structures (colored as labeled) were superimposed, highlighting EC1 position differences that correlate with subfamily. Point of view (eye symbol) shown in (D). See Figure 1—figure supplements 1–4.
-
Figure 1—source data 1
Statistics for PcdhγB3 EC1-4 structure.
- https://doi.org/10.7554/eLife.18449.004
Figure 1—figure supplement 1

PcdhγB3 refolding yields two species, one of which corresponds to monodisperse dimeric protein.
(A) SEC profile of refolded PcdhγB3 run on a Superdex 200 16/60 column, with the two collected peak fractions indicated. (B) SEC-MALS profile of Peak 1 run on a Superdex S200 10/300 column was broad and polydisperse. (C) SEC-MALS profile of Peak 2 run on a Superdex S200 10/300 column was monodisperse at a molecular weight of ~80 kDa, consistent with a dimer (monomeric molecular weight 47 kDa).
Figure 1—figure supplement 2
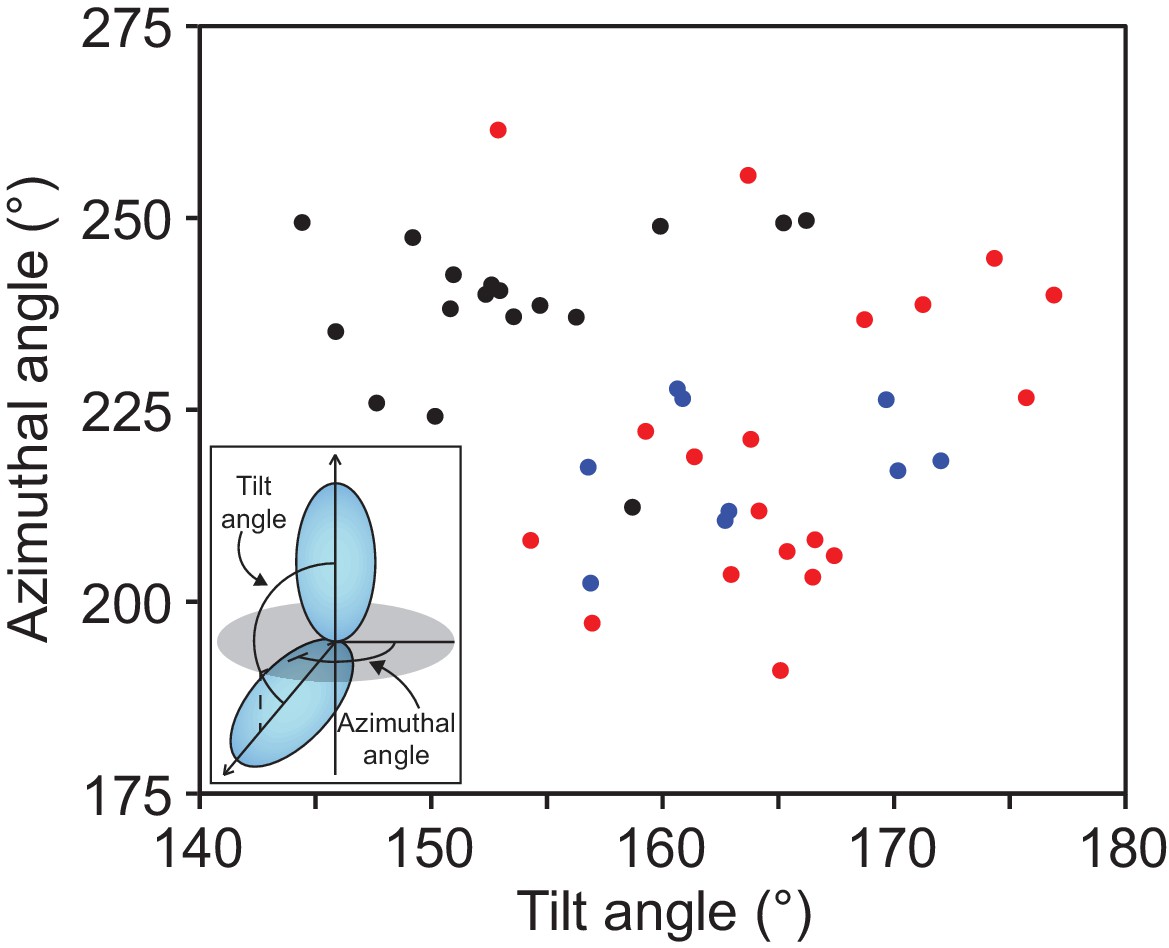
Protocadherins and non-classical cadherins have a distribution of orientation between repeat pairs that is distinct from classical cadherins.
Distribution of tilt and azimuthal angles from adjacent EC repeat pairs of classical (black), Pcdh15 and Cdh23 (blue) and clustered Pcdh (red). (Inset) The orientation of adjacent EC repeats was defined by the tilt and azimuthal rotation of the EC domain principal axes.
Figure 1—figure supplement 3
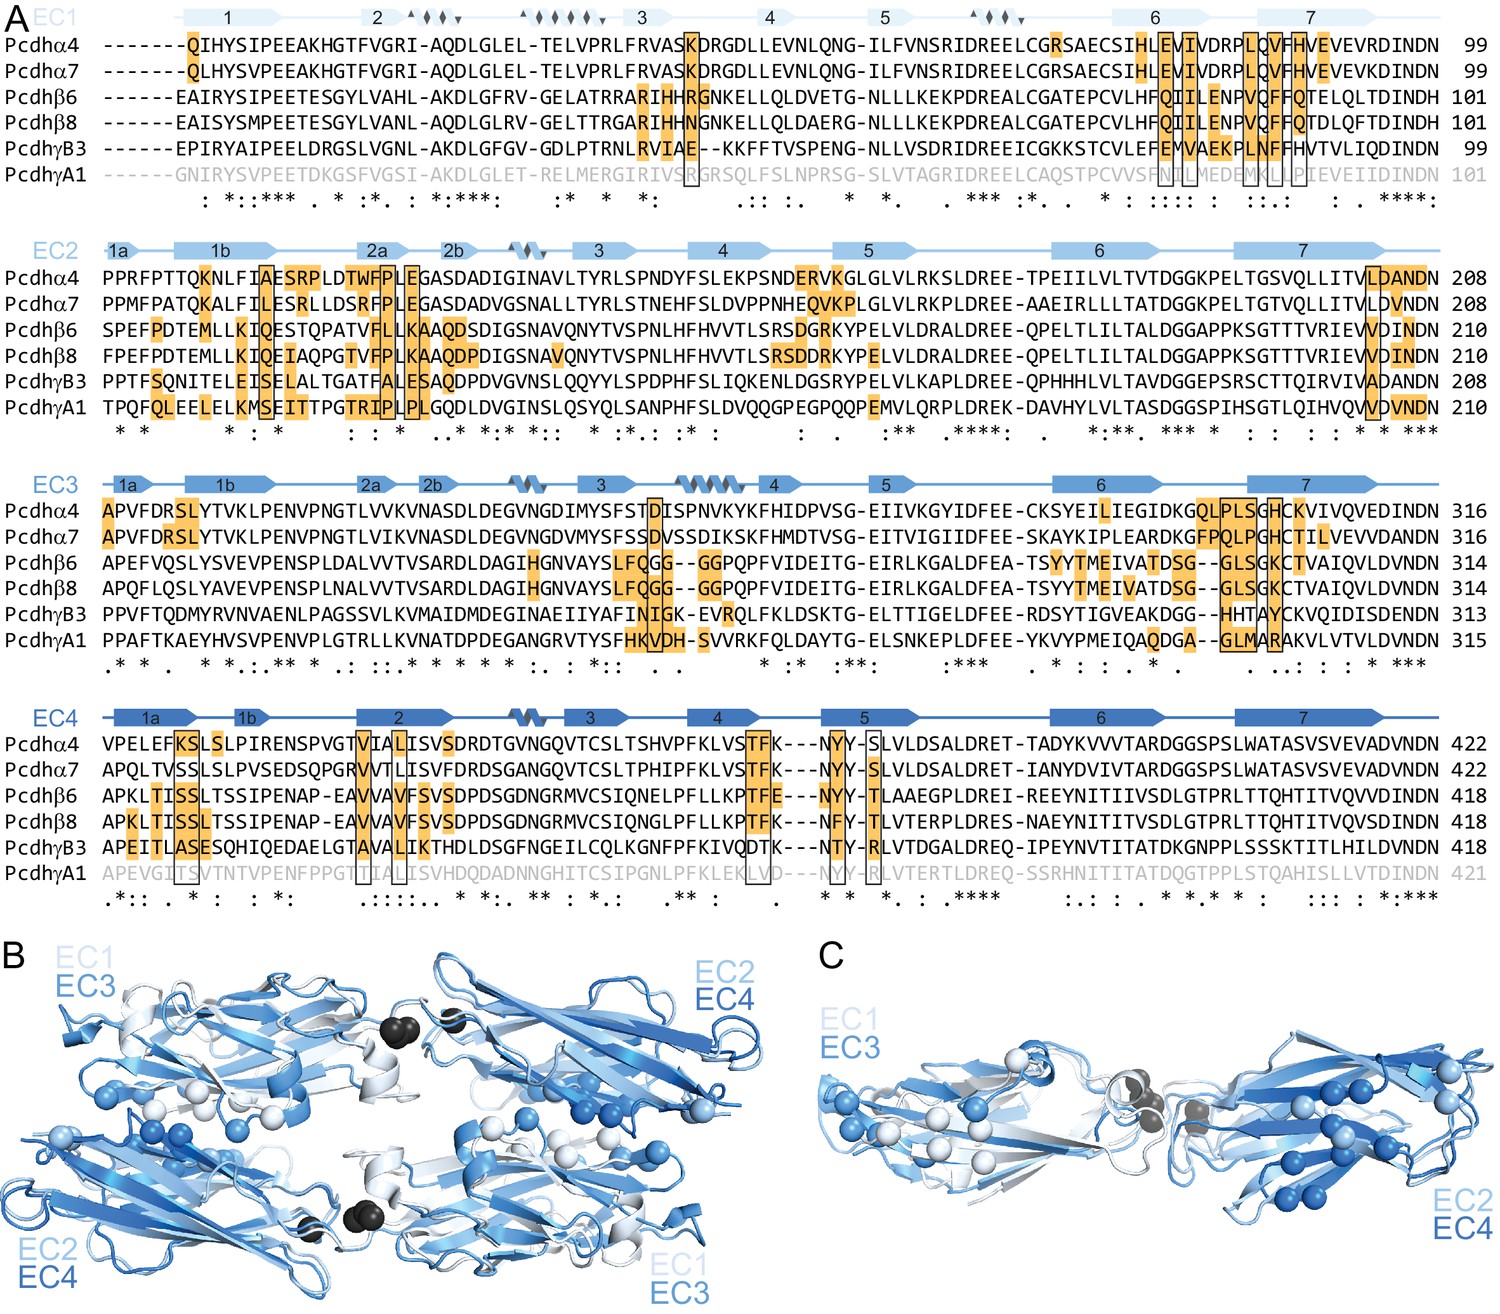
EC1 and EC3 use the same face for intersubunit contacts, as do EC2 and EC4.
(A) Sequence alignment of clustered Pcdhs for which dimer interface structures are available. EC1 and EC4 of PcdhγA1 are grey because their interaction interface is unknown. Residues highlighted orange have a BSA > 10 Å2 in those respective structures. We selected as conserved interface residues (boxed) those that have a BSA > 10 Å2 in 5 of 6 structures for EC2/EC3 or 4 of 5 structures for EC1/EC4. The interface regions are notably similar in EC1 and EC3, as well as in EC2 and EC4. (B) Superposition of the first half of PcdhγB3 EC1-4 with the second half yields an RMSD of 2.24 Å over 142 Cα atoms. (C) The two superimposed chains at the top (B) are rotated 90°, highlighting how similar surfaces of EC1 and EC3, and EC2 and EC4, form the extended antiparallel interface of clustered Pcdhs. In (B) and (C), the conserved interface positions identified in (A) are marked by Cα atom spheres.
Figure 1—figure supplement 4
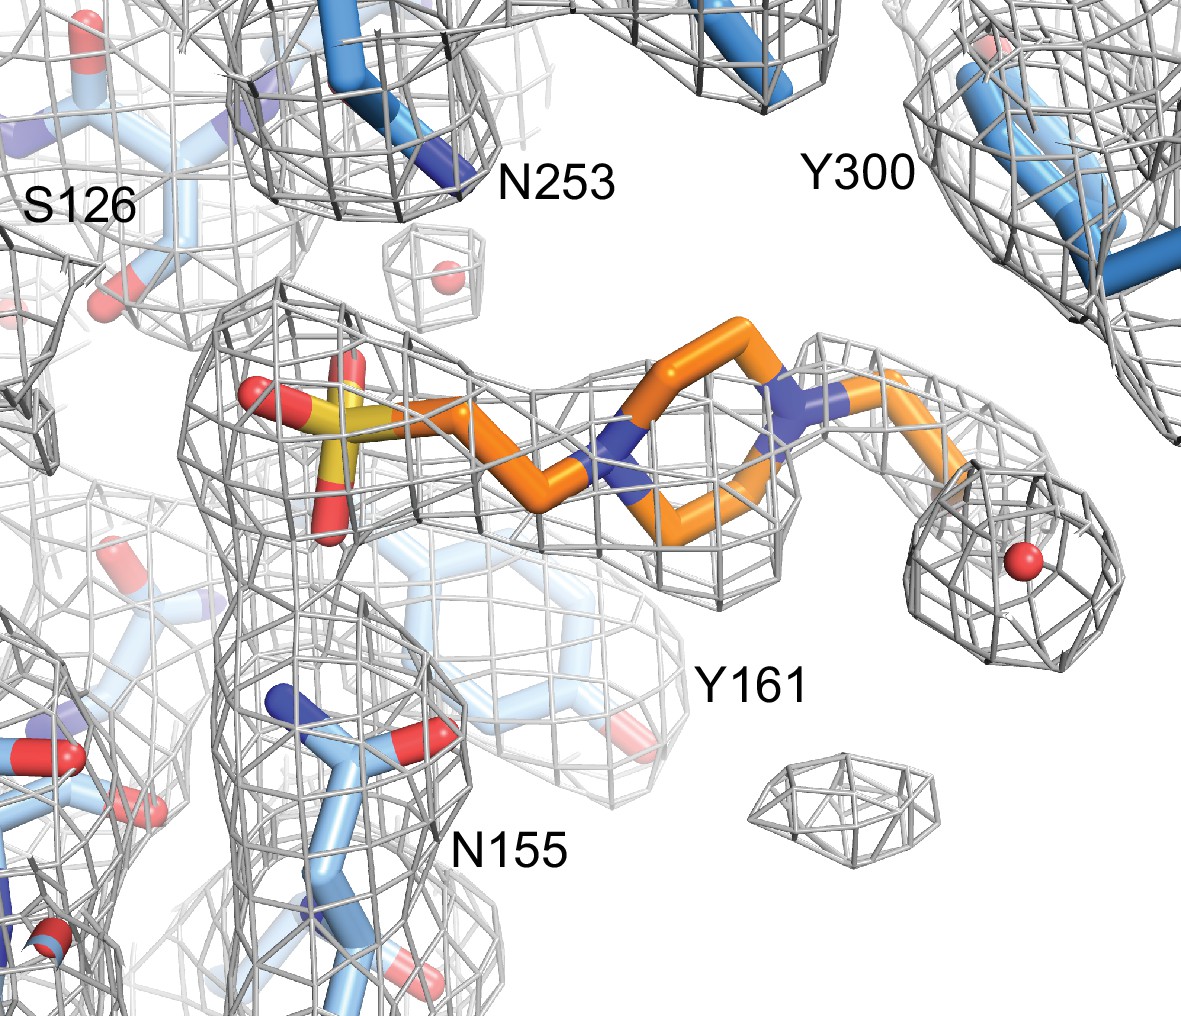
HEPES molecule near the EC2/EC3 interface.
Final 2Fo-Fc electron density contoured at 1σ, with the final structural model shown as sticks. Nearby side chains from EC2 (lighter blue) and EC3 (darker blue) are labeled.
Figure 2 with 1 supplement
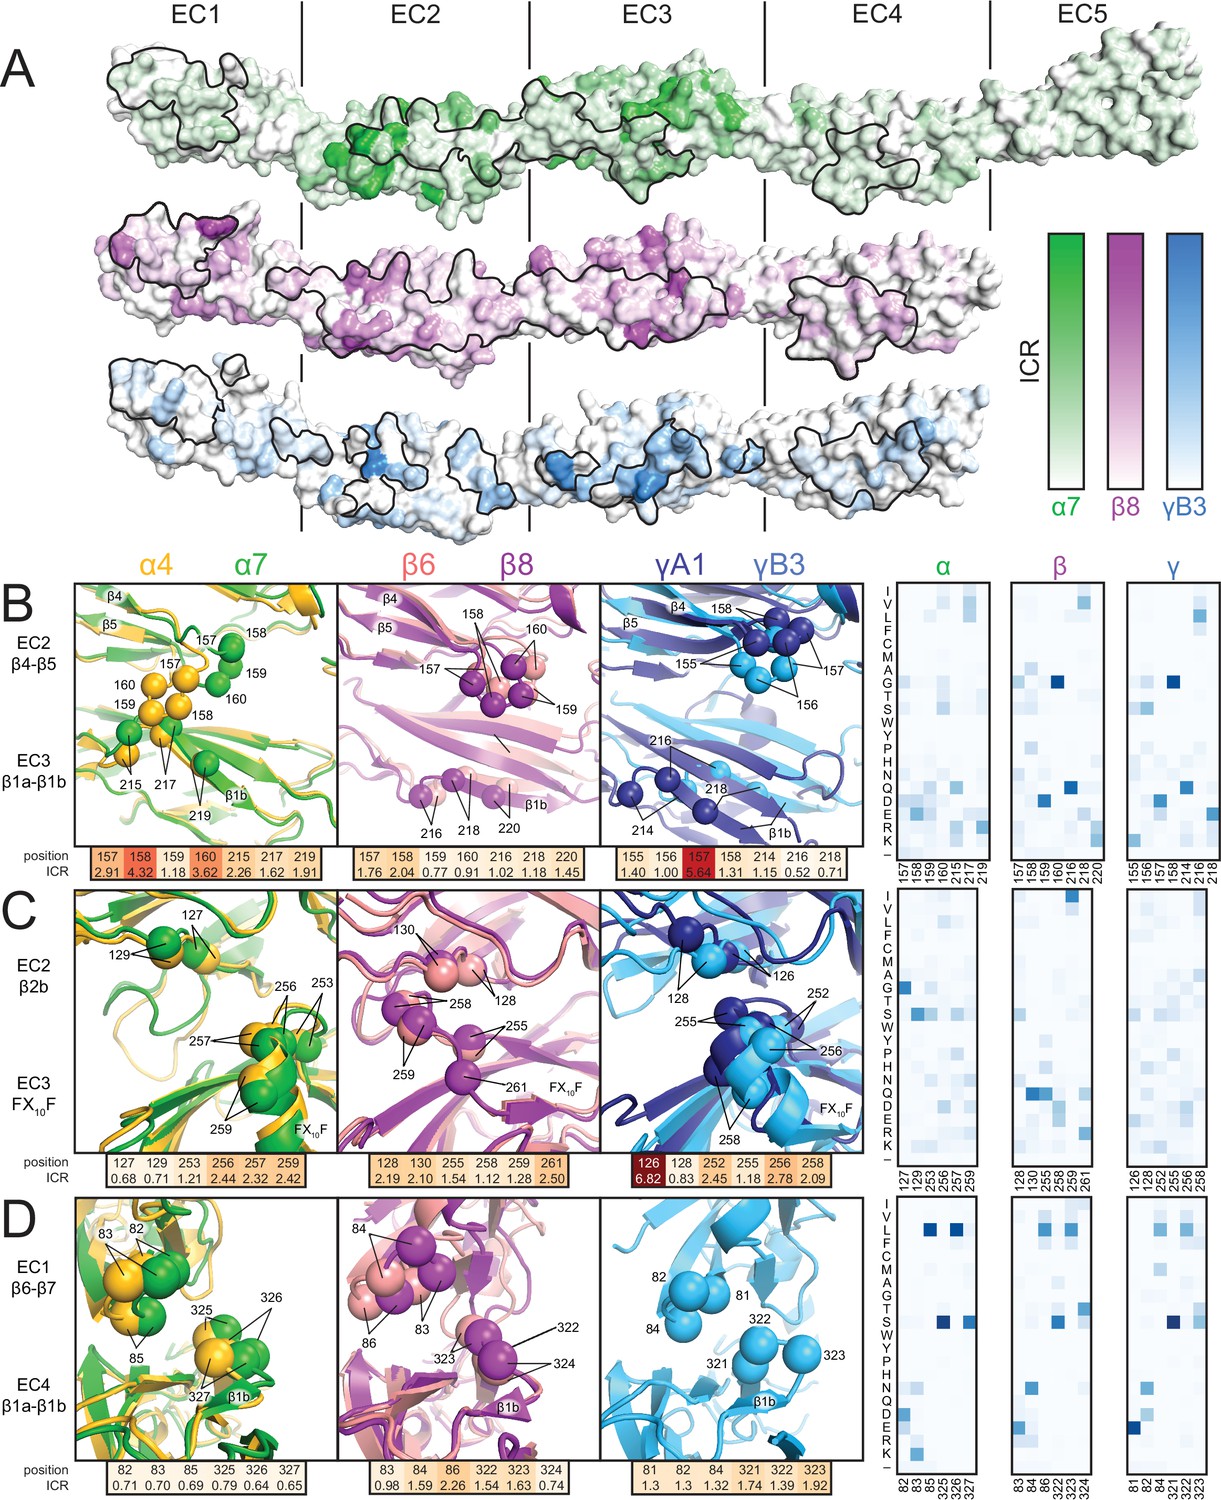
Isoform-specific conservation and structural differences reveal subfamily differences in diversity generation.
(A) Subfamily-specific ICR values mapped onto the surfaces of Pcdhα7 (top, green), Pcdhβ8 (middle, magenta) and PcdhγB3 (bottom, blue). The black outline marks the dimer interface footprint. (B, C, D) Unique structural features of the α (left), β (center), and γ (right) structures (colored according to Figure 1). ICR values for highlighted residues shown below and normalized amino acid frequencies for these positions shown on the right. See Figure 2—figure supplement 1.
Figure 2—figure supplement 1

Clustered Pcdh subfamilies have distinct patterns of isoform-specific conservation.
(A) Subfamily-specific normalized ICR values as a sliding average with a 5-residue window size (α = green, β = magenta, γ = cyan). Loop regions illustrated in Figure 2B–D are indicated at the bottom. (B) ICR values for interface residues (BSA > 10 Å2) for Pcdh α4 EC1-4 (yellow), α7 EC1-5 (green), β6 EC1-4 (salmon), β8 EC1-4 (magenta), γB3 EC1-4 (cyan), and γA1 EC1-3 (dark blue). In black are the average and standard error. Residues with high isoform-specific conservation localize to EC2 and EC3 surfaces.
Figure 3
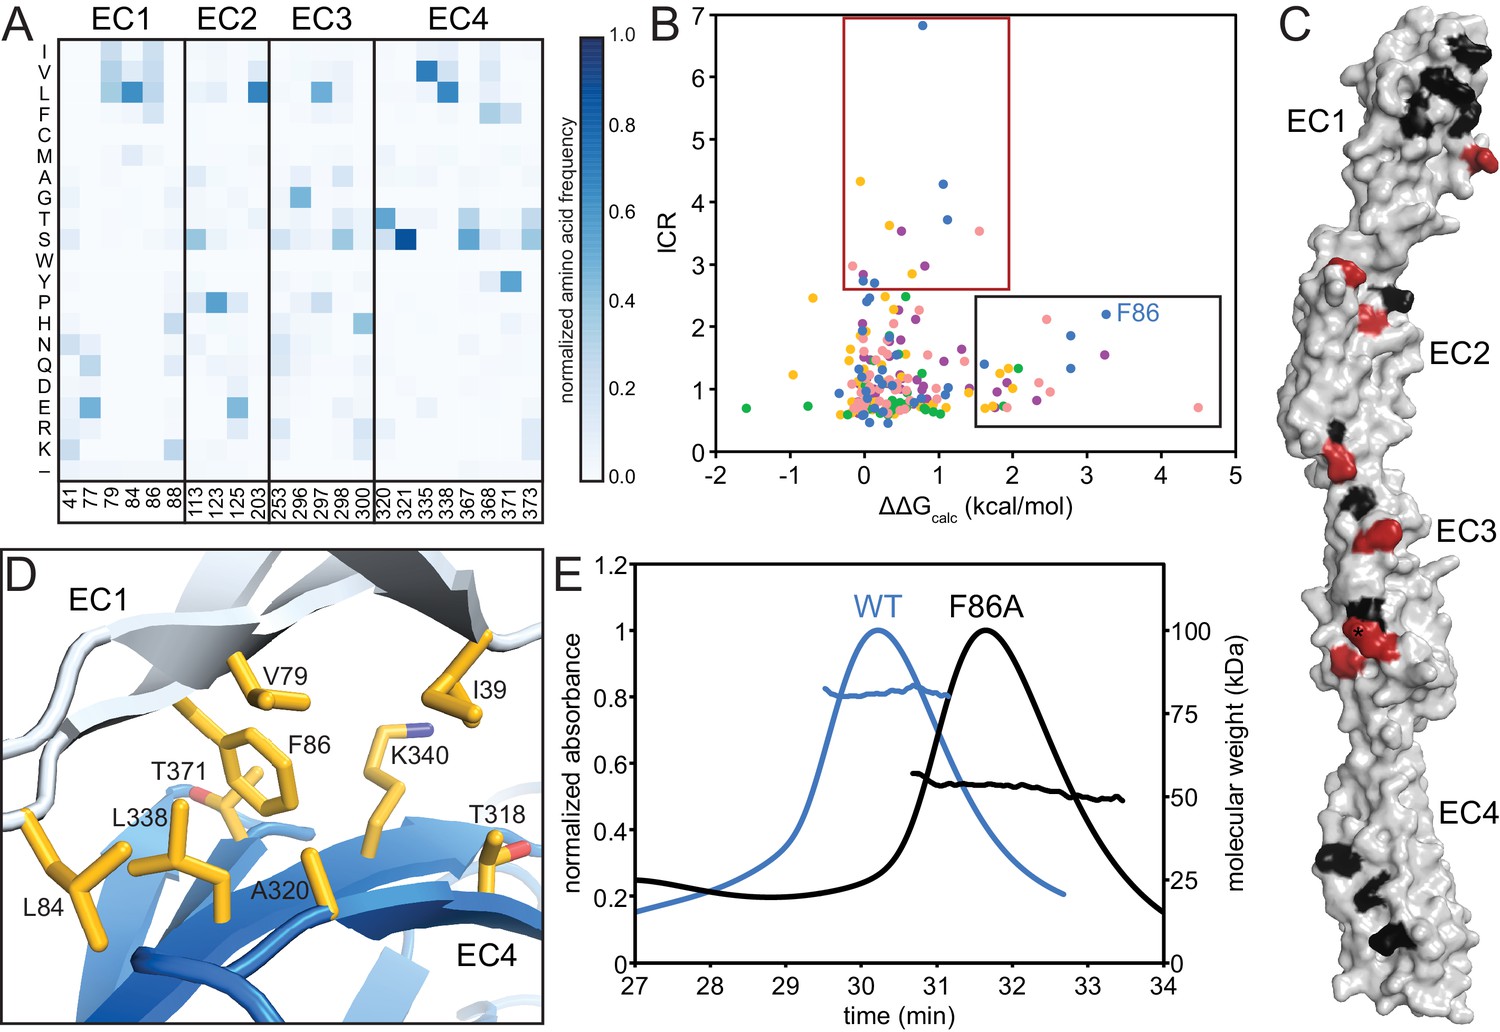
The EC1/EC4 interface is enriched in affinity-driving hydrophobic residues, while the EC2/EC3 interface contains high-ICR residues driving specificity.
(A) Amino acid frequencies in clustered Pcdhs of conserved interface residues (see Figure 1—figure supplement 2). (B) Plot of ICR value and ∆∆Gcalc of interface residues of Pcdh α4 EC1-4 (yellow), α7 EC1-5 (green), β6 EC1-4 (salmon), β8 EC1-4 (magenta), γB3 EC1-4 (blue). Two subsets of interface residues segregate from the main cluster: high-∆∆Gcalc and low-ICR residues (‘affinity’; black box) and low-∆∆Gcalc and high-ICR residues (‘specificity’; crimson box). Residue F86 from PcdhγB3 EC1-4 is labeled. (C) High-∆∆Gcalc and low-ICR residues (black) map primarily to EC1 and EC4, while low-∆∆Gcalc and high-ICR residues (crimson) primarily map to EC2 and EC3. N253 (*) is found in the ‘specificity’ region for γB3 and in the ‘affinity’ region for β6 and β8. (D) The EC1/EC4 interface features a hydrophobic cluster, with EC1 F86 near its center. (E) SEC-MALS profiles of WT PcdhγB3 EC1-4 (blue; molecular weight 82 kDa) and F86A (black; molecular weight 52 kDa) run on a Superdex S200 10/300 column, are consistent with dimeric and monomeric proteins, respectively.
Figure 4 with 2 supplements
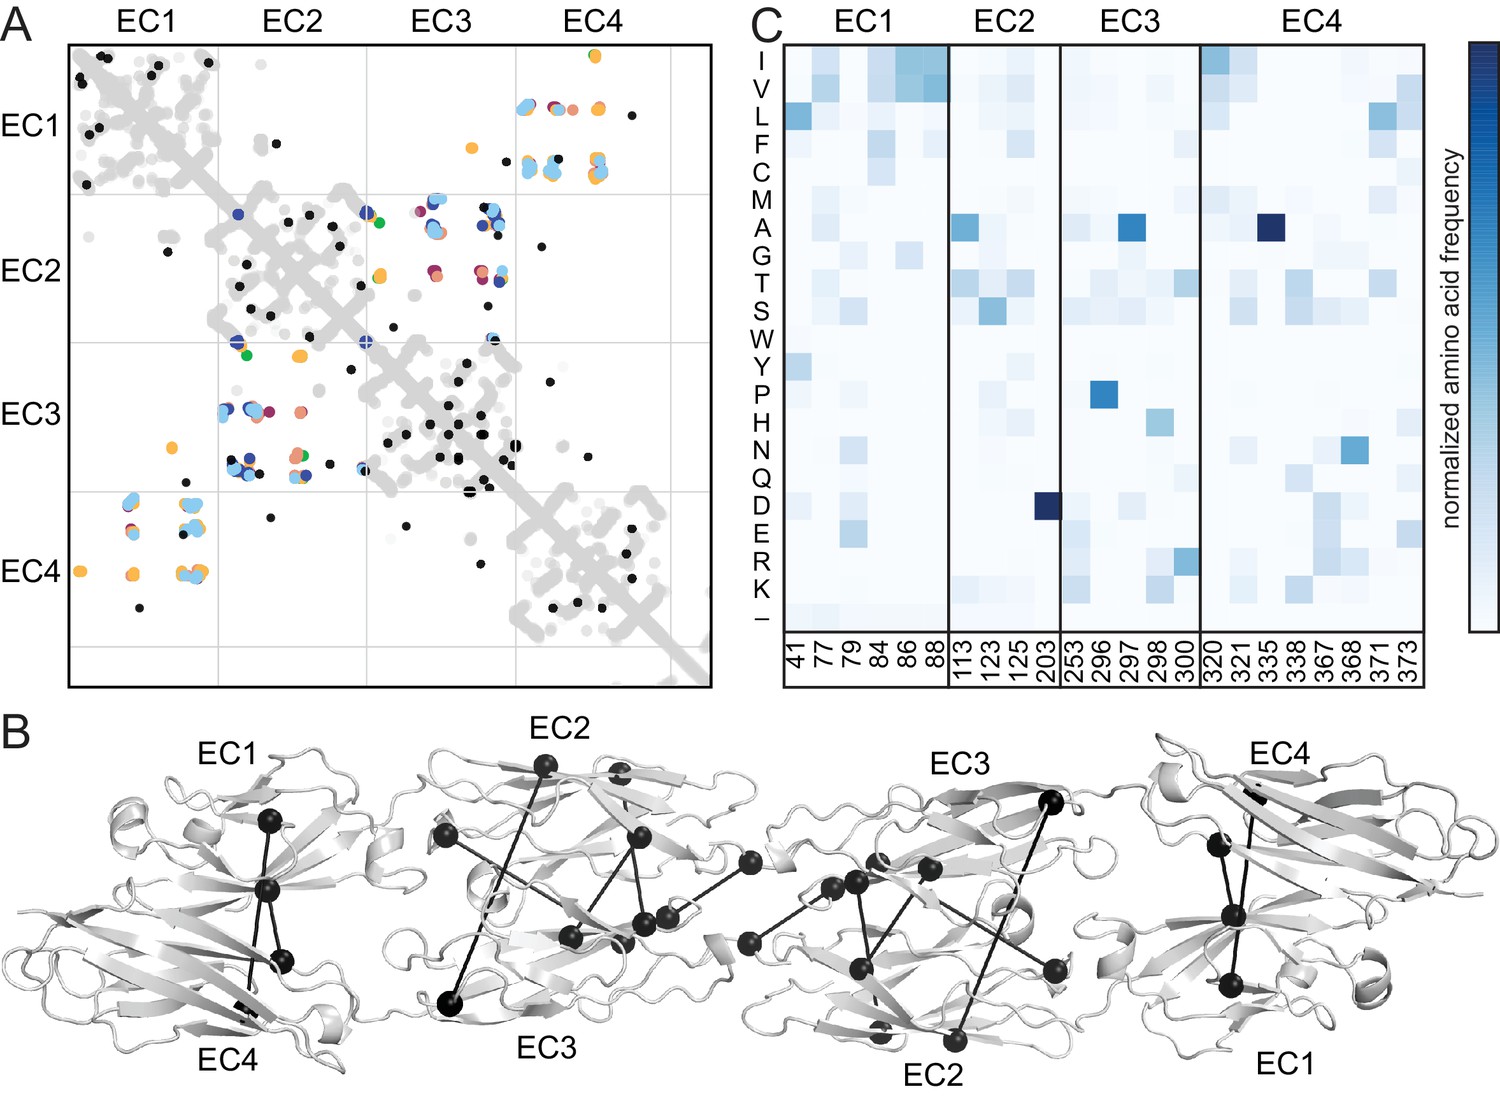
Evolutionary couplings in non-clustered Pcdhs predict an antiparallel interface engaging EC1-EC4.
(A) The top 38 covarying pairs are shown in black, and include a number of EC1-EC4 and EC2-EC3 covarying residue pairs. The intramolecular contact maps of PcdhγB3 EC1-4, Pcdhα4 EC1-4, Pcdhα7 EC1-4, Pcdhβ6 EC1-4, Pcdhβ8 EC1-4 and PcdhγA1 EC1-3 are in gray for reference. The observed interface contact residues are also mapped (α4, yellow; α7, green; β6, salmon; β8, magenta; γB3, blue; γA1, dark blue). (B) Covarying residue pairs across EC1-EC4 or EC2-EC3 are mapped onto the PcdhγB3 EC1-4 structure with a line between coupled residues. Alignments and evolutionary couplings in Figure 4—source data 1 and 2. (C) Amino acid frequencies at non-clustered Pcdh alignment positions corresponding to the conserved interface residue positions identified in clustered Pcdhs (Figure 1—figure supplement 2). See Figure 4—figure supplements 1 and 2.
-
Figure 4—source data 1
Alignment of non-clustered Pcdhs EC1-4.
- https://doi.org/10.7554/eLife.18449.013
-
Figure 4—source data 2
Evolutionary couplings from the non-clustered Pcdh alignment.
- https://doi.org/10.7554/eLife.18449.014
-
Figure 4—source data 3
Alignment of clustered Pcdhs EC1-4.
- https://doi.org/10.7554/eLife.18449.015
-
Figure 4—source data 4
Evolutionary couplings from the clustered Pcdh alignment.
- https://doi.org/10.7554/eLife.18449.016
Figure 4—figure supplement 1
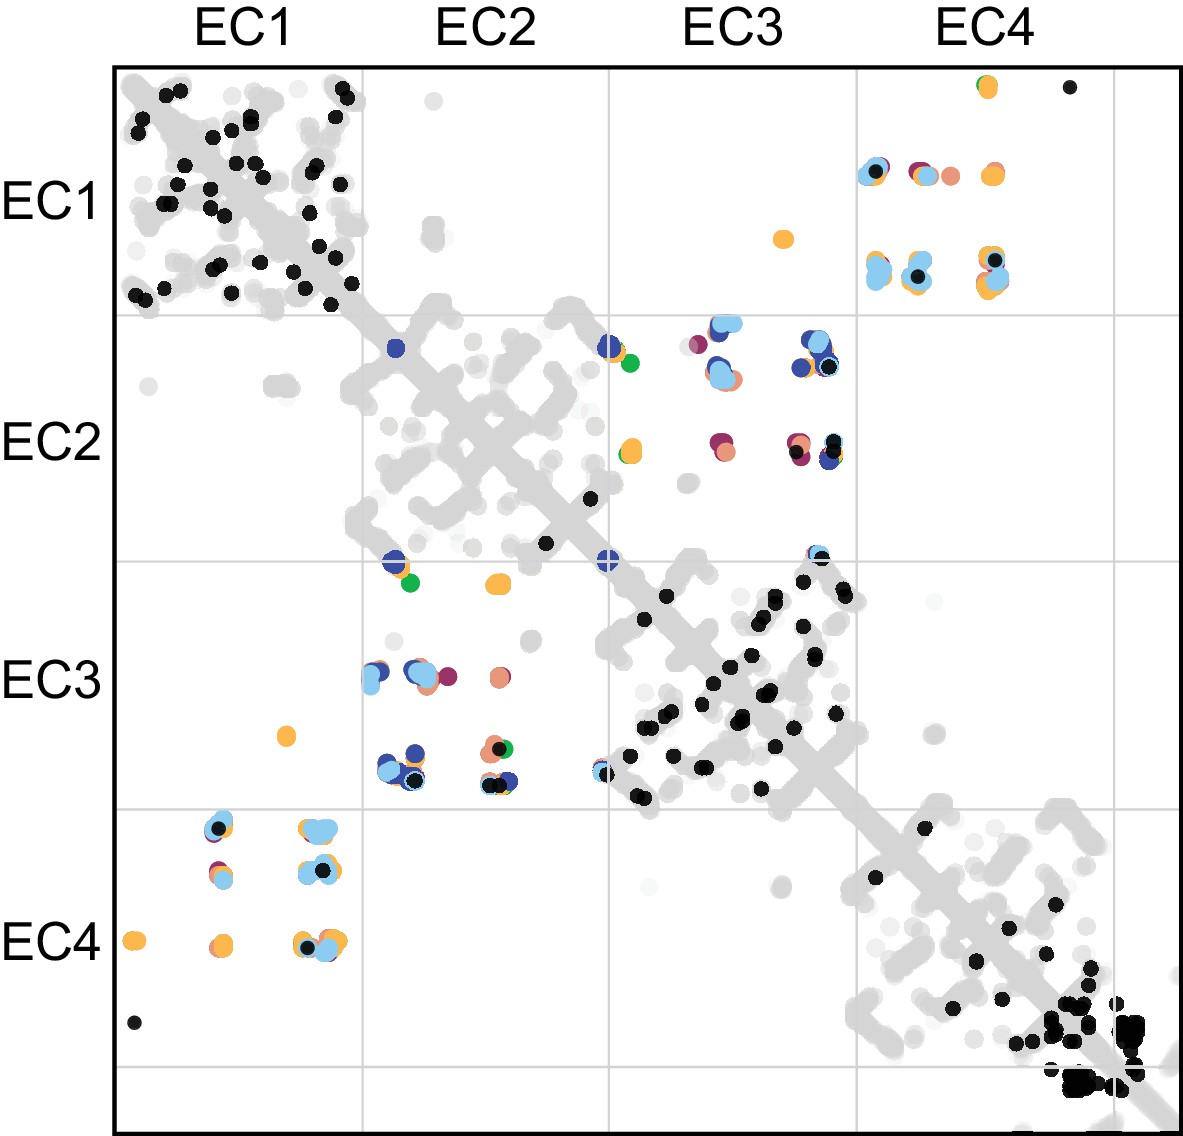
Evolutionary couplings in clustered Pcdhs are consistent with all available EC1-EC4 antiparallel homodimeric interfaces.
The top 83 covarying pairs are shown in black. The intramolecular contact maps of PcdhγB3 EC1-4, Pcdhα4 EC1-4, Pcdhα7 EC1-4, Pcdhβ6 EC1-4, Pcdhβ8 EC1-4 and PcdhγA1 EC1-3 are in gray for reference. The observed interface contact residues are also mapped (α4, yellow; α7, green; β6, salmon; β8, magenta; γB3, blue; γA1, dark blue). Alignments and evolutionary couplings in Figure 4—source data 3 and 4.
Figure 4—figure supplement 2
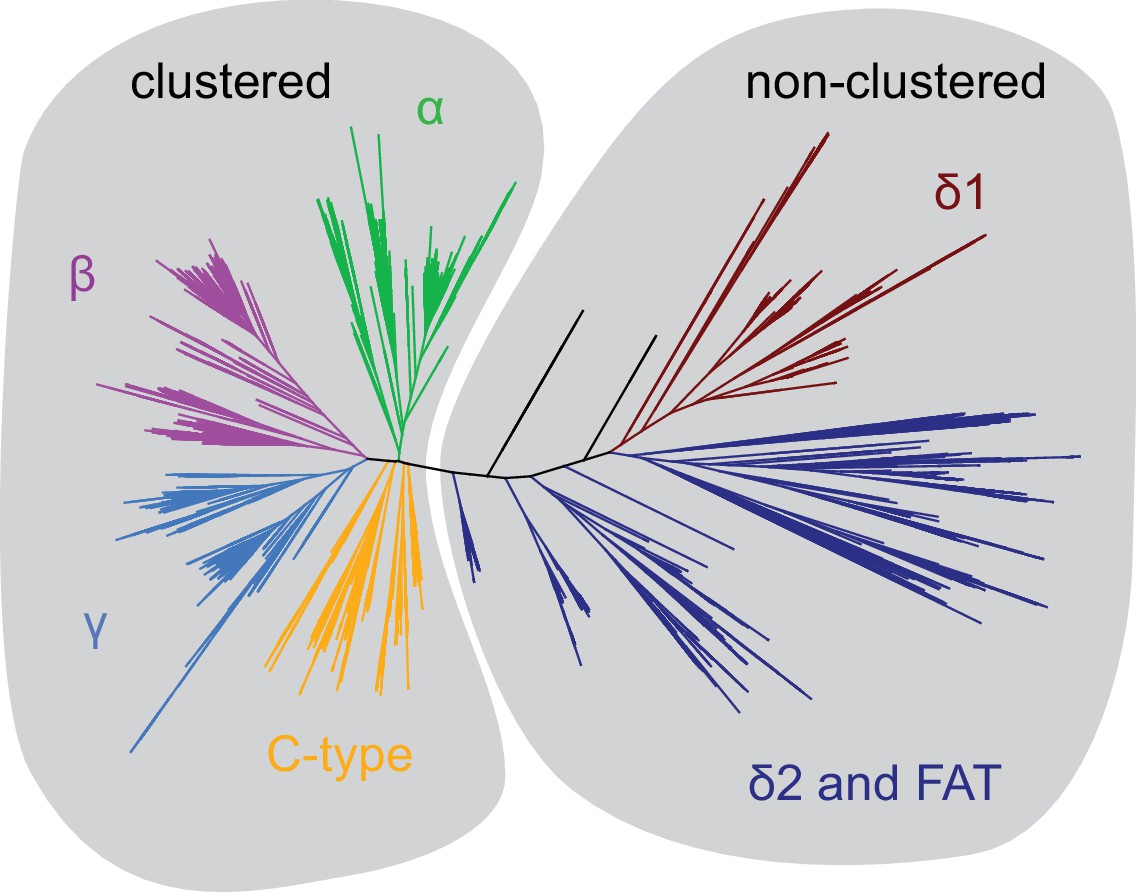
Phylogenetic tree distinguishes clustered from non-clustered Pcdhs.
Based on this phylogeny, evolutionary couplings were obtained for the two groups labeled. The clustered and non-clustered Pcdh alignments had effective sequences numbers of 2660 and 405.5, respectively.
Download links
A two-part list of links to download the article, or parts of the article, in various formats.
Downloads (link to download the article as PDF)
Open citations (links to open the citations from this article in various online reference manager services)
Cite this article (links to download the citations from this article in formats compatible with various reference manager tools)
Antiparallel protocadherin homodimers use distinct affinity- and specificity-mediating regions in cadherin repeats 1-4
eLife 5:e18449.
https://doi.org/10.7554/eLife.18449


